Embed Size (px)
Citation preview
ELIMINATION OF BACKING EFFECTS IN PRACTICAL ADHESION TESTING
David J. Yarusso, Corporate Scientist, 3M Company, St. Paul, MN Taylor Seabaugh, Student Intern, Cornell University, Ithaca, NY
1 Abstract
Two techniques have been suggested for eliminating or correcting for the effect of plastic energy dissipation in the tape backing in peel adhesion measurements. This allows for an estimate of the fracture energy associated with the adhesive/substrate interaction alone. One technique involves peeling around a cylindrical mandrel with a restraining load to ensure conformance of the tape to the mandrel. A second method uses a conventional peel test but corrects the data using properties of the backing obtained from tensile stress-strain testing, to subtract out the energy associated with plastic deformation in the backing. Using a set of test samples with the same adhesive laminated or coated on multiple backings, we evaluated the success of these two approaches as well as the practical aspects of their use. We found that the mandrel method is very effective for backings that are not too stretchy, but for some, the force necessary to ensure conformance to the mandrel causes the backing to stretch significantly so that the result is unattainable. Also, it requires multiple peel measurements for each sample at different levels of the restraining load. The correction method is easier to implement, because it requires just a conventional peel test. However, the results are rather sensitive to the values of the adhesive modulus, which must be entered into the correction algorithm. This value is not generally known for any tape one might be interested in. The equipment, analysis methods, and results will be reviewed.
2 Background
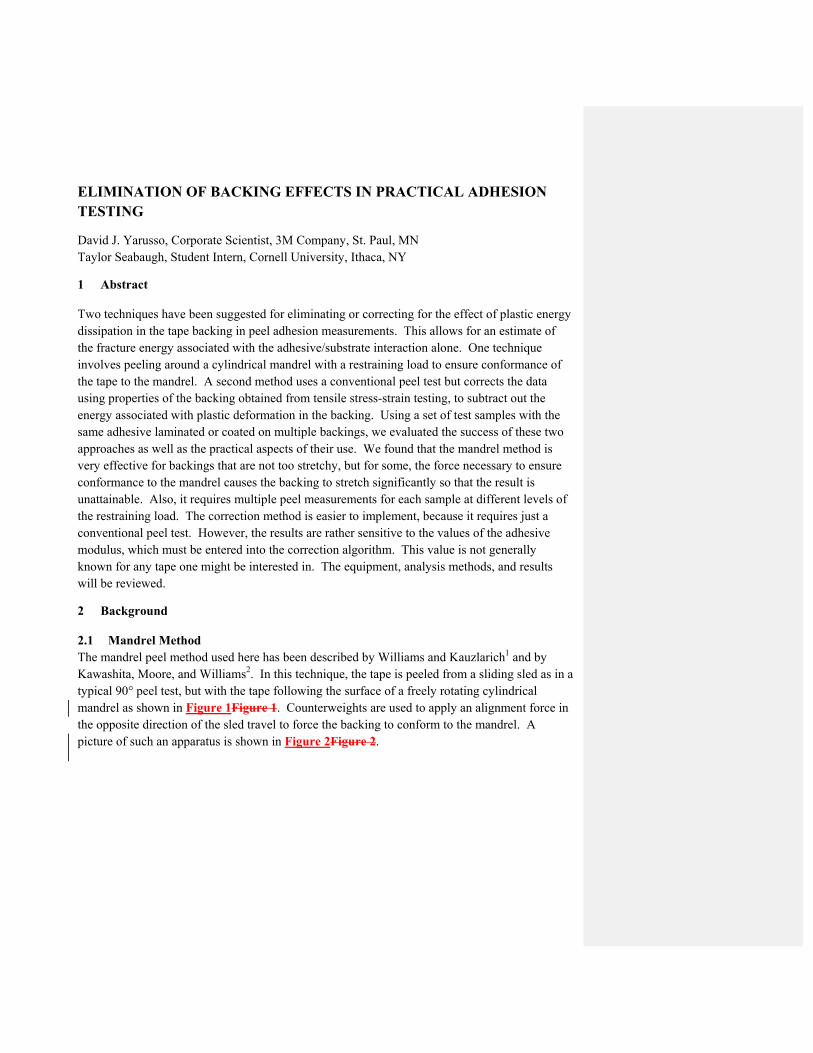
2.1 Mandrel Method The mandrel peel method used here has been described by Williams and Kauzlarich1 and by Kawashita, Moore, and Williams2. In this technique, the tape is peeled from a sliding sled as in a typical 90° peel test, but with the tape following the surface of a freely rotating cylindrical mandrel as shown in Figure 1Figure 1. Counterweights are used to apply an alignment force in the opposite direction of the sled travel to force the backing to conform to the mandrel. A picture of such an apparatus is shown in Figure 2Figure 2.
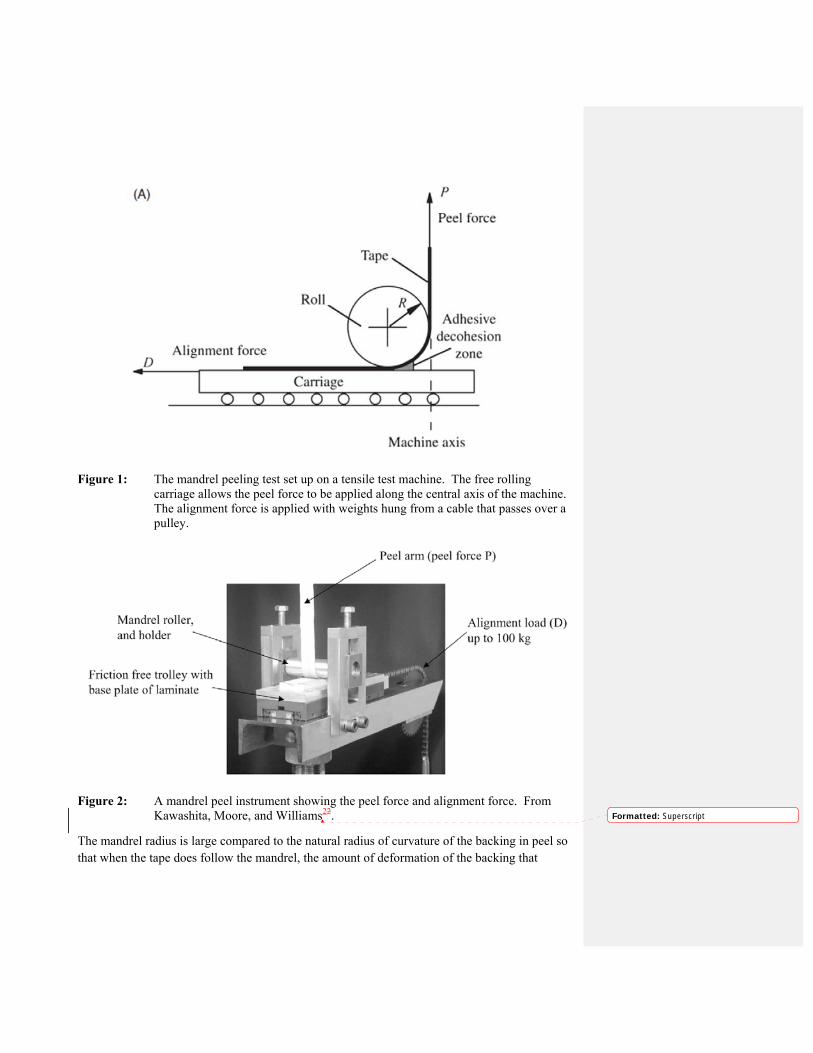
Figure 1: The mandrel peeling test set up on a tensile test machine. The free rolling carriage allows the peel force to be applied along the central axis of the machine. The alignment force is applied with weights hung from a cable that passes over a pulley.
Figure 2: A mandrel peel instrument showing the peel force and alignment force. From Kawashita, Moore, and Williams22.
The mandrel radius is large compared to the natural radius of curvature of the backing in peel so that when the tape does follow the mandrel, the amount of deformation of the backing that
Formatted: Superscript
exceeds the yield point is generally quite small. Whatever contribution there still is from the backing can be measured by running a set of control experiments with the backing but no adhesive.
Figure 3Figure 3 shows the way that mandrel peel results are presented and analyzed. A set of measurements is made for various levels of the alignment force. A control set is run with the backing but no adhesive (or at least, not bonded to the plate). If there is any contribution from plastic deformation of the backing as it bends around the mandrel, the unbonded specimen curve will be above and to the left of a reference curve drawn with the peel force equal to the alignment force multiplied by a correction factor dependent on the friction coefficient of the mandrel (µ). Actual data with adhesive bonding the backing to the plate generates the uppermost (leftmost) curve. At low levels of the alignment force, the backing does not follow the radius of curvature of the mandrel and instead follows its natural, smaller, radius of curvature dictated by the peel force and backing properties. Below that point, the data deviate from a linear relationship between peel force and alignment force and approach the normal 90° peel value at zero alignment force.
Figure 3: Presentation and analysis of results for mandrel peel
The contribution of the plastic energy dissipation in the backing, Gp, is represented by the shift from the reference curve to the unbonded specimen curve and the contribution from the adhesive fracture energy is the shift from the unbonded to the bonded specimen curves. One might think that the vertical shift in these curves would be used and that would be true if there were no friction in the roller. However, the reference curve has a slope slightly greater than unity
because the roller friction is proportional to the alignment force so the horizontal shifts between curves provide the correct value for the energy contributions.
2.2 Mechanics-Based Correction - IC Peel Method The theory behind this method was described by Kinloch, Lau, and Williams3 and by Georgiou, et al.4 The numerical method, called IC Peel by the authors, is available in an Excel™ spreadsheet containing macros to perform the necessary calculations, available at the web site of the Imperial College of London (along with detailed test protocols for both the mandrel method and the IC Peel correction method)5. The basic idea is to use the measured stress-strain properties of the backing to calculate how much energy is dissipated in plastic deformation during peel and subtract that contribution to determine the energy associated with the adhesive alone. There are several options provided in this approach. One is between two different mechanics approaches to the problem: the linear-elastic stiffness approach and the limiting maximum stress approach. We chose to focus on the more standard linear-elastic stiffness approach. One chooses between these approaches simply by entering or not entering a value into the limiting maximum stress parameter field in the worksheet. The second set of choices has to do with the model used to treat the stress-strain properties of the backing. Here there are three options:
1. A bi-linear fit of the data, i.e. fitting two linear regions, one before and one after the yield point. The fit of the post yield data follows
Equation 1: σ σ Eα ε ε
2. A power law fit (work hardening) of the post-yield data, i.e.
Equation 2:
3. A digitized treatment of the actual stress-strain curve. This approach requires estimates from one of the first two methods as a starting point for the analysis.
In all cases, the yield point itself is determined by the intersection of two linear fits, one of the initial slope and one in the initial phases of the plastic zone, i.e. from the yield strain to about 10 times the yield strain.
The first two approaches can be performed using the IC Peel (2006).xls workbook, depending on which fields are entered in the worksheet. The digitized treatment requires the use of a separate workbook, IC Peel (Digitised)07.xls. It still requires entry of the bilinear or power law parameters from the first approach as a starting point along with the digitized set of stress-strain data for the backing.
3 Test Samples
3.1 Standard Tapes The standard 3M tapes tested included Scotch® High Performance Masking Tape 232 with rubber/resin PSA, 3M 425 Aluminum Foil Tape with acrylic PSA, 3M Polyester Tape 8403 with silicone PSA, 3M Vinyl Tape 471 with rubber/resin PSA, Scotch® Shipping Packaging Tape with block polymer rubber/resin PSA, and Scotch® Filament Tape 893 with rubber/resin PSA.
3.2 Acrylic transfer tape constructions The 3M acrylic transfer tape 467MP (pressure sensitive adhesive delivered on release liner) was used to construct a set of test samples. This product is a nominal 2 mil thickness (measured at 56.5 μm). The adhesive was laminated to a set of four different backings:
Primed polyester (polyethylene terephthalate, PET) film from Mitsubishi, 43.9 microns average thickness – PET-1
Aluminum foil, untreated, 55.4 microns average thickness- AL-1
Biaxially oriented polypropylene (BOPP), flame treated, 30.0 microns average thickness – BOPP-1
Blown film multilayer polyolefin film, 108 microns average thickness
Plasticized polyvinyl chloride (PVC) film with primer (designed for graphic marking film), 46.2 microns average thickness
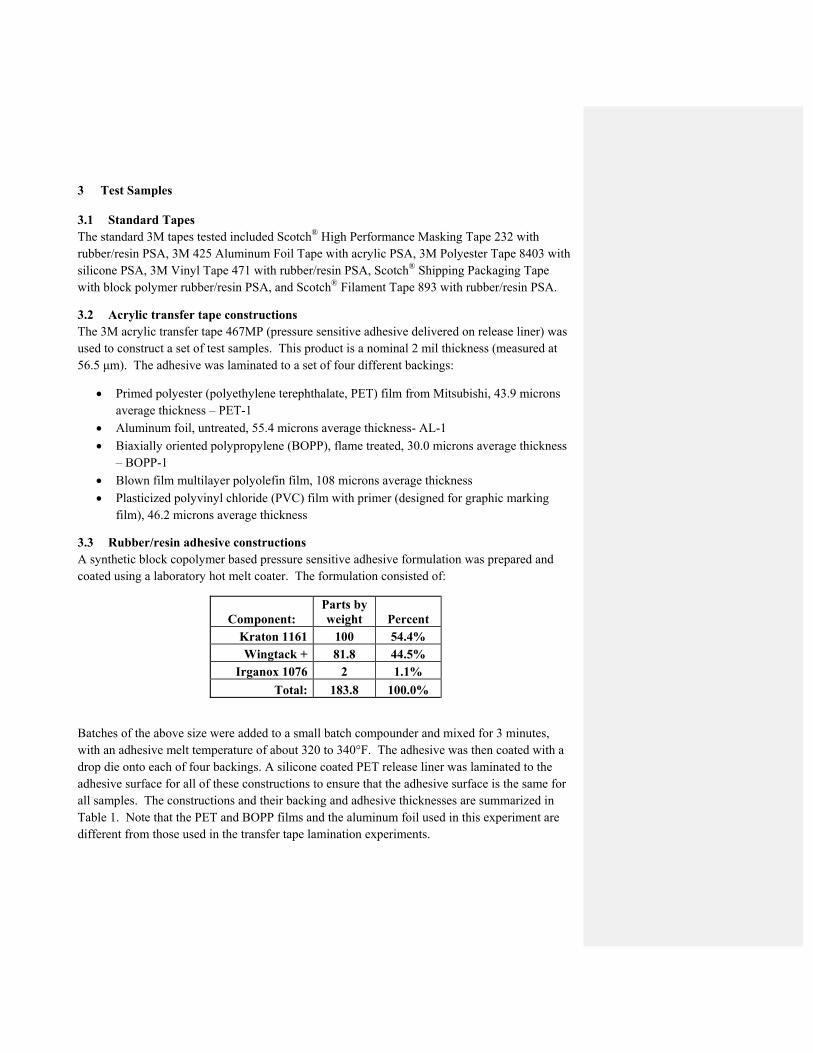
3.3 Rubber/resin adhesive constructions A synthetic block copolymer based pressure sensitive adhesive formulation was prepared and coated using a laboratory hot melt coater. The formulation consisted of:
Component: Parts by weight Percent
Kraton 1161 100 54.4% Wingtack + 81.8 44.5%
Irganox 1076 2 1.1%
Total: 183.8 100.0%
Batches of the above size were added to a small batch compounder and mixed for 3 minutes, with an adhesive melt temperature of about 320 to 340°F. The adhesive was then coated with a drop die onto each of four backings. A silicone coated PET release liner was laminated to the adhesive surface for all of these constructions to ensure that the adhesive surface is the same for all samples. The constructions and their backing and adhesive thicknesses are summarized in Table 1. Note that the PET and BOPP films and the aluminum foil used in this experiment are different from those used in the transfer tape lamination experiments.

Table 1: Construction layer thicknesses for rubber/resin adhesive hot melt coated on various backings
Backing Backing thickness (μm) Adhesive thickness (μm) BOPP-2 34.8 21.1 PET-2 27.9 19.5 Saturated paper masking tape backing 116 27.7 Aluminum foil, AL-2 50.3 22.9 4 Experimental Procedures and Data Analysis
4.1 Tensile stress-strain testing of backings Tensile properties of backings were determined using a 1 inch wide strip of material, about 8-10 inches long. The grip separation (gauge length) was 6 inches. The crosshead speed was 12 in/min.
When testing existing tapes, the backing thickness was determined by cleaning adhesive from several representative samples of tape using solvent and measuring the backing thickness. An average of these thickness measurements was used for all the tensile specimens of that tape. When testing backings that were not adhesive coated (i.e. the inputs to the transfer tape lamination and hot melt coating experiments), similar average backing thickness measurements were used as input for all the tensile specimens.
An Instron tensile testing machine using Bluehill™ software was used for these tests. The raw data files were exported to Excel to allow the necessary fitting of the parameters needed for input to the IC Peel software.
4.2 Fitting of parameters to tensile data An example of one of the tensile stress-strain curves is shown in Figure 4Figure 4.
The initial linear elastic region is fit with one straight line and the initial plastic region after the yield point is fit with another. The intersection of those two lines is used to determine the yield point, i.e. the yield stress and yield strain. Once this is done the post-yield data is fit according to Equation 1Equation 1 or Equation 2Equation 2 to determine the parameters for the bilinear model and the power law model, respectively.
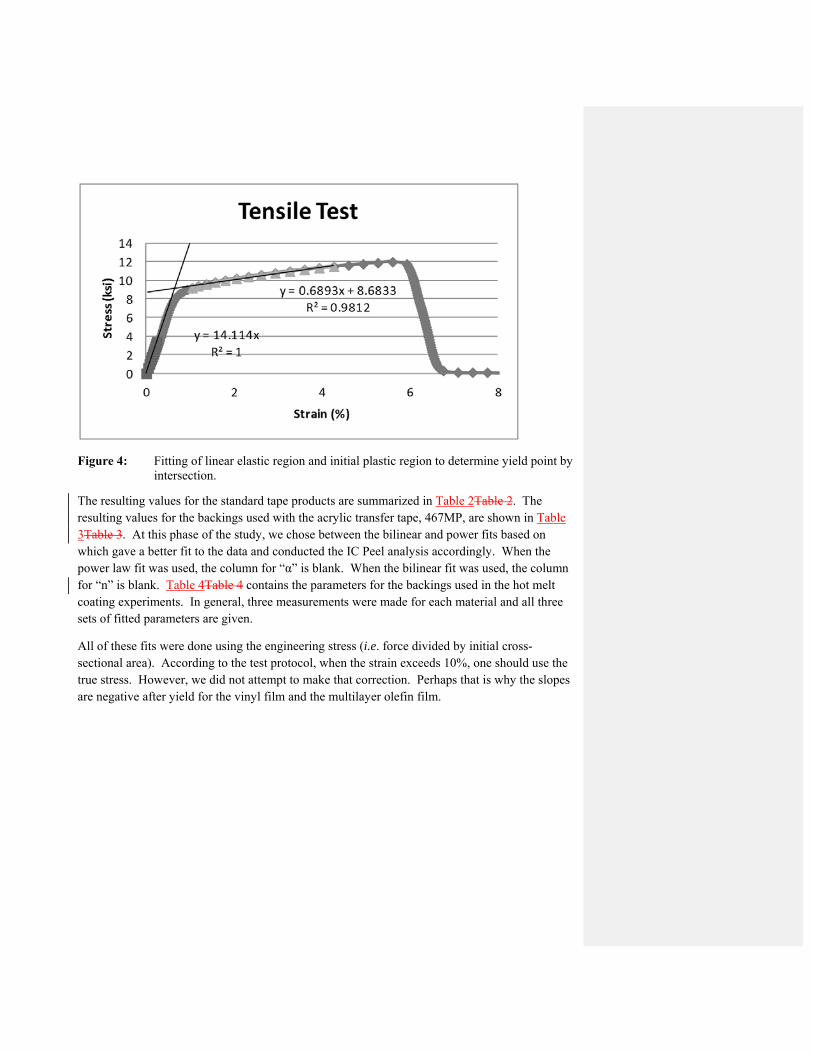
Figure 4: Fitting of linear elastic region and initial plastic region to determine yield point by intersection.
The resulting values for the standard tape products are summarized in Table 2Table 2. The resulting values for the backings used with the acrylic transfer tape, 467MP, are shown in Table 3Table 3. At this phase of the study, we chose between the bilinear and power fits based on which gave a better fit to the data and conducted the IC Peel analysis accordingly. When the power law fit was used, the column for “α” is blank. When the bilinear fit was used, the column for “n” is blank. Table 4Table 4 contains the parameters for the backings used in the hot melt coating experiments. In general, three measurements were made for each material and all three sets of fitted parameters are given.
All of these fits were done using the engineering stress (i.e. force divided by initial cross-sectional area). According to the test protocol, when the strain exceeds 10%, one should use the true stress. However, we did not attempt to make that correction. Perhaps that is why the slopes are negative after yield for the vinyl film and the multilayer olefin film.
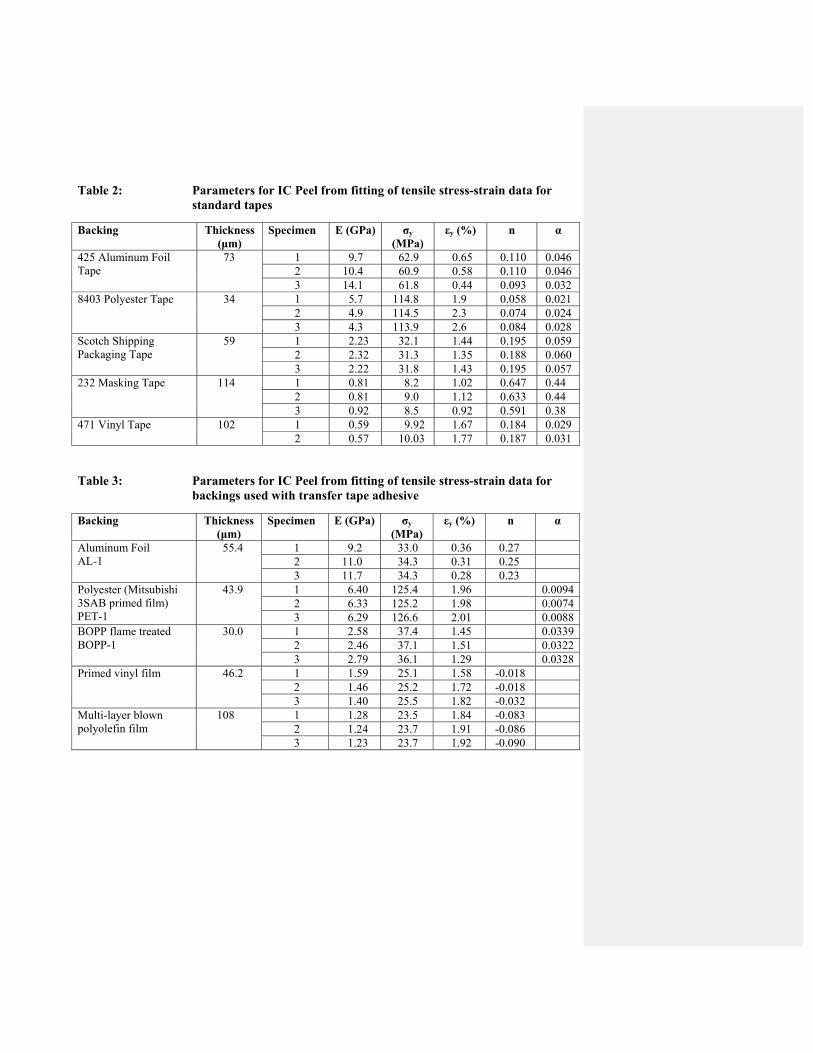
Table 2: Parameters for IC Peel from fitting of tensile stress-strain data for standard tapes
Backing Thickness (μm)
Specimen E (GPa) σy (MPa)
εy (%) n α
425 Aluminum Foil Tape
73 1 9.7 62.9 0.65 0.110 0.046 2 10.4 60.9 0.58 0.110 0.046 3 14.1 61.8 0.44 0.093 0.032
8403 Polyester Tape 34 1 5.7 114.8 1.9 0.058 0.021 2 4.9 114.5 2.3 0.074 0.024 3 4.3 113.9 2.6 0.084 0.028
Scotch Shipping Packaging Tape
59 1 2.23 32.1 1.44 0.195 0.059 2 2.32 31.3 1.35 0.188 0.060 3 2.22 31.8 1.43 0.195 0.057
232 Masking Tape 114 1 0.81 8.2 1.02 0.647 0.44 2 0.81 9.0 1.12 0.633 0.44 3 0.92 8.5 0.92 0.591 0.38
471 Vinyl Tape 102 1 0.59 9.92 1.67 0.184 0.029 2 0.57 10.03 1.77 0.187 0.031
Table 3: Parameters for IC Peel from fitting of tensile stress-strain data for backings used with transfer tape adhesive
Backing Thickness (μm)
Specimen E (GPa) σy (MPa)
εy (%) n α
Aluminum Foil AL-1
55.4 1 9.2 33.0 0.36 0.27 2 11.0 34.3 0.31 0.25 3 11.7 34.3 0.28 0.23
Polyester (Mitsubishi 3SAB primed film) PET-1
43.9 1 6.40 125.4 1.96 0.0094 2 6.33 125.2 1.98 0.0074 3 6.29 126.6 2.01 0.0088
BOPP flame treated BOPP-1
30.0 1 2.58 37.4 1.45 0.0339 2 2.46 37.1 1.51 0.0322 3 2.79 36.1 1.29 0.0328
Primed vinyl film 46.2 1 1.59 25.1 1.58 -0.018 2 1.46 25.2 1.72 -0.018 3 1.40 25.5 1.82 -0.032
Multi-layer blown polyolefin film
108 1 1.28 23.5 1.84 -0.083 2 1.24 23.7 1.91 -0.086 3 1.23 23.7 1.92 -0.090
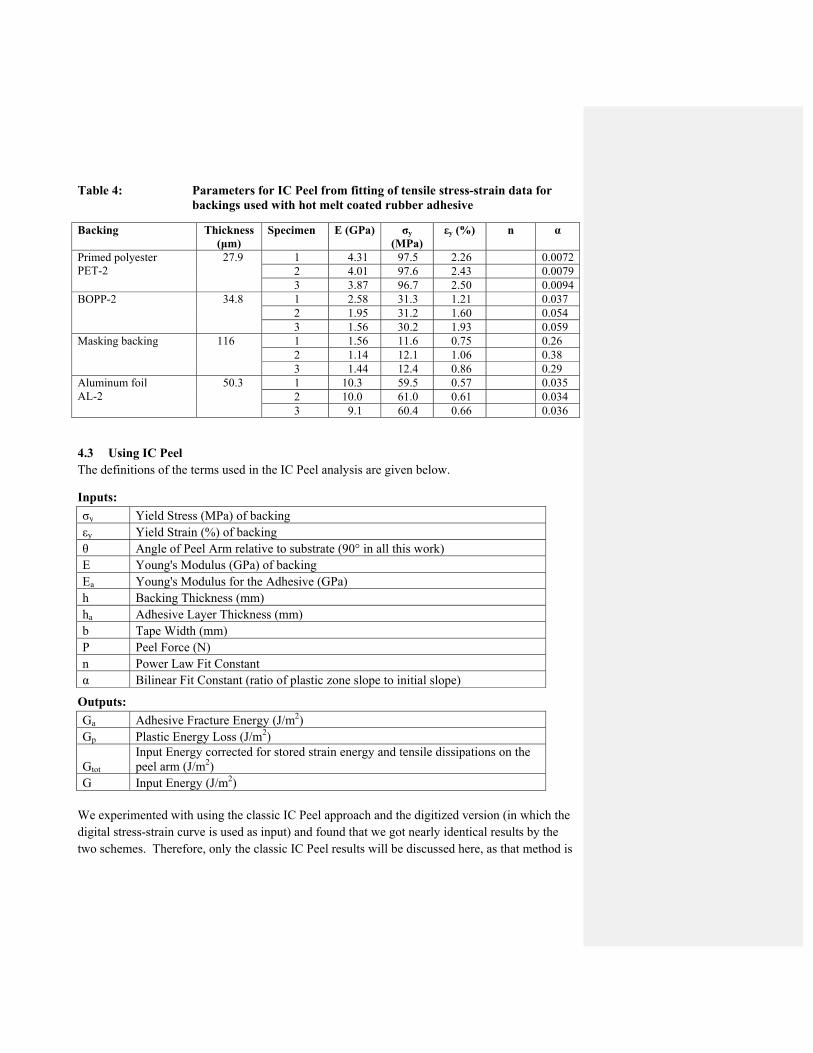
Table 4: Parameters for IC Peel from fitting of tensile stress-strain data for backings used with hot melt coated rubber adhesive
Backing Thickness (μm)
Specimen E (GPa) σy (MPa)
εy (%) n α
Primed polyester PET-2
27.9 1 4.31 97.5 2.26 0.0072 2 4.01 97.6 2.43 0.0079 3 3.87 96.7 2.50 0.0094
BOPP-2 34.8 1 2.58 31.3 1.21 0.037 2 1.95 31.2 1.60 0.054 3 1.56 30.2 1.93 0.059
Masking backing 116 1 1.56 11.6 0.75 0.26 2 1.14 12.1 1.06 0.38 3 1.44 12.4 0.86 0.29
Aluminum foil AL-2
50.3
1 10.3 59.5 0.57 0.035 2 10.0 61.0 0.61 0.034 3 9.1 60.4 0.66 0.036
4.3 Using IC Peel The definitions of the terms used in the IC Peel analysis are given below.
Inputs:
σy Yield Stress (MPa) of backing εy Yield Strain (%) of backing θ Angle of Peel Arm relative to substrate (90° in all this work) E Young's Modulus (GPa) of backing Ea Young's Modulus for the Adhesive (GPa) h Backing Thickness (mm) ha Adhesive Layer Thickness (mm) b Tape Width (mm) P Peel Force (N) n Power Law Fit Constant α Bilinear Fit Constant (ratio of plastic zone slope to initial slope)
Outputs:
Ga Adhesive Fracture Energy (J/m2) Gp Plastic Energy Loss (J/m2)
Gtot Input Energy corrected for stored strain energy and tensile dissipations on the peel arm (J/m2)
G Input Energy (J/m2) We experimented with using the classic IC Peel approach and the digitized version (in which the digital stress-strain curve is used as input) and found that we got nearly identical results by the two schemes. Therefore, only the classic IC Peel results will be discussed here, as that method is
simpler to implement and takes less time. We also found very little difference in the results from using either the bilinear fit or the power law fit to the stress-strain curve as input.
However, we found very different results depending on whether we used finite inputs for the adhesive thickness and modulus vs. leaving them blank. Not entering a value for these parameters is appropriate for analyzing the debonding of a system in which the film is directly bonded to the substrate (such as a heat seal film). Then the mechanics are dictated only by the thickness and mechanical properties of the film and the bond strength. When a separate adhesive layer is present, there is a finite distance near the debond line in which the adhesive is stretched until it actually detaches from the substrate, and that changes the shape of the backing deformation in the peel zone. Thus, to get an accurate measure of the fracture energy by this approach, one must know the adhesive thickness and its effective tensile modulus at the elongation rate that the adhesive experiences during peel. Not having specific modulus measurements of the adhesives on the various tapes tested, we tried three things:
Assume a tensile modulus of 20 MPa. This value was derived from information provided by Williams and Kauzlarich11 in which the same transfer tape as we used for the laminate experiments was tested in tension for its Young’s modulus value. The authors also suggest that the appropriate modulus to use is higher than the Young’s modulus because of the confinement effects of the thin layer of adhesive bounded by the substrate and backing. We used their formula for the Young’s modulus as a function of elongation rate and the suggested confinement enhancement factor (6) to come up with an effective modulus of 20 MPa for this adhesive at the peel rate we used.
Ignore the adhesive modulus effect and run the calculation without it.
Find by trial and error the Ea value necessary to produce a fracture energy equal to that obtained by the mandrel peel method.
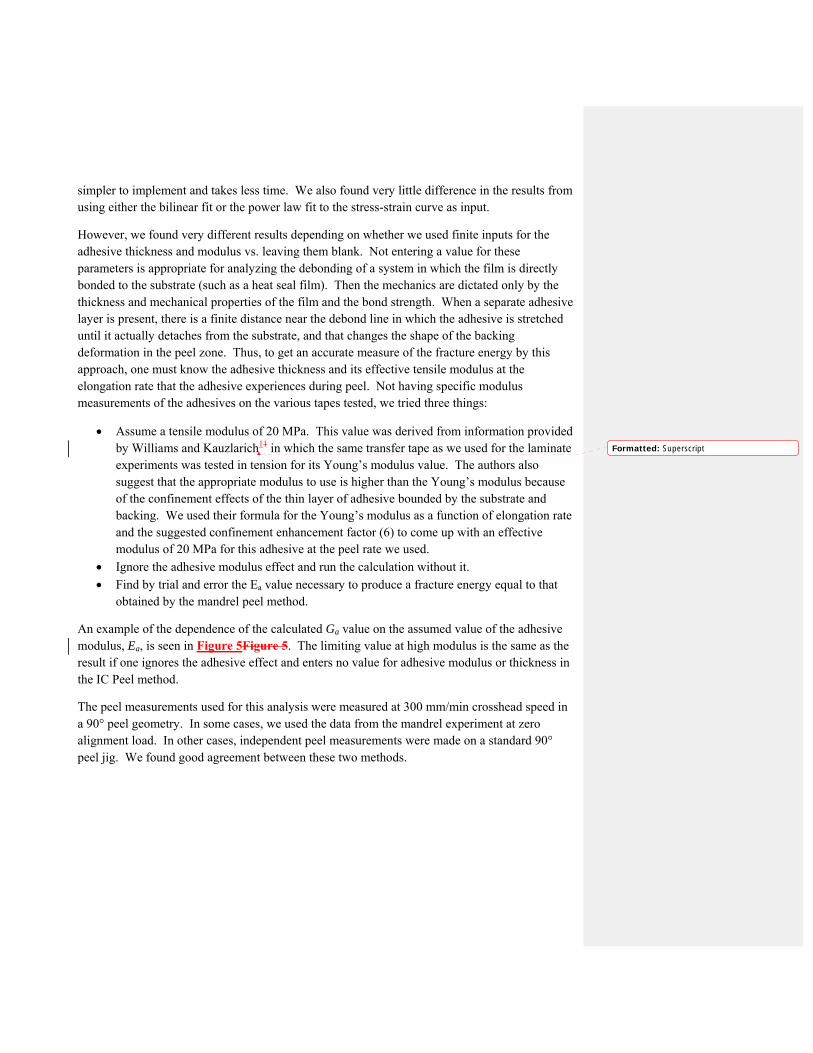
An example of the dependence of the calculated Ga value on the assumed value of the adhesive modulus, Ea, is seen in Figure 5Figure 5. The limiting value at high modulus is the same as the result if one ignores the adhesive effect and enters no value for adhesive modulus or thickness in the IC Peel method.
The peel measurements used for this analysis were measured at 300 mm/min crosshead speed in a 90° peel geometry. In some cases, we used the data from the mandrel experiment at zero alignment load. In other cases, independent peel measurements were made on a standard 90° peel jig. We found good agreement between these two methods.
Formatted: Superscript
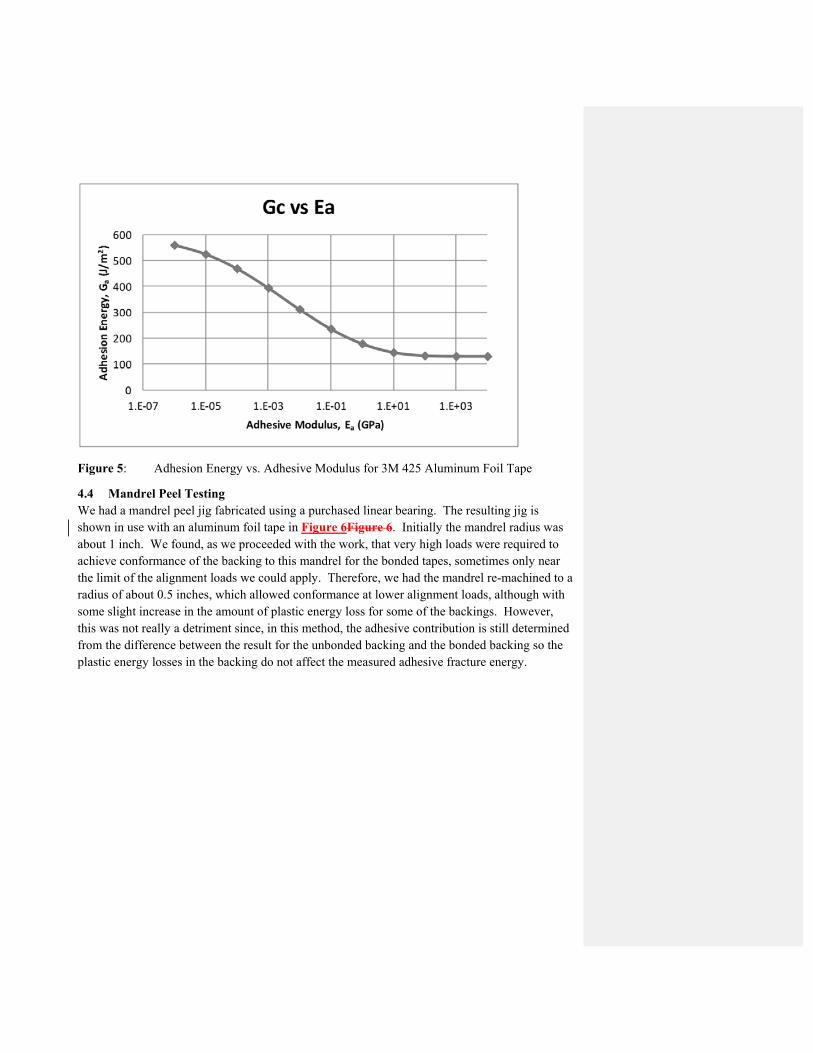
Figure 5: Adhesion Energy vs. Adhesive Modulus for 3M 425 Aluminum Foil Tape
4.4 Mandrel Peel Testing We had a mandrel peel jig fabricated using a purchased linear bearing. The resulting jig is shown in use with an aluminum foil tape in Figure 6Figure 6. Initially the mandrel radius was about 1 inch. We found, as we proceeded with the work, that very high loads were required to achieve conformance of the backing to this mandrel for the bonded tapes, sometimes only near the limit of the alignment loads we could apply. Therefore, we had the mandrel re-machined to a radius of about 0.5 inches, which allowed conformance at lower alignment loads, although with some slight increase in the amount of plastic energy loss for some of the backings. However, this was not really a detriment since, in this method, the adhesive contribution is still determined from the difference between the result for the unbonded backing and the bonded backing so the plastic energy losses in the backing do not affect the measured adhesive fracture energy.
Figure 6: Picture of mandrel peel jig in use with initial 1 inch mandrel radius. Notice the alignment weights hanging from pulley (not visible) at rear of jig.
We found that for the vinyl and multilayer blown polyolefin films, the backings tended to stretch dramatically at the higher alignment loads necessary to achieve conformance to the mandrel. Therefore, for these backings, there was not a suitable range of alignment load for which we could evaluate the Ga using the mandrel method.
4.5 Non-adhesive backing control The first step in this method is to test the backing in the absence of an adhesive bond to quantify the amount of plastic energy loss in the backing simply by bending it around the mandrel. To do this, the backing still needs to be adhered to the test panel at the trailing end to prevent it from slipping off the panel when the alignment load is applied. We accomplished this in the case of existing tapes by dusting the adhesive surface with baby powder (talc) to detackify it but leaving a small portion of functional adhesive at the trailing edge. The peel process never proceeded far enough to get to the bonded portion. For films that were not adhesive coated, we taped the trailing edge to the panel with a piece of masking tape.
The peel force vs. alignment force plots for these tests should be straight lines with a slope which is slightly greater than unity and depends on the friction coefficient of the mandrel bearing. If there is no significant plastic energy loss in the backing, this plot will go through the origin. If not, it will be offset above and to the left as in Figure 3Figure 3.
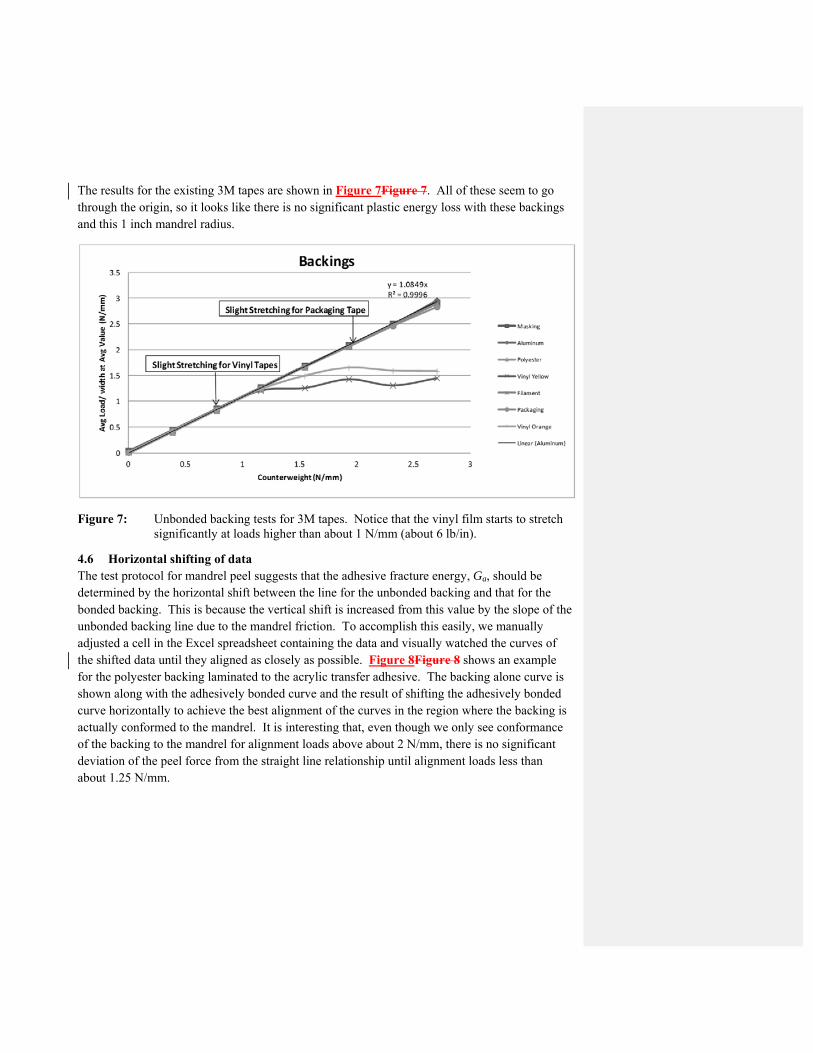
The results for the existing 3M tapes are shown in Figure 7Figure 7. All of these seem to go through the origin, so it looks like there is no significant plastic energy loss with these backings and this 1 inch mandrel radius.
Figure 7: Unbonded backing tests for 3M tapes. Notice that the vinyl film starts to stretch significantly at loads higher than about 1 N/mm (about 6 lb/in).
4.6 Horizontal shifting of data The test protocol for mandrel peel suggests that the adhesive fracture energy, Ga, should be determined by the horizontal shift between the line for the unbonded backing and that for the bonded backing. This is because the vertical shift is increased from this value by the slope of the unbonded backing line due to the mandrel friction. To accomplish this easily, we manually adjusted a cell in the Excel spreadsheet containing the data and visually watched the curves of the shifted data until they aligned as closely as possible. Figure 8Figure 8 shows an example for the polyester backing laminated to the acrylic transfer adhesive. The backing alone curve is shown along with the adhesively bonded curve and the result of shifting the adhesively bonded curve horizontally to achieve the best alignment of the curves in the region where the backing is actually conformed to the mandrel. It is interesting that, even though we only see conformance of the backing to the mandrel for alignment loads above about 2 N/mm, there is no significant deviation of the peel force from the straight line relationship until alignment loads less than about 1.25 N/mm.
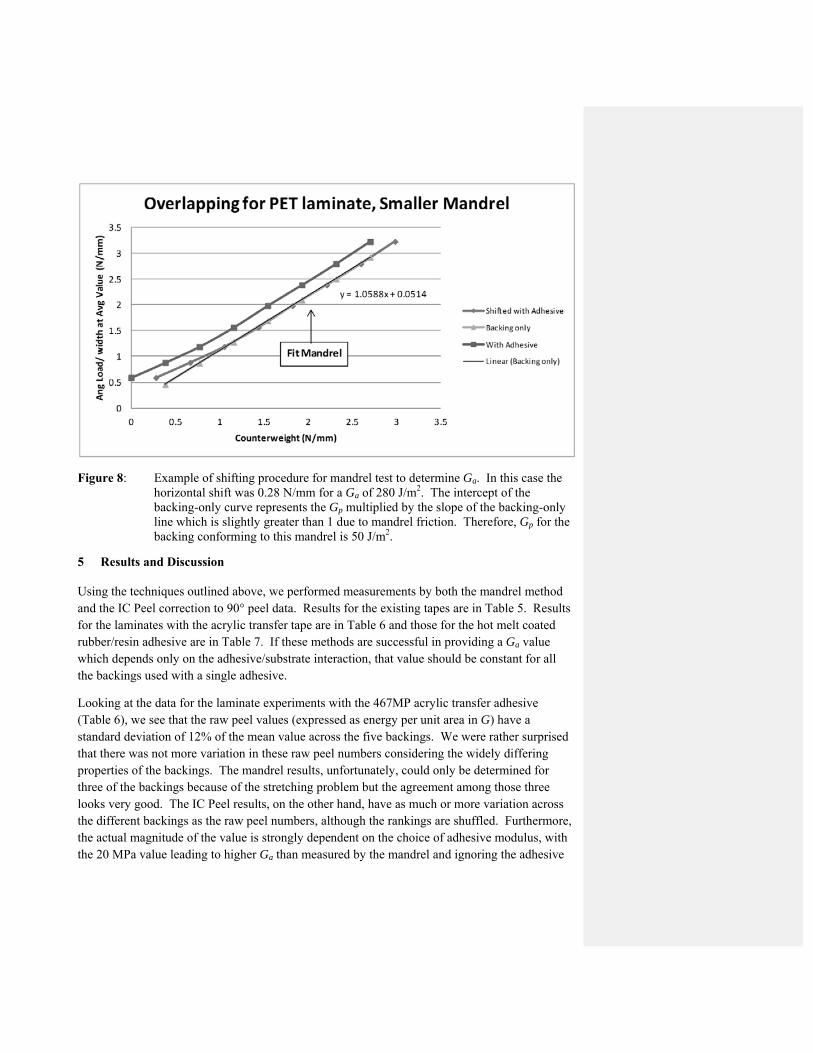
Figure 8: Example of shifting procedure for mandrel test to determine Ga. In this case the horizontal shift was 0.28 N/mm for a Ga of 280 J/m2. The intercept of the backing-only curve represents the Gp multiplied by the slope of the backing-only line which is slightly greater than 1 due to mandrel friction. Therefore, Gp for the backing conforming to this mandrel is 50 J/m2.
5 Results and Discussion
Using the techniques outlined above, we performed measurements by both the mandrel method and the IC Peel correction to 90° peel data. Results for the existing tapes are in Table 5. Results for the laminates with the acrylic transfer tape are in Table 6 and those for the hot melt coated rubber/resin adhesive are in Table 7. If these methods are successful in providing a Ga value which depends only on the adhesive/substrate interaction, that value should be constant for all the backings used with a single adhesive.
Looking at the data for the laminate experiments with the 467MP acrylic transfer adhesive (Table 6), we see that the raw peel values (expressed as energy per unit area in G) have a standard deviation of 12% of the mean value across the five backings. We were rather surprised that there was not more variation in these raw peel numbers considering the widely differing properties of the backings. The mandrel results, unfortunately, could only be determined for three of the backings because of the stretching problem but the agreement among those three looks very good. The IC Peel results, on the other hand, have as much or more variation across the different backings as the raw peel numbers, although the rankings are shuffled. Furthermore, the actual magnitude of the value is strongly dependent on the choice of adhesive modulus, with the 20 MPa value leading to higher Ga than measured by the mandrel and ignoring the adhesive
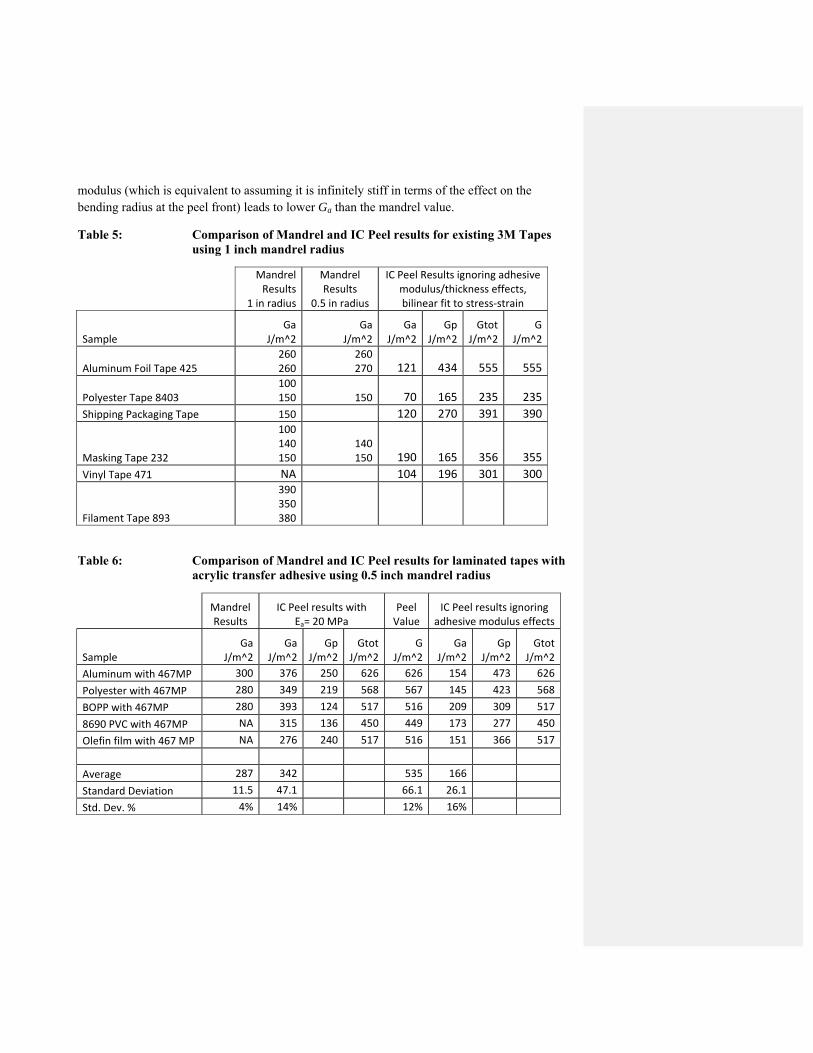
modulus (which is equivalent to assuming it is infinitely stiff in terms of the effect on the bending radius at the peel front) leads to lower Ga than the mandrel value.
Table 5: Comparison of Mandrel and IC Peel results for existing 3M Tapes using 1 inch mandrel radius
Mandrel Results
1 in radius
Mandrel Results
0.5 in radius
IC Peel Results ignoring adhesive modulus/thickness effects, bilinear fit to stress‐strain
Sample Ga
J/m^2 Ga
J/m^2Ga
J/m^2Gp
J/m^2Gtot
J/m^2G
J/m^2
Aluminum Foil Tape 425 260 260
260270 121 434 555 555
Polyester Tape 8403 100 150 150 70 165 235 235
Shipping Packaging Tape 150 120 270 391 390
Masking Tape 232
100 140 150
140150 190 165 356 355
Vinyl Tape 471 NA 104 196 301 300
Filament Tape 893
390 350 380
Table 6: Comparison of Mandrel and IC Peel results for laminated tapes with acrylic transfer adhesive using 0.5 inch mandrel radius
Mandrel Results
IC Peel results with Ea= 20 MPa
Peel Value
IC Peel results ignoring adhesive modulus effects
Sample Ga
J/m^2 Ga
J/m^2 Gp
J/m^2Gtot
J/m^2G
J/m^2Ga
J/m^2Gp
J/m^2Gtot
J/m^2
Aluminum with 467MP 300 376 250 626 626 154 473 626
Polyester with 467MP 280 349 219 568 567 145 423 568
BOPP with 467MP 280 393 124 517 516 209 309 517
8690 PVC with 467MP NA 315 136 450 449 173 277 450
Olefin film with 467 MP NA 276 240 517 516 151 366 517
Average 287 342 535 166
Standard Deviation 11.5 47.1 66.1 26.1
Std. Dev. % 4% 14% 12% 16%
Table 7: Comparison of Mandrel and IC Peel results for tapes made by coating hot melt rubber/resin adhesive using 0.5 inch mandrel radius
Mandrel Results
IC Peel results with Ea= 20 MPa
Peel Value
IC Peel results ignoring adhesive modulus effects
Sample Mandrel Ga J/m^2
Ga J/m^2
GpJ/m^2
GtotJ/m^2
GJ/m^2
GaJ/m^2
GpJ/m^2
GtotJ/m^2
Aluminum with RR adh 180 248 234 482 482 114 368 482
PET with RR adh 180 241 152 393 393 114 280 393
SBOPP with RR adh 190 298 148 446 445 174 272 446
Masking bkg w/ RR adh 150 165 145 310 310 133 177 310
Average 175 238 407.3 134
Standard Deviation 17.3 54.9 74.59 28.4
Std. Dev. % 10% 23% 18% 21%
Examining the data for the hot melt coated rubber-resin adhesive (Table 7), we come to similar conclusions. The raw peel values have a standard deviation of 18% of the mean value across the four backings evaluated. The mandrel results are much closer to providing a single value, having a standard deviation of only 10% of the mean value. The IC Peel corrected results actually show more variation, not less, with standard deviations of 21% of the mean for the case in which the adhesive is disregarded. It should be noted that we have no basis for the adhesive modulus value of 20 MPa used in this case since it is not the same adhesive as the 467 MP but is expected to be of the right order of magnitude.
Clearly, the IC Peel results are very different, depending on whether we use the estimated value of the adhesive modulus, Ea, or ignore its effect on the peel zone geometry. We decided to find what value of Ea would provide a calculated value of Ga that agreed with the mandrel value for each of the tapes in the laminate and coater experiments for which we have usable mandrel results. Those values are shown in Table 8. The values necessary to get agreement are considerably higher than the estimated value taken from Williams and Kauzlarich and no single value provides agreement for all the tapes using the same adhesive.
Given the promising results of the mandrel method, we wanted to find a way around the problem for the stretchy backings. We tried laminating filament tape onto the back side of these tapes and then testing them with the mandrel method, thinking that the filament tape would prevent the backing stretch. This was true, but we also saw some separation of the filament tape from the test tape near the peel front ,and the resultant fracture energy values were considerably higher than those for the other backings. We suspect the deformation and/or debonding of the filament tape adhesive is contributing significantly to the overall energy consumption in the system.
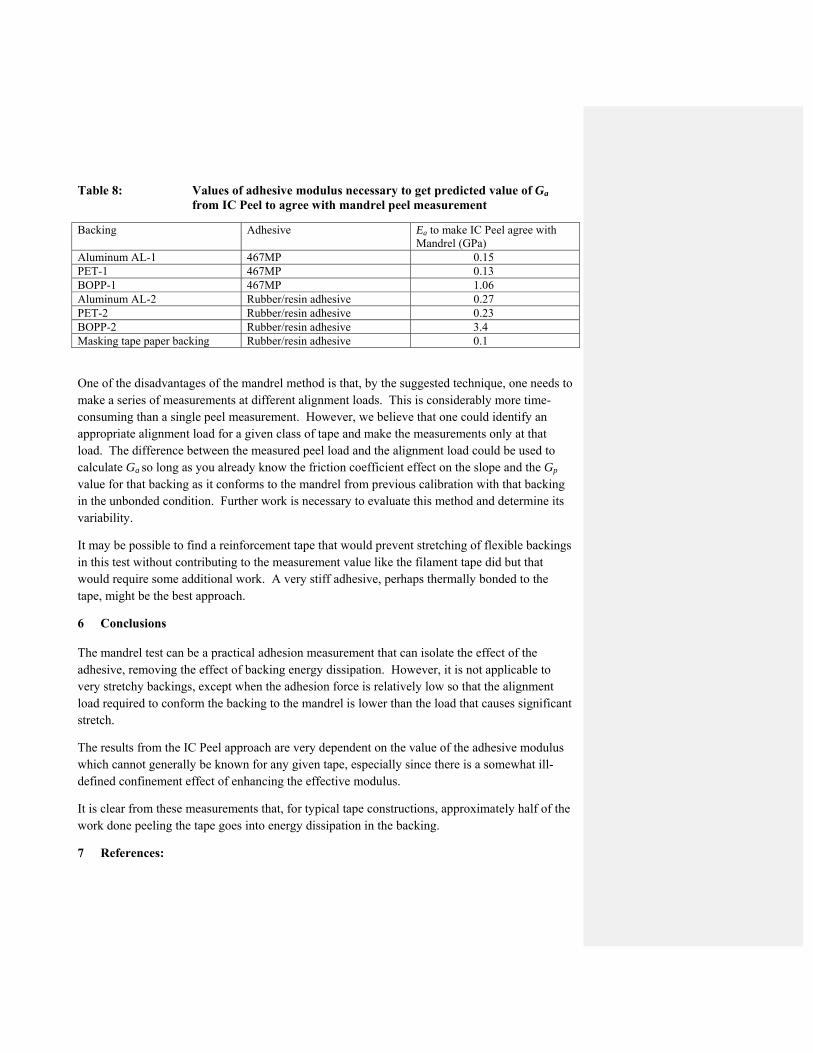
Table 8: Values of adhesive modulus necessary to get predicted value of Ga from IC Peel to agree with mandrel peel measurement
Backing Adhesive Ea to make IC Peel agree with Mandrel (GPa)
Aluminum AL-1 467MP 0.15 PET-1 467MP 0.13 BOPP-1 467MP 1.06 Aluminum AL-2 Rubber/resin adhesive 0.27 PET-2 Rubber/resin adhesive 0.23 BOPP-2 Rubber/resin adhesive 3.4 Masking tape paper backing Rubber/resin adhesive 0.1
One of the disadvantages of the mandrel method is that, by the suggested technique, one needs to make a series of measurements at different alignment loads. This is considerably more time-consuming than a single peel measurement. However, we believe that one could identify an appropriate alignment load for a given class of tape and make the measurements only at that load. The difference between the measured peel load and the alignment load could be used to calculate Ga so long as you already know the friction coefficient effect on the slope and the Gp value for that backing as it conforms to the mandrel from previous calibration with that backing in the unbonded condition. Further work is necessary to evaluate this method and determine its variability.
It may be possible to find a reinforcement tape that would prevent stretching of flexible backings in this test without contributing to the measurement value like the filament tape did but that would require some additional work. A very stiff adhesive, perhaps thermally bonded to the tape, might be the best approach.
6 Conclusions
The mandrel test can be a practical adhesion measurement that can isolate the effect of the adhesive, removing the effect of backing energy dissipation. However, it is not applicable to very stretchy backings, except when the adhesion force is relatively low so that the alignment load required to conform the backing to the mandrel is lower than the load that causes significant stretch.
The results from the IC Peel approach are very dependent on the value of the adhesive modulus which cannot generally be known for any given tape, especially since there is a somewhat ill-defined confinement effect of enhancing the effective modulus.
It is clear from these measurements that, for typical tape constructions, approximately half of the work done peeling the tape goes into energy dissipation in the backing.
7 References:
1. J.A. Williams and J.J. Kauzlarich, Strain (2011), 47, 439-448 2. L.F. Kawashita, D.R. Moore, J.G. Williams, J. of Adhesion (2006), 82, 973-995 3. A.J. Kinloch, C.C. Lau, and J.G. Williams, Intl. J. of Fracture (1994), 66, 45-70 4. I. Georgiou, H. Hadavinia, A. Ivankovic, A.J. Kinloch, V. Tropsa, and J.G. Williams, J. of Adhesion (2003), 79, 239-265 5. http://www3.imperial.ac.uk/meadhesion/testprotocols/peel


![bondingsolutions - Tesa15,resumen-del... · 2016. 10. 7. · Ultimate peel adhesion [N/cm] Product Product description and application Backing Adhesive Color Thickness without liner](https://img.pdfslide.us/doc/110x75/60cbbd2f8b9fb4618e422b0f/bondingsolutions-tesa-15resumen-del-2016-10-7-ultimate-peel-adhesion.jpg)