Embed Size (px)
Citation preview

91
6.1General
Meanwhile the data of a many fully sequenced genomes are available,including the human genome. Depending on the type of organism,only a part of the sequence can be directly correlated with a biologicalfunction. It had been found, that there is very low correlation betweenmRNA abundance and protein level (Anderson and Seilhamer, 1997;Haynes et al. 1998). Furthermore, since it became apparent, that thehuman genome surprisingly contains less than about 26,000 genes, itbecame obvious, that biological events cannot be explained from thegenomic information directly. It has thus become necessary to ana-lyse the protein complement of the genome, which has been definedas the “Proteome” (Wasinger et al. 1995).
A proteome consists of considerably more proteins than expectedby direct transcription and translation due to alternative splicing andpost-translational modifications. Not all proteins are expressed at thesame time, and in a living cell continuously changes are happening.This makes it impossible to create a proteome map like a static genemap. Therefore, during an experiment, a series of samples is ana-lysed, and the quantitative changes of expression levels are moni-tored. This approach is called “proteome analysis” or “proteomics”.The new concept is mainly applied to drug discovery, diagnostics,therapy, and agricultural research.
In practice cell lysates or tissue extracts are searched for up ordown regulated proteins. In an experiment, cells are stimulated bygene deletion or overexpression, pharmaceutical treatment, withdra-wal of nutrients, or by physical or chemical stimulation. The greatchallenge of the Proteomics approach is finding target proteins withhigh significance. This is not an easy task, because there are a lot ofvariants in the analysed biological systems, and the separation anddetection techniques have limited reproducibility.
6
Proteome Analysis
Electrophoresis in Practice, Fourth Edition. Reiner WestermeierCopyright � 2005 WILEY-VCH Verlag GmbH & Co. KGaA, WeinheimISBN: 3-527-31181-5
Anderson L, Seilhamer J. Elec-trophoresis 18 (1997)533–537.Haynes PA, Gygi SP, Figeys D,Aebersold R. Electrophoresis 19(1998) 1862–1871.Wasinger VC, Cordwell SJ,Cerpa-Poljak A, Yan JX,Gooley AA, Wilkins MR,Duncan MW, Harris R,Williams KL, Humphery-Smith I. Electrophoresis 16(1995) 1090–1094.
Hanno Langen has called theproteome a “moving target”.
The key to a successful result isthe proper planning of theProteomics experiment.

6 Proteome Analysis
The “classical” Proteomics approach is based on the separation ofproteins by high-resolution 2-D electrophoresis with subsequentidentification and further analysis of selected protein spots with massspectrometry. During the last few years a complementary “non-gel”approach has been established: Multidimensional protein identifica-tion technology (MuDPIT, Washburn et al. 2001). Here the mixture ofsample proteins is first digested by proteolysis and then analysed byseveral chromatography separations with subsequent mass spectrom-etry. This approach is also called “Shot-gun” Proteomics. It can detectproteins, which do not appear in a 2-D gel. On the other hand, pro-teins included in a 2-D gel do partly not show up in this peptide/chro-matography-based technique. This was also confirmed in a recentlypublished paper (Koller et al. 2002). Both approaches are complemen-tary.
The peptide/chromatography-based techniques have to separate anenormous complex mixture; the evaluation of results is still a chal-lenge. Approaches to reduce the complexity of the sample are underdevelopment. However, the technique shows very high sensitivity ofdetection and offers a useful tool for identification of proteins. 2-Delectrophoresis reduces the complexity of protein analysis consider-ably, because the separation is carried out on the protein level ratherthan the peptide level. The proteins of interest are selected by imageanalysis: only the proteins, which show changes between the biologi-cal stages, are digested and analysed.
2-D gel-based Proteome analysis includes the following majorsteps:
. Sample preparation under maintenance of the protein compo-sition at the actual status of the cell
. Two-dimensional electrophoresis
. Detection of protein spots
. Search for protein changes with image analysis
. Spot excision
. Enzymatic digestion of the proteins in the gel pieces
. Identification and characterization of the proteins by massspectrometry and genomic database search
. Bioinformatics for protein identification and database search-ing
2-D electrophoresis for Proteomics has a number of important fea-tures:
. Physico-chemical parameters of proteins measured
. Extremely high resolving power
92
Washburn MP, Wolters D,Yates JR III. Nature Biotechnol19 (2001) 242–247.Koller A, Washburn MP,Lange BM, Andon NL, Deciu C,Haynes PA, Hays L, Schieltz D,Ulaszek R, Wei J, Wolters D,Yates III JR. Proc Natl Acad SciUSA 99 (2002) 11969–11974.
See also page 42.
Results can be used to confirmprotein identification.
Several thousand proteins areresolved.

6.1 General
. High throughput possible
. Tolerance to crude protein mixtures
. Tolerance to relatively high sample loads
. Isoforms and post-translational modifications are displayed
. The separation is non-destructive for the proteins.
. 2-D gels are very efficient fraction collectors
. Proteins are protected inside the gel matrix for analysis
. Multiple detection, like specific staining or blotting, is applicable
. Difference gel electrophoresis (DIGE) with fluorescence pro-tein labelling allows sample multiplexing.
. With DIGE quantitative results can be obtained at a high con-fidence level
In principle, the physico-chemical properties of proteins, like pIand molecular weight, can be calculated from the open readingframes by “in-silico” translation. However, the theoretical 2-D mapsand the 2-D electrophoresis protein pattern do not match in reality:Many of the gene products are modified by complex gene interac-tions, cellular events, and environmental influence. A number ofpost-translational modifications (PTM) can happen to a gene product,like truncation, phosphorylation, different kinds of glycosylations,acetylation, etc.
Highly sensitive and accurate mass spectrometry methods, newsoftware, and the existence and accessibility of genomic and proteindatabases allow the quick identification even of small protein spots.
From the genome sequence of a relatively simple organism, Myco-plasma pneumoniae, gene products with isoelectric points betweenpH 3 and 13 are expected (Himmelreich et al. 1996). “In silico” trans-lations of other sequenced genomes show, that higher organismshave a similar distribution of their protein spectra. Although most ofthese “theoretical” isoelectric points are altered by various posttransla-tional modifications, the average distribution of the isoelectric pointswill cover a range of pH 3 to 13.
93
With parallel runs
To avoid further modifications
To detect minor components
Indicated by spot changes.
Several thousand protein spotscan be stored
Proteases have no access
This offers the use of an internalstandard.
With the internal standard,created by pooled samplemixture.
PTMs alter the isoelectricpoints and the molecularweights, and cause morecomplex patterns than a theo-retical 2-D map constructedfrom the open reading frames.Not all proteins are expressedat the same time.
Another important prerequisitefor this approach was theimproved and now morereliable 2-D electrophoresismethodology.
Himmelreich R, Hilbert H,Plagens H, Pirkl E, Li B-C,Herrmann R. Nucl Acids Res.24 (1996) 4420–4449.
6 Proteome Analysis
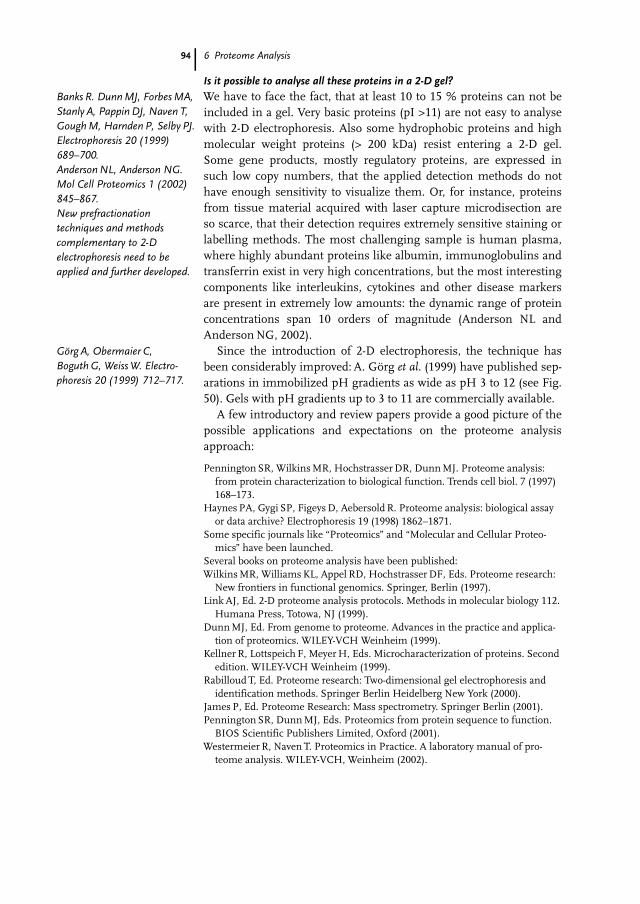
Is it possible to analyse all these proteins in a 2-D gel?
We have to face the fact, that at least 10 to 15 % proteins can not beincluded in a gel. Very basic proteins (pI >11) are not easy to analysewith 2-D electrophoresis. Also some hydrophobic proteins and highmolecular weight proteins (> 200 kDa) resist entering a 2-D gel.Some gene products, mostly regulatory proteins, are expressed insuch low copy numbers, that the applied detection methods do nothave enough sensitivity to visualize them. Or, for instance, proteinsfrom tissue material acquired with laser capture microdisection areso scarce, that their detection requires extremely sensitive staining orlabelling methods. The most challenging sample is human plasma,where highly abundant proteins like albumin, immunoglobulins andtransferrin exist in very high concentrations, but the most interestingcomponents like interleukins, cytokines and other disease markersare present in extremely low amounts: the dynamic range of proteinconcentrations span 10 orders of magnitude (Anderson NL andAnderson NG, 2002).
Since the introduction of 2-D electrophoresis, the technique hasbeen considerably improved: A. G�rg et al. (1999) have published sep-arations in immobilized pH gradients as wide as pH 3 to 12 (see Fig.50). Gels with pH gradients up to 3 to 11 are commercially available.
A few introductory and review papers provide a good picture of thepossible applications and expectations on the proteome analysisapproach:
Pennington SR, Wilkins MR, Hochstrasser DR, Dunn MJ. Proteome analysis:from protein characterization to biological function. Trends cell biol. 7 (1997)168–173.
Haynes PA, Gygi SP, Figeys D, Aebersold R. Proteome analysis: biological assayor data archive? Electrophoresis 19 (1998) 1862–1871.
Some specific journals like “Proteomics” and “Molecular and Cellular Proteo-mics” have been launched.
Several books on proteome analysis have been published:Wilkins MR, Williams KL, Appel RD, Hochstrasser DF, Eds. Proteome research:
New frontiers in functional genomics. Springer, Berlin (1997).Link AJ, Ed. 2-D proteome analysis protocols. Methods in molecular biology 112.
Humana Press, Totowa, NJ (1999).Dunn MJ, Ed. From genome to proteome. Advances in the practice and applica-
tion of proteomics. WILEY-VCH Weinheim (1999).Kellner R, Lottspeich F, Meyer H, Eds. Microcharacterization of proteins. Second
edition. WILEY-VCH Weinheim (1999).Rabilloud T, Ed. Proteome research: Two-dimensional gel electrophoresis and
identification methods. Springer Berlin Heidelberg New York (2000).James P, Ed. Proteome Research: Mass spectrometry. Springer Berlin (2001).Pennington SR, Dunn MJ, Eds. Proteomics from protein sequence to function.
BIOS Scientific Publishers Limited, Oxford (2001).Westermeier R, Naven T. Proteomics in Practice. A laboratory manual of pro-
teome analysis. WILEY-VCH, Weinheim (2002).
94
Banks R. Dunn MJ, Forbes MA,Stanly A, Pappin DJ, Naven T,Gough M, Harnden P, Selby PJ.Electrophoresis 20 (1999)689–700.Anderson NL, Anderson NG.Mol Cell Proteomics 1 (2002)845–867.New prefractionationtechniques and methodscomplementary to 2-Delectrophoresis need to beapplied and further developed.
G�rg A, Obermaier C,Boguth G, Weiss W. Electro-phoresis 20 (1999) 712–717.

6.1 General
Simpson RJ. Proteins and proteomics. A laboratory manual. Cold Spring HarborLaboratory Press, Cold Spring Harbor, New York (2003).
Simpson RJ, Ed. Purifying proteins for proteomics: A laboratory manual. ColdSpring Harbor Laboratory Press, Cold Spring Harbor, New York (2003).
A global as well as numerous local Proteomics societies have beenfounded, which are engaged in scientific and educational activities inproteomics, assist in the coordination of public proteome initiatives,facilitate opportunities for international cooperation, and have startedinitiatives for resources and technology, production of antibodies,model Proteomes like plasma, liver, brain, and define Proteomicsstandards.
In the following chapter a short overview over the methodology inproteome analysis will be given.
95
Fig. 50: Two-dimensional electrophoresis of mouse liver proteins. First dimen-sion: isoelectric focusing in an immobilized pH gradient pH 3–12 in a 24 cmlong gel strip. Second dimension: SDS PAGE in a 13% gel. Silver stained. Withkind permission of Professor A. G�rg.
More information is availableunder: http://www.HUPO.org.

6 Proteome Analysis
6.2Sample preparation
The sample treatment is the key to reasonable results. The proteincomposition of the cell lysate must be reflected in the pattern of the2-D electrophoresis gel without any losses or modifications. “Co-ana-lytical modifications” (CAM) of proteins must be avoided. This is nottrivial, because various protein-protein interactions may happen insuch a complex mixture, and prepurification of the sample can leadto uncontrolled losses of some of the proteins. Too much salt, likewashing cells with PBS, and amphoteric buffers in cell cultures, likeHEPES, have to be avoided. The chemicals used have to be of thehighest purity.
Valuable information on sample preparation – and the how to runthe two-dimensional separations – can be found in a handbook byBerkelman and Stenstedt (2002).
The standard “lysis buffer” is composed of:
8 to 9 mol/L urea, 4 % CHAPS, 60 mmol/L DTT or DTE, 0.8 % car-rier ampholytes, 0.007 % bromophenol blue.
The high urea concentration is needed to get proteins into a singleconformation by cancelling the secondary and tertiary structures, toget hydrophobic proteins into solution, and to avoid protein-proteininteractions.
CHAPS is a zwitterionic detergent, and preferred to non-ionic poly-ol mixtures like Triton X-100 and Nonidet NP-40, because of its high-er purity. It increases the solubility of hydrophobic proteins.
DTT or DTE prevent different oxidation steps of the proteins.2-mercaptoethanol should not be used, because of its buffering effectabove pH 8 (Righetti et al. 1982).
Carrier ampholytes improve the solubility of proteins by substitut-ing ionic buffers. They do not disturb the IEF very much becausethey migrate to their pIs, where they become uncharged.
Bromophenol blue is very useful as a control dye.
Special casesOrganisms with tough cell walls sometimes require boiling for 5minutes in 1 to 2 % SDS before they are diluted with lysis buffer.
96
Hydrophobic proteins must bebrought into solution.Proteases must be removed ordeactivated.Nucleic acids, lipids, saltsand solid material should beremoved without losingproteins.
Berkelman T, Stenstedt T.Amersham Biosciences Hand-book 80–6429–60 (2002).
Isocyanate impurities andheating must be avoided,because these would causecarbamylation of the proteins,resulting in artefactual spots.
Mass spectrometry is particu-larly sensitive to contamina-tions coming from thedetergent.
Righetti PG, Tudor G,Gianazza E. J Biochem BiophysMethods 6 (1982) 219–227.
They are no longer used toestablish the pH gradient, thisis today done with immobilizedpH gradients.
But be aware: SDS does notalways completely separatefrom the proteins, even underhigh field strength.

6.2 Sample preparation
For special cases – particularly for improving the solubility of mem-brane proteins – the addition of 2 mol/L thiourea to 7 mol/L ureainstead of using 8 mol/L urea has been proposed by Rabilloud (1998).This procedure results in a lot more spots in the gel, but artefactualspots and streaks have been reported as well.
Many attempts have been made, and many are tried at present tofind more effective detergents, or substitutes for detergents (Vuillardet al. 1995), alternative reductants and other additives. Unfortunatelymost of the reported substances are highly toxic; some reductants arehydrophobic and decrease the solubility, which was gained with betterdetergents.
Recently it could be shown by M�chin et al. (2003), that a cocktailof several different chaotropes, detergents and reductants couldimprove the solubilization of particularly difficult plant proteins.
Sample treatmentNucleic acids are efficiently broken down by sonification.
Lipids are removed with an excess of detergent (> 2%) or with pre-cipitation.
Salts can be dialysed away or removed by precipitation.
Protease inhibitors can inactivate the proteolysis activities, howeverin some cell lysates not completely. PMSF is frequently used, but it isa toxic compound and has to be added to the sample prior to thereductant. Pefabloc is less toxic, but might lead to charge modifica-tions of some proteins.
Precipitation: For plant samples or other very diluted samples the fol-lowing procedure according to Damerval et al. is frequently and suc-cessfully applied:
The contents of the cell lysate are precipitated with 10 % TCA inacetone; the pellets are washed with acetone, dried under vacuum,and resuspended with lysis buffer. The acid also modifies most of theproteases; subsequently protease activity is inhibited irreversibly.
An alternative procedure employs sequential precipitation withmethanol and chloroform (Wessel and Fl�gge, 1984).
Novel clean-up kits based on acidic precipitation with detergent co-precipitants and organic washing solutions allow a sample clean-upwithin 1 1�2 hours. Practice has shown that more protein spots arepresent in the 2-D gel subsequently to such a treatment, because itdissociates protein-lipid-polysaccharide complexes very effectively. Agood example can be found in the paper by Stasyk et al. (2001).
97
Rabilloud T. Electrophoresis 19(1998) 758–760.
Vuillard L, Marret N,Rabilloud T. Electrophoresis 16(1995) 295–297.
M�chin V, Consoli L, Le Guil-loux M, Damerval C, Proteo-mics 3 (2003) 1299–1302.
Heating must be avoided.
However, both procedures canlead to protein losses.
Some proteases are alreadyinhibited by the denaturingconditions, some by basic pH.
Damerval C, DeVienne D,Zivy M, Thiellement H. Electro-phoresis 7 (1986) 53–54.
Wessel D, Fl�gge UI. Anal.Biochem. 138 (1984)141–143.
Available from AmershamBiosciences.Stasyk T, Hellman U, Souchel-nytskyi S. Life Science News 9(2001) 9–12.

6 Proteome Analysis
At present the situation can be described in the following way:Optimized procedures for different sample types do exist. However, ageneral “Prepares them all” procedure is not available.
Sample preparation for DIGEFor Difference Gel electrophoresis the sample proteins are labelledwith modified fluorescent cyanine dyes (�nl� et al. 1997). Three dyeswith different excitation and emission wavelengths are available: Cy2,Cy3 and Cy5. After labelling the samples are mixed and applied onthe same gel. The patterns are scanned with a fluorescent laser scan-ner at different wavelengths. Two different approaches exist: mini-mum labelling and saturation labelling for scarce samples.
Minimum labelling
The Cy dyes bind to the e-amino group of the lysine. Only limitedamount of dye is added to the protein mixture: about 3 % of the pro-teins are labelled. In this way an increase in hydrophobicity of theproteins is avoided, multiply labelled proteins occur statisticallybelow the range of sensitivity of detection. It is important to performthe labelling procedure under exactly controlled conditions:
. The pH value must be adjusted to pH 8.5.
. Absence of carrier ampholytes and reductants.
. Half hour labelling on ice-water.
. Stopping of reaction by adding a small amount of lysine afterlabelling.
Saturation labelling
Only Cy3 and Cy5 can be modified for saturation labelling. With thisapproach all available thiol groups of all present proteins are labelled.Also this procedure must occur under strictly controlled conditions:
. Reduction for one hour at 37 �C at pH 8.0 with a strong reduc-tant: Tris-carboxyethyl phosphine (TCEP).
. Labelling for half an hour at 37 �C at pH 8.0 with the Cy dyederivative.
Pre-fractionationThe reason for missing of proteins is very often the high complexityof the sample. There are various methods of pre-fractionation toreduce the complexity of the protein mixture:
98
In chapter 11 more detailedinstructions for sample prepara-tion are given.
�nl� M, Morgan ME,Minden JS. Electrophoresis 18(1997) 2071–2077.
The labelling effectiveness isconsiderably increased, whenthe sample has been cleanedup by precipitation.
By adding about 30 mmol/LTris-base
These reagents are added afterlabelling.
This is a useful method for thedetection of proteins acquiredwith laser capture microdisec-tion.
The concentrations of reductantand label must be optimizedfor the sample type.

6.2 Sample preparation
Protein chromatography: There is a basic difference between proteinpurification and fractionation: the goal of purification is the removalof all contaminants, whereas in fractionation the losses of proteinshave to be avoided. The principles of protein chromatography arecomprehensively described in the book Protein Purification, edited byJanson and Ryd�n (1997).
Differential Solubility: Sequential protein extraction with increasinglystrong solubilizing agents divides the sample mixture into smallersubsets.
Blue Native Electrophoresis (see page 41): This method reveals alsoproteins with high hydrophobicity because of the reduction of com-plexity of the protein mixture. Werhan and Braun (2002) applied a“three-dimensional electrophoresis” with the first dimension separa-tion of protein complexes by blue native polyacrylamide electrophor-esis. The visible bands are eluted from the gel, destained, and sepa-rated by 2-D electrophoresis.
Selective Removal of Abundant Proteins: The most specific fractiona-tion can be obtained with immuno affinity techniques. For humanplasma analysis, there are affinity columns on the market, whichremove a high amount of albumin and some other highly abundantproteins like the immunoglobulins, transferrin, and fibrinogen. Pro-teins sticking to albumin should be analyzed as well: the removedfraction should not be discarded.
Subcellular Components: Different methodology can be employed:
. Ultracentrifugation (Pretlow and Pretlow, 1991).
. Free flow electrophoresis (Zischka et al. 2003), see alsopage 10.
. Detergent fractionation in cytosol, membrane-organelle, nuclearmembrane and cytoskeletal-matrix proteins (Ramsby et al. 1994).
According to pI: When isoelectric focusing should be carried out innarrow interval pH gradients.
99
Janson JC, Ryd�n L, Eds.Protein purification. Principles,high-resolution methods, andapplications. WILEY-Liss, NewYork (1998).
But hydrophobicity of a proteinis not correlated to its function.
Information on which protein iscomplexing with which partnersis obtained.Werhahn W, Braun H-P.Electrophoresis 23 (2002)640–646.
Also plant samples may requiresuch a procedure in order toremove Rubisco.
The location of a protein in a cellis closely linked to its function.
Pretlow TG, Pretlow TPMethods: A Companion toMethods in Enzymology 2(1991)183–191.
Zischka H, Weber G, WeberPJA, Posch A, Braun RJ, B�hrin-ger D, Schneider U, Nissum M,Meitinger T, Ueffing M, Eckers-korn C. Proteomics 3 (2003)906–916.
Ramsby ML, Makowski GS,Khairallah EA. Electrophoresis15 (1994) 265–277.
6 Proteome Analysis
. Free flow isoelectric focusing in a carrier ampholytes-contain-ing liquid stream.
. Electrophoretic separation between isoelectric membranes.
. Carrier isoelectric focusing in Sephadex.
6.3Two-dimensional electrophoresis
First dimension
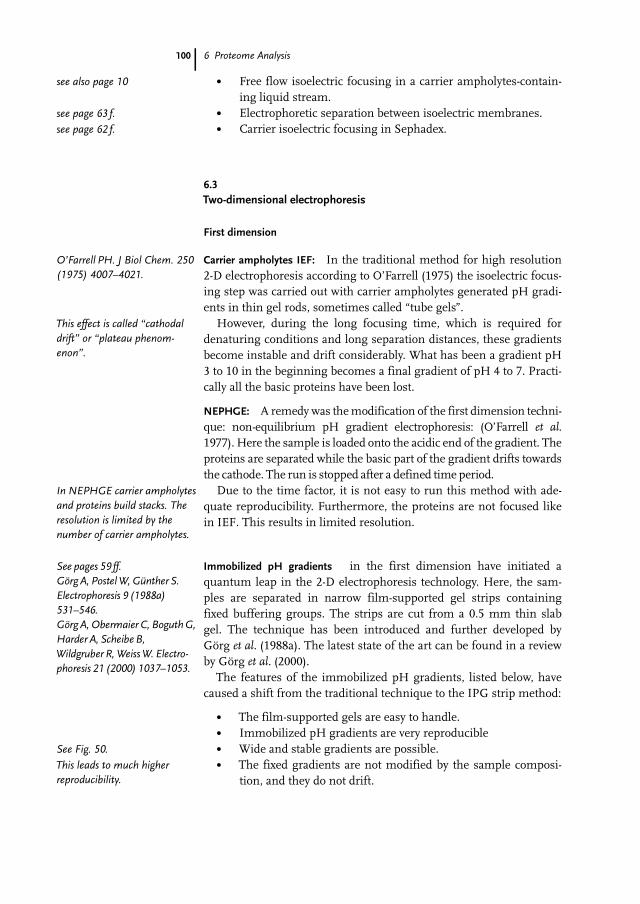
Carrier ampholytes IEF: In the traditional method for high resolution2-D electrophoresis according to O’Farrell (1975) the isoelectric focus-ing step was carried out with carrier ampholytes generated pH gradi-ents in thin gel rods, sometimes called “tube gels”.
However, during the long focusing time, which is required fordenaturing conditions and long separation distances, these gradientsbecome instable and drift considerably. What has been a gradient pH3 to 10 in the beginning becomes a final gradient of pH 4 to 7. Practi-cally all the basic proteins have been lost.
NEPHGE: A remedy was the modification of the first dimension techni-que: non-equilibrium pH gradient electrophoresis: (O’Farrell et al.1977). Here the sample is loaded onto the acidic end of the gradient. Theproteins are separated while the basic part of the gradient drifts towardsthe cathode. The run is stopped after a defined time period.
Due to the time factor, it is not easy to run this method with ade-quate reproducibility. Furthermore, the proteins are not focused likein IEF. This results in limited resolution.
Immobilized pH gradients in the first dimension have initiated aquantum leap in the 2-D electrophoresis technology. Here, the sam-ples are separated in narrow film-supported gel strips containingfixed buffering groups. The strips are cut from a 0.5 mm thin slabgel. The technique has been introduced and further developed byG�rg et al. (1988a). The latest state of the art can be found in a reviewby G�rg et al. (2000).
The features of the immobilized pH gradients, listed below, havecaused a shift from the traditional technique to the IPG strip method:
. The film-supported gels are easy to handle.
. Immobilized pH gradients are very reproducible
. Wide and stable gradients are possible.
. The fixed gradients are not modified by the sample composi-tion, and they do not drift.
100
see also page 10
see page 63 f.
see page 62 f.
O’Farrell PH. J Biol Chem. 250(1975) 4007–4021.
This effect is called “cathodaldrift” or “plateau phenom-enon”.
In NEPHGE carrier ampholytesand proteins build stacks. Theresolution is limited by thenumber of carrier ampholytes.
See pages 59 ff.G�rg A, Postel W, G�nther S.Electrophoresis 9 (1988a)531–546.G�rg A, Obermaier C, Boguth G,Harder A, Scheibe B,Wildgruber R, Weiss W. Electro-phoresis 21 (2000) 1037–1053.
See Fig. 50.
This leads to much higherreproducibility.

6.3 Two-dimensional electrophoresis
. Very narrow pH intervals in long gel strips can be prepared,which allow high spatial resolution and high protein loading.
. Different ways of sample applications are feasible; in mostcases the dried strips are rehydrated with the sample solutionsthemselves.
. Various additives, like detergents and reductants, can be addedto the rehydration solution.
With the considerably improved first dimension, 2-D electrophore-sis has now become more reproducible and more useful for analyticalas well as for micropreparative applications. An inter-laboratory com-parison has demonstrated the high reproducibility of the method(Blomberg et al. 1995).
Probably the most powerful feature is the possibility to reachalmost unlimited spatial resolution with very narrow pH intervals.
Horizontal streaking in basic pH gradients
In basic pH ranges horizontal streaking of spots was a frequently ob-served problem. The streaking was caused by deprotonation of DTTor DTT, which are weak acids. The thus negatively charged reductantsmigrate towards the anode, leaving the cysteins unprotected. Thisleads to back folding and aggregating of polypeptides, which isaccompanied by gaining different isoelectric points leading to hori-zontal smearing. Use of alternative reductants like Tributyl phos-phine (TBP) or TCEP was not solving the problem, it caused othernegative effects. Alkylation of heterogeneous protein mixtures priorto IEF produces artefactual spots of incompletely alkylated polypep-tides.
With oxidation of the cysteinyls to mixed disulfides during IEF theproblem is completely abolished (Olsson et al. 2002). The samples,containing any reductant of choice, are loaded at the anodal end ofthe IPG strip, which has been rehydrated with the standard chao-tropes, detergent, carrier ampholytes, and – instead of a reductant –with 100 mmol/L of a disulfide reagent. This is an equilibrium reac-tion with high specifity, without unwanted side reactions.
Second dimensionNothing really revolutionary has happened for this part of the proce-dure: Usually SDS polyacrylamide gel electrophoresis in a Tris-chlo-ride Tris-glycine buffer according to Laemmli (1970) is employed,mostly without a stacking gel. Vertical and horizontal flatbed systemscan be used with similar results (G�rg et al. 1995).
101
This allows also the detectionof low expressed proteins.
Protein losses due toaggregation and precipitationare avoided with sampleloading by rehydration.
Many of them would inhibit gelpolymerization.
Blomberg A, Blomberg L,Norbeck J, Fey SJ, Larsen PM,Roepstorff P, Degand H,Boutry M, Posch A, G�rg A.Electrophoresis 16 (1995)1935–1945.
This is absolutely necessary forprotein identification with massspectrometry.
Olsson I, Larsson K, Palm-gren R, Bjellqvist B. Proteomics2 (2002) 1630–1632.
A stacking gel is not needed,because the proteins are pre-separated by IEF and migratefrom a gel into another gel.G�rg A, Boguth G, Ober-maier C, Posch A, Weiss W.Electrophoresis 16 (1995)1079–1086.
6 Proteome Analysis
Small peptides are better resolved in Tris-tricine gels according toSch�gger and Von Jagow (1987), or in Tris-tricine ready-made long-shelf life gels which are described on page 40 f.
Once a conventional gel leaves the glass cassette after the run, itbehaves like a living animal: it swells and shrinks during staining.This makes evaluation with image analysis cumbersome and auto-mated spot-cutting impossible.
Film-supported SDS polyacrylamide gels for the second dimension aremuch easier to use. The only little drawbacks are: The steps in silverstaining require more time, because the liquid can diffuse into thegel only from one side. The films used show fluorescent backgroundat certain wavelengths. It could however be shown, that spot detectionwith the sensitive fluorescent dye SYPRO Ruby works well, when afluorescence scanner with a confocal scanning head is employed (seealso page 86).
With dimension-stable gels image analysis is much easier and faster.They can be used in an automated spot-picker, which uses the infor-mation from the image analysis system; the kind of the detectiontechnique does not matter.
Shelf life stability of the gels: Due to the high pH value 8.8 of the Tris-Chloride gel buffer the polyacrylamide gel starts to hydrolyse andchanges its sieving properties already after a week.
Recently a modification of Laemmli buffer system has been intro-duced: the Tris of the gel buffer has been replaced by PPA (piperidinopropionamide) resulting in a pH value below 7. Thus ready-madegels can be used without stability limitations, and with an improvedreproducibility of the spot positions also in the second dimension.
There is a convention how to display a 2-D gel: Like in a Cartesiancoordinate system, where the small figures are on the left hand sideat the bottom, the acidic proteins (with low pI) are shown on the leftside, the low MW proteins at the bottom.
6.4Detection techniques
The ideal detection technique should have a wide linear dynamicrange, should be very sensitive, quantitative, compatible with thefurther analysis using mass spectrometry, quick, non-toxic, reason-ably priced, and should not require living cells for labelling. None ofthe existing techniques combines all these features.
102
Another problem is the fragilityof the gels; they can easily get acrack or break into pieces.
Gels on covalently boundsupport films, which do notcome off during staining, canbe employed in horizontalflatbed and in verticalinstruments.
Here the cathodal bufferconsists of Tris-glycine like inthe Laemmli buffer: Thus theprotein pattern is the same aswith a conventional buffersystem.
Still some papers can be found,where this convention is notrespected. But this complicatesthe comparisons of the 2-Dpatterns even more.
6.4 Detection techniques
Labeling of living cells
Radioactive labelling: The most sensitive and quantitatively reliablemethod is the labelling of the proteins with 35S or 32P isotopes, expo-sure of the gel on a storage phosphor screen, which is subsequentlyscanned with a laser (see page 85). Less than 1 pg protein can bedetected.
Stable isotope labelling with 14N/15N (ammonium), 12C/13C (glucose)is ideal for differential 2-D electrophoresis and quantification, but isexpensive and requires high resolution MS for detection.
These methods require living cells, and can therefore not beapplied on analysis of biopsy tissue, body fluids, plant material etc.
The following staining and labelling techniques do not require liv-ing cells:
Staining after 2-D electrophoresisCoomassie Brilliant Blue stains almost all proteins and peptides withgood quantitative linearity. It is compatible with mass spectrometry,but is not very sensitive (at least ca. 0.1 lg of protein per spot is re-quired). Alcohol free procedures should be used to reach the highestsensitivity, see methods 7 and 10.
Negative staining with imidazole zinc is more sensitive: down to 15ng (Hardy et al. 1996). As only the background is stained, and not theproteins, the recovery yield is very good for further analysis withmass spectrometry (Matsui et al. 1997). However, it cannot be usedfor quantification.
Silver staining, introduced for 2-D polyacrylamide gels by Merril etal. (1979), picks up protein amounts down to 0.2 ng. Although ca. 50modifications have been published, there are two main typesemployed for 2-D gels: silver nitrate and silver diamine procedures.The latter shows a better sensitivity for basic proteins, but it containssome caustic solutions, does not work with tricine buffer in the gel,and a silver mirror development on the gel surface can easily happen.In the silver nitrate method the silver is more weakly bound to theproteins, it can be modified for mass spectrometry compatibility.Both methods require multiple steps; automation of the procedure istherefore very helpful. It is very important, that staining is performedin closed trays to prevent keratin contamination.
103
However, as alreadymentioned, there is a trend toreplace radioactivity in thelaboratories wherever possible.
The sensitivity is not the samefor all proteins. It is dependenton the binding properties of theproteins, see page 90.
Hardy E, Santana H, Sosa AE,Hernandez L, Fernandez-Patron C, Castellanos-Serra L.Anal Biochem. 240 (1996)150–152.Matsui NM, Smith DM,Clauser KR, Fichmann J,Andrews LE, Sullivan CM,Burlingame AL, Epstein LB.Electrophoresis 18 (1997) 409–417.
Merril CR, Switzer RC, VanKeuren ML.Proc Nat Acad Sci76 (1979) 4335–4339.A silver diamine procedure(ammoniacalic) is described inmethod 6, because it is themost sensitive technique forisoelectric focusing gels.
A very sensitive silver nitratetechnique is described inmethods 7 and 11, in the latteralso the mass spectrometrycompatible version.

6 Proteome Analysis
Fluorescence staining methods are less sensitive than silver staining:down to 2 – 8 ng protein. But they have very wide linear dynamicranges of ca. 104, and they are compatible with subsequent massspectrometry analysis. Deep PurpleTM is the most sensitive dye(Mackintosh et al. 2003), followed by SYPRO Ruby (Berggren et al.2002); others are similar sensitive like Coomassie Brilliant Blue: NileRed (Alba et al. 1996), SYPRO Red and Orange (Steinberg et al.1996). These dyes are relatively expensive, and a fluorescence scanneror a CCD camera is required.
Blotting of 2-D gels is nowadays mainly used for immuno detec-tion. The transfer efficiency of electro blotting is not sufficient for thegeneral detection of all the proteins.
New fluorescent dyes for specific detection of post-translational mod-ifications have lately been introduced: Pro-Q-Diamond dye for phos-phorylated proteins, and Pro-Q-Emerald for glycosylated proteins. Itis possible to stain a gel sequentially with the different dyes andfinally with a total stain.
Fluorescence stained or labelled spots are not visible. Accuratepicking of selected spots for mass spectrometry analysis works best,when the gels are fixed on a glass plate or film-support. Two smallself-adhesive fluorescent labels, internal reference markers, areplaced on the gel support before or after casting. Because those arevisible, the camera of the spot picker can find their positions. Thespot picker software will – with the help of the pixel coordinates ofthe reference markers – convert the pixel coordinates of the selectedspots into the machine coordinates.
DIGE (Difference gel electrophoresis)Difference gel electrophoresis using fluorescence protein pre-label-ling is not solely a detection technique; it offers a complete conceptfor accurate quantitative Proteomics. With the CyDye technology it ispossible to label the proteins from different samples with dyes of dif-ferent excitation and emission wavelengths. The samples are mixedand run together in one gel (multiplexing). The gels are cast in non-fluorescent glass cassettes and do not need to be removed from thecassettes during scanning. The two labelling concepts, lysine mini-mum labelling and cysteins saturation labelling have been brieflydescribed under “6.2 Sample preparation” on page 98.
104
Mackintosh JA, Choi H-Y, BaeS-H, Veal DA, Bell PJ,Ferrari BC, Van Dyk DD,Verrills NM, Paik Y-K, Karuso P.Proteomics 3 (2003)2273–2288.Berggren KN, Schulenberg B,Lopez MF, Steinberg TH,Bogdanova A, Smejkal G,Wang A, Patton WF. Proteomics2 (2002) 486–498.Alba FJ, Bermudez A, DabanJ-R. BioTechniques 21 (1996)625–626.Steinberg TH,Hangland RP, Singer VI. AnalBiochem. 239 (1996) 238–245.
See also spot identification onpage 109.
These dyes are available fromMolecular Probes.
Note, that glass plates or film-support must be non-fluores-cent. For non-backed gels, thecellophane trick can be applied,which is described below.
The Cyanine dyes are speciallymodified for binding toproteins. The standard CyDyesused for DNA labelling cannotbe used here.

6.4 Detection techniques
Minimum labelling
The different samples, for instance healthy and diseased tissueextracts, as well as a pooled standard are labelled with the differentdyes, mixed and applied on one gel as shown schematically in figure51 A. The different patterns are acquired with a fluorescence scannerby excitation and measurement at three different wavelengths (seeFig. 51). Identical proteins of the different samples migrate to thesame positions, because the dyes are matched for charge and size:
. pI: Each of the CyDyeTM DIGE fluors contains a buffering groupwith the same pK value like the e-amino group of lysine.
. Mr: The molecular weight added to the polypeptides is verysimilar for each of the fluors (from 434 to 464 Da).
Therefore spot matching within a gel is not needed. Changes ofprotein expression levels are easily detected by overlaying the imagechannels with false color display as shown in figure 51 B.
The 2-D patterns are qualitatively the same as those obtained fromnon-labelled proteins; because some multiply labelled proteins willexist in such low concentrations, that they are not detected. In gen-eral, the sensitivity of detection is similar like for post-staining withfluorescence dyes. The scanned images are evaluated with dedicatedsoftware, which can co-detect the identical protein spots of the differ-ent samples and the standard. In order to make quantitative changesmeasurable, the software has to normalize the images to compensatethe different emission intensities of the dyes. In mass spectrometryanalysis the signals of the minimum labelled proteins (about 3 %only) are below the detection level. For spot picking the gels are post-stained, because in the molecular weight range below 30 kDa SDSelectrophoresis is able to resolve 450 Da mass differences, the non-labelled proteins have migrated further than the labelled proteins.The non-labelled proteins are thus detected, matched with thelabelled, and picked for mass spectrometry analysis.
Saturation labelling
This labelling concept offers the possibility of labelling the totalamount of cystein-containing proteins of a sample, which leads tovery high sensitivity of detection. Proteins with more than one cysteinare multiply labelled, resulting in an additional increase in sensitivityof detection. The spot pattern looks therefore different from thoseobtained with minimum-labelling or non-labelled proteins. But themodified Cy3 and Cy5 fluors are size-matched, in order to assure co-migration of the differently labelled proteins. A mass of 672.85 Da isadded to each cystein labelled with Cy3, 684.86 to each cysteinlabelled with Cy5. These masses have to be taken in account for theidentification with peptide mass fingerprinting.
105
In this way the pI is not altered.
The differences are far belowthe resolution of SDS electro-phoresis.
The non-labelled proteins makeup 97 % of a spot in the highand medium molecular weightarea, in the lower molecularweight area the non-labelledproteins are set off the labelledones.
The method is particularlyuseful for labelling scarceprotein samples like thoseacquired with laser capturemicrodisection.

6 Proteome Analysis106
healthyCy3 label
pooled sample= internal standard
Cy2 label
diseasedCy5 label
mixture
IPG strip
2-D electrophoresis
scan at different wavelengths
image of Cy5diseased tissue
image of Cy3healthy tissue
image of Cy2internal standard
A
B
Cye 3 channel Cye 5 channel
Cye 3/ Cye 5 channel overlay
Fig. 51: Difference Gel Electrophoresis (DIGE): A: Schematic drawing of theconcept of labelling two samples and a mixture of the samples, a pooled standard,with three different fluorescent dyes and running them together in 2-D electro-phoresis. B: False color representation of the Cy 3 and Cye 5 image channels afterscanning and overlay of the images. Channel overlay: Yellow spots: no changes,red spots: up-regulated, green spots: down-regulated proteins.

6.5 Image analysis
The internal standard
By employing the 2-D DIGE technique the number of gels to be runis considerably reduced. However, the particular strength of this mul-tiplexing technique is the use of an internal standard for every pro-tein. In this way gel-to-gel variations are eliminated. Each protein inthe population must appear also in the standard; otherwise it will notbe used in the evaluation. For multi-sample experiments the standardis run in each gel, this allows normalization between the gels accord-ing to the spot positions and the spot volumes of the standard. Thisallows routine detection of less than ten percent differences in pro-tein expression levels with over ninety-five percent confidence withinshort time.
Alban et al. (2003) have published a paper which confirms the the-oretical benefits of the internal standard in a spiking experiment.Friedman et al. (2004) have recently demonstrated the enormouspractical progress achieved with DIGE using the internal standard forproteome analysis of human colon cancer.
6.5Image analysis
Image acquisition is preferably done with scanners rather than withCCD cameras, because high resolution and a homogeneous back-ground from the centre to the edges are required. Visible patterns arerecorded with modified desktop scanners in the light transmissionmode, fluorescent dyes or radioactivity is detected with special laserscanners (see page 85f).
For automated picking of selected protein spots the internal refer-ence markers are scanned together with the protein spots. Theirx- and y- coordinates will be a part of the picking list, which containsthe x- and y-coordinates of the selected spots.
Image analysis is a very important step in the proteome analysisprocedure, because the evaluation of the complex patterns can easilybecome the bottleneck.
Gel evaluation softwareThe evaluation of the highly complex 2-D patterns requires software,which automatically detects the spots, corrects the background, andquantifies the spot volumina. Furthermore the isoelectric points andmolecular weights of the spots are interpolated after 2-D calibration.For DIGE evaluation special software is available, which can co-detectthe co-migrated proteins in the different image channels.
107
The “internal standard”converts 2-D electrophoresisfrom a semi-quantitativeseparation technique into atruly analytical method.
Alban A, David S, Bjorkesten L,Andersson C, Sloge E, Lewis S,Currie I. Proteomics 3 (2003)36–44.Friedman DB, Hill S, Keller JW,Merchant NB, Levy SE,Coffey RJ, Caprioli RM. Proteo-mics 4 (2004) 793–811.

6 Proteome Analysis
Average gels: For statistically reliable quantitative data samples areoften grown, prepared and run in doublets or triplets. Therefore asoftware tool is necessary to construct composite gels from a numberof 2-D patterns of the same sample.
The patterns of different samples are compared by first defining areference gel and then matching the spot positions with those of thereference. Because staining is never perfectly reproducible, a normal-ization step is needed before quantitative spot comparisons betweengels can be performed.
Qualitative and quantitative differences in spot patterns are then de-termined and displayed for the detection and measurement of up ordown regulated gene products. Those proteins, which show differ-ences between the samples
Statistics
Statistic tools are mostly included in the software packages, in orderto check the significance of a change in protein expression. The con-fidence level rises, when replicate gels have been run and evaluated.The use of pooled standard, which is only possible with DIGE gels,increases the confidence level considerably, even without replicategels.
Spot picking list
Advanced automated spot pickers use the coordinates of the spots fromthe image analysis. Thus also radiolabelled and other “invisible” spotscan easily be collected with high precision. For this procedure thegels have to be fixed on a glass plate or film support. Non-backed gelscan be placed on a dry cellophane sheet, which is clamped andstretched into a set of plastic frames. The gels stick tightly to the cello-phane and cannot shrink or swell anymore during scanning, spot-picking, and in between. A picking list is created giving the x/y coor-dinates of the reference markers and the protein spots selected forfurther analysis.
Database software
For the analysis of multiple gel experiments and intensive statisticstudies database software is employed. With the definition of complexqueries of the quantitative behaviour of gene products, control pointsin biochemical pathways and protein families can be found.
108
These virtual average gelsreduce the noise of the system.
Links to external databases areestablished by employing a webbrowser.
Gel-to-gel variations need to beeliminated.
The cellophane trick has beenfound by Burghardt Scheibe.The “cellophane” procedureworks also for fluorescencelabelled or stained gels, becausecellophane does not give afluorescent background.
In principle, database softwareis used for combining theresults of many 2-D experi-ments – a 2-D experiment isusually composed of a series of2-D gels.
6.6 Protein spot identification
6.6Protein spot identification
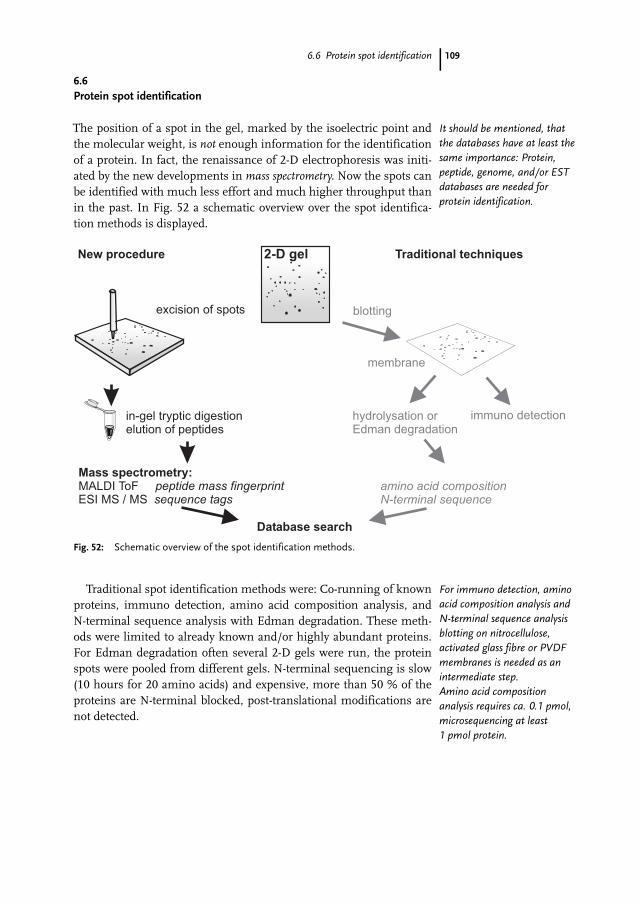
The position of a spot in the gel, marked by the isoelectric point andthe molecular weight, is not enough information for the identificationof a protein. In fact, the renaissance of 2-D electrophoresis was initi-ated by the new developments in mass spectrometry. Now the spots canbe identified with much less effort and much higher throughput thanin the past. In Fig. 52 a schematic overview over the spot identifica-tion methods is displayed.
Traditional spot identification methods were: Co-running of knownproteins, immuno detection, amino acid composition analysis, andN-terminal sequence analysis with Edman degradation. These meth-ods were limited to already known and/or highly abundant proteins.For Edman degradation often several 2-D gels were run, the proteinspots were pooled from different gels. N-terminal sequencing is slow(10 hours for 20 amino acids) and expensive, more than 50 % of theproteins are N-terminal blocked, post-translational modifications arenot detected.
109
in-gel tryptic digestionelution of peptides
Mass spectrometry:MALDI ToFESI MS / MS
peptide mass fingerprintsequence tags
excision of spots
hydrolysation orEdman degradation
Database search
New procedure Traditional techniques
amino acid compositionN-terminal sequence
blotting
membrane
immuno detection
2-D gel
Fig. 52: Schematic overview of the spot identification methods.
It should be mentioned, thatthe databases have at least thesame importance: Protein,peptide, genome, and/or ESTdatabases are needed forprotein identification.
For immuno detection, aminoacid composition analysis andN-terminal sequence analysisblotting on nitrocellulose,activated glass fibre or PVDFmembranes is needed as anintermediate step.Amino acid compositionanalysis requires ca. 0.1 pmol,microsequencing at least1 pmol protein.

6 Proteome Analysis
During the development of the new mass spectrometry methods,blotting had been used in order to remove contaminating buffers anddetergents. However, the overall transfer efficiency of blotting wasnever sufficient. Furthermore, mass spectrometry picks up chemicalcompounds from the membranes.
Thus, the proteins are digested inside of excised gel pieces withproteolytic enzymes, the peptide mixtures are submitted for furtheranalysis.
The latter technique is also preferred for chemical microsequen-cing: because of the poor transfer reliability, and to obtain sequenceinformation also from N-terminally blocked proteins (Hellman et al.1995).
When spots are cut manually, there is high danger to contaminatethe gels with keratins and other substances from the air. It is not onlya cumbersome task, errors of picking wrong spots can jeopardize theresults. In Fig. 53 the concept of an automated spot-picker, digester,and spotter is displayed: the system is placed into a closed cabinet;spot positions are imported from the image analysis results.
110
imageanalysis
2-D Gelfixed on a filmor glass plate digester
spot picker
gel hotel
spotter
MALDI ToF MS
Fig. 53: Schematic drawing of an automated spot picking, digestion, and spot-ting system.
With electro elution of intactproteins from polyacrylamidegels very low yields areobtained. Note, that blotting isan electro elution process.
Hellman U, Wernstedt C,G��ez J, Heldin C-H. AnalBiochem. 224 (1995)451–455.
Automated digestion for verysmall protein amounts iscurrently under development.

6.6 Protein spot identification
6.6.1Mass spectrometry methods
The reason why mass spectrometry was not employed already manyyears earlier is the late development of ionization methods for pep-tides and proteins. For mass spectrometry analysis the sample mole-cules must be available as ionized gas.
Two methods have survived the “evolution” of ionization proce-dures for peptides and proteins: Electrospray (ESI), invented by Yama-shita and Fenn (1984) and matrix assisted laser desorption ionization(MALDI), developed by Karas and Hillenkamp (1988).
Also, sensitivity, accuracy, and resolution of the instruments hadbeen developed so far, that the data can be used in the databasesearch with an adequate confidence level.
With new mass spectrometry equipment sensitivities in the rangeof femto to attomol are reached.
MALDI ToF
MALDI ToF is mostly employed for protein identification via finger-printing of tryptic peptides. The peptides are mixed with low molecu-lar weight compounds, which have an absorption maximum at thewavelength of the laser – the matrix.
The matrix substances used for peptide analysis have been selectedby Beavis and Chait (1989, 1990): For entire proteins sinapinic acid isused, for peptides a-cyano-4-hydroxy cinnamic acid or 2,5-dihydroxy-benzoic acid (DHB). The mixtures are applied and dried as spots ontoa metal slide.
This slide is inserted into a vacuum box. A pulsed laser beam (337nm) is fired into the spot; the small matrix molecules absorb the en-ergy. They move away from the target with supersonic speed. Thematrix molecules take the peptides and proteins with them. Whilethis happens, the charged matrix molecules transfer their charges onthe peptide and protein molecules. MALDI produces mainly singlycharged ions.
All ions with their different masses are accelerated in an electricfield with the help of a high voltage grid to the same kinetic energyand induced into the high vacuum tube. Light ions arrive at the detec-tor sooner than heavy ions (see Fig. 54). The recorded flight times areused to calculate the masses of the ions in m/z (mass per charge).
Several technical developments have contributed to a better perfor-mance, higher mass accuracy, and enhanced resolution of theMALDI ToF technology:
111
Up to a few years ago onlyvolatile small molecules couldbe analysed with mass spectro-metry.
Yamashita MJ, Fenn B. J PhysChem. 88 (1984) 4451–4459.Karas M, Hillenkamp F. AnalChem. 60 (1988) 2299–2301.
Protein spots of silver stainedgels can now be identified.
But it is also sensitive tocontaminations, like keratinetc.
Beavis RC, Chait BT. RapidCommun Mass Spectrom. 3(1989) 432–435.Beavis RC.Org Mass Spectrom. 27 (1992)653–659.
The charge transfer does notalways work for all peptides,which is the main reason formissing peptides.
With a low mass rejectionfunction the matrix ions arecancelled out.Secondary electron multiplier ismostly used as detectors, whichprovide sensitivity in thefemtomol / attomol range.
Also new A/D converters(1–2 GHz) acquire more datapoints for higher resolution.

6 Proteome Analysis
Pulsed extraction: The voltage of the acceleration grid is not appliedpermanently, but switched on with a time delay (a few nanoseconds)from the laser impulse. At this moment ions with a higher start velo-city are further away from the slide than slower ions; they will thusreceive a lower kinetic energy. In this way all ions will arrive at theflight tube at the same time.
Reflectron tubes reverse the drift direction of the ions in an electriccounter field. This “ion mirror” corrects the start velocity distributionof ions of the same mass: Ions of the same mass, but higher startenergy drift deeper into the reflector, thus fly a longer distance andcatch up with the slower moving ions at a certain point after thereflector. The detector is located at this focusing point. This leads to asharper signal, resulting in higher resolution.
Also the longer flight length obtained in a reflectron increases theresolution without the need for a larger instrument.
112
+
+
+
+
+
+
+
+
+
++
+
vacuum
highvacuum
pulsedUV laser(3-4 ns)
timedion gate
detectorfor linear mode
detectorfor reflectron mode
reflectron
slide
strongelectricfield
Time of Flight
tube
Matrix Assisted
Laser Desorption
Ionization
peptide mixtureembedded inlight absorbingchemicals (matrix)
time of flight [m/z]
inte
nsity
+
+
+
+
+
+
+
+
+
+
Fig. 54: MALDI ToF with quadratic field reflectron. Forfurther explanation see text.
Also known as “time focusing”.
Multiple spectra from a singlelaser shot are summed forsignal averagingto achieve accurate massdetermination.

6.6 Protein spot identification
High molecular weight peptides and proteins are only detected inthe linear mode; that is why most ToF instruments can be used inboth modes.
In a quadratic field reflectron the potential plates are arranged insuch way, that the same focusing point and the same reflector voltagecan be used for measurements of a wide mass / charge range in oneshot. Thus the voltage has not to be stepped up; no signals are lost atthe seams of a stitched mass spectrum.
Post source decay (PSD):
In the field-free drift region of the mass analyzer a part of the pep-tides become fragmented, mainly by collision with background gas.These metastable fragments have the same velocity as their parentions and would arrive at a linear detector at the same time. However,because the lighter fragments have smaller energy, in a reflectron theywill turn back at an earlier time and will be accelerated back earlierthan the larger fragments.
As fragmentation occurs at the peptide bonds, the pattern showsion series, whose masses differ by the sizes of the respective aminoacids. In this way sequence information is obtained (Kaufmann et al.1994). Also PTMs are detected.
Because the peptides are only singly charged, this fragmentation isrelatively rare; it is difficult to control.
CAF derivatisation (Chemically assisted fragmentation)
By chemical derivatisation of the tryptic peptides the fragmentationcan be enhanced. One example is the method developed by Keough etal. (1999): A sulfonic acid group is added to the N-terminus, whichcauses a proton on the C-terminus to balance the negative chargecoming from the low pK value. With MALDI the peptide will thengain a second proton from the matrix, which can bounce along thepeptide backbone and initiate enhanced fragmentation. In this waystrong fragment signals are obtained in the mass spectrum. As a sec-ond feature of this method the modified N-termini are not detected,because they contain a negative and a positive charge; they are neutraland will not be returned by the ion mirror. Only the C-terminal frag-ments are detected. These spectra are very easy to read out for aminoacid sequencing and detection of phosphorylation sites.
For analysing PSD data, a peptide is selected with an ion gate at theentrance to the flight tube. In a quadratic field reflectron the resolu-tion of the fragment peaks is constant over the complete mass rangemaking it very useful for PSD analysis.
In Fig. 55 a PSD spectrum of a derivatised peptide separated in aquadratic field reflectron MALDI ToF is shown.
113
The reflector reduces thesensitivity.
Anderson UN, Colburn AW,Makarov AA, Raptakis EN,Reynolds DJ, Derrick PJ,Davis SC, Hoffman AD andThomson S. Rev Sci Instrum 69(1998) 1650–1660.
Note: the vacuum in a MALDIToF is ca. 10–6 Torr. Thismeans, that there are still somegas molecules left, which cancollide with peptide ions.
Kaufmann R, Kirsch D,Spengler B. Int J Mass Spec-trom Ion Processes 131 (1994)355–385.
Keough T, Youngquist RS,Lacey MP. Proc Natl Acad SciUSA. 96 (1999) 7131–7136.This modification increases thefragmentation rate andprovides clearer PSD spectra.
Only one spectrum has to beacquired to obtain a completePSD ion series.

6 Proteome Analysis
Electrospray ionization
Here the supernatant of the tryptic digest is pressed through a metalcapillary or a capillary with metal coating – for instance a cell injec-tion needle – at high potential. The spray of fine highly charged drop-lets is created at atmospheric pressure in the presence of an electricfield. These charged droplets are attracted to the inlet of the massspectrometer, which is hold at lower potential.
Dry gas and heat are applied to the droplets; this causes the solventto evaporate. The droplets decrease in size. Same charges give mutualrepulses, those exceed the force of surface tension, the ions leave thedroplet and are induced through a capillary or an orifice into the vac-uum of the mass analyser (see Fig. 56).
Multiple protonation occurs: even 40 to 60 fold. This makes thecombination with mass analysers possible, which have limited ionsize capabilities like quadrupole mass filters and ion traps.
With nano electrospray 1lL sample liquid can be sprayed for morethan 30 min, which allows extended analysis. Even unseparated pep-tide mixtures can be analysed (Wilm and Mann 1994).
Electrospray mass spectrometers can be coupled on-line to capil-lary electrophoresis and liquid chromatography systems.
114
Fig. 55: A. MALDI ToF spectrum of peptides. B. PSD spectrum of a selectedpeptide (m/z = 1658.45). Derivatisation according to Keough et al. (1999),measurement with a quadratic field reflectron. With kind permission fromAmersham Pharmacia Biotech, Uppsala, Sweden.
Frequently also the term API(atmospheric pressure ioniza-tion) is used.
Wilm M, Mann M. Int J MassSpectrom Ion Proc. 136 (1994)167–180.

6.6 Protein spot identification
Comparison of ESI – MALDI ion sources
Electrospray spectrograms are more complex to evaluate than MALDIspectrograms, because multiply charged ions are produced. Withelectrospray there are usually more peptides ionized than withMALDI, leading to higher coverage. Electrospray ionization is verymild, proteins with intact tertiary structures and even noncovalentprotein complexes can be analysed, the signals can be made quantita-tive. ESI can be combined with more possible mass analysers, includ-ing tandem mass spectrometry (MS/MS or MSn). Mass spectra gener-ated by ESI methods can provide quantitative information; this is notpossible with MALDI.
Tandem mass spectrometry
For structural analysis the peptides are selected with a first mass analy-sis, actively fragmented by collision-induced dissociation (CID) withargon or helium under low-energy conditions; these fragments aremeasured with a second mass analysis. This can, for instance, bedone by using an ion trap: The ions are captured a three-dimensionalquadrupolar field and “stored” for a certain time (0.1 to 10 ms). It isfilled with a low amount of Helium gas to reduce the initial entrancespeed of the ions and to allow CID. The ions are ejected from the iontrap in the sequence of their masses either by continuously raisingthe AC voltage or by the application of multipolar fields.
115
quadrupolemetal-coatedglass capillary
detector(multiplier)
“spray”
opening:
1 - 2 mµ
++
+
+
+
+
+
++
++
+
+
+
++
++
++
++
++
++
+++
+
+ +
+
+
+
vacuum
orifice
100 µm∅
solvents
heated N2
accV
chargeddroplets
taylorcones
ions
+
ESI Ion Source Mass Analyser
Fig. 56: Schematic drawing of electrospray ionization. Different kinds of massanalysers can be employed, including tandem mass analysers for structuralanalysis.
MALDI can be employed forhigh throughput and auto-mated applications for ca. 200proteins per day, ESI is used formore thorough investigationsfor 10 to 20 proteins per day.
With an ion trap system furtherfragmentation of the fragments(MSn) for PTM analysis can becarried out.
6 Proteome Analysis
Sequence information: Different ions are produced by fragmentation:y-ions with intact C-terminus and b-ions with intact N-terminus (Roep-storff and Fohlmann, 1984). The evaluation software is checking themeasured mass differences of the fragments against the masses of theamino acids; it suggests possible y- and b-ion series, and finally theamino acid sequence. Even though glutamine and lysine (M = 128), aswell as leucine and isoleucine (M = 113) have identical masses, themethod can be used for de novo sequencing (Wilm et al. 1996).
Post-translational modification analysis: Phosphorylation and acetyla-tion can be identified with the help of the software, but in many casesdifferential enzymatic treatment and repeated analysis has to be per-formed, like for the case of glycosylations (Mørtz et al. 1996).
At the high end there are FT-ICR (Fourier transform – Ion cyclo-tron resonance) mass spectrometers based on the work of Comisarowand Marshall (1974), which reach a resolution of 106 . They can beconnected to MALDI and ESI ion sources, and allow identification ofproteins even in complex peptide mixtures.
More comprehensive information on mass spectrometry of pep-tides is found in the following books:Siuzdak G. The expanding role of mass spectrometry for biotechnology. MCC
Press, San Diego (2003).Chapman JR Ed. Mass spectrometry of proteins and peptides. Methods in molec-
ular biology. Vol 146. Humana Press, Totowa (2000).
6.6.2Peptide mass fingerprinting
With mass spectrometry such accurate peptide sizes are measured,that the results can be compared to those which are mathematicallyderived from the genome databases: The triplets from the DNAsequence are theoretically translated into an amino acid sequence,the peptide sizes are predicted using the knowledge of the preferredcleavage motifs of the enzyme used in the practical experiment.Fig. 57 shows a diagram of protein identification with peptide massfingerprinting.
Prior to digestion, the buffer components and SDS are washed outfrom the gel piece, the cysteins are modified with vinylpyridine oriodoacetamide in order to cancel out different oxidation forms.
Peptide mass fingerprinting is usually performed using a MALDIToF (see page 111), because this ionization produces only singlycharged peptides – this makes evaluation of the mass spectrum easier.Three to four peptides measured with high mass accuracy (ca. 25ppm) are sufficient to identify a protein (Berndt et al. 1999).
116
Roepstorff P, Fohlmann J.Biomed Mass Spectrom. 11(1984) 601.Wilm M, Shevchenko A,Houthaeve T, Breit S, Schwei-gerer L, Fotsis T, Mann M.Nature 379 (1996) 466–469.
Mørtz E, Saraneva T, Haebel S,Julkunen I, Roepstorff P.Electrophoresis 17 (1996)925–931.
Comisarow MB, Marshall AG.Chem Phys Letters. 25 (1974)282–283.The limitations of such instru-ments are mainly thepurchasing price and the exper-tise of the operator.
Chemical (CnBr) or enzymaticcleavage methods areemployed. A “well defined”procedure is required. Mostlytrypsin is used, which cleaves apolypeptide after each arginineand lysine.
This is a multistep procedureincluding several times drying,in order to get the reactantsand the enzyme into the gel byrehydration.
Note: In a MALDI ToF spectro-gram always some of thepeptides are missing.Berndt P, Hobohm U,Langen H. Electrophoresis 20

6.6 Protein spot identification
With the accuracy and the resolution needed, different isotopicpeaks of one peptide are resolved, because in nature exists a certaindistribution of 12C and 13C isotopes (100 : 1). For PMF search themonoisotopic peak containing only the most common isotope 12C isused.
Peptide mass finger printing is the easiest and fastest method toidentify proteins. However, in 20 to 40 % of the cases the search soft-ware does not find a match, or the match is uncertain or not plausi-ble. This can be caused by several reasons, for instance: wrong predic-tions of the open reading frames from the genomic database,sequence errors in the genomic database, mutations, PTMs, etc.Those spots have to be further analysed with post source decay forsequence information, which will help to identify ca 10 % more pro-teins.
When this does not give a result, the sample has to be submitted totandem mass spectrometry to obtain more detailed structural infor-mation: a larger part of the amino acid sequence or the post-transla-tional modification.
117
genomic database:DNA sequence
theoretical gene product:amino acid sequence
protein database
theoreticalproteolytic peptides
peptide database
Match ? !
“ ” translationin silico
“ ” digestionin silico
DIPGHGQEVLIRLFKGHPETLEKFDKFKHLK
SEDEMKASEDLKKHGATVLTALGGILKKKGH
HEAEIKPLAQSHATKHKIPVKYLEFISECII
VLQS
“ ” digestion /elution of peptidesin vitro
peptidemass spectrum
2-D gelspot cutting
Practical Experiment Database Search
m/z
TTGCATGCCTGAGGTCGACTCTAGAGGATCCCCGGGTACCGAGCTCGAATTCGTAATCATGTCATAGCTGTTTCCTGTGTGAAATTG
peptide masses:
2,735.22582,657.78932,534.53991,983.91411,875.2567
theoretical masses:
2,735.2256
2,657.7896
2,593.9785
2,534.5397
2,395.6702
1,983.9147
1,875.2561
DIPGHGQEVLIR
LFKGHPETLEK
KIHGQEVPLR
FDKFKHLK
TEGFHVPR
SEDEMK
ASEDLK
m/z
Fig. 57: Peptide mass fingerprinting. Thepeptide masses of the digested protein arecompared to the theoretical masses of peptides,which are mathematically derived from the genomic database.
(1999) 3521–3526.
Also protein mixtures – forinstance more than one proteinin one spot – have to beanalysed with MS/MS.

6 Proteome Analysis
6.6.3Protein characterization
Structural data have mostly been acquired with ESI tandem mass spec-trometers (see page 114 f.). The – usually short – amino acid sequencecan be read out from the mass spectrum of the fragmented peptides.With this information the search software can browse the EST(expressed sequence tag) databases. In this way protein identificationis performed with higher confidence than with the peptide masssearch alone.
This technique is more complicated to handle, mostly because elec-trospray ionization produces multiply charged ions, which make themass spectra very complex.
Also information on post-translational modifications can be extractedfrom the collision induced dissociation (CID) mass spectra, forinstance phosphorylation. The peptide mixture is measured beforeand after treatment with phosphatase; the distance of the resultingshift of the peptide peak is measured.
New developed MALDI-ToF instruments together with new deriva-tisation chemistry allow structural analysis of peptides with postsource decay (see page 113). This makes protein identification andcharacterization much easier: Only one instrument is required, itneeds just a few more laser shots to acquire the PSD data than pre-paring a sample for ESI.
However, MALDI ToF data do not provide a complete coverage ofpeptides. Thus, for de novo sequencing and intensive PTM analysisESI tandem mass spectrometers are needed.
6.7Bioinformatics
Proteome analysis is highly depending on bioinformatics tools. Theyare necessary from protein spot identification and characterization tothe statistical analysis of the large data sets produced by the highthroughput proteome studies.
Protein and peptide mass spectra can mostly not be manually evalu-ated. Particularly the multiple charged ESI peak patterns need decon-volution algorithms.
The mass spectrometric measurements need to be correlated withprotein and genome sequences. In-silico translations and digestionshave to be performed. Missed cleavage sites must be taken inaccount. Advanced database search programs include plausibility andsignificance checks for protein identification as a quality control. Thisis particularly important for the automation of protein identification.
118
This is just one example forPTM identification; others arepublished in the relevantliterature.
The quality of database searchresults is obviously highlydependent on the softwareemployed.
6.8 Functional proteomics
The software must convert fragment ion series into amino acidsequences, and search the EST databases. Modified amino acids andmany other post-translational modifications can be already detectedand characterized without further in-vitro experiments.
Raw data must be stored in an organized way; administration ofanalysis results in databases is required. Appropriate visualizationand interpretation tools are needed as well.
Finally, biological information must be extracted from these com-plex data, which is probably the most complicated job for bioinfor-matics.
6.8Functional proteomics
The drawback of the proteomics analysis procedure described so faris, that information on three-dimensional folding of the proteins, pro-tein-protein complexes etc., which are important for the function of aprotein, are destroyed by denaturation of the samples during the anal-ysis. Native multiple analysis for the screening of proteins is not pos-sible.
Therefore the following strategy is pursued:At first target proteins are identified, characterized and correlated
with “protein families”. Once some structural information areknown, smaller subsets of proteins are analysed with milder separa-tion and measuring techniques: for instance, some proteins arefished out of a cell lysate with affinity chromatography and then pro-teins with intact tertiary structure, or protein-protein complexes areanalysed after electrospray ionization (see reviews by Lamond andMann, 1997, and Pandey and Mann, 2000).
119
Lamond AI, Mann M. TrendsCell Biol. 7 (1997)139–142.Pandey A, Mann M. Nature405 (2000) 837–846.