Embed Size (px)
Citation preview
molecules
Article
Insight of Saffron Proteome by Gel-Electrophoresis
Gianluca Paredi 1, Samanta Raboni 1, Francesco Marchesani 1, Stella A. Ordoudi 2,Maria Z. Tsimidou 2 and Andrea Mozzarelli 1,3,4,*
1 Department of Pharmacy, Interdepartment Center SITEIA.PARMA, University of Parma, Parma 43124, Italy;[email protected] (G.P.); [email protected] (S.R.);[email protected] (F.M.)
2 Laboratory of Food Chemistry and Technology, School of Chemistry, Aristotle University of Thessaloniki,Thessaloniki 54124, Greece; [email protected] (S.A.O.); [email protected] (M.Z.T.)
3 National Institute of Biostructures and Biosystems, Rome 00136, Italy4 Institute of Biophysics, CNR, Pisa 56124, Italy* Correspondence: [email protected]; Tel.: +39-0521-905-138
Academic Editor: Derek J. McPheeReceived: 16 December 2015 ; Accepted: 26 January 2016 ; Published: 29 January 2016
Abstract: Saffron is a spice comprised of the dried stigmas and styles of Crocus sativus L. flowersand, since it is very expensive, it is frequently adulterated. So far, proteomic tools have never beenapplied to characterize the proteome of saffron or identify possible cases of fraud. In this study,1D-Gel Electrophoresis was carried out to characterize the protein profile of (i) fresh stigmas andstyles of the plant; (ii) dried stigmas and styles from different geographical origins (Spanish, Italian,Greek and Iranian) that had been stored for various periods of time after their processing; and (iii)two common plant adulterants, dried petals of Carthamus tinctorius L. and dried fruits of Gardeniajasminoides Ellis. A selective protein extraction protocol was applied to avoid interference from coloredsaffron metabolites, such as crocins, during electrophoretic analyses of saffron. We succeeded inseparating and assigning the molecular weights to more than 20 proteins. In spite of the unavailabilityof the genome of saffron, we were able to identify five proteins by Peptide Mass Fingerprinting:phosphoenolpyruvate carboxylase 3, heat shock cognate 70 KDa protein, crocetin glucosyltransferase 2,α-1,4-glucan-protein synthase and glyceraldehydes-3-phosphate dehydrogenase-2. Our findingsindicate that (i) few bands are present in all saffron samples independently of origin and storagetime, with amounts that significantly vary among samples and (ii) aging during saffron storage isassociated with a reduction in the number of detectable bands, suggesting that proteases are stillactive. The protein pattern of saffron was quite distinct from those of two common adulterants, suchas the dried petals of Carthamus tinctorius and the dried fruits of Gardenia jasminoides indicating thatproteomic analyses could be exploited for detecting possible frauds.
Keywords: saffron; Crocus sativus L.; proteomics; adulteration; Gardenia jasminoides; Carthamustinctorius L.
1. Introduction
Saffron is a spice comprised of the dried stigmas and styles of Crocus sativus L., a perennial plantbelonging to the Iridaceae family. Crocus sativus L. is a sterile triploid species with the completegenome not yet being determined. However, several investigations are ongoing towards this goal [1–4]as well as studies aimed at unveiling pathways leading to the formation of key metabolites [5].
Saffron is presently produced in Asia (Iran, India, Afghanistan), Europe (Greece, Spain, Italy,France, Austria), and Africa (Morocco). The spice is derived from the three-branch styles of theC. sativus L. flowers after drying. The latter procedure is carried out in various ways, depending onthe country and local traditional practices, typically for Spanish saffron at 70 ˝C for half an hour, for
Molecules 2016, 21, 167; doi:10.3390/molecules21020167 www.mdpi.com/journal/molecules
Molecules 2016, 21, 167 2 of 12
Italian saffron at 45 ˝C for several hours and for Greek production at controlled room temperaturefor 12–24 h [6]. The drying causes a loss in weight of about 20%, protein degradation and chemicaltransformations. The resulting product contains more than 150 different chemical entities that are atthe basis of the very appreciated culinary properties as well as the many claims of beneficial healtheffects, most of them related with in vivo antioxidant properties [7] including neuropathologies [8],cancer [9], depression [10], cardiopathies [11] and macular degeneration [12].
Saffron quality is associated with crocins that provide the typical yellow color, picrocrocin thatconfers a bitter taste, and safranal that causes a characteristic aroma. Crocins are water-soluble andbelong to the carotenoids [13–15]. The most abundant crocin is trans-di-(β-D-gentiobiosyl) crocetin,that contains two dicarboxylic acid moieties esterified with gentiobiose. Picrocrocin is a terpene, verysoluble in water and in alcoholic solutions, formed after the oxidative degradation of zeaxanthin [15].Safranal is generated during stigma drying due to the hydrolysis of picrocrocin and is the majorvolatile compound, not very soluble in water but more soluble in alcoholic solutions [16]. Since saffronis the most expensive spice in the world, many different frauds and adulterations have been detected,including dyes, flower fruits or petals, and even colored meat [17–20].
Proteomics aims at the mapping of proteins in biological samples. Proteomic approachesare used for a wide range of applications, from biomarker identification [21,22] to food qualityevaluation [23,24]. Different methods are applied that are either gel-based or gel-free, consistingof mono and bidimensional electrophoresis coupled to mass spectrometry and LC-mass spectrometry.In the present work, the analytical power of proteomic analyses is exploited for the initialcharacterization of saffron protein profile. Previous proteomics investigations of saffron were aimedat detecting proteins that bind crocins [25] and proteins associated with saffron embryogenic andnon-embryogenic calli [26]. Here, we specifically compared (i) the proteome of fresh stigmas andstyles with those of dried ones and stored for different periods of time; (ii) the proteome of saffronobtained from Spain, Italy, Greece and Iran; and (iii) the proteome of saffron with respect to that ofGardenia jasminoides fruits and Carthamus tinctorius L. petals, two commonly used adulterants. Proteinscontained in saffron were identified by peptide mass fingerprint analysis. Overall, the present study isthe first step towards the development of a comprehensive saffron proteome database, integrated withother omic and chemical data.
2. Results and Discussion
To our knowledge, this study is the first attempt of exploiting proteomic tools for the completedetermination of saffron proteome. However, 1D-PAGE gel analysis of saffron stigmas and styles isnot straightforward as the analysis of other food products and biological fluids due to the presence ofhigh amount of interfering metabolites, such as the colored crocins. The dyes and other metabolitesseverely interfere with protein migration, both in isoelectrofocusing and SDS-PAGE experiments. Forthis reason, a tailored procedure for protein extraction from saffron stigmas and styles was developed(see Experimental Design). Only 1D-SDS-PAGE analyses were reproducibly carried out. In spite ofthese limitations, significant results were obtained and are reported below, opening the ways to furtherinvestigations on saffron proteome.
2.1. Comparison of Protein Patterns for Fresh and Dried Stigmas and Styles of C. sativus L. flowers
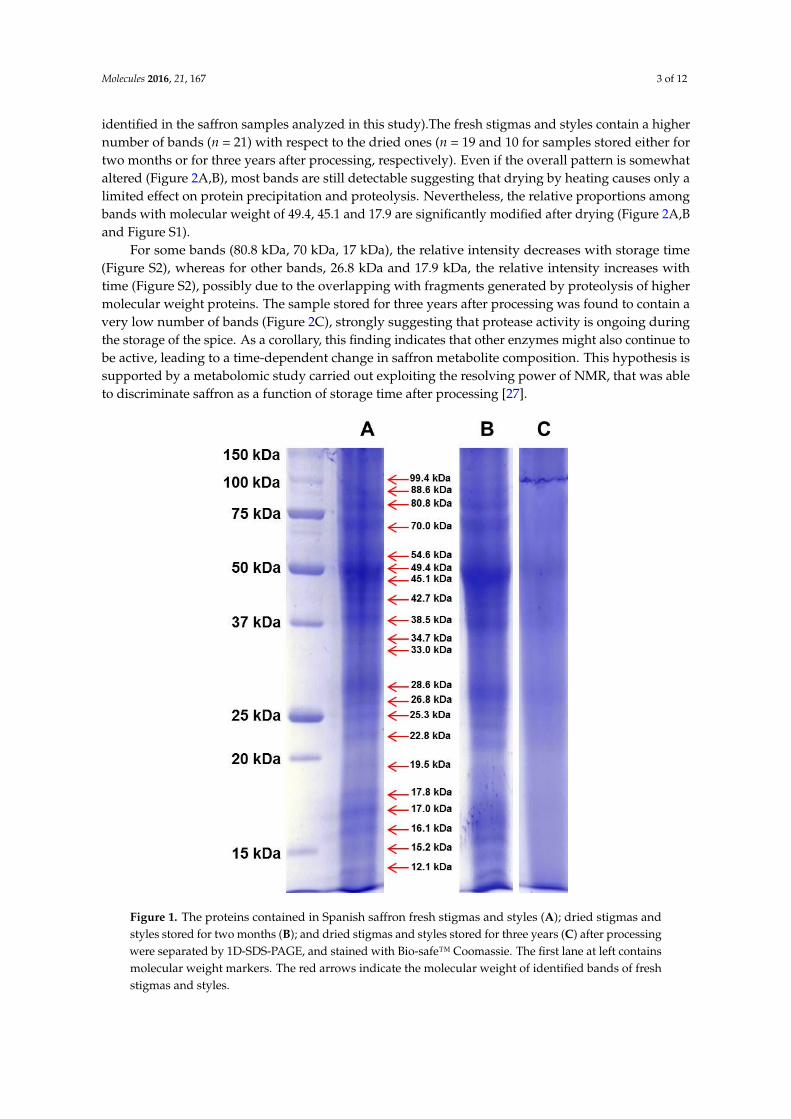
Proteins contained in fresh stigmas and styles of Crocus sativus L. flowers, and dried stigmasand styles, stored either for about two months or for more than three years after processing, wereseparated by 1D-SDS-PAGE (Figure 1). These materials were of the same geographical origin in Spaincorresponding to the PDO product “Azafran de La Mancha”.
As stated before, colored metabolites at high levels interfere with protein migration in 1D-PAGEresulting in a significant background noise. However, a robust gel image analysis, carried out withImage Lab™ software, allowed to identify several bands, as shown in a representative case in Figure S1.The pattern of identified bands is shown in Figure 2 (Table S1 shows the molecular weight of all bands
Molecules 2016, 21, 167 3 of 12
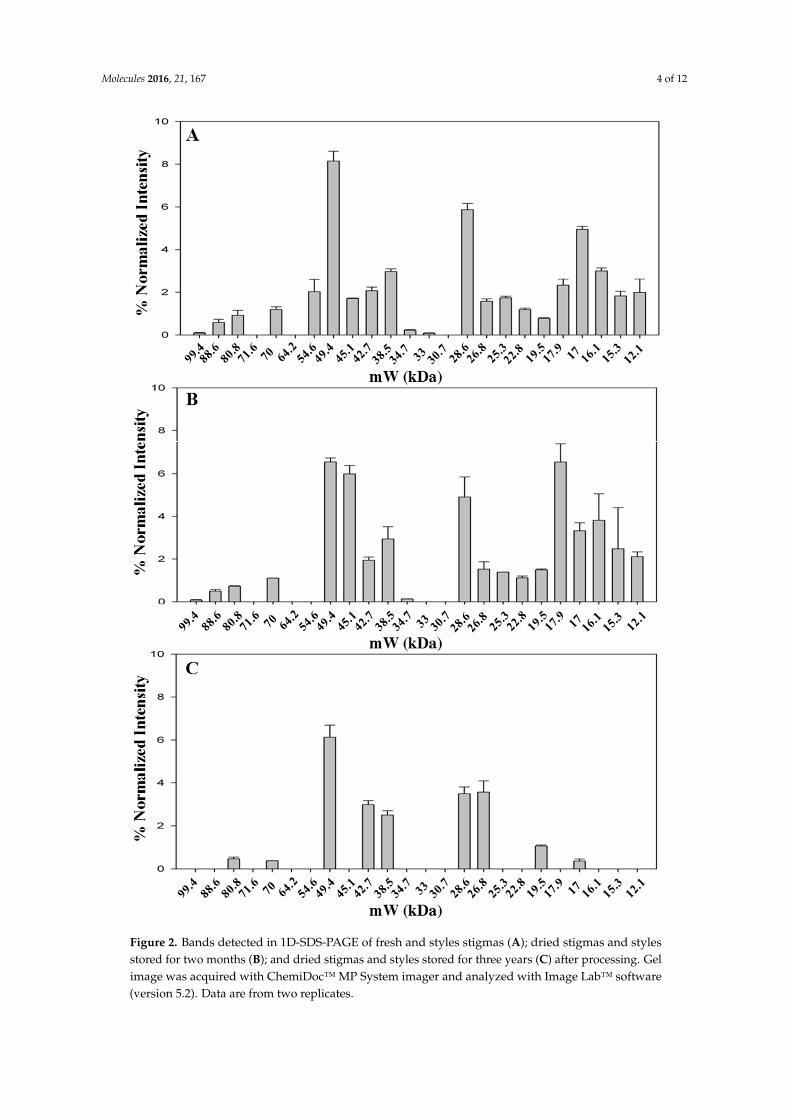
identified in the saffron samples analyzed in this study).The fresh stigmas and styles contain a highernumber of bands (n = 21) with respect to the dried ones (n = 19 and 10 for samples stored either fortwo months or for three years after processing, respectively). Even if the overall pattern is somewhataltered (Figure 2A,B), most bands are still detectable suggesting that drying by heating causes only alimited effect on protein precipitation and proteolysis. Nevertheless, the relative proportions amongbands with molecular weight of 49.4, 45.1 and 17.9 are significantly modified after drying (Figure 2A,Band Figure S1).
For some bands (80.8 kDa, 70 kDa, 17 kDa), the relative intensity decreases with storage time(Figure S2), whereas for other bands, 26.8 kDa and 17.9 kDa, the relative intensity increases withtime (Figure S2), possibly due to the overlapping with fragments generated by proteolysis of highermolecular weight proteins. The sample stored for three years after processing was found to contain avery low number of bands (Figure 2C), strongly suggesting that protease activity is ongoing duringthe storage of the spice. As a corollary, this finding indicates that other enzymes might also continue tobe active, leading to a time-dependent change in saffron metabolite composition. This hypothesis issupported by a metabolomic study carried out exploiting the resolving power of NMR, that was ableto discriminate saffron as a function of storage time after processing [27].
Molecules 2016, 21, 167 3 of 12
stored either for two months or for three years after processing, respectively). Even if the overall pattern is somewhat altered (Figure 2A,B), most bands are still detectable suggesting that drying by heating causes only a limited effect on protein precipitation and proteolysis. Nevertheless, the relative proportions among bands with molecular weight of 49.4, 45.1 and 17.9 are significantly modified after drying (Figure 2A,B and Figure S1).
For some bands (80.8 kDa, 70 kDa, 17 kDa), the relative intensity decreases with storage time (Figure S2), whereas for other bands, 26.8 kDa and 17.9 kDa, the relative intensity increases with time (Figure S2), possibly due to the overlapping with fragments generated by proteolysis of higher molecular weight proteins. The sample stored for three years after processing was found to contain a very low number of bands (Figure 2C), strongly suggesting that protease activity is ongoing during the storage of the spice. As a corollary, this finding indicates that other enzymes might also continue to be active, leading to a time-dependent change in saffron metabolite composition. This hypothesis is supported by a metabolomic study carried out exploiting the resolving power of NMR, that was able to discriminate saffron as a function of storage time after processing [27].
Figure 1. The proteins contained in Spanish saffron fresh stigmas and styles (A); dried stigmas and styles stored for two months (B); and dried stigmas and styles stored for three years (C) after processing were separated by 1D-SDS-PAGE, and stained with Bio-safe™ Coomassie. The first lane at left contains molecular weight markers. The red arrows indicate the molecular weight of identified bands of fresh stigmas and styles.
Figure 1. The proteins contained in Spanish saffron fresh stigmas and styles (A); dried stigmas andstyles stored for two months (B); and dried stigmas and styles stored for three years (C) after processingwere separated by 1D-SDS-PAGE, and stained with Bio-safe™ Coomassie. The first lane at left containsmolecular weight markers. The red arrows indicate the molecular weight of identified bands of freshstigmas and styles.
Molecules 2016, 21, 167 4 of 12Molecules 2016, 21, 167 4 of 12
Figure 2. Bands detected in 1D-SDS-PAGE of fresh and styles stigmas (A); dried stigmas and styles stored for two months (B); and dried stigmas and styles stored for three years (C) after processing. Gel image was acquired with ChemiDoc™ MP System imager and analyzed with Image Lab™ software (version 5.2). Data are from two replicates.
Figure 2. Bands detected in 1D-SDS-PAGE of fresh and styles stigmas (A); dried stigmas and stylesstored for two months (B); and dried stigmas and styles stored for three years (C) after processing. Gelimage was acquired with ChemiDoc™ MP System imager and analyzed with Image Lab™ software(version 5.2). Data are from two replicates.
Molecules 2016, 21, 167 5 of 12
2.2. Identification of Proteins Contained in Fresh and Dried Stigmas and Styles
Among the bands that were detected in the sample of fresh stigmas and styles, fourteen weresubjected to peptide mass fingerprint (PMF) analysis using a MALDI TOF/TOF mass spectrometerin order to identify the corresponding proteins. Saffron protein identification poses some problemsbecause the genome of Crocus sativus L. stigmas and styles has not been determined yet and the ESTsequence database is not accessible). We interrogated Swiss-prot Viridiplantae database using Mascotserver (Matrix Science) as search engine. The resulting matches and coverages are reported in Table 1whereas amino acid sequences of identified peptides are reported in Table S2. Only five proteinswere identified with sufficient confidence. These are: (i) band at 99.4 kDa, present in very lowquantity, identified as phosphoenolpyruvate carboxylase-3, an enzyme involved in glycogenesis;(ii) band at 70 kDa, identified as heat shock cognate 70 kDa protein, a protein that plays a crucialrole in protecting plants against abiotic stress [28]; (iii) band at 49.4 kDa, present in large quantityin all analyzed samples, identified as crocetin glucosyltransferase-2, the enzyme that catalyzes theesterification of a carbonyl group of crocetin or crocetin monoglycosyl ester and formation of crocins,key components of saffron [29,30]; (iv) band at 42.7 kDa, identified as α-1,4-glucan-protein synthase,an enzyme involved in the synthesis of cell wall polysaccharide [31]; (v) band at 38.5 kDa, identifiedas glyceraldhyde-3-phosphate dehydrogenase-2, the enzyme carrying out the only oxidative step inglycolysis, but also involved in other moonlighting activities [32].
Table 1. Identity of proteins contained in the sample of fresh C. sativus L. stigmas and styles.
Band Protein Uniprot Score a Coverage %
99.4 kDa Phosphoenol piruvate carboxylase 3 CAPP3_ARATH 83 1370 kDa Heat shock cognate 70 kDa protein HSP7C_PETHY 65 29
49.4 kDa Crocetin glucosyl transferase-2 GLT2_CROSA 78 3042.7 kDa A-1,4 glucan-protein synthase UPTG_PEA 64 22
38.5 kDa Glyceraldehyde-3-phosphatedehydrogenase-2 b G3PC_ORYSJ 85 34
a Mascot score. All values are above the threshold of confidence; b Identification was further confirmed byMALDI MS/MS.
2.3. Comparison of Protein Pattern for Saffron from Different Origins
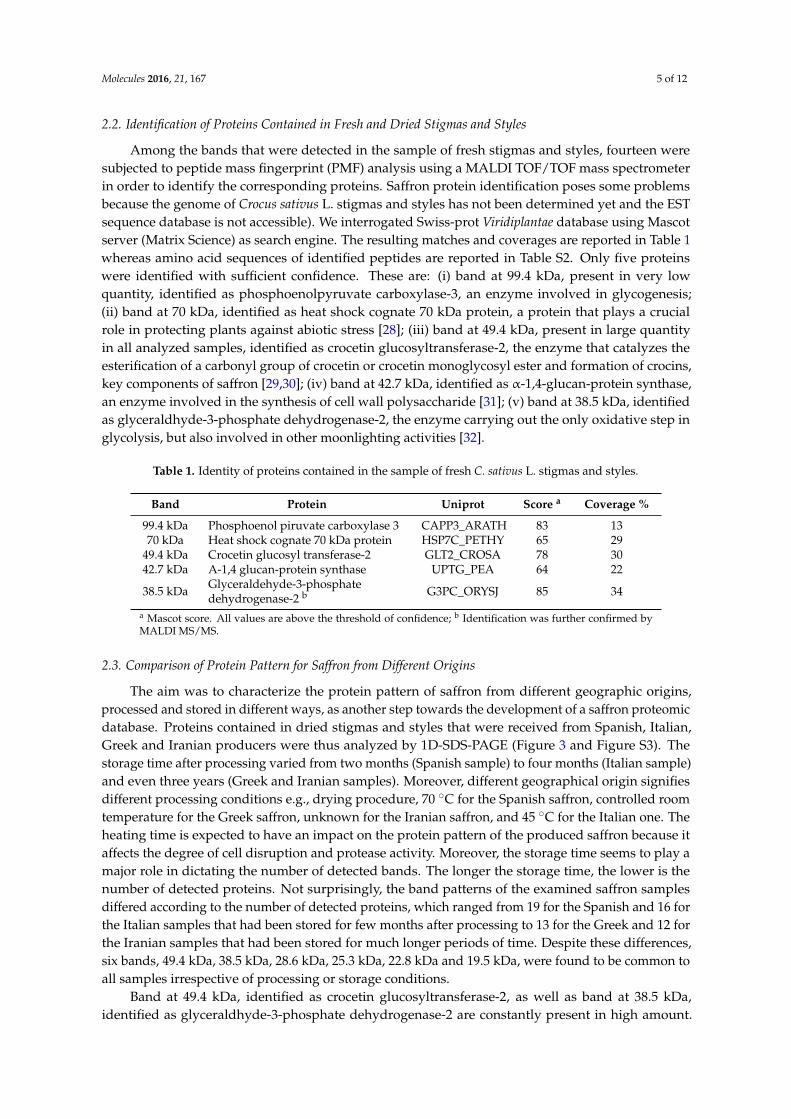
The aim was to characterize the protein pattern of saffron from different geographic origins,processed and stored in different ways, as another step towards the development of a saffron proteomicdatabase. Proteins contained in dried stigmas and styles that were received from Spanish, Italian,Greek and Iranian producers were thus analyzed by 1D-SDS-PAGE (Figure 3 and Figure S3). Thestorage time after processing varied from two months (Spanish sample) to four months (Italian sample)and even three years (Greek and Iranian samples). Moreover, different geographical origin signifiesdifferent processing conditions e.g., drying procedure, 70 ˝C for the Spanish saffron, controlled roomtemperature for the Greek saffron, unknown for the Iranian saffron, and 45 ˝C for the Italian one. Theheating time is expected to have an impact on the protein pattern of the produced saffron because itaffects the degree of cell disruption and protease activity. Moreover, the storage time seems to play amajor role in dictating the number of detected bands. The longer the storage time, the lower is thenumber of detected proteins. Not surprisingly, the band patterns of the examined saffron samplesdiffered according to the number of detected proteins, which ranged from 19 for the Spanish and 16 forthe Italian samples that had been stored for few months after processing to 13 for the Greek and 12 forthe Iranian samples that had been stored for much longer periods of time. Despite these differences,six bands, 49.4 kDa, 38.5 kDa, 28.6 kDa, 25.3 kDa, 22.8 kDa and 19.5 kDa, were found to be common toall samples irrespective of processing or storage conditions.
Band at 49.4 kDa, identified as crocetin glucosyltransferase-2, as well as band at 38.5 kDa,identified as glyceraldhyde-3-phosphate dehydrogenase-2 are constantly present in high amount.
Molecules 2016, 21, 167 6 of 12
Finally, band at 28.6 kDa was significantly less intense in the Italian sample compared to the otherthree samples. A comparison of the intensity for all bands is reported in Figure S4.
Molecules 2016, 21, 167 6 of 12
Band at 49.4 kDa, identified as crocetin glucosyltransferase-2, as well as band at 38.5 kDa, identified as glyceraldhyde-3-phosphate dehydrogenase-2 are constantly present in high amount. Finally, band at 28.6 kDa was significantly less intense in the Italian sample compared to the other three samples. A comparison of the intensity for all bands is reported in Figure S4.
Figure 3. Bands detected in 1D-SDS-PAGE of saffron samples from Spain (A); Italy (B); Greece (C) and Iran (D). Gel image was acquired with ChemiDoc™ MP System imager and analyzed with Image Lab™ software (version 5.2). Data are from two replicates.
2.4. Diversity of Protein Pattern within Saffron Samples Originated from Italy
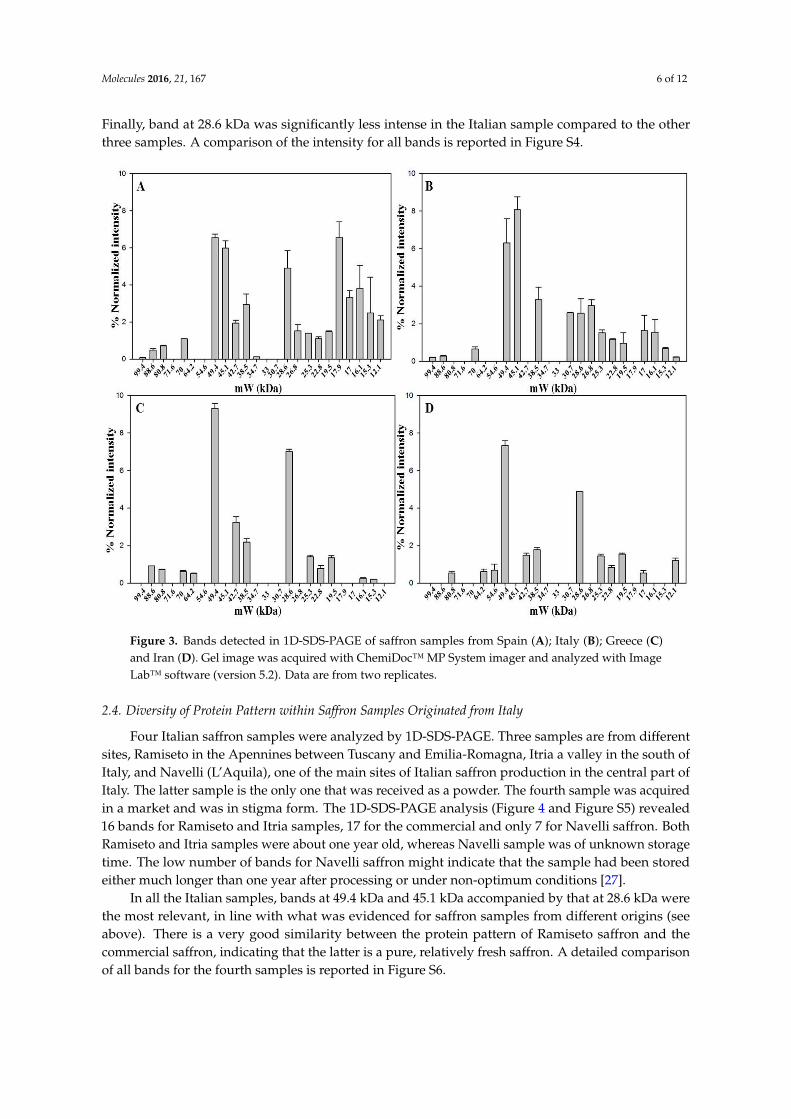
Four Italian saffron samples were analyzed by 1D-SDS-PAGE. Three samples are from different sites, Ramiseto in the Apennines between Tuscany and Emilia-Romagna, Itria a valley in the south of Italy, and Navelli (L’Aquila), one of the main sites of Italian saffron production in the central part of Italy. The latter sample is the only one that was received as a powder. The fourth sample was acquired in a market and was in stigma form. The 1D-SDS-PAGE analysis (Figure 4 and Figure S5) revealed 16 bands for Ramiseto and Itria samples, 17 for the commercial and only 7 for Navelli saffron. Both Ramiseto and Itria samples were about one year old, whereas Navelli sample was of unknown storage time. The low number of bands for Navelli saffron might indicate that the sample had been stored either much longer than one year after processing or under non-optimum conditions [27].
In all the Italian samples, bands at 49.4 kDa and 45.1 kDa accompanied by that at 28.6 kDa were the most relevant, in line with what was evidenced for saffron samples from different origins (see above). There is a very good similarity between the protein pattern of Ramiseto saffron and the commercial saffron, indicating that the latter is a pure, relatively fresh saffron. A detailed comparison of all bands for the fourth samples is reported in Figure S6.
Figure 3. Bands detected in 1D-SDS-PAGE of saffron samples from Spain (A); Italy (B); Greece (C)and Iran (D). Gel image was acquired with ChemiDoc™ MP System imager and analyzed with ImageLab™ software (version 5.2). Data are from two replicates.
2.4. Diversity of Protein Pattern within Saffron Samples Originated from Italy
Four Italian saffron samples were analyzed by 1D-SDS-PAGE. Three samples are from differentsites, Ramiseto in the Apennines between Tuscany and Emilia-Romagna, Itria a valley in the south ofItaly, and Navelli (L’Aquila), one of the main sites of Italian saffron production in the central part ofItaly. The latter sample is the only one that was received as a powder. The fourth sample was acquiredin a market and was in stigma form. The 1D-SDS-PAGE analysis (Figure 4 and Figure S5) revealed16 bands for Ramiseto and Itria samples, 17 for the commercial and only 7 for Navelli saffron. BothRamiseto and Itria samples were about one year old, whereas Navelli sample was of unknown storagetime. The low number of bands for Navelli saffron might indicate that the sample had been storedeither much longer than one year after processing or under non-optimum conditions [27].
In all the Italian samples, bands at 49.4 kDa and 45.1 kDa accompanied by that at 28.6 kDa werethe most relevant, in line with what was evidenced for saffron samples from different origins (seeabove). There is a very good similarity between the protein pattern of Ramiseto saffron and thecommercial saffron, indicating that the latter is a pure, relatively fresh saffron. A detailed comparisonof all bands for the fourth samples is reported in Figure S6.
Molecules 2016, 21, 167 7 of 12Molecules 2016, 21, 167 7 of 12
Figure 4. Bands detected in 1D-SDS-PAGE of dried saffron from Ramiseto (A); Itria (B); market (C) and Navelli (D). Gel image was acquired with ChemiDoc™ MP System imager and analyzed with Image Lab™ software (version 5.2). Data are from two replicates.
2.5. Comparison of Protein Pattern of Saffron and Its Most Common Plant Adulterants
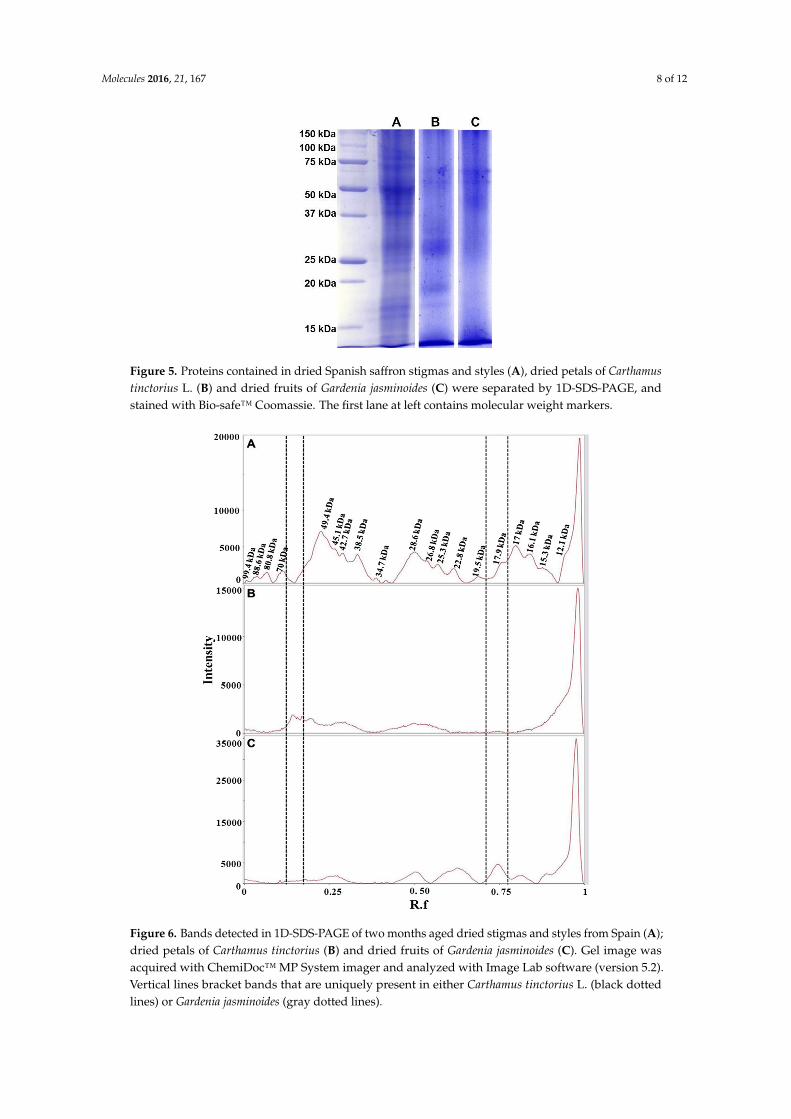
Saffron has a very high price, ranging from 12 to 20 Euro/g, depending on the quality category as defined by ISO3632-1 classes [33,34]. Therefore, not surprisingly, adulteration of saffron is a very common practice. Reported adulterants are dyes, flower stigmas or petals, colored meat, salts [17–20]. Petals of dried flowers of Carthamus tinctorius L. possess a dye, carthamin, that is a quinone-like compound, with coloring and flavoring reminiscent of saffron. Powder from the dried fruits of Gardenia jasminoides is also used for adulteration as they contain crocins, one of components of saffron. Dried petals of Carthamus tinctorius L. flowers and dried fruits of Gardenia jasminoides were used in this study as two of the most representative cases of saffron adulterants. The dried material from these plants was treated in the same way as saffron stigmas and styles in order to extract proteins (see Experimental Section). 1D-SDS-PAGE protein separation was then carried out as shown in Figure 5.
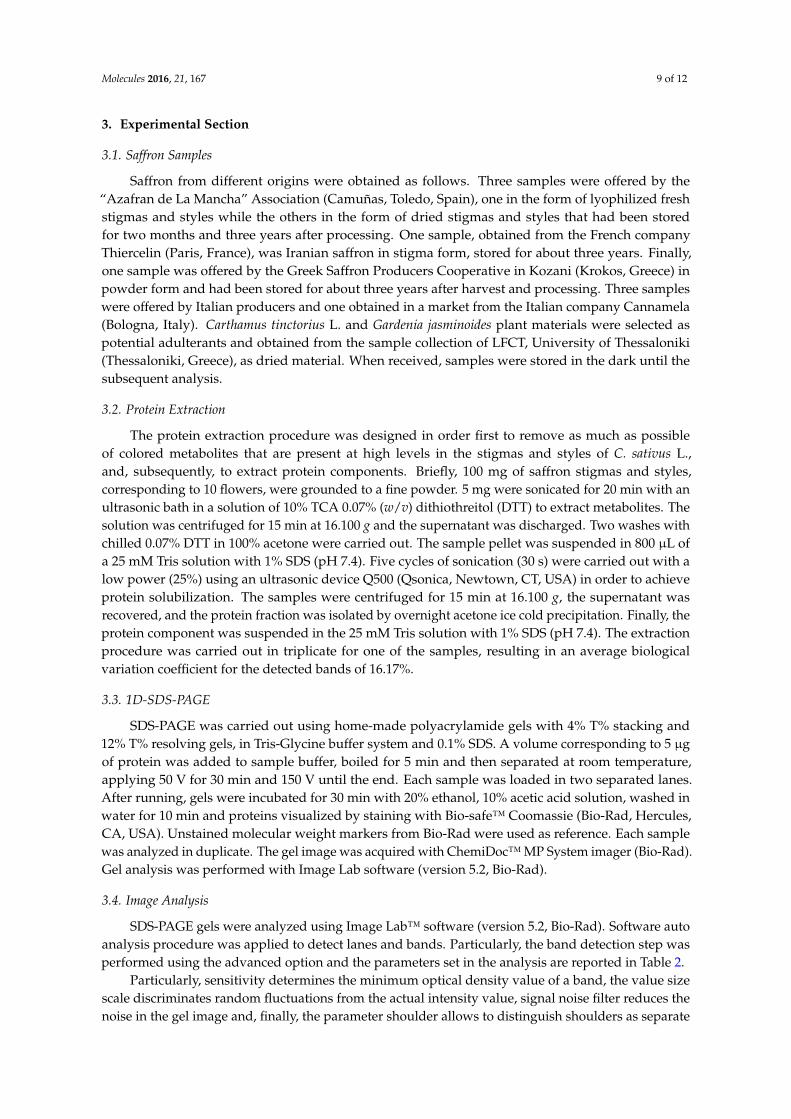
From the comparison of the protein profiles (Figure 6), obtained by gel imaging and analysis, it is evident that protein composition of the plant material from both Carthamus tinctorius and Gardenia jasminoides is very different from protein composition of saffron stigmas and styles. The bands at Rf of about 0.15 and 0.75 are most probably typical of Carthamus tinctorius L. petals and of Gardenia jasminoides fruits, respectively. Both bands were not detected in saffron. Taking into account that the amount of added adulterants in saffron is usually very high in order to be profitable (typically >5% w/w), our findings indicate the potential of a proteomic analysis in the detection of saffron adulteration with material from these plants.
Figure 4. Bands detected in 1D-SDS-PAGE of dried saffron from Ramiseto (A); Itria (B); market (C) andNavelli (D). Gel image was acquired with ChemiDoc™ MP System imager and analyzed with ImageLab™ software (version 5.2). Data are from two replicates.
2.5. Comparison of Protein Pattern of Saffron and Its Most Common Plant Adulterants
Saffron has a very high price, ranging from 12 to 20 Euro/g, depending on the quality categoryas defined by ISO3632-1 classes [33,34]. Therefore, not surprisingly, adulteration of saffron is a verycommon practice. Reported adulterants are dyes, flower stigmas or petals, colored meat, salts [17–20].Petals of dried flowers of Carthamus tinctorius L. possess a dye, carthamin, that is a quinone-likecompound, with coloring and flavoring reminiscent of saffron. Powder from the dried fruits ofGardenia jasminoides is also used for adulteration as they contain crocins, one of components of saffron.Dried petals of Carthamus tinctorius L. flowers and dried fruits of Gardenia jasminoides were used inthis study as two of the most representative cases of saffron adulterants. The dried material fromthese plants was treated in the same way as saffron stigmas and styles in order to extract proteins (seeExperimental Section). 1D-SDS-PAGE protein separation was then carried out as shown in Figure 5.
From the comparison of the protein profiles (Figure 6), obtained by gel imaging and analysis, it isevident that protein composition of the plant material from both Carthamus tinctorius and Gardeniajasminoides is very different from protein composition of saffron stigmas and styles. The bands atRf of about 0.15 and 0.75 are most probably typical of Carthamus tinctorius L. petals and of Gardeniajasminoides fruits, respectively. Both bands were not detected in saffron. Taking into account that theamount of added adulterants in saffron is usually very high in order to be profitable (typically >5%w/w), our findings indicate the potential of a proteomic analysis in the detection of saffron adulterationwith material from these plants.
Molecules 2016, 21, 167 8 of 12
Molecules 2016, 21, 167 8 of 12
Figure 5. Proteins contained in dried Spanish saffron stigmas and styles (A), dried petals of Carthamus tinctorius L. (B) and dried fruits of Gardenia jasminoides (C) were separated by 1D-SDS-PAGE, and stained with Bio-safe™ Coomassie. The first lane at left contains molecular weight markers.
Figure 6. Bands detected in 1D-SDS-PAGE of two months aged dried stigmas and styles from Spain (A); dried petals of Carthamus tinctorius (B) and dried fruits of Gardenia jasminoides (C). Gel image was acquired with ChemiDoc™ MP System imager and analyzed with Image Lab software (version 5.2). Vertical lines bracket bands that are uniquely present in either Carthamus tinctorius L. (black dotted lines) or Gardenia jasminoides (gray dotted lines).
Figure 5. Proteins contained in dried Spanish saffron stigmas and styles (A), dried petals of Carthamustinctorius L. (B) and dried fruits of Gardenia jasminoides (C) were separated by 1D-SDS-PAGE, andstained with Bio-safe™ Coomassie. The first lane at left contains molecular weight markers.
Molecules 2016, 21, 167 8 of 12
Figure 5. Proteins contained in dried Spanish saffron stigmas and styles (A), dried petals of Carthamus tinctorius L. (B) and dried fruits of Gardenia jasminoides (C) were separated by 1D-SDS-PAGE, and stained with Bio-safe™ Coomassie. The first lane at left contains molecular weight markers.
Figure 6. Bands detected in 1D-SDS-PAGE of two months aged dried stigmas and styles from Spain (A); dried petals of Carthamus tinctorius (B) and dried fruits of Gardenia jasminoides (C). Gel image was acquired with ChemiDoc™ MP System imager and analyzed with Image Lab software (version 5.2). Vertical lines bracket bands that are uniquely present in either Carthamus tinctorius L. (black dotted lines) or Gardenia jasminoides (gray dotted lines).
Figure 6. Bands detected in 1D-SDS-PAGE of two months aged dried stigmas and styles from Spain (A);dried petals of Carthamus tinctorius (B) and dried fruits of Gardenia jasminoides (C). Gel image wasacquired with ChemiDoc™ MP System imager and analyzed with Image Lab software (version 5.2).Vertical lines bracket bands that are uniquely present in either Carthamus tinctorius L. (black dottedlines) or Gardenia jasminoides (gray dotted lines).
Molecules 2016, 21, 167 9 of 12
3. Experimental Section
3.1. Saffron Samples
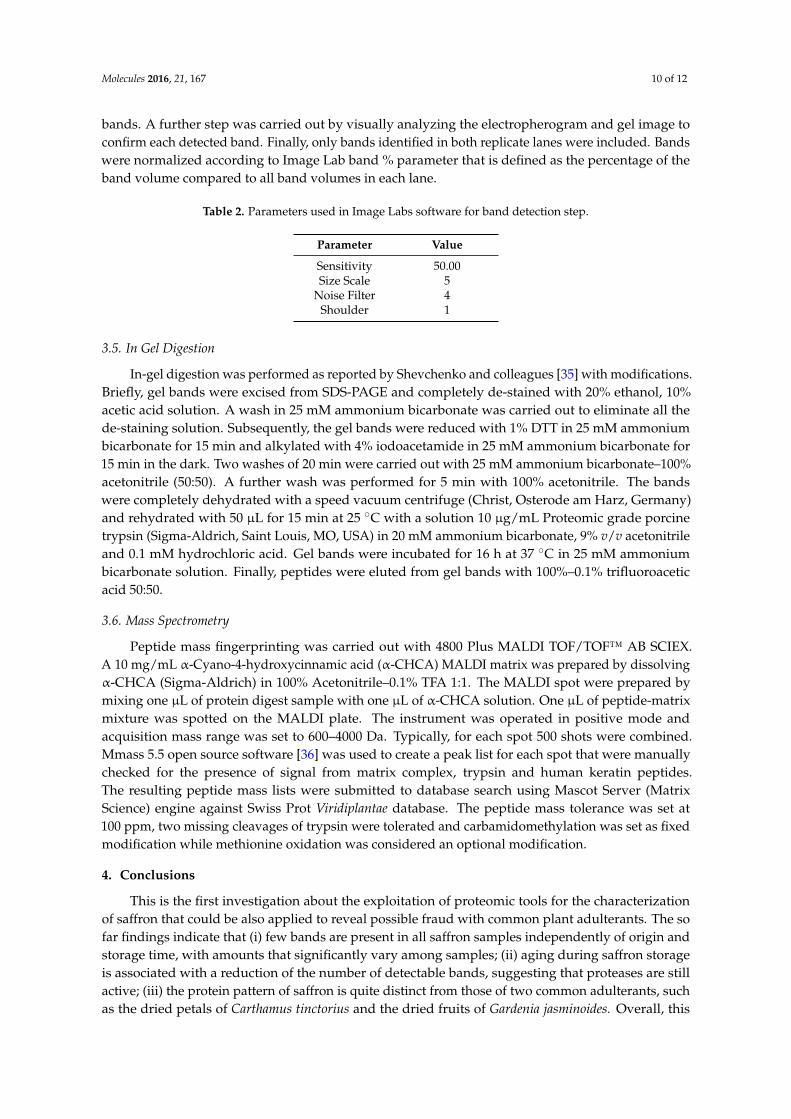
Saffron from different origins were obtained as follows. Three samples were offered by the“Azafran de La Mancha” Association (Camuñas, Toledo, Spain), one in the form of lyophilized freshstigmas and styles while the others in the form of dried stigmas and styles that had been storedfor two months and three years after processing. One sample, obtained from the French companyThiercelin (Paris, France), was Iranian saffron in stigma form, stored for about three years. Finally,one sample was offered by the Greek Saffron Producers Cooperative in Kozani (Krokos, Greece) inpowder form and had been stored for about three years after harvest and processing. Three sampleswere offered by Italian producers and one obtained in a market from the Italian company Cannamela(Bologna, Italy). Carthamus tinctorius L. and Gardenia jasminoides plant materials were selected aspotential adulterants and obtained from the sample collection of LFCT, University of Thessaloniki(Thessaloniki, Greece), as dried material. When received, samples were stored in the dark until thesubsequent analysis.
3.2. Protein Extraction
The protein extraction procedure was designed in order first to remove as much as possibleof colored metabolites that are present at high levels in the stigmas and styles of C. sativus L.,and, subsequently, to extract protein components. Briefly, 100 mg of saffron stigmas and styles,corresponding to 10 flowers, were grounded to a fine powder. 5 mg were sonicated for 20 min with anultrasonic bath in a solution of 10% TCA 0.07% (w/v) dithiothreitol (DTT) to extract metabolites. Thesolution was centrifuged for 15 min at 16.100 g and the supernatant was discharged. Two washes withchilled 0.07% DTT in 100% acetone were carried out. The sample pellet was suspended in 800 µL ofa 25 mM Tris solution with 1% SDS (pH 7.4). Five cycles of sonication (30 s) were carried out with alow power (25%) using an ultrasonic device Q500 (Qsonica, Newtown, CT, USA) in order to achieveprotein solubilization. The samples were centrifuged for 15 min at 16.100 g, the supernatant wasrecovered, and the protein fraction was isolated by overnight acetone ice cold precipitation. Finally, theprotein component was suspended in the 25 mM Tris solution with 1% SDS (pH 7.4). The extractionprocedure was carried out in triplicate for one of the samples, resulting in an average biologicalvariation coefficient for the detected bands of 16.17%.
3.3. 1D-SDS-PAGE
SDS-PAGE was carried out using home-made polyacrylamide gels with 4% T% stacking and12% T% resolving gels, in Tris-Glycine buffer system and 0.1% SDS. A volume corresponding to 5 µgof protein was added to sample buffer, boiled for 5 min and then separated at room temperature,applying 50 V for 30 min and 150 V until the end. Each sample was loaded in two separated lanes.After running, gels were incubated for 30 min with 20% ethanol, 10% acetic acid solution, washed inwater for 10 min and proteins visualized by staining with Bio-safe™ Coomassie (Bio-Rad, Hercules,CA, USA). Unstained molecular weight markers from Bio-Rad were used as reference. Each samplewas analyzed in duplicate. The gel image was acquired with ChemiDoc™ MP System imager (Bio-Rad).Gel analysis was performed with Image Lab software (version 5.2, Bio-Rad).
3.4. Image Analysis
SDS-PAGE gels were analyzed using Image Lab™ software (version 5.2, Bio-Rad). Software autoanalysis procedure was applied to detect lanes and bands. Particularly, the band detection step wasperformed using the advanced option and the parameters set in the analysis are reported in Table 2.
Particularly, sensitivity determines the minimum optical density value of a band, the value sizescale discriminates random fluctuations from the actual intensity value, signal noise filter reduces thenoise in the gel image and, finally, the parameter shoulder allows to distinguish shoulders as separate
Molecules 2016, 21, 167 10 of 12
bands. A further step was carried out by visually analyzing the electropherogram and gel image toconfirm each detected band. Finally, only bands identified in both replicate lanes were included. Bandswere normalized according to Image Lab band % parameter that is defined as the percentage of theband volume compared to all band volumes in each lane.
Table 2. Parameters used in Image Labs software for band detection step.
Parameter Value
Sensitivity 50.00Size Scale 5
Noise Filter 4Shoulder 1
3.5. In Gel Digestion
In-gel digestion was performed as reported by Shevchenko and colleagues [35] with modifications.Briefly, gel bands were excised from SDS-PAGE and completely de-stained with 20% ethanol, 10%acetic acid solution. A wash in 25 mM ammonium bicarbonate was carried out to eliminate all thede-staining solution. Subsequently, the gel bands were reduced with 1% DTT in 25 mM ammoniumbicarbonate for 15 min and alkylated with 4% iodoacetamide in 25 mM ammonium bicarbonate for15 min in the dark. Two washes of 20 min were carried out with 25 mM ammonium bicarbonate–100%acetonitrile (50:50). A further wash was performed for 5 min with 100% acetonitrile. The bandswere completely dehydrated with a speed vacuum centrifuge (Christ, Osterode am Harz, Germany)and rehydrated with 50 µL for 15 min at 25 ˝C with a solution 10 µg/mL Proteomic grade porcinetrypsin (Sigma-Aldrich, Saint Louis, MO, USA) in 20 mM ammonium bicarbonate, 9% v/v acetonitrileand 0.1 mM hydrochloric acid. Gel bands were incubated for 16 h at 37 ˝C in 25 mM ammoniumbicarbonate solution. Finally, peptides were eluted from gel bands with 100%–0.1% trifluoroaceticacid 50:50.
3.6. Mass Spectrometry
Peptide mass fingerprinting was carried out with 4800 Plus MALDI TOF/TOF™ AB SCIEX.A 10 mg/mL α-Cyano-4-hydroxycinnamic acid (α-CHCA) MALDI matrix was prepared by dissolvingα-CHCA (Sigma-Aldrich) in 100% Acetonitrile–0.1% TFA 1:1. The MALDI spot were prepared bymixing one µL of protein digest sample with one µL of α-CHCA solution. One µL of peptide-matrixmixture was spotted on the MALDI plate. The instrument was operated in positive mode andacquisition mass range was set to 600–4000 Da. Typically, for each spot 500 shots were combined.Mmass 5.5 open source software [36] was used to create a peak list for each spot that were manuallychecked for the presence of signal from matrix complex, trypsin and human keratin peptides.The resulting peptide mass lists were submitted to database search using Mascot Server (MatrixScience) engine against Swiss Prot Viridiplantae database. The peptide mass tolerance was set at100 ppm, two missing cleavages of trypsin were tolerated and carbamidomethylation was set as fixedmodification while methionine oxidation was considered an optional modification.
4. Conclusions
This is the first investigation about the exploitation of proteomic tools for the characterizationof saffron that could be also applied to reveal possible fraud with common plant adulterants. The sofar findings indicate that (i) few bands are present in all saffron samples independently of origin andstorage time, with amounts that significantly vary among samples; (ii) aging during saffron storageis associated with a reduction of the number of detectable bands, suggesting that proteases are stillactive; (iii) the protein pattern of saffron is quite distinct from those of two common adulterants, suchas the dried petals of Carthamus tinctorius and the dried fruits of Gardenia jasminoides. Overall, this
Molecules 2016, 21, 167 11 of 12
study represents a step towards the development of a proteomic database containing the profile andidentity of saffron proteins as well as the protein profile of common plant adulterants.
Supplementary Materials: Supplementary materials can be accessed at: http://www.mdpi.com/1420-3049/21/2/167/s1.
Acknowledgments: This work is part of activities carried out within the European COST ACTION FA1101SAFFRONOMICS (2011–2015).
Author Contributions: Gianluca Paredi, Andrea Mozzarelli and Maria Z. Tsimidou conceived and designed theexperiments; Gianluca Paredi, Francesco Marchesani and Samanta Raboni performed the experiments; GianlucaParedi and Stella A. Ordoudi analyzed the data; Stella A. Ordoudi and Maria Z. Tsimidou contributed materials;Gianluca Paredi and Andrea Mozzarelli wrote the paper.
Conflicts of Interest: The authors declare no conflict of interest.
References
1. Busconi, M.; Colli, L.; Sánchez, R.A.; Santaella, M.; de-Los-Mozos Pascual, M.; Santana, O.; Roldán, M.;Fernández, J.-A. AFLP and MS-AFLP analysis of the variation within saffron crocus (Crocus sativus L.)germplasm. PLoS ONE 2015, 10, e0123434. [CrossRef] [PubMed]
2. Gismondi, A.; Fanali, F.; Labarga, J.; Caiola, M.; Canini, A. Crocus sativus L. genomics and different DNAbarcode applications. Plant Syst. Evol. 2013, 299, 1859–1863. [CrossRef]
3. D’Agostino, N.; Pizzichini, D.; Chiusano, M.L.; Giuliano, G. An EST database from saffron stigmas.BMC Plant Biol. 2007, 7. [CrossRef] [PubMed]
4. Fernández, J.-A.; Santana, O.; Guardiola, J.-L.; Molina, R.-V.; Heslop-Harrison, P.; Borbely, G.; Branca, F.;Argento, S.; Maloupa, E.; Talou, T. The world saffron and crocus collection: Strategies for establishment,management, characterisation and utilisation. Genet. Resour. Crop Evol. 2011, 58, 125–137. [CrossRef]
5. Frusciante, S.; Diretto, G.; Bruno, M.; Ferrante, P.; Pietrella, M.; Prado-Cabrero, A.; Rubio-Moraga, A.; Beyer, P.;Gomez-Gomez, L.; Al-Babili, S.; et al. Novel carotenoid cleavage dioxygenase catalyzes the first dedicatedstep in saffron crocin biosynthesis. Proc. Natl. Acad. Sci. USA 2014, 111, 12246–12251. [CrossRef] [PubMed]
6. Alonso, G.L.; Arghittu, A.; Astraka, K.; Betza, T.; Camba, E.; Canadas Sanchez, W.; Carmona Delgado, M.;Cilloco, M.T.; Corona, J.; Curreli, M.; et al. White Book, Saffron in Europe. Problems and Strategies for Improvingthe Quality and Strengthen Competitiveness; ALEXANDROS-LLC: Athens, Greece, 2007.
7. Kyriakoudi, A.; Ordoudi, S.A.; Roldán-Medina, M.; Tsimidou, M.Z. Saffron, a functional spice. Austin J. Nutr.Food Sci. 2015, 3, 1059.
8. Purushothuman, S.; Nandasena, C.; Peoples, C.L.; El Massri, N.; Johnstone, D.M.; Mitrofanis, J.; Stone, J.Saffron pre-treatment offers neuroprotection to nigral and retinal dopaminergic cells of MPTP-treated mice.J. Parkinsons. Dis. 2013, 3, 77–83. [PubMed]
9. Bolhassani, A.; Khavari, A.; Bathaie, S.Z. Saffron and natural carotenoids: Biochemical activities andanti-tumor effects. Biochim. Biophys. Acta 2014, 1845, 20–30. [CrossRef] [PubMed]
10. Ghasemi, T.; Abnous, K.; Vahdati, F.; Mehri, S.; Razavi, B.M.; Hosseinzadeh, H. Antidepressant effect ofcrocus sativus aqueous extract and its effect on CREB, BDNF, and VGF transcript and protein levels in rathippocampus. Drug Res. 2015, 65, 337–343. [CrossRef] [PubMed]
11. Chahine, N.; Hanna, J.; Makhlouf, H.; Duca, L.; Martiny, L.; Chahine, R. Protective effect of saffron extractagainst doxorubicin cardiotoxicity in isolated rabbit heart. Pharm. Biol. 2013, 51, 1564–1571. [CrossRef][PubMed]
12. Bisti, S.; Maccarone, R.; Falsini, B. Saffron and retina: Neuroprotection and pharmacokinetics. Vis. Neurosci.2014, 31, 355–361. [CrossRef] [PubMed]
13. Gregory, M.J.; Menary, R.C.; Davies, N.W. Effect of drying temperature and air flow on the production andretention of secondary metabolites in saffron. J. Agric. Food Chem. 2005, 53, 5969–5975. [CrossRef] [PubMed]
14. Raina, B.L.; Agarwal, S.G.; Bhatia, A.K.; Gaur, G.S. Changes in pigments and volatiles of saffron (Crocussativus L.) during processing and storage. J. Sci. Food Agric. 1996, 71, 27–32. [CrossRef]
15. Alonso, G.L.; Salinas, M.R.; Garijo, J.; SÁNchez-FernÁNdez, M.A. Composition of crocins and picrocrocinfrom spanish saffron (Crocus sativus L.). J. Food Qual. 2001, 24, 219–233. [CrossRef]
16. Alonso GL, R.S.M.; Esteban-Infantes, F.J.; Sanchez-Fernandez, M.A. Determination of safranal from saffron(Crocus sativus L.) by thermal desorption-gas chromatography. J. Agric. Food Chem. 1996, 44, 185–188. [CrossRef]
Molecules 2016, 21, 167 12 of 12
17. Ordoudi, S.; Tsimidou, M. Saffron quality: Effect of agricultural practices, processing and storage.In Production Practices and Quality Assessment of Food Crops Volume 1; Dris, R., Jain, S., Eds.; Springer:Dordrecht, The Netherlands, 2004; pp. 209–260.
18. Sánchez, A.M.; Maggi, L.; Carmona, M.; Alonso, G.L. Authentication of saffron spice Crocus sativus L.In Progress in Authentication of Food and Wine; ACS Publications: Washington, DC, USA, 2011; Volume 1081,pp. 309–331.
19. Hagh-Nazari, S.; Keifi, N. Saffron and various fraud manners in its production and trades. In Acta Hort.(ISHS); ISHS: Leuven, Belgium, 2007; Volume 739, pp. 411–416.
20. Haghighi, B.; Feizy, J.; Kakhki, A. LC determination of adulterated saffron prepared by adding styles coloredwith some natural colorants. Chroma 2007, 66, 325–332. [CrossRef]
21. Davidsson, P.; Sjögren, M. The use of proteomics in biomarker discovery in neurodegenerative diseases.Dis. Markers 2005, 21, 81–92. [CrossRef] [PubMed]
22. Johann, D.J.; McGuigan, M.D.; Patel, A.R.; Tomov, S.; Ross, S.; Conrads, T.P.; Veenstra, T.D.; Fishman, D.A.;Whiteley, G.R.; Petricoin, E.F.; et al. Clinical proteomics and biomarker discovery. Ann. N. Y. Acad. Sci. 2004,1022, 295–305. [CrossRef] [PubMed]
23. Paredi, G.; Sentandreu, M.-A.; Mozzarelli, A.; Fadda, S.; Hollung, K.; de Almeida, A.M. Muscle and meat:New horizons and applications for proteomics on a farm to fork perspective. J. Proteom. 2013, 88, 58–82.[CrossRef] [PubMed]
24. Gašo-Sokac, D.; Kovac, S.; Josic, D. Application of proteomics in food technology and food biotechnology:Process development, quality control and product safety. Food Technol. Biotechol. 2010, 48, 284–295.
25. Hosseinzadeh, H.; Mehri, S.; Heshmati, A.; Ramezani, M.; Sahebkar, A.; Abnous, K. Proteomic screening ofmolecular targets of crocin. Daru J. Pharm. Sci. 2014, 22. [CrossRef] [PubMed]
26. Sharifi, G.; Ebrahimzadeh, H.; Ghareyazie, B.; Gharechahi, J.; Vatankhah, E. Identification of differentiallyaccumulated proteins associated with embryogenic and non-embryogenic calli in saffron (Crocus sativus L.).Proteome Sci. 2012, 10, 1–27. [CrossRef] [PubMed]
27. Ordoudi, S.A.; Cagliani, L.R.; Lalou, S.; Naziri, E.; Tsimidou, M.Z.; Consonni, R. 1H-NMR-basedmetabolomics of saffron reveals markers for its quality deterioration. Food Res. Int. 2015, 70, 1–6. [CrossRef]
28. Wang, W.; Vinocur, B.; Shoseyov, O.; Altman, A. Role of plant heat-shock proteins and molecular chaperonesin the abiotic stress response. Trends Plant Sci. 2004, 9, 244–252. [CrossRef] [PubMed]
29. Moraga, A.R.; Nohales, P.F.; Pérez, J.A.F.; Gómez-Gómez, L. Glucosylation of the saffron apocarotenoidcrocetin by a glucosyltransferase isolated from crocus sativus stigmas. Planta 2004, 219, 955–966. [CrossRef][PubMed]
30. Côté, F.; Cormier, F.; Dufresne, C.; Willemot, C. Properties of a glucosyltransferase involved in crocinsynthesis. Plant Sci. 2000, 153, 55–63. [CrossRef]
31. Rothschild, A.; Tandecarz, J.S. Udp-glucose: Protein transglucosylase in developing maize endosperm.Plant Sci. 1994, 97, 119–127. [CrossRef]
32. Zaffagnini, M.; Morisse, S.; Bedhomme, M.; Marchand, C.H.; Festa, M.; Rouhier, N.; Lemaire, S.D.; Trost, P.Mechanisms of nitrosylation and denitrosylation of cytoplasmic glyceraldehyde-3-phosphate dehydrogenasefrom arabidopsis thaliana. J. Biol. Chem. 2013, 288, 22777–22789. [CrossRef] [PubMed]
33. ISO. International Standard ISO 3632-2: Saffon (Crocus sativus L.) Test Methods; The International Organizationfor Standardization: Geneva, Switzerland, 2010; pp. 1–8.
34. ISO. International Standard ISO 3632-1: Saffron (Crocus sativus L.) Specification; The International Organizationfor Standardization: Geneva, Switzerland, 2011; pp. 1–33.
35. Shevchenko, A.; Tomas, H.; Havli, J.; Olsen, J.V.; Mann, M. In-gel digestion for mass spectrometriccharacterization of proteins and proteomes. Nat. Protoc. 2006, 1, 2856–2860. [CrossRef] [PubMed]
36. Strohalm, M.; Hassman, M.; Košata, B.; Kodícek, M. Mmass data miner: An open source alternative for massspectrometric data analysis. Rapid Commun. Mass Spectrom. 2008, 22, 905–908. [CrossRef] [PubMed]
Sample Availability: Samples of the analyzed compounds are available from the authors.
© 2016 by the authors; licensee MDPI, Basel, Switzerland. This article is an open accessarticle distributed under the terms and conditions of the Creative Commons by Attribution(CC-BY) license (http://creativecommons.org/licenses/by/4.0/).