Embed Size (px)
Citation preview
Fast Analytical-Scale Separations by Capillary Electrophoresis and LiquidChromatography
Robert T. Kennedy,* Igor German, Jonathan E. Thompson, and Steven R. Witowski
Department of Chemistry, University of Florida, Gainesville, Florida 32611-7200
Received February 19, 1999 (Revised Manuscript Received July 15, 1999)
ContentsI. Introduction 3081II. Capillary Electrophoresis 3082
A. Introduction and Theory 3082B. Instrumentation 3084C. Micellar Electrokinetic Chromatography
(MEKC)3092
D. Applications of Rapid CE 3094III. Liquid Chromatography 3109
A. Introduction 3109B. Nonporous and Superficially Porous Particles 3110C. Perfusion Particles 3115D. Capillary Columns 3119E. Monoliths 3119F. Temperature 3122G. Electrochromatography 3123H. Other Applications 3125
IV. Concluding Remarks 3126V. Acknowledgments 3127VI. List of Symbols 3127VII. References 3127
I. Introduction
Separations are generally considered a slow stepin any analytical methodology. HPLC and electro-phoresis, the mainstay of separations of nonvolatilecompounds in the modern laboratory, take anywherefrom tens of minutes to hours to complete dependingupon the complexity of the sample, the desiredinformation, and selectivity available. This timerequirement has limited the types of problems thatseparations can be asked to solve. For instance,separation methods are not typically used in high-throughput analyses or for monitoring applications.The time-consuming nature of separations has drivenmany researchers to investigate methods of improv-ing the speed of separations techniques. In thisreview, we examine recent trends in improving thespeed of liquid-phase analytical-scale separationsbased on chromatography and electrophoresis. Whilethe present review is limited to liquid-phase separa-tions, we note that recent advances have been madein the speed of gas chromatography separations as
well, and this work has recently been reviewedelsewhere. Because many of the technical advancesthat have improved the speed of separations haveoccurred since 1990, our review emphasizes the past9 years.
In developing a review on fast separations, we werefaced with the dilemma of how to define a fastseparation. Our approach was to consider articles inwhich the emphasis was on use of theory andtechnology which were developed specifically to im-prove the speed of separation over conventionalpractice. Conventional practice, while difficult todefine, in HPLC includes separations performed in1-4.6 mm bore by 10-25 cm long columns packedwith 3-5 µm porous particles. Thus, innovations suchas nonporous particles, particle diameters <2 µm,perfused particles, elevated temperature, or opentubular columns and their application are discussed.For electrophoresis, we considered only capillaryelectrophoresis (CE). CE, by its very nature, is“faster” than gel electrophoresis; however, the rapiddevelopment of CE has meant that it would beimpractical to simply review CE relative to gelelectrophoresis. (Furthermore, exhaustive reviews ofCE are available.) Rather, we consider innovationsin CE that led to speed over conventional practice.For CE, conventional practice was defined as separa-tions in columns with 50-100 µm bore and 50-100cm length and electric field (E) < 300 V/cm. Use ofminiaturized systems, rapid and automated injectionschemes, high E, and certain gels and additives areinnovations which can dramatically improve thespeed of the separation and are included here.Microfabricated systems have been extensively uti-lized in achieving fast separations, especially for CE.A separate review on microfabricated systems foranalysis and separation has been commissioned forthis special issue of Chemical Reviews; therefore,while we acknowledge such advances, we limit ourdiscussion of these important techniques relative toother innovations. Further information on microfab-ricated systems can be found in this other review fora more complete picture of fast separation systems.
In addition to descriptions of the technical innova-tions, examples of the applications are included. Wehave emphasized applications which were madequalitatively possible by the improvement in speed.Such examples include on-line in vivo monitoring,using a fast separation as a second-dimension in two-dimensional separations, detection of short-lived spe-
* To whom correspondence should be addressed. E-mail: [email protected].
3081Chem. Rev. 1999, 99, 3081−3131
10.1021/cr980134j CCC: $35.00 © 1999 American Chemical SocietyPublished on Web 09/16/1999
cies such as complexes or proteins in certain confor-mations, and process monitoring. These types ofapplications simply would not be practical withconventional separations conditions.
II. Capillary Electrophoresis
A. Introduction and TheoryIn cases where diffusion is the only source of band
broadening, simple theories for CE show that it ispossible to simultaneously obtain increases in speedand efficiency by increasing the voltage. This prop-erty is illustrated by the following equations formigration time (tmig) and theoretical plates (N)
where v is the analyte velocity, l is the separationlength, L is the total capillary length, V is the voltagedropped across L, µ is the electrophoretic mobility,and D is the diffusion coefficient of the analyte. Theseequations show that tmig is inversely proportional tovoltage while N is proportional to voltage. Theequations also show that separation efficiency isindependent of column length. Thus, as long as thesame voltage is dropped across the separation path,use of shorter columns will yield faster runs with thesame plate counts. This fortuitous situation is quitedifferent from chromatography where increases inspeed by shortening the column or increasing the flowrate result in lower numbers of theoretical plates.
In most cases, electroosmotic flow (EOF) is presentand this changes the above equations to the following
Robert T. Kennedy received his B.S. degree in Chemistry at the Universityof Florida, in 1984, where he performed undergraduate research in physicalorganic chemistry with Bill Dolbier. In 1984 he began his Ph.D. work atthe University of North CarolinasChapel Hill (UNC) in analytical chemistryunder the direction of James W. Jorgenson. His work involved developmentof capillary LC columns and their application to single cell analysis. Aftergraduation in 1988, he began an NSF post-doctoral fellowship with R.Mark Wightman, also at UNC, working in the study of neurotransmissionusing microelectrodes. In 1991 he joined the faculty at the University ofFlorida Chemistry Department where he is now Professor of Chemistryand a member of the UF Brain Institute. His research group is investigatingcapillary separations, confocal microscopy, and amperometry for the studyof neutransmitters and hormones both in vivo and at the single cell level.
Igor German received his B.S. degree in Chemistry from the Universityof Florida in 1996, where he performed undergraduate research withProfessor David Richardson in bioinorganic chemistry. He began in thePh.D. program at UF under the direction of Robert T. Kennedy immediatelyafter graduation. His current research involves development of affinityreagents with capillary electrophoresis and capillary chromatorgraphy fordetermination of trace levels of neuropeptides and hormones. In addition,he is involved in development of the separation-based methods that utilizeaptamers as ligands.
Jonathan E. Thompson was born in Allentown, PA, in 1976. He receivedhis B.S. degree in Chemistry from Troy State University in Alabama in1997. Currently he is working toward his Ph.D. in Analytical Chemistry atthe University of Florida under the direction of Robert. T. Kennedy. Hisresearch involves the rapid separation of neurotransmitters by opticallygated capillary electrophoresis and application to high-throughput analysisand monitoring in the brain of living animals.
Steven R. Witowski received his B.S. degree in Chemistry with a minorin Spanish from Georgia Institute of Technology in 1995. He is currentlyworking toward his Ph.D. at the University of Florida under the directionof Robert T. Kennedy. His research interests concern the use ofmicrodialysis coupled on-line to capillary electrophoresis for the in vivomeasurement of biologically important compounds with high temporalresolution. Areas of focus include applying microdialysis/CE to themeasurement of glutamate and aspartate in rats in the presence ofseizurogenic toxins.
tmig) l/v ) L/Vµ (1)
N ) µV/2D (2)
3082 Chemical Reviews, 1999, Vol. 99, No. 10 Kennedy et al.
where µEOF is the electroosmotic mobility. Theseequations show that higher EOF improves speed andefficiency; however, the improvement in efficiency ismisleading. The presence of EOF moves analytes offthe column faster, allowing less time for diffusionalband broadening and thus higher efficiency; however,since EOF is a nonselective mode of transport, it alsomoves analytes off the column with less time to beseparated by electrophoresis (assuming that analytesare moving in the same direction as the EOF). It ismore instructive to consider the expression for reso-lution (Rs) in the presence of EOF1
where µ1 and µ2 refer to mobilities of two species andµavg is their average. This equation shows thatincreases in EOF will decrease resolution if the flowis in the same direction as the ion mobility and willincrease resolution if flow is in the opposite directionof the ion mobility. Thus, while EOF decreasesanalysis time, its effect on resolution depends on thecharge of the analyte.
The above equations are useful because they showwhat is possible in the limit where diffusion is theonly source of band broadening. In reality, however,several other factors come into play to limit theefficiency as voltages are increased. To consider theseother factors, we begin with the definition of ef-ficiency
where σTot2 is the zone variance due to all sources of
band broadening. In CE, σTot2 can be expressed as
where σ2Diff, σ2
Inj, σ2Det, σ2
Heat, σ2Ads, and σ2
ED are thevariances due to longitudinal diffusion, sample injec-tion, detection, Joule heating, adsorption, and elec-tromigration dispersion (also known as “sampleoverloading”), respectively. When tmig is small, it isdifficult to achieve diffusion-limited efficiency (σ2
Diffdominates in the above equation) unless great careis taken to suppress these other band broadeningeffects. These effects and their suppression will bediscussed below. As will be shown, the primaryconcern is minimizing Joule heat which is typicallyaffected by using small bore capillaries (most fastseparations use capillaries with inner diameter i.d.<10 µm) and low conductivity buffers.
1. Broadening Caused by TemperatureFor high-speed CE separations, we must consider
the effects of Joule heat, which increases withincreasing voltage, on efficiency. Although heat isgenerated uniformly throughout the capillary crosssection, it is only dissipated through the capillarysurface; consequently, a radial temperature gradient
results inside the capillary. The temperature differ-ence between the capillary wall and any radiuswithin the capillary is given by
where ∆T is the temperature difference, rc is theradius of the capillary, λ is the thermal conductivityof the solution, rx is the distance from the capillarywall, and G is the heat generation rate (W/m3). As∆T is proportional to rc
2, it is apparent that the useof small i.d. capillaries will reduce the temperaturegradient. Additionally, the use of small i.d. capillariesincreases the resistivity of the column, giving rise toless current and less heating.
The temperature gradients induced by Joule heatresult in band broadening since many factors whichcontrol electromigration rates, such as viscosity, aretemperature dependent. Electrophoretic mobility ofa species can be altered due to regional viscositychanges in the solvent caused by the temperaturedifferences. Uneven temperature also results inconvection which additionally contributes to bandbroadening. Furthermore, Gas2 has shown that theconcentration of the background electrolyte maychange at sites of jumps in the radial heat fluxyielding a nonuniform separation media and nonuni-form migration rates.
The effect of heating on band broadening has beenquantified in the form of a plate height (H) equationfor CE.3 The term for heating was given as
where E is the electric field strength, µapp is theapparent electrophoretic mobility (µapp ) µEOF + µ),S is the specific conductance, λ is the thermalconductivity of the buffer, τ is the thermal coefficientof the solute mobility, µ is the electrophoretic mobilityof the solute, K1 and K2 are unitless constants withK1 ) 6.5 × 10⁻⁴ and K2 ) 4.34 × 10⁻⁵, and the otherterms have been described above. This equationallows prediction of the limits of voltage for a givenset of parameters before heating begins to alterefficiency.
Minimization of Joule Heat Effects. Equations7 and 8 show that decreasing the column radiusshould allow higher voltages and faster separationsbefore heating degrades the separation. In many ofthe examples that will be given, the fastest separa-tions are generally found to be performed in capil-laries with i.d. of 10 µm or less with electric fields of2-5 kV/cm. As will be discussed below, while de-creasing the column radius is effective at reducingband broadening due to heating, reductions to capil-lary diameters below 50 µm place great demands onthe injection and detection system.
Another approach to combat Joule heating is theuse of low-conductivity electrophoresis buffers. Hjertenet al.4 demonstrated this approach by utilizing high
tmig ) L/(µ + µEOF)V (3)
N ) (µ + µEOF)V/2D (4)
Rs ) 0.177(µ1 - µ2)((V)/(D(µavg + µEOF)))1/2 (5)
N ) tmig2/σTot
2 (6)
σTot2 ) σ2
Diff + σ2Inj + σ2
Det + σ2Heat + σ2
Ads + σ2ED(7)
∆T ) (Grc2/4λ)(1 - (rx
2/rc2)) (8)
Hheating ) (τ2S2µ2/λ2D))((K1E5rc
6/µapp) +
(K2E6rc
8/LD)) (9)
Fast Analytical-Scale Separations by CE and LC Chemical Reviews, 1999, Vol. 99, No. 10 3083
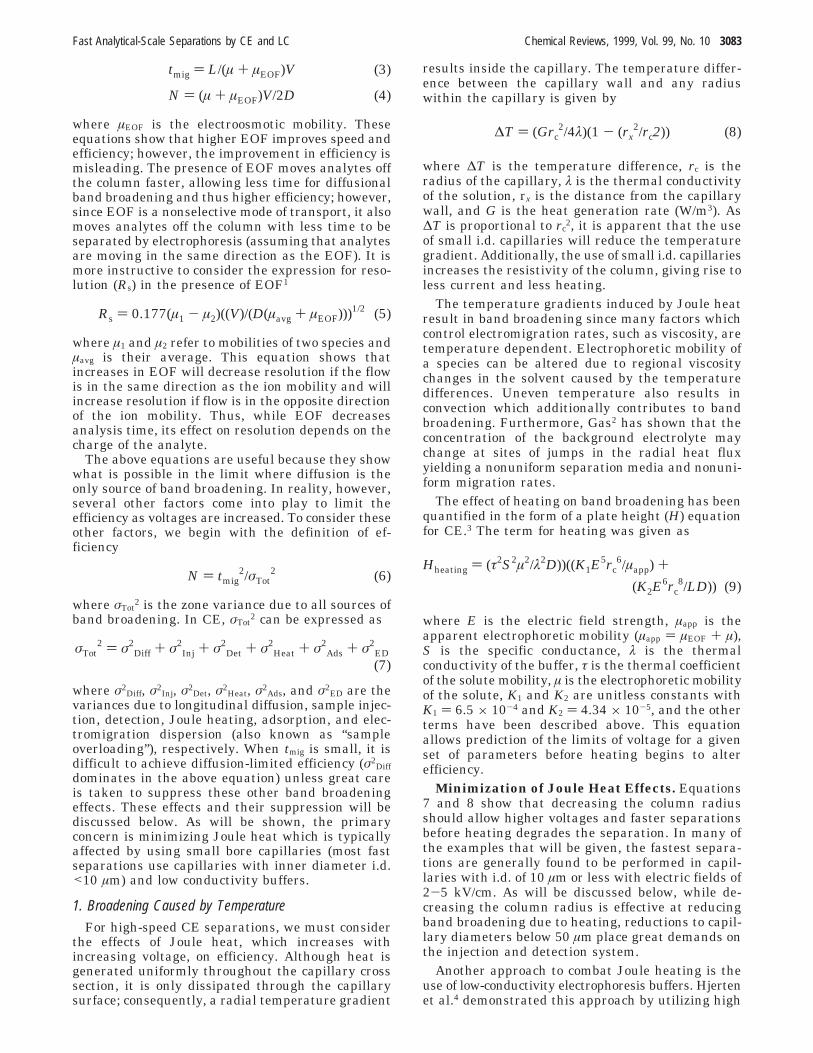
molecular weight buffers with small net charge or anarrow pH range of ampholytes for buffer. Thisapproach is attractive because it requires no specialinstrumental design and therefore is applicable tocommercial CE instruments. Using this approach,several carboxylic acids were separated within 25 sin 50 µm i.d. capillaries as shown in Figure 1. Asshown, no loss in resolution is observed between thelow-field case and the high-field case while analysistime is reduced ∼5-fold.
2. Broadening Caused by AbsorptionAdsorption to the capillary walls results in a
contribution of chromatographic retention and bandbroadening to the electrophoretic separation. As iswell-known from chromatography, increasing thespeed of migration will increase band broadening dueto such nonequilibrium effects. Novotny et al.3 adaptedequations derived by Wieme et al.5 to describe thissource of band broadening in CE as follows
where R is the fractional concentration of free solute,n is the number of molecules per unit volume insidethe tube, R is the fraction of molecules which stickon collision, Z is the number of molecules striking aunit surface area/s, and the other terms are asdefined above. This equation shows that, like thetemperature effect, increasing voltage will increasethis source of band broadening, thus lowering resolu-tion at higher speeds. It is also interesting to considerthat while utilizing small i.d. columns can suppressheating and associated band broadening, they mayalso increase broadening due to adsorptive interac-tions since the capillary surface area-to-volume ratio
is increased in small bore capillaries resulting ingreater chance for adsorption. Other authors,6-10
have also contributed work in modeling solute ad-sorption to the capillary walls. These works havepresented analytical solutions to equations describingelectrophoretic migration in the presence of soluteadsorption, and theoretical simulations based onthese equations have been examined. The limit tospeed in analysis when solute adsorption occurs islargely dependent upon the kinetics of the soluteinteraction with the capillary wall.
Most examples of high-speed separations to dateinvolve small molecules or DNA, possibly becausethese compounds typically do not adsorb strongly tothe capillary wall. Although adsorption of smallmolecules is usually considered inconsequential,comparisons of theory with experimental resultsunder conditions of high E (E > 1000 V/cm) haveshown that some band broadening is not accountedfor by diffusion, injection, or heating, suggesting acontribution due to adsorption for small moleculesunder fast separation conditions.11,12
The adsorption problem is frequently important forpeptides and proteins with pI lower than the migra-tion buffer. A number of methods can be used todecrease adsorption to capillaries,13-19 and imple-mentation of these methods should allow fast separa-tions of proteins as well, although this has yet to bedemonstrated, except in a few isolated incidencesrelated to fast immunoassays.20-24
3. Band Broadening Summary
The band broadening contributions from injection,diffusion, heating, and solute adsorption have beencombined to form a complete plate height equationfor CE3
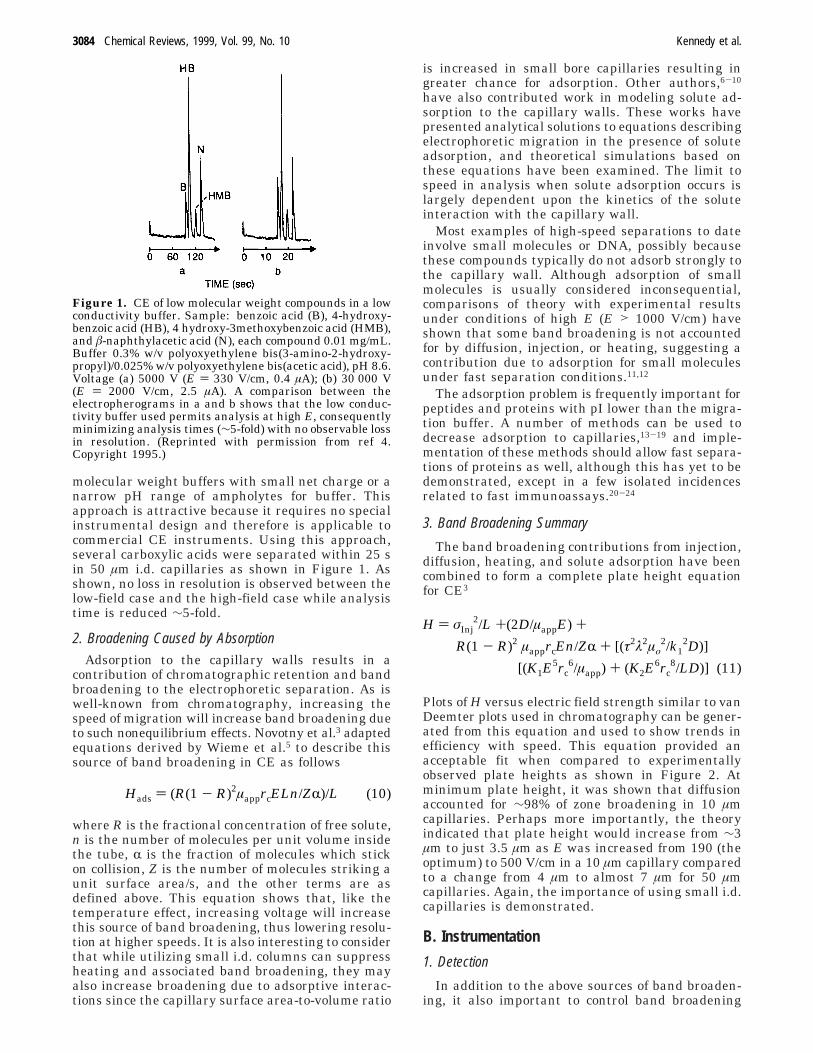
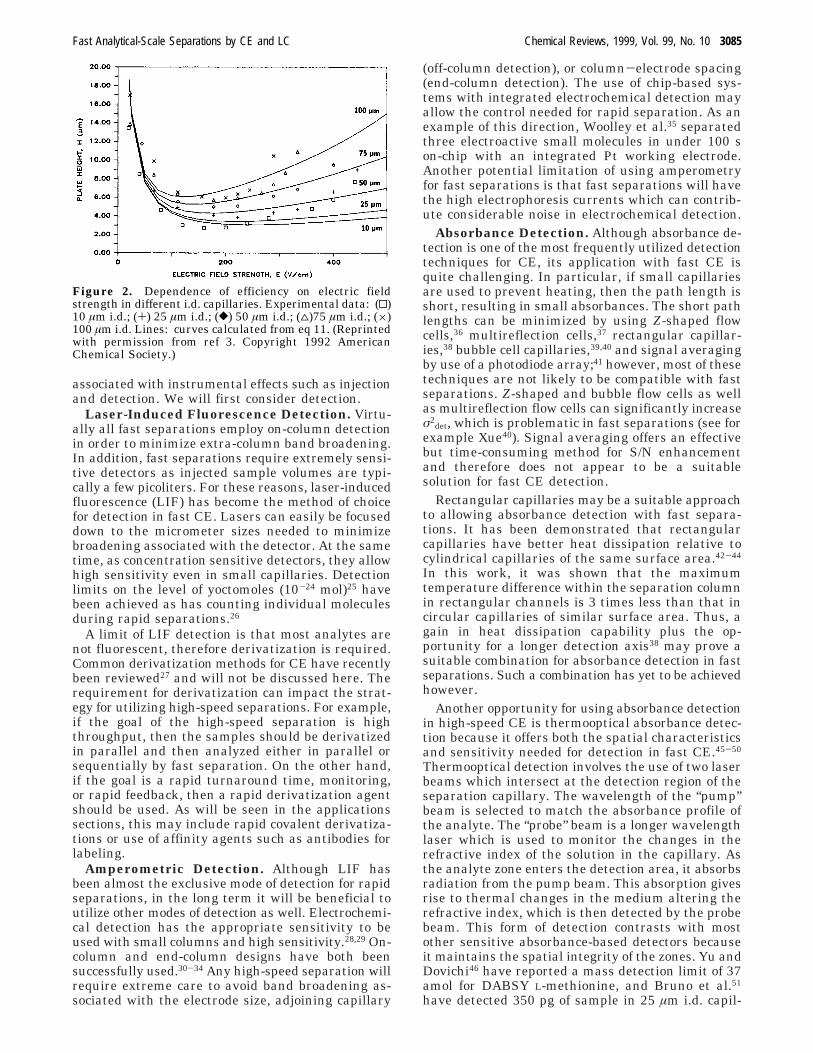
Plots of H versus electric field strength similar to vanDeemter plots used in chromatography can be gener-ated from this equation and used to show trends inefficiency with speed. This equation provided anacceptable fit when compared to experimentallyobserved plate heights as shown in Figure 2. Atminimum plate height, it was shown that diffusionaccounted for ∼98% of zone broadening in 10 µmcapillaries. Perhaps more importantly, the theoryindicated that plate height would increase from ∼3µm to just 3.5 µm as E was increased from 190 (theoptimum) to 500 V/cm in a 10 µm capillary comparedto a change from 4 µm to almost 7 µm for 50 µmcapillaries. Again, the importance of using small i.d.capillaries is demonstrated.
B. Instrumentation
1. Detection
In addition to the above sources of band broaden-ing, it also important to control band broadening
Figure 1. CE of low molecular weight compounds in a lowconductivity buffer. Sample: benzoic acid (B), 4-hydroxy-benzoic acid (HB), 4 hydroxy-3methoxybenzoic acid (HMB),and â-naphthylacetic acid (N), each compound 0.01 mg/mL.Buffer 0.3% w/v polyoxyethylene bis(3-amino-2-hydroxy-propyl)/0.025% w/v polyoxyethylene bis(acetic acid), pH 8.6.Voltage (a) 5000 V (E ) 330 V/cm, 0.4 µA); (b) 30 000 V(E ) 2000 V/cm, 2.5 µA). A comparison between theelectropherograms in a and b shows that the low conduc-tivity buffer used permits analysis at high E, consequentlyminimizing analysis times (∼5-fold) with no observable lossin resolution. (Reprinted with permission from ref 4.Copyright 1995.)
Hads ) (R(1 - R)2µapprcELn/ZR)/L (10)
H ) σInj2/L +(2D/µappE) +
R(1 - R)2 µapprcEn/ZR + [(τ2λ2µï2/k1
2D)]
[(K1E5rc
6/µapp) + (K2E6rc
8/LD)] (11)
3084 Chemical Reviews, 1999, Vol. 99, No. 10 Kennedy et al.
associated with instrumental effects such as injectionand detection. We will first consider detection.
Laser-Induced Fluorescence Detection. Virtu-ally all fast separations employ on-column detectionin order to minimize extra-column band broadening.In addition, fast separations require extremely sensi-tive detectors as injected sample volumes are typi-cally a few picoliters. For these reasons, laser-inducedfluorescence (LIF) has become the method of choicefor detection in fast CE. Lasers can easily be focuseddown to the micrometer sizes needed to minimizebroadening associated with the detector. At the sametime, as concentration sensitive detectors, they allowhigh sensitivity even in small capillaries. Detectionlimits on the level of yoctomoles (10-24 mol)25 havebeen achieved as has counting individual moleculesduring rapid separations.26
A limit of LIF detection is that most analytes arenot fluorescent, therefore derivatization is required.Common derivatization methods for CE have recentlybeen reviewed27 and will not be discussed here. Therequirement for derivatization can impact the strat-egy for utilizing high-speed separations. For example,if the goal of the high-speed separation is highthroughput, then the samples should be derivatizedin parallel and then analyzed either in parallel orsequentially by fast separation. On the other hand,if the goal is a rapid turnaround time, monitoring,or rapid feedback, then a rapid derivatization agentshould be used. As will be seen in the applicationssections, this may include rapid covalent derivatiza-tions or use of affinity agents such as antibodies forlabeling.
Amperometric Detection. Although LIF hasbeen almost the exclusive mode of detection for rapidseparations, in the long term it will be beneficial toutilize other modes of detection as well. Electrochemi-cal detection has the appropriate sensitivity to beused with small columns and high sensitivity.28,29 On-column and end-column designs have both beensuccessfully used.30-34 Any high-speed separation willrequire extreme care to avoid band broadening as-sociated with the electrode size, adjoining capillary
(off-column detection), or column-electrode spacing(end-column detection). The use of chip-based sys-tems with integrated electrochemical detection mayallow the control needed for rapid separation. As anexample of this direction, Woolley et al.35 separatedthree electroactive small molecules in under 100 son-chip with an integrated Pt working electrode.Another potential limitation of using amperometryfor fast separations is that fast separations will havethe high electrophoresis currents which can contrib-ute considerable noise in electrochemical detection.
Absorbance Detection. Although absorbance de-tection is one of the most frequently utilized detectiontechniques for CE, its application with fast CE isquite challenging. In particular, if small capillariesare used to prevent heating, then the path length isshort, resulting in small absorbances. The short pathlengths can be minimized by using Z-shaped flowcells,36 multireflection cells,37 rectangular capillar-ies,38 bubble cell capillaries,39,40 and signal averagingby use of a photodiode array;41 however, most of thesetechniques are not likely to be compatible with fastseparations. Z-shaped and bubble flow cells as wellas multireflection flow cells can significantly increaseσ2
det, which is problematic in fast separations (see forexample Xue40). Signal averaging offers an effectivebut time-consuming method for S/N enhancementand therefore does not appear to be a suitablesolution for fast CE detection.
Rectangular capillaries may be a suitable approachto allowing absorbance detection with fast separa-tions. It has been demonstrated that rectangularcapillaries have better heat dissipation relative tocylindrical capillaries of the same surface area.42-44
In this work, it was shown that the maximumtemperature difference within the separation columnin rectangular channels is 3 times less than that incircular capillaries of similar surface area. Thus, again in heat dissipation capability plus the op-portunity for a longer detection axis38 may prove asuitable combination for absorbance detection in fastseparations. Such a combination has yet to be achievedhowever.
Another opportunity for using absorbance detectionin high-speed CE is thermooptical absorbance detec-tion because it offers both the spatial characteristicsand sensitivity needed for detection in fast CE.45-50
Thermooptical detection involves the use of two laserbeams which intersect at the detection region of theseparation capillary. The wavelength of the “pump”beam is selected to match the absorbance profile ofthe analyte. The “probe” beam is a longer wavelengthlaser which is used to monitor the changes in therefractive index of the solution in the capillary. Asthe analyte zone enters the detection area, it absorbsradiation from the pump beam. This absorption givesrise to thermal changes in the medium altering therefractive index, which is then detected by the probebeam. This form of detection contrasts with mostother sensitive absorbance-based detectors becauseit maintains the spatial integrity of the zones. Yu andDovichi46 have reported a mass detection limit of 37amol for DABSY L-methionine, and Bruno et al.51
have detected 350 pg of sample in 25 µm i.d. capil-
Figure 2. Dependence of efficiency on electric fieldstrength in different i.d. capillaries. Experimental data: (0)10 µm i.d.; (+) 25 µm i.d.; ([) 50 µm i.d.; (4)75 µm i.d.; (×)100 µm i.d. Lines: curves calculated from eq 11. (Reprintedwith permission from ref 3. Copyright 1992 AmericanChemical Society.)
Fast Analytical-Scale Separations by CE and LC Chemical Reviews, 1999, Vol. 99, No. 10 3085
laries by this method. These reports suggest ther-mooptical absorbance detection offers the potentialof being applied to fast CE measurements utilizingsmall i.d. capillaries.
Mass Spectrometry Detection. Mass spectrom-etry also provides a possible alternative for detectionin fast separations. While many of the fastest CEseparations are applied to well characterized systems(i.e., chemical monitoring), there is a growing interestin high-throughput screening or high-throughputpeptide/protein analysis for proteomics. The highseparation efficiencies and rapid analysis of CEcoupled with the structural information obtainableby various MS techniques provides an opportunityto obtain large amounts of analytical information ina short time.
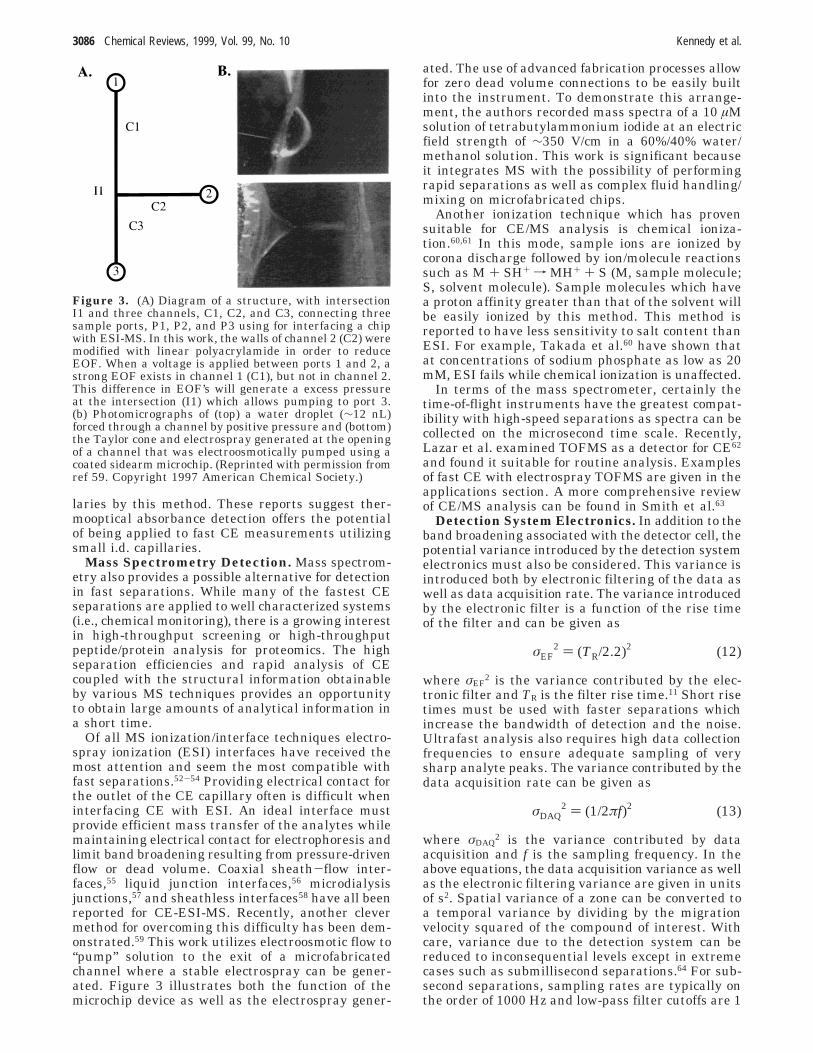
Of all MS ionization/interface techniques electro-spray ionization (ESI) interfaces have received themost attention and seem the most compatible withfast separations.52-54 Providing electrical contact forthe outlet of the CE capillary often is difficult wheninterfacing CE with ESI. An ideal interface mustprovide efficient mass transfer of the analytes whilemaintaining electrical contact for electrophoresis andlimit band broadening resulting from pressure-drivenflow or dead volume. Coaxial sheath-flow inter-faces,55 liquid junction interfaces,56 microdialysisjunctions,57 and sheathless interfaces58 have all beenreported for CE-ESI-MS. Recently, another clevermethod for overcoming this difficulty has been dem-onstrated.59 This work utilizes electroosmotic flow to“pump” solution to the exit of a microfabricatedchannel where a stable electrospray can be gener-ated. Figure 3 illustrates both the function of themicrochip device as well as the electrospray gener-
ated. The use of advanced fabrication processes allowfor zero dead volume connections to be easily builtinto the instrument. To demonstrate this arrange-ment, the authors recorded mass spectra of a 10 µMsolution of tetrabutylammonium iodide at an electricfield strength of ∼350 V/cm in a 60%/40% water/methanol solution. This work is significant becauseit integrates MS with the possibility of performingrapid separations as well as complex fluid handling/mixing on microfabricated chips.
Another ionization technique which has provensuitable for CE/MS analysis is chemical ioniza-tion.60,61 In this mode, sample ions are ionized bycorona discharge followed by ion/molecule reactionssuch as M + SH+ f MH+ + S (M, sample molecule;S, solvent molecule). Sample molecules which havea proton affinity greater than that of the solvent willbe easily ionized by this method. This method isreported to have less sensitivity to salt content thanESI. For example, Takada et al.60 have shown thatat concentrations of sodium phosphate as low as 20mM, ESI fails while chemical ionization is unaffected.
In terms of the mass spectrometer, certainly thetime-of-flight instruments have the greatest compat-ibility with high-speed separations as spectra can becollected on the microsecond time scale. Recently,Lazar et al. examined TOFMS as a detector for CE62
and found it suitable for routine analysis. Examplesof fast CE with electrospray TOFMS are given in theapplications section. A more comprehensive reviewof CE/MS analysis can be found in Smith et al.63
Detection System Electronics. In addition to theband broadening associated with the detector cell, thepotential variance introduced by the detection systemelectronics must also be considered. This variance isintroduced both by electronic filtering of the data aswell as data acquisition rate. The variance introducedby the electronic filter is a function of the rise timeof the filter and can be given as
where σEF2 is the variance contributed by the elec-
tronic filter and TR is the filter rise time.11 Short risetimes must be used with faster separations whichincrease the bandwidth of detection and the noise.Ultrafast analysis also requires high data collectionfrequencies to ensure adequate sampling of verysharp analyte peaks. The variance contributed by thedata acquisition rate can be given as
where σDAQ2 is the variance contributed by data
acquisition and f is the sampling frequency. In theabove equations, the data acquisition variance as wellas the electronic filtering variance are given in unitsof s2. Spatial variance of a zone can be converted toa temporal variance by dividing by the migrationvelocity squared of the compound of interest. Withcare, variance due to the detection system can bereduced to inconsequential levels except in extremecases such as submillisecond separations.64 For sub-second separations, sampling rates are typically onthe order of 1000 Hz and low-pass filter cutoffs are 1
Figure 3. (A) Diagram of a structure, with intersectionI1 and three channels, C1, C2, and C3, connecting threesample ports, P1, P2, and P3 using for interfacing a chipwith ESI-MS. In this work, the walls of channel 2 (C2) weremodified with linear polyacrylamide in order to reduceEOF. When a voltage is applied between ports 1 and 2, astrong EOF exists in channel 1 (C1), but not in channel 2.This difference in EOF’s will generate a excess pressureat the intersection (I1) which allows pumping to port 3.(b) Photomicrographs of (top) a water droplet (∼12 nL)forced through a channel by positive pressure and (bottom)the Taylor cone and electrospray generated at the openingof a channel that was electroosmotically pumped using acoated sidearm microchip. (Reprinted with permission fromref 59. Copyright 1997 American Chemical Society.)
σEF2 ) (TR/2.2)2 (12)
σDAQ2 ) (1/2πf)2 (13)
3086 Chemical Reviews, 1999, Vol. 99, No. 10 Kennedy et al.
ms.11,12 Examples of calculation of the effect of thesevarious sources of band broadening can be found inseveral papers on fast CE.11,12,64
2. Sample InjectionAnother contribution to band broadening in fast
separations is that of sample injection. This is ofparticular interest for fast separations, which requirevery narrow plugs of sample injected onto the sepa-ration capillary. Most advances in separation speedhave followed development of novel instrumentationfor fast and reliable sample injection. In fact, mostrecent work has shown that for small molecules,which do not adsorb strongly to the capillary surface,the variance due to injection is often the largestcontributor to band broadening.11,12 Mathematically,the variance contributed by sample injection can begiven as
where h is the initial width of a sample plug.3 Thus,since narrow sample zones and small i.d. capillariesare a necessity, sample volumes on the order ofhundreds of picoliters (10-12 L) or less must beinjected onto the column to achieve high-speed, high-efficiency separations. A frequent problem in high-speed CE separations is that to minimize the bandbroadening due to injection, small amounts must beinjected, thus compounding the problem raised byusing small i.d. capillaries.
In addition to broadening due to the width of theinitial sample plug, broadening associated with sampleoverloading (or “electromigration dispersion”) mustalso be considered. This type of broadening occursas a result of the electrical discontinuity that occursin the capillary from the sample to the buffer.1 Thistype of broadening can be minimized by using lowconcentrations of analyte dissolved in a buffer identi-cal to the electrophoresis buffer.
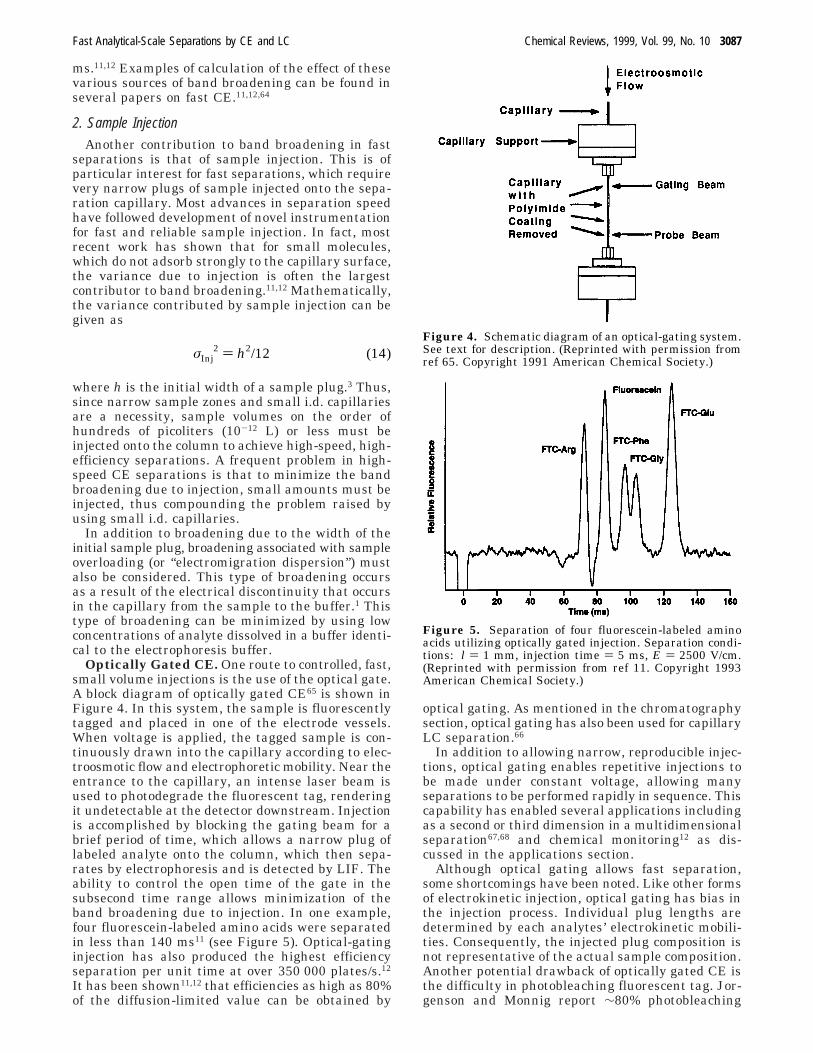
Optically Gated CE. One route to controlled, fast,small volume injections is the use of the optical gate.A block diagram of optically gated CE65 is shown inFigure 4. In this system, the sample is fluorescentlytagged and placed in one of the electrode vessels.When voltage is applied, the tagged sample is con-tinuously drawn into the capillary according to elec-troosmotic flow and electrophoretic mobility. Near theentrance to the capillary, an intense laser beam isused to photodegrade the fluorescent tag, renderingit undetectable at the detector downstream. Injectionis accomplished by blocking the gating beam for abrief period of time, which allows a narrow plug oflabeled analyte onto the column, which then sepa-rates by electrophoresis and is detected by LIF. Theability to control the open time of the gate in thesubsecond time range allows minimization of theband broadening due to injection. In one example,four fluorescein-labeled amino acids were separatedin less than 140 ms11 (see Figure 5). Optical-gatinginjection has also produced the highest efficiencyseparation per unit time at over 350 000 plates/s.12
It has been shown11,12 that efficiencies as high as 80%of the diffusion-limited value can be obtained by
optical gating. As mentioned in the chromatographysection, optical gating has also been used for capillaryLC separation.66
In addition to allowing narrow, reproducible injec-tions, optical gating enables repetitive injections tobe made under constant voltage, allowing manyseparations to be performed rapidly in sequence. Thiscapability has enabled several applications includingas a second or third dimension in a multidimensionalseparation67,68 and chemical monitoring12 as dis-cussed in the applications section.
Although optical gating allows fast separation,some shortcomings have been noted. Like other formsof electrokinetic injection, optical gating has bias inthe injection process. Individual plug lengths aredetermined by each analytes’ electrokinetic mobili-ties. Consequently, the injected plug composition isnot representative of the actual sample composition.Another potential drawback of optically gated CE isthe difficulty in photobleaching fluorescent tag. Jor-genson and Monnig report ∼80% photobleaching
Figure 4. Schematic diagram of an optical-gating system.See text for description. (Reprinted with permission fromref 65. Copyright 1991 American Chemical Society.)
Figure 5. Separation of four fluorescein-labeled aminoacids utilizing optically gated injection. Separation condi-tions: l ) 1 mm, injection time ) 5 ms, E ) 2500 V/cm.(Reprinted with permission from ref 11. Copyright 1993American Chemical Society.)
σInj2 ) h2/12 (14)
Fast Analytical-Scale Separations by CE and LC Chemical Reviews, 1999, Vol. 99, No. 10 3087
efficiency of fluorescein at 600 mW of the 488 nm line.Unbleached fluorophore molecules give rise to back-ground fluorescence at the detector and result inpoorer detection limits. More easily photobleacheddyes, while poorer fluorophores, may be more ame-nable to optical gating applications. For example, Taoet al.12 reported a photobleaching efficiency of over98% for OPA/â-ME derivatives of amino acids at ∼1mW laser power. The low background possible withthis reagent resulted in mass limits of detectionbetween 10 and 35 zmol and concentration detectionlimits of ∼15 nM. A final concern in optically gatedCE is that the sample matrix is constantly beinginfused onto the capillary. If the sample matrixcontains high salt content or adsorptive componentswhich can alter the electroosmotic flow, then poorefficiency and reproducibility may be observed.
Because of the limitations of optical gating, itseems likely to be used primarily in certain nicheapplications where the above problems can be over-come. Such applications may include multidimen-sional separations or chemical monitoring. At thesame time, however, opportunities exist for expand-ing the utility of this and related approaches. First,other fluorophores should be investigated for theirapplicability to optical gating. In addition, otherdestructive detectors could possibly be used withgating. One can envision, for example, using electro-chemical gating in which an electrode is used tooxidize analytes preventing detection at a down-stream electrode. Switching the potential on theupstream electrode could be used to inject a plug ofintact molecules for separation and subsequent am-perometric detection.
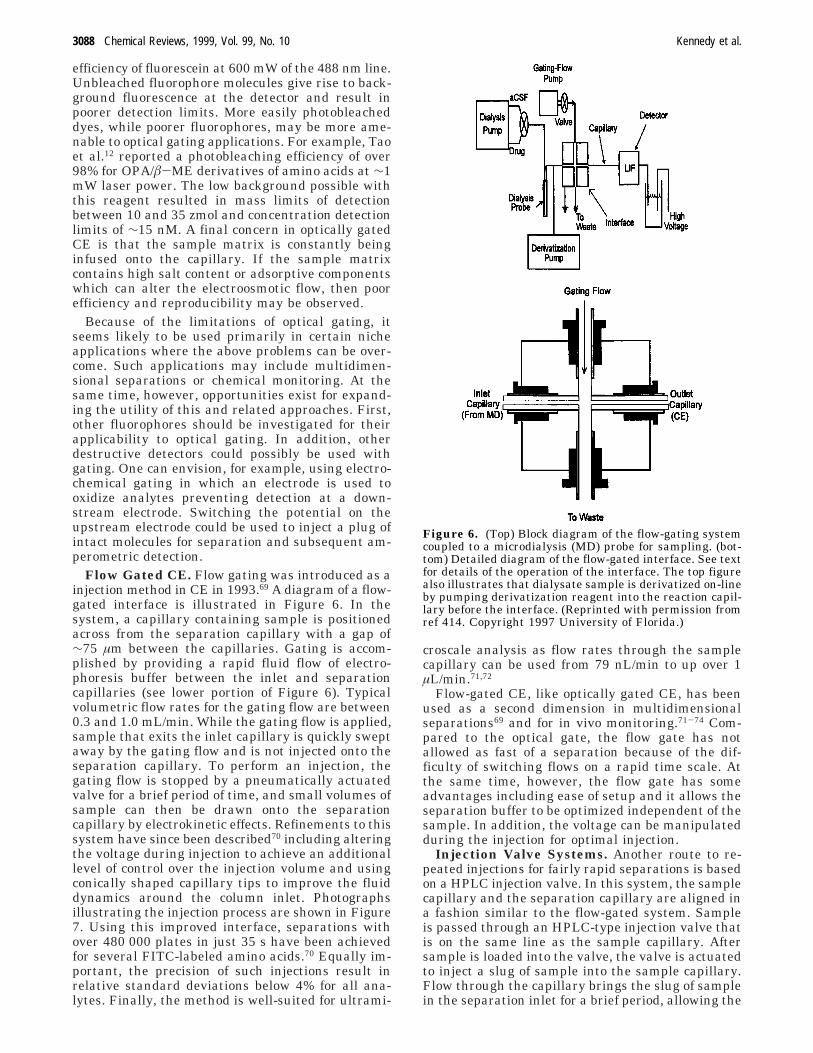
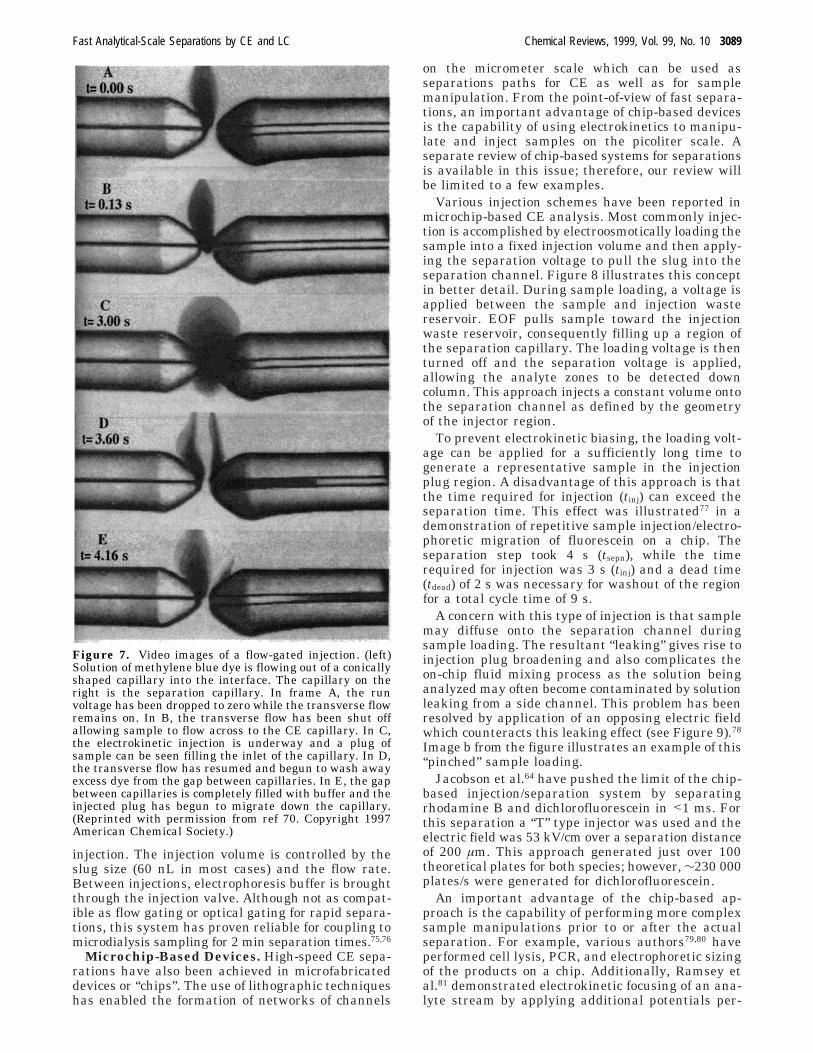
Flow Gated CE. Flow gating was introduced as ainjection method in CE in 1993.69 A diagram of a flow-gated interface is illustrated in Figure 6. In thesystem, a capillary containing sample is positionedacross from the separation capillary with a gap of∼75 µm between the capillaries. Gating is accom-plished by providing a rapid fluid flow of electro-phoresis buffer between the inlet and separationcapillaries (see lower portion of Figure 6). Typicalvolumetric flow rates for the gating flow are between0.3 and 1.0 mL/min. While the gating flow is applied,sample that exits the inlet capillary is quickly sweptaway by the gating flow and is not injected onto theseparation capillary. To perform an injection, thegating flow is stopped by a pneumatically actuatedvalve for a brief period of time, and small volumes ofsample can then be drawn onto the separationcapillary by electrokinetic effects. Refinements to thissystem have since been described70 including alteringthe voltage during injection to achieve an additionallevel of control over the injection volume and usingconically shaped capillary tips to improve the fluiddynamics around the column inlet. Photographsillustrating the injection process are shown in Figure7. Using this improved interface, separations withover 480 000 plates in just 35 s have been achievedfor several FITC-labeled amino acids.70 Equally im-portant, the precision of such injections result inrelative standard deviations below 4% for all ana-lytes. Finally, the method is well-suited for ultrami-
croscale analysis as flow rates through the samplecapillary can be used from 79 nL/min to up over 1µL/min.71,72
Flow-gated CE, like optically gated CE, has beenused as a second dimension in multidimensionalseparations69 and for in vivo monitoring.71-74 Com-pared to the optical gate, the flow gate has notallowed as fast of a separation because of the dif-ficulty of switching flows on a rapid time scale. Atthe same time, however, the flow gate has someadvantages including ease of setup and it allows theseparation buffer to be optimized independent of thesample. In addition, the voltage can be manipulatedduring the injection for optimal injection.
Injection Valve Systems. Another route to re-peated injections for fairly rapid separations is basedon a HPLC injection valve. In this system, the samplecapillary and the separation capillary are aligned ina fashion similar to the flow-gated system. Sampleis passed through an HPLC-type injection valve thatis on the same line as the sample capillary. Aftersample is loaded into the valve, the valve is actuatedto inject a slug of sample into the sample capillary.Flow through the capillary brings the slug of samplein the separation inlet for a brief period, allowing the
Figure 6. (Top) Block diagram of the flow-gating systemcoupled to a microdialysis (MD) probe for sampling. (bot-tom) Detailed diagram of the flow-gated interface. See textfor details of the operation of the interface. The top figurealso illustrates that dialysate sample is derivatized on-lineby pumping derivatization reagent into the reaction capil-lary before the interface. (Reprinted with permission fromref 414. Copyright 1997 University of Florida.)
3088 Chemical Reviews, 1999, Vol. 99, No. 10 Kennedy et al.
injection. The injection volume is controlled by theslug size (60 nL in most cases) and the flow rate.Between injections, electrophoresis buffer is broughtthrough the injection valve. Although not as compat-ible as flow gating or optical gating for rapid separa-tions, this system has proven reliable for coupling tomicrodialysis sampling for 2 min separation times.75,76
Microchip-Based Devices. High-speed CE sepa-rations have also been achieved in microfabricateddevices or “chips”. The use of lithographic techniqueshas enabled the formation of networks of channels
on the micrometer scale which can be used asseparations paths for CE as well as for samplemanipulation. From the point-of-view of fast separa-tions, an important advantage of chip-based devicesis the capability of using electrokinetics to manipu-late and inject samples on the picoliter scale. Aseparate review of chip-based systems for separationsis available in this issue; therefore, our review willbe limited to a few examples.
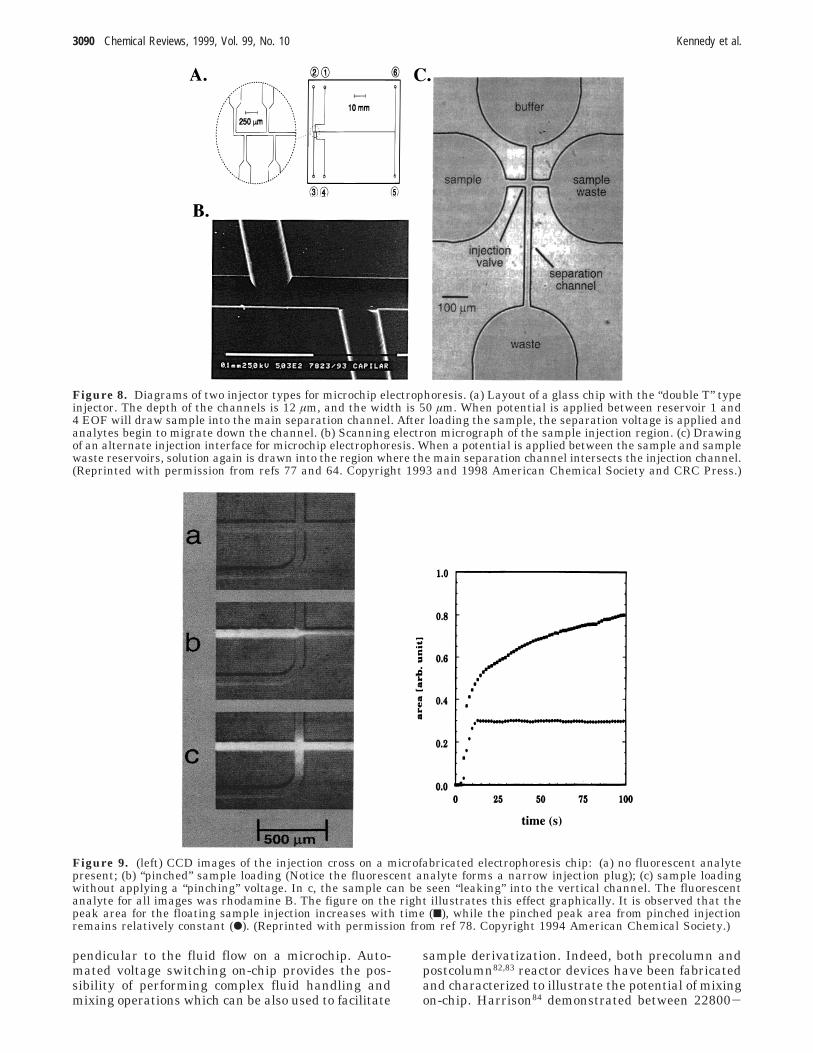
Various injection schemes have been reported inmicrochip-based CE analysis. Most commonly injec-tion is accomplished by electroosmotically loading thesample into a fixed injection volume and then apply-ing the separation voltage to pull the slug into theseparation channel. Figure 8 illustrates this conceptin better detail. During sample loading, a voltage isapplied between the sample and injection wastereservoir. EOF pulls sample toward the injectionwaste reservoir, consequently filling up a region ofthe separation capillary. The loading voltage is thenturned off and the separation voltage is applied,allowing the analyte zones to be detected downcolumn. This approach injects a constant volume ontothe separation channel as defined by the geometryof the injector region.
To prevent electrokinetic biasing, the loading volt-age can be applied for a sufficiently long time togenerate a representative sample in the injectionplug region. A disadvantage of this approach is thatthe time required for injection (tinj) can exceed theseparation time. This effect was illustrated77 in ademonstration of repetitive sample injection/electro-phoretic migration of fluorescein on a chip. Theseparation step took 4 s (tsepn), while the timerequired for injection was 3 s (tinj) and a dead time(tdead) of 2 s was necessary for washout of the regionfor a total cycle time of 9 s.
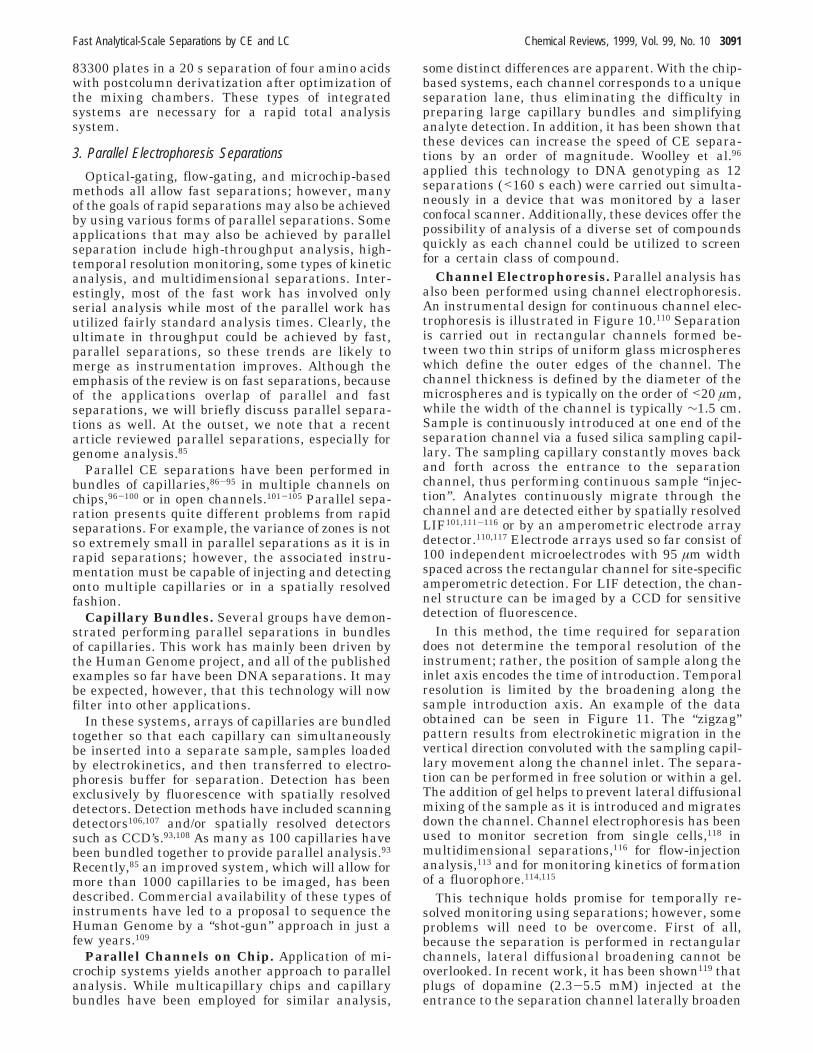
A concern with this type of injection is that samplemay diffuse onto the separation channel duringsample loading. The resultant “leaking” gives rise toinjection plug broadening and also complicates theon-chip fluid mixing process as the solution beinganalyzed may often become contaminated by solutionleaking from a side channel. This problem has beenresolved by application of an opposing electric fieldwhich counteracts this leaking effect (see Figure 9).78
Image b from the figure illustrates an example of this“pinched” sample loading.
Jacobson et al.64 have pushed the limit of the chip-based injection/separation system by separatingrhodamine B and dichlorofluorescein in <1 ms. Forthis separation a “T” type injector was used and theelectric field was 53 kV/cm over a separation distanceof 200 µm. This approach generated just over 100theoretical plates for both species; however, ∼230 000plates/s were generated for dichlorofluorescein.
An important advantage of the chip-based ap-proach is the capability of performing more complexsample manipulations prior to or after the actualseparation. For example, various authors79,80 haveperformed cell lysis, PCR, and electrophoretic sizingof the products on a chip. Additionally, Ramsey etal.81 demonstrated electrokinetic focusing of an ana-lyte stream by applying additional potentials per-
Figure 7. Video images of a flow-gated injection. (left)Solution of methylene blue dye is flowing out of a conicallyshaped capillary into the interface. The capillary on theright is the separation capillary. In frame A, the runvoltage has been dropped to zero while the transverse flowremains on. In B, the transverse flow has been shut offallowing sample to flow across to the CE capillary. In C,the electrokinetic injection is underway and a plug ofsample can be seen filling the inlet of the capillary. In D,the transverse flow has resumed and begun to wash awayexcess dye from the gap between capillaries. In E, the gapbetween capillaries is completely filled with buffer and theinjected plug has begun to migrate down the capillary.(Reprinted with permission from ref 70. Copyright 1997American Chemical Society.)
Fast Analytical-Scale Separations by CE and LC Chemical Reviews, 1999, Vol. 99, No. 10 3089
pendicular to the fluid flow on a microchip. Auto-mated voltage switching on-chip provides the pos-sibility of performing complex fluid handling andmixing operations which can be also used to facilitate
sample derivatization. Indeed, both precolumn andpostcolumn82,83 reactor devices have been fabricatedand characterized to illustrate the potential of mixingon-chip. Harrison84 demonstrated between 22800-
Figure 8. Diagrams of two injector types for microchip electrophoresis. (a) Layout of a glass chip with the “double T” typeinjector. The depth of the channels is 12 µm, and the width is 50 µm. When potential is applied between reservoir 1 and4 EOF will draw sample into the main separation channel. After loading the sample, the separation voltage is applied andanalytes begin to migrate down the channel. (b) Scanning electron micrograph of the sample injection region. (c) Drawingof an alternate injection interface for microchip electrophoresis. When a potential is applied between the sample and samplewaste reservoirs, solution again is drawn into the region where the main separation channel intersects the injection channel.(Reprinted with permission from refs 77 and 64. Copyright 1993 and 1998 American Chemical Society and CRC Press.)
Figure 9. (left) CCD images of the injection cross on a microfabricated electrophoresis chip: (a) no fluorescent analytepresent; (b) “pinched” sample loading (Notice the fluorescent analyte forms a narrow injection plug); (c) sample loadingwithout applying a “pinching” voltage. In c, the sample can be seen “leaking” into the vertical channel. The fluorescentanalyte for all images was rhodamine B. The figure on the right illustrates this effect graphically. It is observed that thepeak area for the floating sample injection increases with time (9), while the pinched peak area from pinched injectionremains relatively constant (b). (Reprinted with permission from ref 78. Copyright 1994 American Chemical Society.)
3090 Chemical Reviews, 1999, Vol. 99, No. 10 Kennedy et al.
83300 plates in a 20 s separation of four amino acidswith postcolumn derivatization after optimization ofthe mixing chambers. These types of integratedsystems are necessary for a rapid total analysissystem.
3. Parallel Electrophoresis Separations
Optical-gating, flow-gating, and microchip-basedmethods all allow fast separations; however, manyof the goals of rapid separations may also be achievedby using various forms of parallel separations. Someapplications that may also be achieved by parallelseparation include high-throughput analysis, high-temporal resolution monitoring, some types of kineticanalysis, and multidimensional separations. Inter-estingly, most of the fast work has involved onlyserial analysis while most of the parallel work hasutilized fairly standard analysis times. Clearly, theultimate in throughput could be achieved by fast,parallel separations, so these trends are likely tomerge as instrumentation improves. Although theemphasis of the review is on fast separations, becauseof the applications overlap of parallel and fastseparations, we will briefly discuss parallel separa-tions as well. At the outset, we note that a recentarticle reviewed parallel separations, especially forgenome analysis.85
Parallel CE separations have been performed inbundles of capillaries,86-95 in multiple channels onchips,96-100 or in open channels.101-105 Parallel sepa-ration presents quite different problems from rapidseparations. For example, the variance of zones is notso extremely small in parallel separations as it is inrapid separations; however, the associated instru-mentation must be capable of injecting and detectingonto multiple capillaries or in a spatially resolvedfashion.
Capillary Bundles. Several groups have demon-strated performing parallel separations in bundlesof capillaries. This work has mainly been driven bythe Human Genome project, and all of the publishedexamples so far have been DNA separations. It maybe expected, however, that this technology will nowfilter into other applications.
In these systems, arrays of capillaries are bundledtogether so that each capillary can simultaneouslybe inserted into a separate sample, samples loadedby electrokinetics, and then transferred to electro-phoresis buffer for separation. Detection has beenexclusively by fluorescence with spatially resolveddetectors. Detection methods have included scanningdetectors106,107 and/or spatially resolved detectorssuch as CCD’s.93,108 As many as 100 capillaries havebeen bundled together to provide parallel analysis.93
Recently,85 an improved system, which will allow formore than 1000 capillaries to be imaged, has beendescribed. Commercial availability of these types ofinstruments have led to a proposal to sequence theHuman Genome by a “shot-gun” approach in just afew years.109
Parallel Channels on Chip. Application of mi-crochip systems yields another approach to parallelanalysis. While multicapillary chips and capillarybundles have been employed for similar analysis,
some distinct differences are apparent. With the chip-based systems, each channel corresponds to a uniqueseparation lane, thus eliminating the difficulty inpreparing large capillary bundles and simplifyinganalyte detection. In addition, it has been shown thatthese devices can increase the speed of CE separa-tions by an order of magnitude. Woolley et al.96
applied this technology to DNA genotyping as 12separations (<160 s each) were carried out simulta-neously in a device that was monitored by a laserconfocal scanner. Additionally, these devices offer thepossibility of analysis of a diverse set of compoundsquickly as each channel could be utilized to screenfor a certain class of compound.
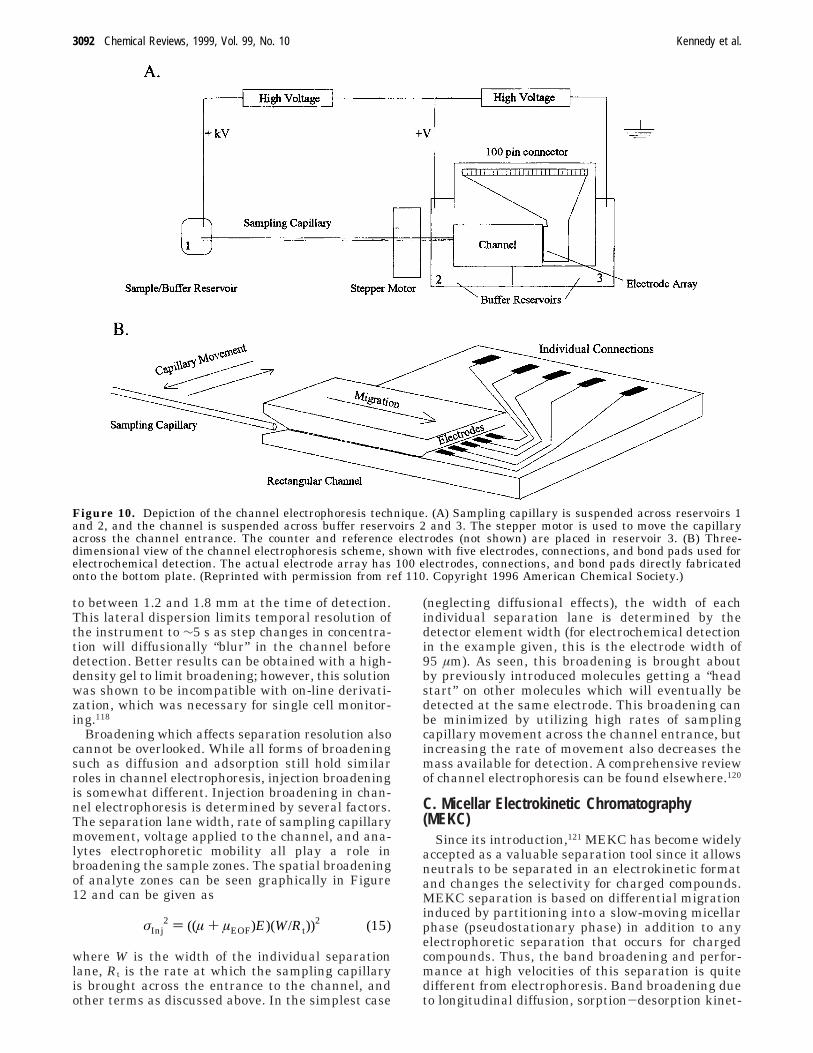
Channel Electrophoresis. Parallel analysis hasalso been performed using channel electrophoresis.An instrumental design for continuous channel elec-trophoresis is illustrated in Figure 10.110 Separationis carried out in rectangular channels formed be-tween two thin strips of uniform glass microsphereswhich define the outer edges of the channel. Thechannel thickness is defined by the diameter of themicrospheres and is typically on the order of <20 µm,while the width of the channel is typically ∼1.5 cm.Sample is continuously introduced at one end of theseparation channel via a fused silica sampling capil-lary. The sampling capillary constantly moves backand forth across the entrance to the separationchannel, thus performing continuous sample “injec-tion”. Analytes continuously migrate through thechannel and are detected either by spatially resolvedLIF101,111-116 or by an amperometric electrode arraydetector.110,117 Electrode arrays used so far consist of100 independent microelectrodes with 95 µm widthspaced across the rectangular channel for site-specificamperometric detection. For LIF detection, the chan-nel structure can be imaged by a CCD for sensitivedetection of fluorescence.
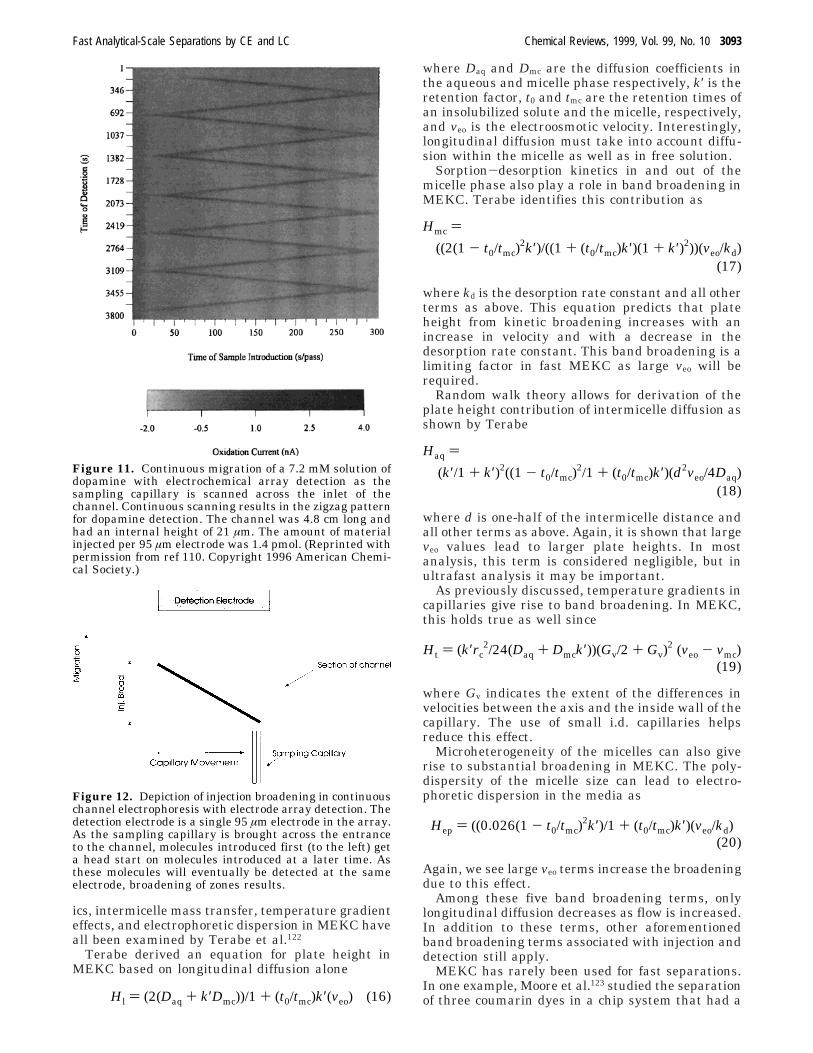
In this method, the time required for separationdoes not determine the temporal resolution of theinstrument; rather, the position of sample along theinlet axis encodes the time of introduction. Temporalresolution is limited by the broadening along thesample introduction axis. An example of the dataobtained can be seen in Figure 11. The “zigzag”pattern results from electrokinetic migration in thevertical direction convoluted with the sampling capil-lary movement along the channel inlet. The separa-tion can be performed in free solution or within a gel.The addition of gel helps to prevent lateral diffusionalmixing of the sample as it is introduced and migratesdown the channel. Channel electrophoresis has beenused to monitor secretion from single cells,118 inmultidimensional separations,116 for flow-injectionanalysis,113 and for monitoring kinetics of formationof a fluorophore.114,115
This technique holds promise for temporally re-solved monitoring using separations; however, someproblems will need to be overcome. First of all,because the separation is performed in rectangularchannels, lateral diffusional broadening cannot beoverlooked. In recent work, it has been shown119 thatplugs of dopamine (2.3-5.5 mM) injected at theentrance to the separation channel laterally broaden
Fast Analytical-Scale Separations by CE and LC Chemical Reviews, 1999, Vol. 99, No. 10 3091
to between 1.2 and 1.8 mm at the time of detection.This lateral dispersion limits temporal resolution ofthe instrument to ∼5 s as step changes in concentra-tion will diffusionally “blur” in the channel beforedetection. Better results can be obtained with a high-density gel to limit broadening; however, this solutionwas shown to be incompatible with on-line derivati-zation, which was necessary for single cell monitor-ing.118
Broadening which affects separation resolution alsocannot be overlooked. While all forms of broadeningsuch as diffusion and adsorption still hold similarroles in channel electrophoresis, injection broadeningis somewhat different. Injection broadening in chan-nel electrophoresis is determined by several factors.The separation lane width, rate of sampling capillarymovement, voltage applied to the channel, and ana-lytes electrophoretic mobility all play a role inbroadening the sample zones. The spatial broadeningof analyte zones can be seen graphically in Figure12 and can be given as
where W is the width of the individual separationlane, Rt is the rate at which the sampling capillaryis brought across the entrance to the channel, andother terms as discussed above. In the simplest case
(neglecting diffusional effects), the width of eachindividual separation lane is determined by thedetector element width (for electrochemical detectionin the example given, this is the electrode width of95 µm). As seen, this broadening is brought aboutby previously introduced molecules getting a “headstart” on other molecules which will eventually bedetected at the same electrode. This broadening canbe minimized by utilizing high rates of samplingcapillary movement across the channel entrance, butincreasing the rate of movement also decreases themass available for detection. A comprehensive reviewof channel electrophoresis can be found elsewhere.120
C. Micellar Electrokinetic Chromatography(MEKC)
Since its introduction,121 MEKC has become widelyaccepted as a valuable separation tool since it allowsneutrals to be separated in an electrokinetic formatand changes the selectivity for charged compounds.MEKC separation is based on differential migrationinduced by partitioning into a slow-moving micellarphase (pseudostationary phase) in addition to anyelectrophoretic separation that occurs for chargedcompounds. Thus, the band broadening and perfor-mance at high velocities of this separation is quitedifferent from electrophoresis. Band broadening dueto longitudinal diffusion, sorption-desorption kinet-
Figure 10. Depiction of the channel electrophoresis technique. (A) Sampling capillary is suspended across reservoirs 1and 2, and the channel is suspended across buffer reservoirs 2 and 3. The stepper motor is used to move the capillaryacross the channel entrance. The counter and reference electrodes (not shown) are placed in reservoir 3. (B) Three-dimensional view of the channel electrophoresis scheme, shown with five electrodes, connections, and bond pads used forelectrochemical detection. The actual electrode array has 100 electrodes, connections, and bond pads directly fabricatedonto the bottom plate. (Reprinted with permission from ref 110. Copyright 1996 American Chemical Society.)
σInj2 ) ((µ + µEOF)E)(W/Rt))
2 (15)
3092 Chemical Reviews, 1999, Vol. 99, No. 10 Kennedy et al.
ics, intermicelle mass transfer, temperature gradienteffects, and electrophoretic dispersion in MEKC haveall been examined by Terabe et al.122
Terabe derived an equation for plate height inMEKC based on longitudinal diffusion alone
where Daq and Dmc are the diffusion coefficients inthe aqueous and micelle phase respectively, k′ is theretention factor, t0 and tmc are the retention times ofan insolubilized solute and the micelle, respectively,and veo is the electroosmotic velocity. Interestingly,longitudinal diffusion must take into account diffu-sion within the micelle as well as in free solution.
Sorption-desorption kinetics in and out of themicelle phase also play a role in band broadening inMEKC. Terabe identifies this contribution as
where kd is the desorption rate constant and all otherterms as above. This equation predicts that plateheight from kinetic broadening increases with anincrease in velocity and with a decrease in thedesorption rate constant. This band broadening is alimiting factor in fast MEKC as large veo will berequired.
Random walk theory allows for derivation of theplate height contribution of intermicelle diffusion asshown by Terabe
where d is one-half of the intermicelle distance andall other terms as above. Again, it is shown that largeveo values lead to larger plate heights. In mostanalysis, this term is considered negligible, but inultrafast analysis it may be important.
As previously discussed, temperature gradients incapillaries give rise to band broadening. In MEKC,this holds true as well since
where Gv indicates the extent of the differences invelocities between the axis and the inside wall of thecapillary. The use of small i.d. capillaries helpsreduce this effect.
Microheterogeneity of the micelles can also giverise to substantial broadening in MEKC. The poly-dispersity of the micelle size can lead to electro-phoretic dispersion in the media as
Again, we see large veo terms increase the broadeningdue to this effect.
Among these five band broadening terms, onlylongitudinal diffusion decreases as flow is increased.In addition to these terms, other aforementionedband broadening terms associated with injection anddetection still apply.
MEKC has rarely been used for fast separations.In one example, Moore et al.123 studied the separationof three coumarin dyes in a chip system that had a
Figure 11. Continuous migration of a 7.2 mM solution ofdopamine with electrochemical array detection as thesampling capillary is scanned across the inlet of thechannel. Continuous scanning results in the zigzag patternfor dopamine detection. The channel was 4.8 cm long andhad an internal height of 21 µm. The amount of materialinjected per 95 µm electrode was 1.4 pmol. (Reprinted withpermission from ref 110. Copyright 1996 American Chemi-cal Society.)
Figure 12. Depiction of injection broadening in continuouschannel electrophoresis with electrode array detection. Thedetection electrode is a single 95 µm electrode in the array.As the sampling capillary is brought across the entranceto the channel, molecules introduced first (to the left) geta head start on molecules introduced at a later time. Asthese molecules will eventually be detected at the sameelectrode, broadening of zones results.
Hl ) (2(Daq + k′Dmc))/1 + (t0/tmc)k′(veo) (16)
Hmc )
((2(1 - t0/tmc)2k′)/((1 + (t0/tmc)k′)(1 + k′)2))(veo/kd)
(17)
Haq )
(k′/1 + k′)2((1 - t0/tmc)2/1 + (t0/tmc)k′)(d2veo/4Daq)
(18)
Ht ) (k′rc2/24(Daq + Dmck′))(Gv/2 + Gv)
2 (veo - vmc)(19)
Hep ) ((0.026(1 - t0/tmc)2k′)/1 + (t0/tmc)k′)(veo/kd)
(20)
Fast Analytical-Scale Separations by CE and LC Chemical Reviews, 1999, Vol. 99, No. 10 3093
separation capillary with ∼70 µm width and 10 µmdepth with either 16.5 or 1.3 cm length. Theyobserved that with E up to 1200 V/cm, the dominantsource of band broadening was independent of veloc-ity and was perhaps injection or detection broaden-ing. More importantly from a theoretical standpoint,they observed that above 400 V/cm sorption-desorp-tion kinetics began to contribute to plate height andabove 700 V/cm Joule heating played a role. The factthat sorption-desorption kinetics began to contributeat 400 V/cm suggests that MEKC will not allow asfast a separation as CE. These results and theoryshow that the limit to speed in MEKC ultimatelydepends on the solutes retention factor as the mass-transfer band broadening terms become more sig-nificant as retention factor increases. Thus, applica-bility of MEKC to fast CE analysis is largelydependent on the analyte and sample matrix.
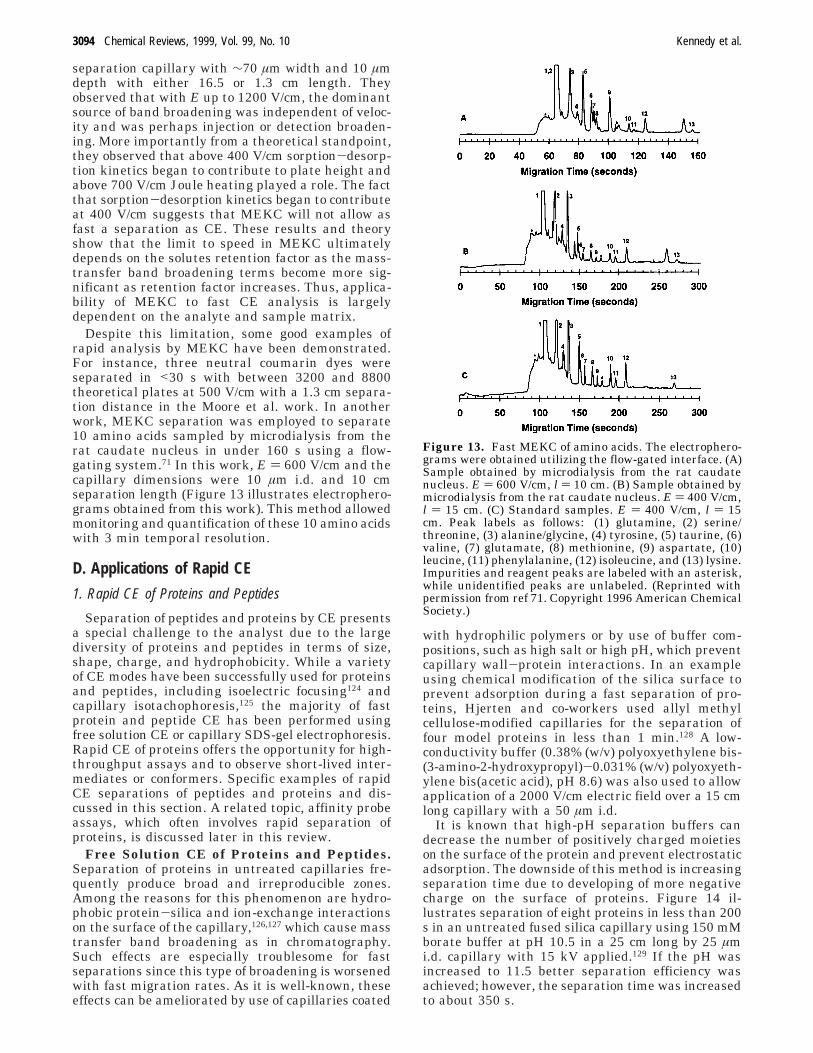
Despite this limitation, some good examples ofrapid analysis by MEKC have been demonstrated.For instance, three neutral coumarin dyes wereseparated in <30 s with between 3200 and 8800theoretical plates at 500 V/cm with a 1.3 cm separa-tion distance in the Moore et al. work. In anotherwork, MEKC separation was employed to separate10 amino acids sampled by microdialysis from therat caudate nucleus in under 160 s using a flow-gating system.71 In this work, E ) 600 V/cm and thecapillary dimensions were 10 µm i.d. and 10 cmseparation length (Figure 13 illustrates electrophero-grams obtained from this work). This method allowedmonitoring and quantification of these 10 amino acidswith 3 min temporal resolution.
D. Applications of Rapid CE
1. Rapid CE of Proteins and Peptides
Separation of peptides and proteins by CE presentsa special challenge to the analyst due to the largediversity of proteins and peptides in terms of size,shape, charge, and hydrophobicity. While a varietyof CE modes have been successfully used for proteinsand peptides, including isoelectric focusing124 andcapillary isotachophoresis,125 the majority of fastprotein and peptide CE has been performed usingfree solution CE or capillary SDS-gel electrophoresis.Rapid CE of proteins offers the opportunity for high-throughput assays and to observe short-lived inter-mediates or conformers. Specific examples of rapidCE separations of peptides and proteins and dis-cussed in this section. A related topic, affinity probeassays, which often involves rapid separation ofproteins, is discussed later in this review.
Free Solution CE of Proteins and Peptides.Separation of proteins in untreated capillaries fre-quently produce broad and irreproducible zones.Among the reasons for this phenomenon are hydro-phobic protein-silica and ion-exchange interactionson the surface of the capillary,126,127 which cause masstransfer band broadening as in chromatography.Such effects are especially troublesome for fastseparations since this type of broadening is worsenedwith fast migration rates. As it is well-known, theseeffects can be ameliorated by use of capillaries coated
with hydrophilic polymers or by use of buffer com-positions, such as high salt or high pH, which preventcapillary wall-protein interactions. In an exampleusing chemical modification of the silica surface toprevent adsorption during a fast separation of pro-teins, Hjerten and co-workers used allyl methylcellulose-modified capillaries for the separation offour model proteins in less than 1 min.128 A low-conductivity buffer (0.38% (w/v) polyoxyethylene bis-(3-amino-2-hydroxypropyl)-0.031% (w/v) polyoxyeth-ylene bis(acetic acid), pH 8.6) was also used to allowapplication of a 2000 V/cm electric field over a 15 cmlong capillary with a 50 µm i.d.
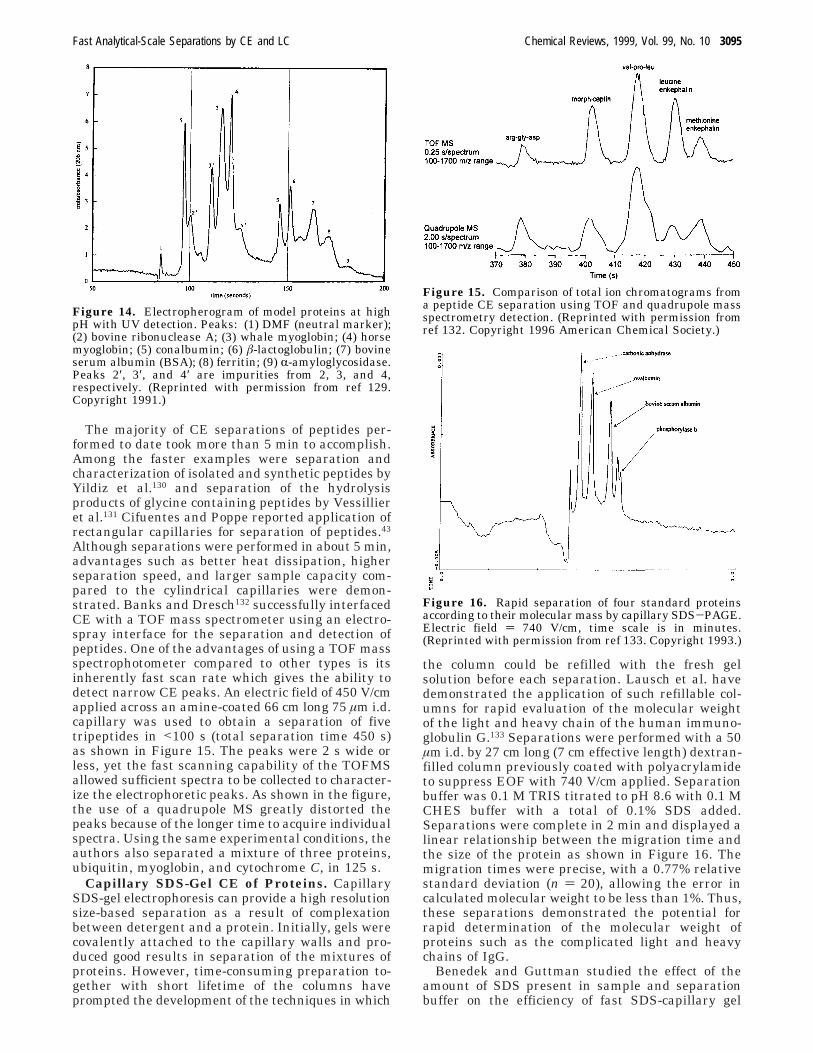
It is known that high-pH separation buffers candecrease the number of positively charged moietieson the surface of the protein and prevent electrostaticadsorption. The downside of this method is increasingseparation time due to developing of more negativecharge on the surface of proteins. Figure 14 il-lustrates separation of eight proteins in less than 200s in an untreated fused silica capillary using 150 mMborate buffer at pH 10.5 in a 25 cm long by 25 µmi.d. capillary with 15 kV applied.129 If the pH wasincreased to 11.5 better separation efficiency wasachieved; however, the separation time was increasedto about 350 s.
Figure 13. Fast MEKC of amino acids. The electrophero-grams were obtained utilizing the flow-gated interface. (A)Sample obtained by microdialysis from the rat caudatenucleus. E ) 600 V/cm, l ) 10 cm. (B) Sample obtained bymicrodialysis from the rat caudate nucleus. E ) 400 V/cm,l ) 15 cm. (C) Standard samples. E ) 400 V/cm, l ) 15cm. Peak labels as follows: (1) glutamine, (2) serine/threonine, (3) alanine/glycine, (4) tyrosine, (5) taurine, (6)valine, (7) glutamate, (8) methionine, (9) aspartate, (10)leucine, (11) phenylalanine, (12) isoleucine, and (13) lysine.Impurities and reagent peaks are labeled with an asterisk,while unidentified peaks are unlabeled. (Reprinted withpermission from ref 71. Copyright 1996 American ChemicalSociety.)
3094 Chemical Reviews, 1999, Vol. 99, No. 10 Kennedy et al.
The majority of CE separations of peptides per-formed to date took more than 5 min to accomplish.Among the faster examples were separation andcharacterization of isolated and synthetic peptides byYildiz et al.130 and separation of the hydrolysisproducts of glycine containing peptides by Vessillieret al.131 Cifuentes and Poppe reported application ofrectangular capillaries for separation of peptides.43
Although separations were performed in about 5 min,advantages such as better heat dissipation, higherseparation speed, and larger sample capacity com-pared to the cylindrical capillaries were demon-strated. Banks and Dresch132 successfully interfacedCE with a TOF mass spectrometer using an electro-spray interface for the separation and detection ofpeptides. One of the advantages of using a TOF massspectrophotometer compared to other types is itsinherently fast scan rate which gives the ability todetect narrow CE peaks. An electric field of 450 V/cmapplied across an amine-coated 66 cm long 75 µm i.d.capillary was used to obtain a separation of fivetripeptides in <100 s (total separation time 450 s)as shown in Figure 15. The peaks were 2 s wide orless, yet the fast scanning capability of the TOFMSallowed sufficient spectra to be collected to character-ize the electrophoretic peaks. As shown in the figure,the use of a quadrupole MS greatly distorted thepeaks because of the longer time to acquire individualspectra. Using the same experimental conditions, theauthors also separated a mixture of three proteins,ubiquitin, myoglobin, and cytochrome C, in 125 s.
Capillary SDS-Gel CE of Proteins. CapillarySDS-gel electrophoresis can provide a high resolutionsize-based separation as a result of complexationbetween detergent and a protein. Initially, gels werecovalently attached to the capillary walls and pro-duced good results in separation of the mixtures ofproteins. However, time-consuming preparation to-gether with short lifetime of the columns haveprompted the development of the techniques in which
the column could be refilled with the fresh gelsolution before each separation. Lausch et al. havedemonstrated the application of such refillable col-umns for rapid evaluation of the molecular weightof the light and heavy chain of the human immuno-globulin G.133 Separations were performed with a 50µm i.d. by 27 cm long (7 cm effective length) dextran-filled column previously coated with polyacrylamideto suppress EOF with 740 V/cm applied. Separationbuffer was 0.1 M TRIS titrated to pH 8.6 with 0.1 MCHES buffer with a total of 0.1% SDS added.Separations were complete in 2 min and displayed alinear relationship between the migration time andthe size of the protein as shown in Figure 16. Themigration times were precise, with a 0.77% relativestandard deviation (n ) 20), allowing the error incalculated molecular weight to be less than 1%. Thus,these separations demonstrated the potential forrapid determination of the molecular weight ofproteins such as the complicated light and heavychains of IgG.
Benedek and Guttman studied the effect of theamount of SDS present in sample and separationbuffer on the efficiency of fast SDS-capillary gel
Figure 14. Electropherogram of model proteins at highpH with UV detection. Peaks: (1) DMF (neutral marker);(2) bovine ribonuclease A; (3) whale myoglobin; (4) horsemyoglobin; (5) conalbumin; (6) â-lactoglobulin; (7) bovineserum albumin (BSA); (8) ferritin; (9) R-amyloglycosidase.Peaks 2′, 3′, and 4′ are impurities from 2, 3, and 4,respectively. (Reprinted with permission from ref 129.Copyright 1991.)
Figure 15. Comparison of total ion chromatograms froma peptide CE separation using TOF and quadrupole massspectrometry detection. (Reprinted with permission fromref 132. Copyright 1996 American Chemical Society.)
Figure 16. Rapid separation of four standard proteinsaccording to their molecular mass by capillary SDS-PAGE.Electric field ) 740 V/cm, time scale is in minutes.(Reprinted with permission from ref 133. Copyright 1993.)
Fast Analytical-Scale Separations by CE and LC Chemical Reviews, 1999, Vol. 99, No. 10 3095
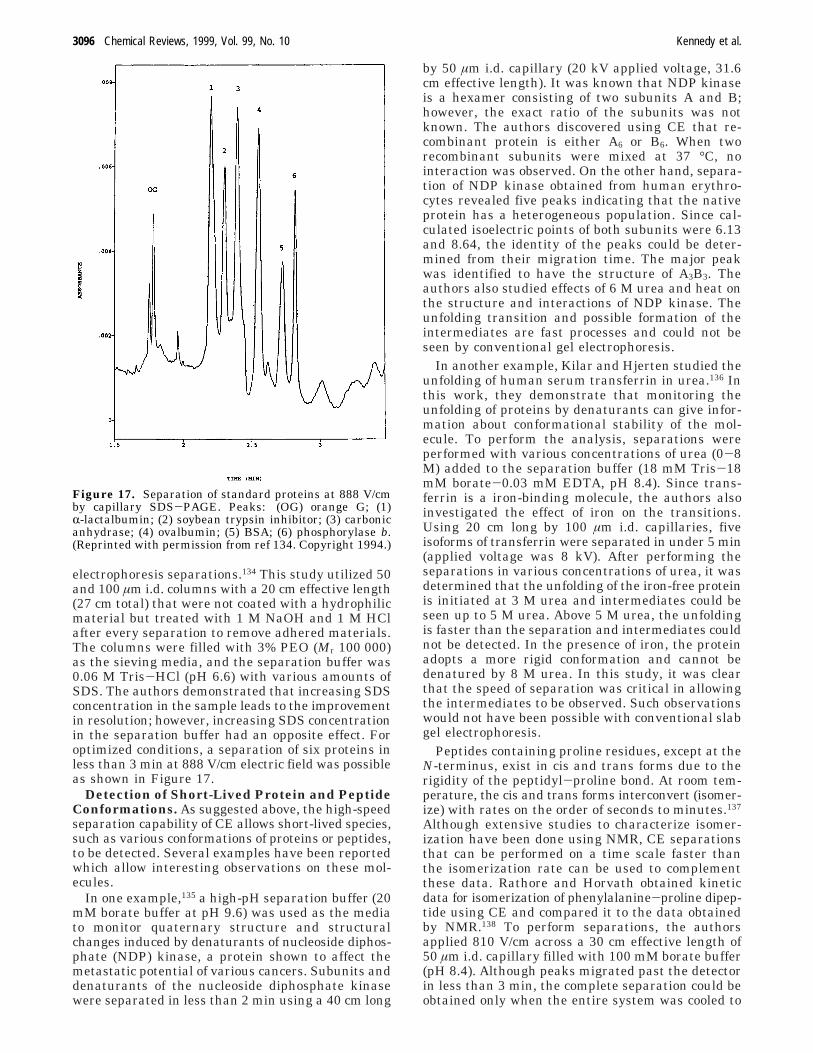
electrophoresis separations.134 This study utilized 50and 100 µm i.d. columns with a 20 cm effective length(27 cm total) that were not coated with a hydrophilicmaterial but treated with 1 M NaOH and 1 M HClafter every separation to remove adhered materials.The columns were filled with 3% PEO (Mr 100 000)as the sieving media, and the separation buffer was0.06 M Tris-HCl (pH 6.6) with various amounts ofSDS. The authors demonstrated that increasing SDSconcentration in the sample leads to the improvementin resolution; however, increasing SDS concentrationin the separation buffer had an opposite effect. Foroptimized conditions, a separation of six proteins inless than 3 min at 888 V/cm electric field was possibleas shown in Figure 17.
Detection of Short-Lived Protein and PeptideConformations. As suggested above, the high-speedseparation capability of CE allows short-lived species,such as various conformations of proteins or peptides,to be detected. Several examples have been reportedwhich allow interesting observations on these mol-ecules.
In one example,135 a high-pH separation buffer (20mM borate buffer at pH 9.6) was used as the mediato monitor quaternary structure and structuralchanges induced by denaturants of nucleoside diphos-phate (NDP) kinase, a protein shown to affect themetastatic potential of various cancers. Subunits anddenaturants of the nucleoside diphosphate kinasewere separated in less than 2 min using a 40 cm long
by 50 µm i.d. capillary (20 kV applied voltage, 31.6cm effective length). It was known that NDP kinaseis a hexamer consisting of two subunits A and B;however, the exact ratio of the subunits was notknown. The authors discovered using CE that re-combinant protein is either A6 or B6. When tworecombinant subunits were mixed at 37 °C, nointeraction was observed. On the other hand, separa-tion of NDP kinase obtained from human erythro-cytes revealed five peaks indicating that the nativeprotein has a heterogeneous population. Since cal-culated isoelectric points of both subunits were 6.13and 8.64, the identity of the peaks could be deter-mined from their migration time. The major peakwas identified to have the structure of A3B3. Theauthors also studied effects of 6 M urea and heat onthe structure and interactions of NDP kinase. Theunfolding transition and possible formation of theintermediates are fast processes and could not beseen by conventional gel electrophoresis.
In another example, Kilar and Hjerten studied theunfolding of human serum transferrin in urea.136 Inthis work, they demonstrate that monitoring theunfolding of proteins by denaturants can give infor-mation about conformational stability of the mol-ecule. To perform the analysis, separations wereperformed with various concentrations of urea (0-8M) added to the separation buffer (18 mM Tris-18mM borate-0.03 mM EDTA, pH 8.4). Since trans-ferrin is a iron-binding molecule, the authors alsoinvestigated the effect of iron on the transitions.Using 20 cm long by 100 µm i.d. capillaries, fiveisoforms of transferrin were separated in under 5 min(applied voltage was 8 kV). After performing theseparations in various concentrations of urea, it wasdetermined that the unfolding of the iron-free proteinis initiated at 3 M urea and intermediates could beseen up to 5 M urea. Above 5 M urea, the unfoldingis faster than the separation and intermediates couldnot be detected. In the presence of iron, the proteinadopts a more rigid conformation and cannot bedenatured by 8 M urea. In this study, it was clearthat the speed of separation was critical in allowingthe intermediates to be observed. Such observationswould not have been possible with conventional slabgel electrophoresis.
Peptides containing proline residues, except at theN-terminus, exist in cis and trans forms due to therigidity of the peptidyl-proline bond. At room tem-perature, the cis and trans forms interconvert (isomer-ize) with rates on the order of seconds to minutes.137
Although extensive studies to characterize isomer-ization have been done using NMR, CE separationsthat can be performed on a time scale faster thanthe isomerization rate can be used to complementthese data. Rathore and Horvath obtained kineticdata for isomerization of phenylalanine-proline dipep-tide using CE and compared it to the data obtainedby NMR.138 To perform separations, the authorsapplied 810 V/cm across a 30 cm effective length of50 µm i.d. capillary filled with 100 mM borate buffer(pH 8.4). Although peaks migrated past the detectorin less than 3 min, the complete separation could beobtained only when the entire system was cooled to
Figure 17. Separation of standard proteins at 888 V/cmby capillary SDS-PAGE. Peaks: (OG) orange G; (1)R-lactalbumin; (2) soybean trypsin inhibitor; (3) carbonicanhydrase; (4) ovalbumin; (5) BSA; (6) phosphorylase b.(Reprinted with permission from ref 134. Copyright 1994.)
3096 Chemical Reviews, 1999, Vol. 99, No. 10 Kennedy et al.
1.5 °C to slow the isomerization rate. At highertemperatures, a bridge forms between the two peaks,indicating interconversion during the separation. Theauthors used simulation techniques to determinekinetic parameters from peak shapes and obtainedresults that were in good agreement with NMR data(average error less than 5%).
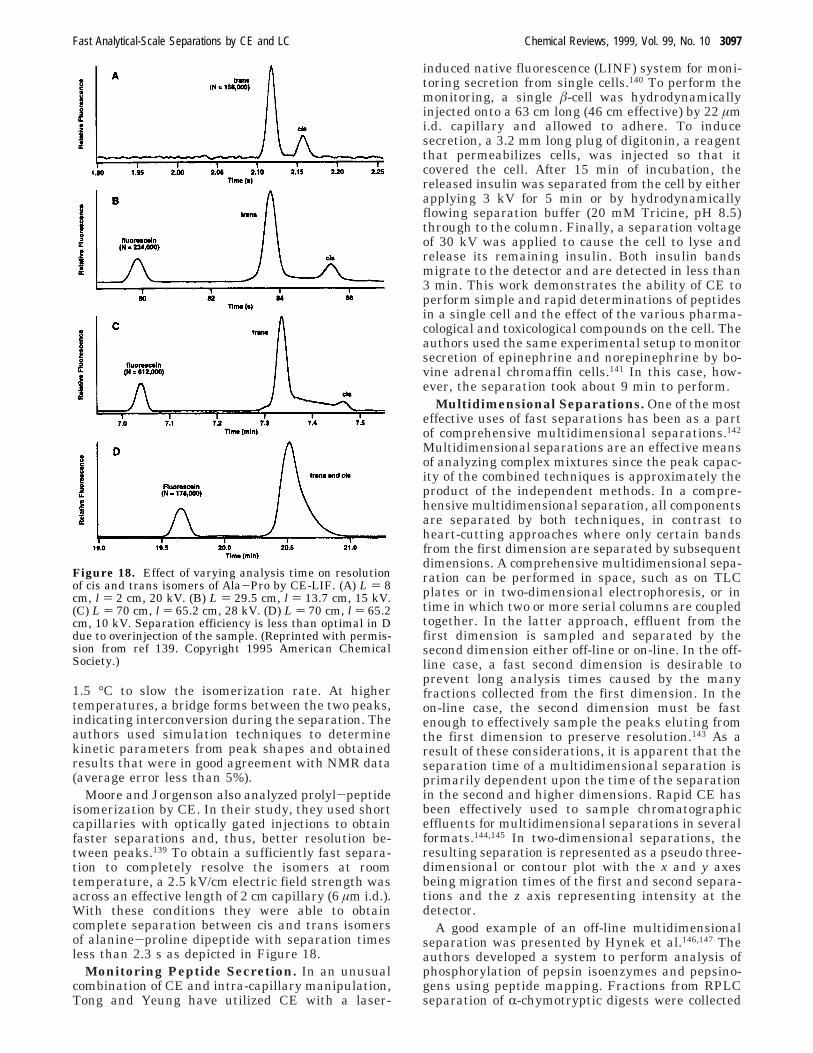
Moore and Jorgenson also analyzed prolyl-peptideisomerization by CE. In their study, they used shortcapillaries with optically gated injections to obtainfaster separations and, thus, better resolution be-tween peaks.139 To obtain a sufficiently fast separa-tion to completely resolve the isomers at roomtemperature, a 2.5 kV/cm electric field strength wasacross an effective length of 2 cm capillary (6 µm i.d.).With these conditions they were able to obtaincomplete separation between cis and trans isomersof alanine-proline dipeptide with separation timesless than 2.3 s as depicted in Figure 18.
Monitoring Peptide Secretion. In an unusualcombination of CE and intra-capillary manipulation,Tong and Yeung have utilized CE with a laser-
induced native fluorescence (LINF) system for moni-toring secretion from single cells.140 To perform themonitoring, a single â-cell was hydrodynamicallyinjected onto a 63 cm long (46 cm effective) by 22 µmi.d. capillary and allowed to adhere. To inducesecretion, a 3.2 mm long plug of digitonin, a reagentthat permeabilizes cells, was injected so that itcovered the cell. After 15 min of incubation, thereleased insulin was separated from the cell by eitherapplying 3 kV for 5 min or by hydrodynamicallyflowing separation buffer (20 mM Tricine, pH 8.5)through to the column. Finally, a separation voltageof 30 kV was applied to cause the cell to lyse andrelease its remaining insulin. Both insulin bandsmigrate to the detector and are detected in less than3 min. This work demonstrates the ability of CE toperform simple and rapid determinations of peptidesin a single cell and the effect of the various pharma-cological and toxicological compounds on the cell. Theauthors used the same experimental setup to monitorsecretion of epinephrine and norepinephrine by bo-vine adrenal chromaffin cells.141 In this case, how-ever, the separation took about 9 min to perform.
Multidimensional Separations. One of the mosteffective uses of fast separations has been as a partof comprehensive multidimensional separations.142
Multidimensional separations are an effective meansof analyzing complex mixtures since the peak capac-ity of the combined techniques is approximately theproduct of the independent methods. In a compre-hensive multidimensional separation, all componentsare separated by both techniques, in contrast toheart-cutting approaches where only certain bandsfrom the first dimension are separated by subsequentdimensions. A comprehensive multidimensional sepa-ration can be performed in space, such as on TLCplates or in two-dimensional electrophoresis, or intime in which two or more serial columns are coupledtogether. In the latter approach, effluent from thefirst dimension is sampled and separated by thesecond dimension either off-line or on-line. In the off-line case, a fast second dimension is desirable toprevent long analysis times caused by the manyfractions collected from the first dimension. In theon-line case, the second dimension must be fastenough to effectively sample the peaks eluting fromthe first dimension to preserve resolution.143 As aresult of these considerations, it is apparent that theseparation time of a multidimensional separation isprimarily dependent upon the time of the separationin the second and higher dimensions. Rapid CE hasbeen effectively used to sample chromatographiceffluents for multidimensional separations in severalformats.144,145 In two-dimensional separations, theresulting separation is represented as a pseudo three-dimensional or contour plot with the x and y axesbeing migration times of the first and second separa-tions and the z axis representing intensity at thedetector.
A good example of an off-line multidimensionalseparation was presented by Hynek et al.146,147 Theauthors developed a system to perform analysis ofphosphorylation of pepsin isoenzymes and pepsino-gens using peptide mapping. Fractions from RPLCseparation of R-chymotryptic digests were collected
Figure 18. Effect of varying analysis time on resolutionof cis and trans isomers of Ala-Pro by CE-LIF. (A) L ) 8cm, l ) 2 cm, 20 kV. (B) L ) 29.5 cm, l ) 13.7 cm, 15 kV.(C) L ) 70 cm, l ) 65.2 cm, 28 kV. (D) L ) 70 cm, l ) 65.2cm, 10 kV. Separation efficiency is less than optimal in Ddue to overinjection of the sample. (Reprinted with permis-sion from ref 139. Copyright 1995 American ChemicalSociety.)
Fast Analytical-Scale Separations by CE and LC Chemical Reviews, 1999, Vol. 99, No. 10 3097
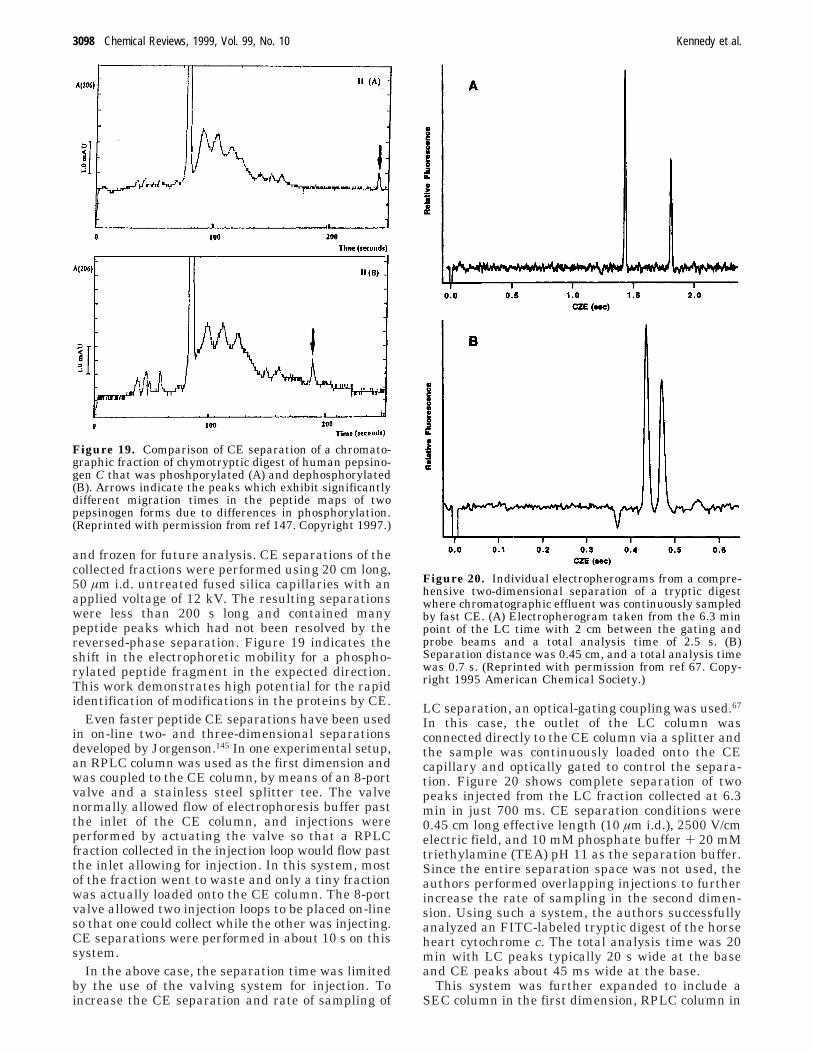
and frozen for future analysis. CE separations of thecollected fractions were performed using 20 cm long,50 µm i.d. untreated fused silica capillaries with anapplied voltage of 12 kV. The resulting separationswere less than 200 s long and contained manypeptide peaks which had not been resolved by thereversed-phase separation. Figure 19 indicates theshift in the electrophoretic mobility for a phospho-rylated peptide fragment in the expected direction.This work demonstrates high potential for the rapididentification of modifications in the proteins by CE.
Even faster peptide CE separations have been usedin on-line two- and three-dimensional separationsdeveloped by Jorgenson.145 In one experimental setup,an RPLC column was used as the first dimension andwas coupled to the CE column, by means of an 8-portvalve and a stainless steel splitter tee. The valvenormally allowed flow of electrophoresis buffer pastthe inlet of the CE column, and injections wereperformed by actuating the valve so that a RPLCfraction collected in the injection loop would flow pastthe inlet allowing for injection. In this system, mostof the fraction went to waste and only a tiny fractionwas actually loaded onto the CE column. The 8-portvalve allowed two injection loops to be placed on-lineso that one could collect while the other was injecting.CE separations were performed in about 10 s on thissystem.
In the above case, the separation time was limitedby the use of the valving system for injection. Toincrease the CE separation and rate of sampling of
LC separation, an optical-gating coupling was used.67
In this case, the outlet of the LC column wasconnected directly to the CE column via a splitter andthe sample was continuously loaded onto the CEcapillary and optically gated to control the separa-tion. Figure 20 shows complete separation of twopeaks injected from the LC fraction collected at 6.3min in just 700 ms. CE separation conditions were0.45 cm long effective length (10 µm i.d.), 2500 V/cmelectric field, and 10 mM phosphate buffer + 20 mMtriethylamine (TEA) pH 11 as the separation buffer.Since the entire separation space was not used, theauthors performed overlapping injections to furtherincrease the rate of sampling in the second dimen-sion. Using such a system, the authors successfullyanalyzed an FITC-labeled tryptic digest of the horseheart cytochrome c. The total analysis time was 20min with LC peaks typically 20 s wide at the baseand CE peaks about 45 ms wide at the base.
This system was further expanded to include aSEC column in the first dimension, RPLC column in
Figure 19. Comparison of CE separation of a chromato-graphic fraction of chymotryptic digest of human pepsino-gen C that was phoshporylated (A) and dephosphorylated(B). Arrows indicate the peaks which exhibit significantlydifferent migration times in the peptide maps of twopepsinogen forms due to differences in phosphorylation.(Reprinted with permission from ref 147. Copyright 1997.)
Figure 20. Individual electropherograms from a compre-hensive two-dimensional separation of a tryptic digestwhere chromatographic effluent was continuously sampledby fast CE. (A) Electropherogram taken from the 6.3 minpoint of the LC time with 2 cm between the gating andprobe beams and a total analysis time of 2.5 s. (B)Separation distance was 0.45 cm, and a total analysis timewas 0.7 s. (Reprinted with permission from ref 67. Copy-right 1995 American Chemical Society.)
3098 Chemical Reviews, 1999, Vol. 99, No. 10 Kennedy et al.
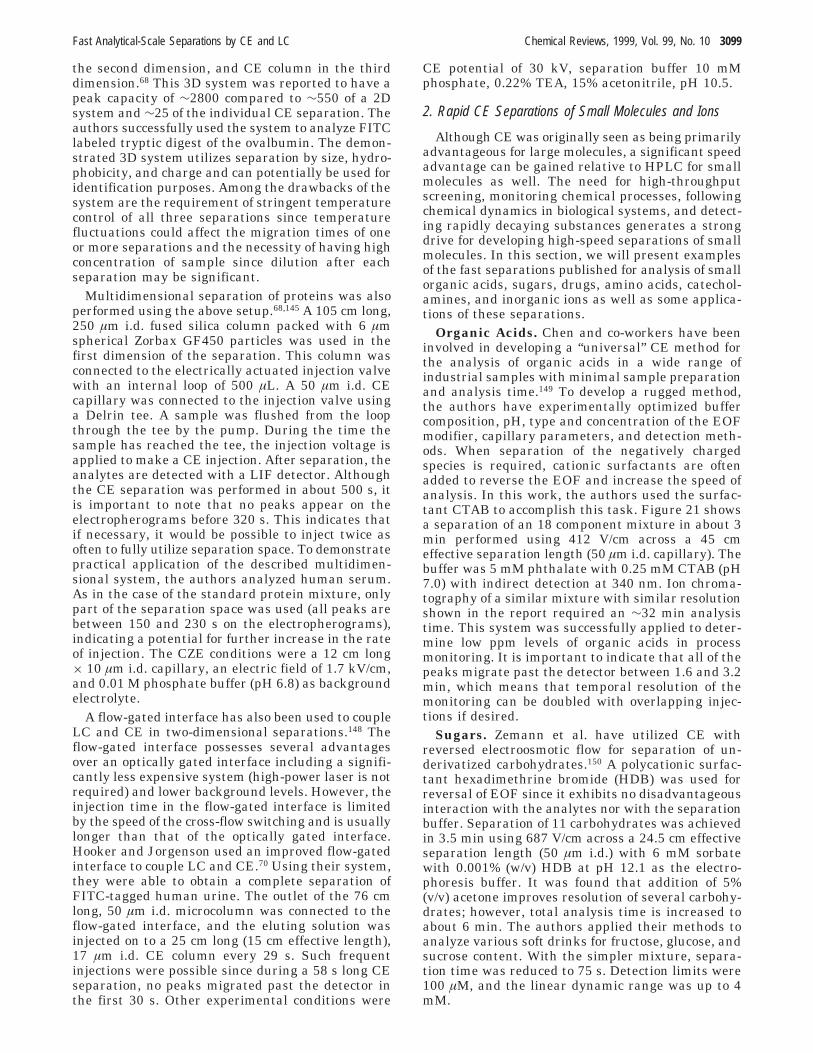
the second dimension, and CE column in the thirddimension.68 This 3D system was reported to have apeak capacity of ∼2800 compared to ∼550 of a 2Dsystem and ∼25 of the individual CE separation. Theauthors successfully used the system to analyze FITClabeled tryptic digest of the ovalbumin. The demon-strated 3D system utilizes separation by size, hydro-phobicity, and charge and can potentially be used foridentification purposes. Among the drawbacks of thesystem are the requirement of stringent temperaturecontrol of all three separations since temperaturefluctuations could affect the migration times of oneor more separations and the necessity of having highconcentration of sample since dilution after eachseparation may be significant.
Multidimensional separation of proteins was alsoperformed using the above setup.68,145 A 105 cm long,250 µm i.d. fused silica column packed with 6 µmspherical Zorbax GF450 particles was used in thefirst dimension of the separation. This column wasconnected to the electrically actuated injection valvewith an internal loop of 500 µL. A 50 µm i.d. CEcapillary was connected to the injection valve usinga Delrin tee. A sample was flushed from the loopthrough the tee by the pump. During the time thesample has reached the tee, the injection voltage isapplied to make a CE injection. After separation, theanalytes are detected with a LIF detector. Althoughthe CE separation was performed in about 500 s, itis important to note that no peaks appear on theelectropherograms before 320 s. This indicates thatif necessary, it would be possible to inject twice asoften to fully utilize separation space. To demonstratepractical application of the described multidimen-sional system, the authors analyzed human serum.As in the case of the standard protein mixture, onlypart of the separation space was used (all peaks arebetween 150 and 230 s on the electropherograms),indicating a potential for further increase in the rateof injection. The CZE conditions were a 12 cm long× 10 µm i.d. capillary, an electric field of 1.7 kV/cm,and 0.01 M phosphate buffer (pH 6.8) as backgroundelectrolyte.
A flow-gated interface has also been used to coupleLC and CE in two-dimensional separations.148 Theflow-gated interface possesses several advantagesover an optically gated interface including a signifi-cantly less expensive system (high-power laser is notrequired) and lower background levels. However, theinjection time in the flow-gated interface is limitedby the speed of the cross-flow switching and is usuallylonger than that of the optically gated interface.Hooker and Jorgenson used an improved flow-gatedinterface to couple LC and CE.70 Using their system,they were able to obtain a complete separation ofFITC-tagged human urine. The outlet of the 76 cmlong, 50 µm i.d. microcolumn was connected to theflow-gated interface, and the eluting solution wasinjected on to a 25 cm long (15 cm effective length),17 µm i.d. CE column every 29 s. Such frequentinjections were possible since during a 58 s long CEseparation, no peaks migrated past the detector inthe first 30 s. Other experimental conditions were
CE potential of 30 kV, separation buffer 10 mMphosphate, 0.22% TEA, 15% acetonitrile, pH 10.5.
2. Rapid CE Separations of Small Molecules and Ions
Although CE was originally seen as being primarilyadvantageous for large molecules, a significant speedadvantage can be gained relative to HPLC for smallmolecules as well. The need for high-throughputscreening, monitoring chemical processes, followingchemical dynamics in biological systems, and detect-ing rapidly decaying substances generates a strongdrive for developing high-speed separations of smallmolecules. In this section, we will present examplesof the fast separations published for analysis of smallorganic acids, sugars, drugs, amino acids, catechol-amines, and inorganic ions as well as some applica-tions of these separations.
Organic Acids. Chen and co-workers have beeninvolved in developing a “universal” CE method forthe analysis of organic acids in a wide range ofindustrial samples with minimal sample preparationand analysis time.149 To develop a rugged method,the authors have experimentally optimized buffercomposition, pH, type and concentration of the EOFmodifier, capillary parameters, and detection meth-ods. When separation of the negatively chargedspecies is required, cationic surfactants are oftenadded to reverse the EOF and increase the speed ofanalysis. In this work, the authors used the surfac-tant CTAB to accomplish this task. Figure 21 showsa separation of an 18 component mixture in about 3min performed using 412 V/cm across a 45 cmeffective separation length (50 µm i.d. capillary). Thebuffer was 5 mM phthalate with 0.25 mM CTAB (pH7.0) with indirect detection at 340 nm. Ion chroma-tography of a similar mixture with similar resolutionshown in the report required an ∼32 min analysistime. This system was successfully applied to deter-mine low ppm levels of organic acids in processmonitoring. It is important to indicate that all of thepeaks migrate past the detector between 1.6 and 3.2min, which means that temporal resolution of themonitoring can be doubled with overlapping injec-tions if desired.
Sugars. Zemann et al. have utilized CE withreversed electroosmotic flow for separation of un-derivatized carbohydrates.150 A polycationic surfac-tant hexadimethrine bromide (HDB) was used forreversal of EOF since it exhibits no disadvantageousinteraction with the analytes nor with the separationbuffer. Separation of 11 carbohydrates was achievedin 3.5 min using 687 V/cm across a 24.5 cm effectiveseparation length (50 µm i.d.) with 6 mM sorbatewith 0.001% (w/v) HDB at pH 12.1 as the electro-phoresis buffer. It was found that addition of 5%(v/v) acetone improves resolution of several carbohy-drates; however, total analysis time is increased toabout 6 min. The authors applied their methods toanalyze various soft drinks for fructose, glucose, andsucrose content. With the simpler mixture, separa-tion time was reduced to 75 s. Detection limits were100 µM, and the linear dynamic range was up to 4mM.
Fast Analytical-Scale Separations by CE and LC Chemical Reviews, 1999, Vol. 99, No. 10 3099
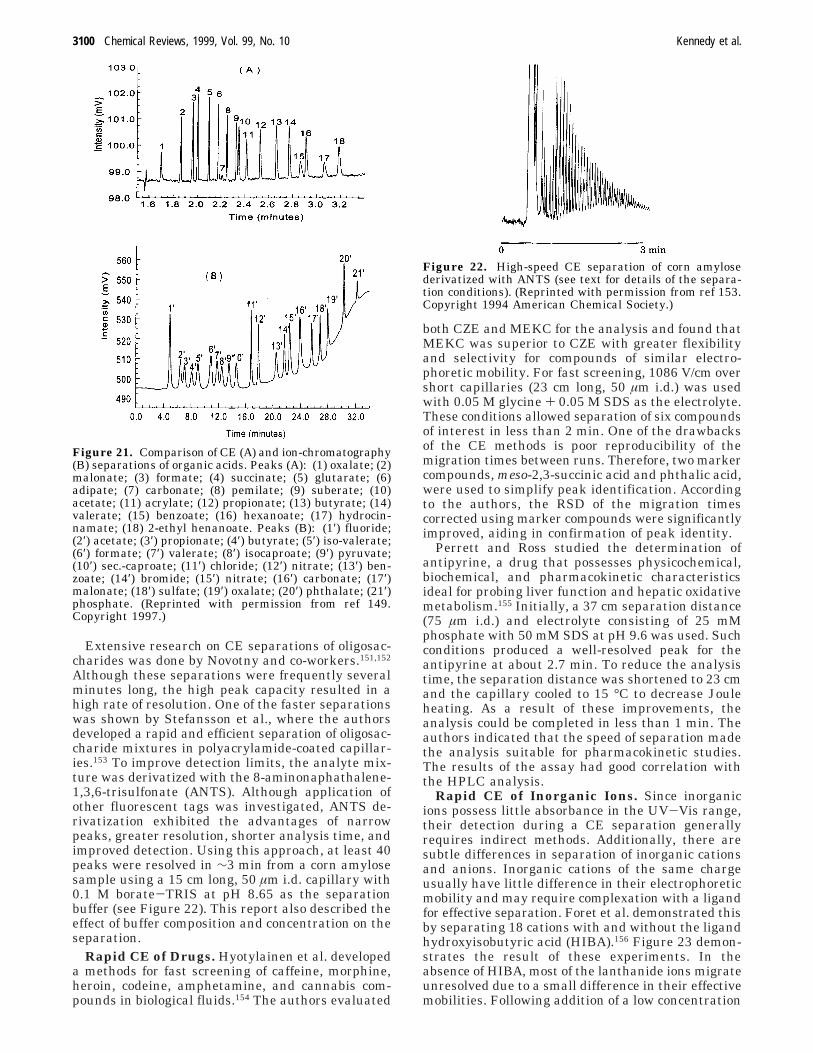
Extensive research on CE separations of oligosac-charides was done by Novotny and co-workers.151,152
Although these separations were frequently severalminutes long, the high peak capacity resulted in ahigh rate of resolution. One of the faster separationswas shown by Stefansson et al., where the authorsdeveloped a rapid and efficient separation of oligosac-charide mixtures in polyacrylamide-coated capillar-ies.153 To improve detection limits, the analyte mix-ture was derivatized with the 8-aminonaphathalene-1,3,6-trisulfonate (ANTS). Although application ofother fluorescent tags was investigated, ANTS de-rivatization exhibited the advantages of narrowpeaks, greater resolution, shorter analysis time, andimproved detection. Using this approach, at least 40peaks were resolved in ∼3 min from a corn amylosesample using a 15 cm long, 50 µm i.d. capillary with0.1 M borate-TRIS at pH 8.65 as the separationbuffer (see Figure 22). This report also described theeffect of buffer composition and concentration on theseparation.
Rapid CE of Drugs. Hyotylainen et al. developeda methods for fast screening of caffeine, morphine,heroin, codeine, amphetamine, and cannabis com-pounds in biological fluids.154 The authors evaluated
both CZE and MEKC for the analysis and found thatMEKC was superior to CZE with greater flexibilityand selectivity for compounds of similar electro-phoretic mobility. For fast screening, 1086 V/cm overshort capillaries (23 cm long, 50 µm i.d.) was usedwith 0.05 M glycine + 0.05 M SDS as the electrolyte.These conditions allowed separation of six compoundsof interest in less than 2 min. One of the drawbacksof the CE methods is poor reproducibility of themigration times between runs. Therefore, two markercompounds, meso-2,3-succinic acid and phthalic acid,were used to simplify peak identification. Accordingto the authors, the RSD of the migration timescorrected using marker compounds were significantlyimproved, aiding in confirmation of peak identity.
Perrett and Ross studied the determination ofantipyrine, a drug that possesses physicochemical,biochemical, and pharmacokinetic characteristicsideal for probing liver function and hepatic oxidativemetabolism.155 Initially, a 37 cm separation distance(75 µm i.d.) and electrolyte consisting of 25 mMphosphate with 50 mM SDS at pH 9.6 was used. Suchconditions produced a well-resolved peak for theantipyrine at about 2.7 min. To reduce the analysistime, the separation distance was shortened to 23 cmand the capillary cooled to 15 °C to decrease Jouleheating. As a result of these improvements, theanalysis could be completed in less than 1 min. Theauthors indicated that the speed of separation madethe analysis suitable for pharmacokinetic studies.The results of the assay had good correlation withthe HPLC analysis.
Rapid CE of Inorganic Ions. Since inorganicions possess little absorbance in the UV-Vis range,their detection during a CE separation generallyrequires indirect methods. Additionally, there aresubtle differences in separation of inorganic cationsand anions. Inorganic cations of the same chargeusually have little difference in their electrophoreticmobility and may require complexation with a ligandfor effective separation. Foret et al. demonstrated thisby separating 18 cations with and without the ligandhydroxyisobutyric acid (HIBA).156 Figure 23 demon-strates the result of these experiments. In theabsence of HIBA, most of the lanthanide ions migrateunresolved due to a small difference in their effectivemobilities. Following addition of a low concentration
Figure 21. Comparison of CE (A) and ion-chromatography(B) separations of organic acids. Peaks (A): (1) oxalate; (2)malonate; (3) formate; (4) succinate; (5) glutarate; (6)adipate; (7) carbonate; (8) pemilate; (9) suberate; (10)acetate; (11) acrylate; (12) propionate; (13) butyrate; (14)valerate; (15) benzoate; (16) hexanoate; (17) hydrocin-namate; (18) 2-ethyl henanoate. Peaks (B): (1′) fluoride;(2′) acetate; (3′) propionate; (4′) butyrate; (5′) iso-valerate;(6′) formate; (7′) valerate; (8′) isocaproate; (9′) pyruvate;(10′) sec.-caproate; (11′) chloride; (12′) nitrate; (13′) ben-zoate; (14′) bromide; (15′) nitrate; (16′) carbonate; (17′)malonate; (18′) sulfate; (19′) oxalate; (20′) phthalate; (21′)phosphate. (Reprinted with permission from ref 149.Copyright 1997.)
Figure 22. High-speed CE separation of corn amylosederivatized with ANTS (see text for details of the separa-tion conditions). (Reprinted with permission from ref 153.Copyright 1994 American Chemical Society.)
3100 Chemical Reviews, 1999, Vol. 99, No. 10 Kennedy et al.
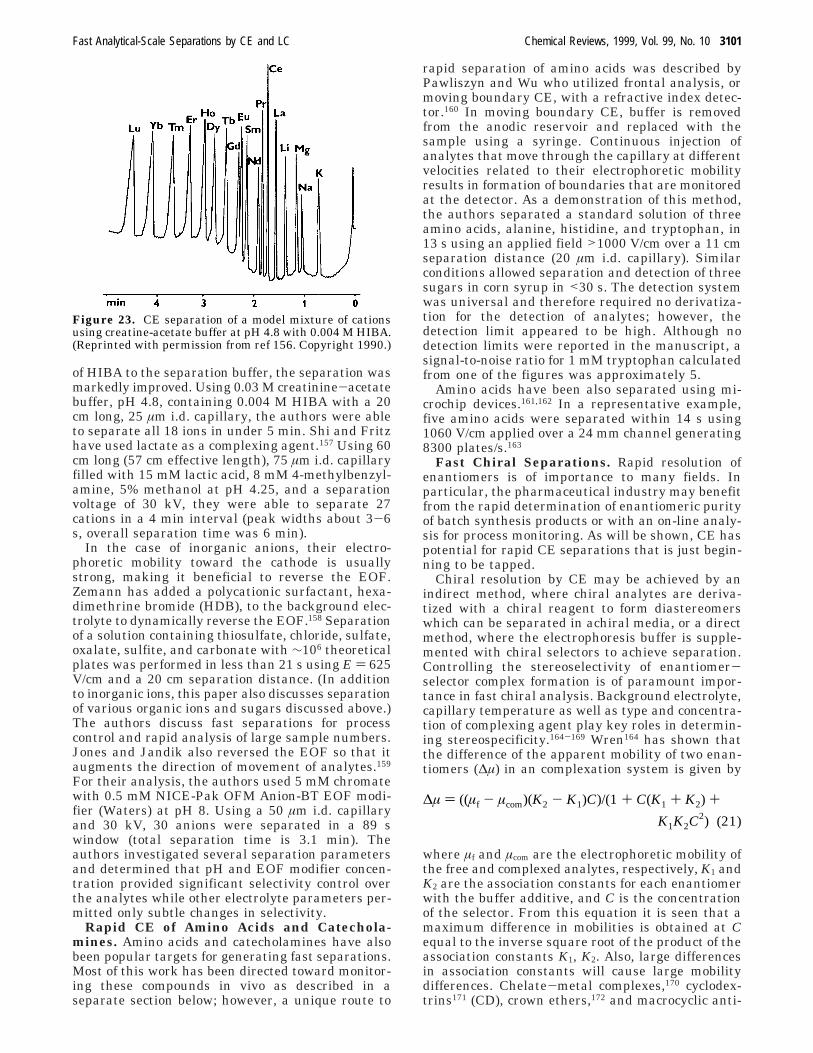
of HIBA to the separation buffer, the separation wasmarkedly improved. Using 0.03 M creatinine-acetatebuffer, pH 4.8, containing 0.004 M HIBA with a 20cm long, 25 µm i.d. capillary, the authors were ableto separate all 18 ions in under 5 min. Shi and Fritzhave used lactate as a complexing agent.157 Using 60cm long (57 cm effective length), 75 µm i.d. capillaryfilled with 15 mM lactic acid, 8 mM 4-methylbenzyl-amine, 5% methanol at pH 4.25, and a separationvoltage of 30 kV, they were able to separate 27cations in a 4 min interval (peak widths about 3-6s, overall separation time was 6 min).
In the case of inorganic anions, their electro-phoretic mobility toward the cathode is usuallystrong, making it beneficial to reverse the EOF.Zemann has added a polycationic surfactant, hexa-dimethrine bromide (HDB), to the background elec-trolyte to dynamically reverse the EOF.158 Separationof a solution containing thiosulfate, chloride, sulfate,oxalate, sulfite, and carbonate with ∼106 theoreticalplates was performed in less than 21 s using E ) 625V/cm and a 20 cm separation distance. (In additionto inorganic ions, this paper also discusses separationof various organic ions and sugars discussed above.)The authors discuss fast separations for processcontrol and rapid analysis of large sample numbers.Jones and Jandik also reversed the EOF so that itaugments the direction of movement of analytes.159
For their analysis, the authors used 5 mM chromatewith 0.5 mM NICE-Pak OFM Anion-BT EOF modi-fier (Waters) at pH 8. Using a 50 µm i.d. capillaryand 30 kV, 30 anions were separated in a 89 swindow (total separation time is 3.1 min). Theauthors investigated several separation parametersand determined that pH and EOF modifier concen-tration provided significant selectivity control overthe analytes while other electrolyte parameters per-mitted only subtle changes in selectivity.
Rapid CE of Amino Acids and Catechola-mines. Amino acids and catecholamines have alsobeen popular targets for generating fast separations.Most of this work has been directed toward monitor-ing these compounds in vivo as described in aseparate section below; however, a unique route to
rapid separation of amino acids was described byPawliszyn and Wu who utilized frontal analysis, ormoving boundary CE, with a refractive index detec-tor.160 In moving boundary CE, buffer is removedfrom the anodic reservoir and replaced with thesample using a syringe. Continuous injection ofanalytes that move through the capillary at differentvelocities related to their electrophoretic mobilityresults in formation of boundaries that are monitoredat the detector. As a demonstration of this method,the authors separated a standard solution of threeamino acids, alanine, histidine, and tryptophan, in13 s using an applied field >1000 V/cm over a 11 cmseparation distance (20 µm i.d. capillary). Similarconditions allowed separation and detection of threesugars in corn syrup in <30 s. The detection systemwas universal and therefore required no derivatiza-tion for the detection of analytes; however, thedetection limit appeared to be high. Although nodetection limits were reported in the manuscript, asignal-to-noise ratio for 1 mM tryptophan calculatedfrom one of the figures was approximately 5.
Amino acids have been also separated using mi-crochip devices.161,162 In a representative example,five amino acids were separated within 14 s using1060 V/cm applied over a 24 mm channel generating8300 plates/s.163
Fast Chiral Separations. Rapid resolution ofenantiomers is of importance to many fields. Inparticular, the pharmaceutical industry may benefitfrom the rapid determination of enantiomeric purityof batch synthesis products or with an on-line analy-sis for process monitoring. As will be shown, CE haspotential for rapid CE separations that is just begin-ning to be tapped.
Chiral resolution by CE may be achieved by anindirect method, where chiral analytes are deriva-tized with a chiral reagent to form diastereomerswhich can be separated in achiral media, or a directmethod, where the electrophoresis buffer is supple-mented with chiral selectors to achieve separation.Controlling the stereoselectivity of enantiomer-selector complex formation is of paramount impor-tance in fast chiral analysis. Background electrolyte,capillary temperature as well as type and concentra-tion of complexing agent play key roles in determin-ing stereospecificity.164-169 Wren164 has shown thatthe difference of the apparent mobility of two enan-tiomers (∆µ) in an complexation system is given by
where µf and µcom are the electrophoretic mobility ofthe free and complexed analytes, respectively, K1 andK2 are the association constants for each enantiomerwith the buffer additive, and C is the concentrationof the selector. From this equation it is seen that amaximum difference in mobilities is obtained at Cequal to the inverse square root of the product of theassociation constants K1, K2. Also, large differencesin association constants will cause large mobilitydifferences. Chelate-metal complexes,170 cyclodex-trins171 (CD), crown ethers,172 and macrocyclic anti-
Figure 23. CE separation of a model mixture of cationsusing creatine-acetate buffer at pH 4.8 with 0.004 M HIBA.(Reprinted with permission from ref 156. Copyright 1990.)
∆µ ) ((µf - µcom)(K2 - K1)C)/(1 + C(K1 + K2) +
K1K2C2) (21)
Fast Analytical-Scale Separations by CE and LC Chemical Reviews, 1999, Vol. 99, No. 10 3101
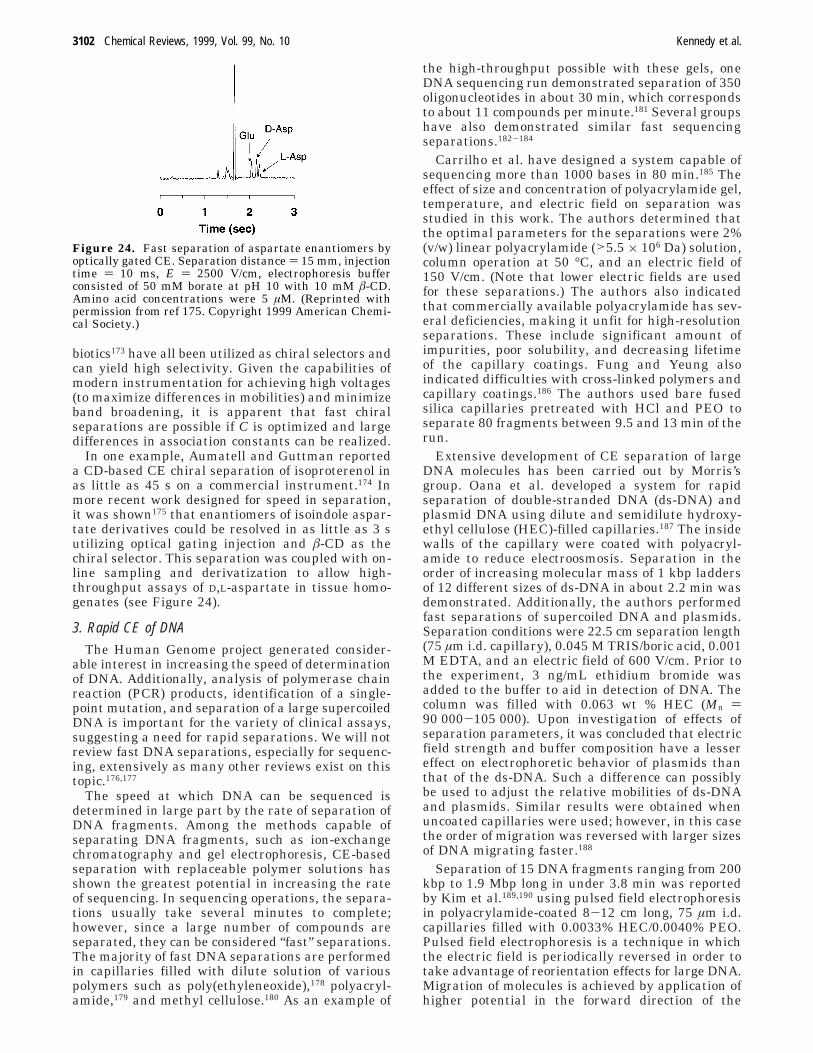
biotics173 have all been utilized as chiral selectors andcan yield high selectivity. Given the capabilities ofmodern instrumentation for achieving high voltages(to maximize differences in mobilities) and minimizeband broadening, it is apparent that fast chiralseparations are possible if C is optimized and largedifferences in association constants can be realized.
In one example, Aumatell and Guttman reporteda CD-based CE chiral separation of isoproterenol inas little as 45 s on a commercial instrument.174 Inmore recent work designed for speed in separation,it was shown175 that enantiomers of isoindole aspar-tate derivatives could be resolved in as little as 3 sutilizing optical gating injection and â-CD as thechiral selector. This separation was coupled with on-line sampling and derivatization to allow high-throughput assays of D,L-aspartate in tissue homo-genates (see Figure 24).
3. Rapid CE of DNA
The Human Genome project generated consider-able interest in increasing the speed of determinationof DNA. Additionally, analysis of polymerase chainreaction (PCR) products, identification of a single-point mutation, and separation of a large supercoiledDNA is important for the variety of clinical assays,suggesting a need for rapid separations. We will notreview fast DNA separations, especially for sequenc-ing, extensively as many other reviews exist on thistopic.176,177
The speed at which DNA can be sequenced isdetermined in large part by the rate of separation ofDNA fragments. Among the methods capable ofseparating DNA fragments, such as ion-exchangechromatography and gel electrophoresis, CE-basedseparation with replaceable polymer solutions hasshown the greatest potential in increasing the rateof sequencing. In sequencing operations, the separa-tions usually take several minutes to complete;however, since a large number of compounds areseparated, they can be considered “fast” separations.The majority of fast DNA separations are performedin capillaries filled with dilute solution of variouspolymers such as poly(ethyleneoxide),178 polyacryl-amide,179 and methyl cellulose.180 As an example of
the high-throughput possible with these gels, oneDNA sequencing run demonstrated separation of 350oligonucleotides in about 30 min, which correspondsto about 11 compounds per minute.181 Several groupshave also demonstrated similar fast sequencingseparations.182-184
Carrilho et al. have designed a system capable ofsequencing more than 1000 bases in 80 min.185 Theeffect of size and concentration of polyacrylamide gel,temperature, and electric field on separation wasstudied in this work. The authors determined thatthe optimal parameters for the separations were 2%(v/w) linear polyacrylamide (>5.5 × 10⁶ Da) solution,column operation at 50 °C, and an electric field of150 V/cm. (Note that lower electric fields are usedfor these separations.) The authors also indicatedthat commercially available polyacrylamide has sev-eral deficiencies, making it unfit for high-resolutionseparations. These include significant amount ofimpurities, poor solubility, and decreasing lifetimeof the capillary coatings. Fung and Yeung alsoindicated difficulties with cross-linked polymers andcapillary coatings.186 The authors used bare fusedsilica capillaries pretreated with HCl and PEO toseparate 80 fragments between 9.5 and 13 min of therun.
Extensive development of CE separation of largeDNA molecules has been carried out by Morris’sgroup. Oana et al. developed a system for rapidseparation of double-stranded DNA (ds-DNA) andplasmid DNA using dilute and semidilute hydroxy-ethyl cellulose (HEC)-filled capillaries.187 The insidewalls of the capillary were coated with polyacryl-amide to reduce electroosmosis. Separation in theorder of increasing molecular mass of 1 kbp laddersof 12 different sizes of ds-DNA in about 2.2 min wasdemonstrated. Additionally, the authors performedfast separations of supercoiled DNA and plasmids.Separation conditions were 22.5 cm separation length(75 µm i.d. capillary), 0.045 M TRIS/boric acid, 0.001M EDTA, and an electric field of 600 V/cm. Prior tothe experiment, 3 ng/mL ethidium bromide wasadded to the buffer to aid in detection of DNA. Thecolumn was filled with 0.063 wt % HEC (Mn )90 000-105 000). Upon investigation of effects ofseparation parameters, it was concluded that electricfield strength and buffer composition have a lessereffect on electrophoretic behavior of plasmids thanthat of the ds-DNA. Such a difference can possiblybe used to adjust the relative mobilities of ds-DNAand plasmids. Similar results were obtained whenuncoated capillaries were used; however, in this casethe order of migration was reversed with larger sizesof DNA migrating faster.188
Separation of 15 DNA fragments ranging from 200kbp to 1.9 Mbp long in under 3.8 min was reportedby Kim et al.189,190 using pulsed field electrophoresisin polyacrylamide-coated 8-12 cm long, 75 µm i.d.capillaries filled with 0.0033% HEC/0.0040% PEO.Pulsed field electrophoresis is a technique in whichthe electric field is periodically reversed in order totake advantage of reorientation effects for large DNA.Migration of molecules is achieved by application ofhigher potential in the forward direction of the
Figure 24. Fast separation of aspartate enantiomers byoptically gated CE. Separation distance ) 15 mm, injectiontime ) 10 ms, E ) 2500 V/cm, electrophoresis bufferconsisted of 50 mM borate at pH 10 with 10 mM â-CD.Amino acid concentrations were 5 µM. (Reprinted withpermission from ref 175. Copyright 1999 American Chemi-cal Society.)
3102 Chemical Reviews, 1999, Vol. 99, No. 10 Kennedy et al.
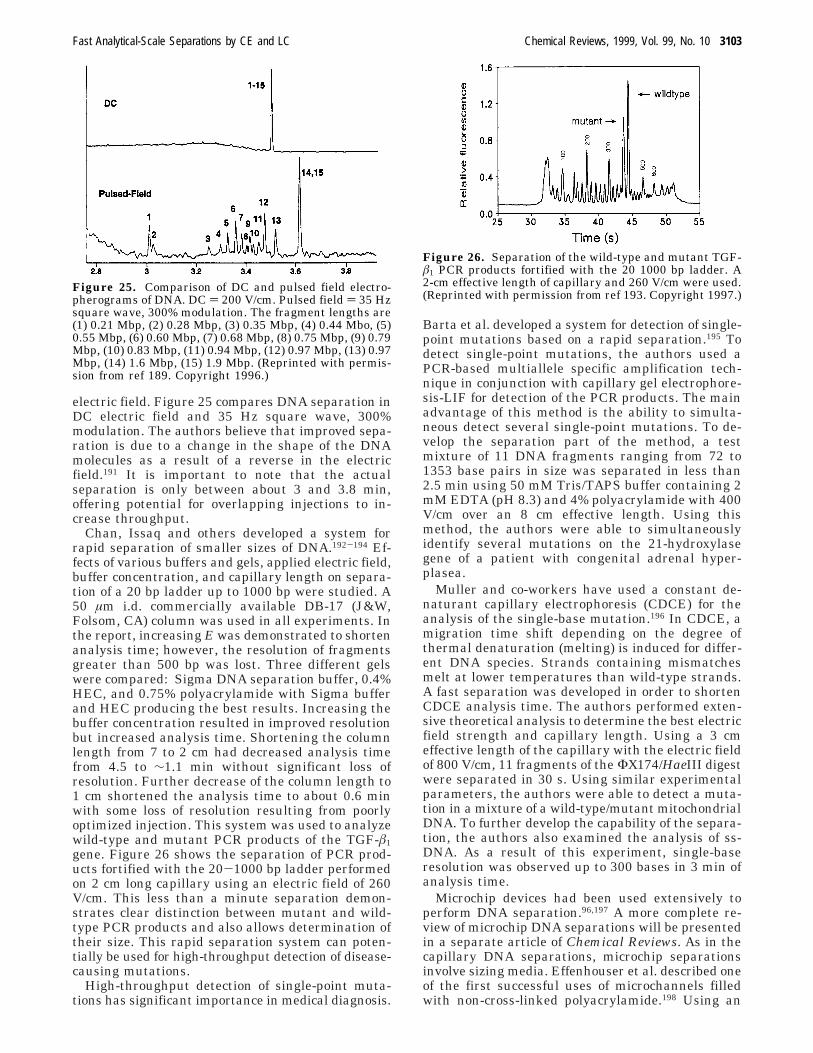
electric field. Figure 25 compares DNA separation inDC electric field and 35 Hz square wave, 300%modulation. The authors believe that improved sepa-ration is due to a change in the shape of the DNAmolecules as a result of a reverse in the electricfield.191 It is important to note that the actualseparation is only between about 3 and 3.8 min,offering potential for overlapping injections to in-crease throughput.
Chan, Issaq and others developed a system forrapid separation of smaller sizes of DNA.192-194 Ef-fects of various buffers and gels, applied electric field,buffer concentration, and capillary length on separa-tion of a 20 bp ladder up to 1000 bp were studied. A50 µm i.d. commercially available DB-17 (J&W,Folsom, CA) column was used in all experiments. Inthe report, increasing E was demonstrated to shortenanalysis time; however, the resolution of fragmentsgreater than 500 bp was lost. Three different gelswere compared: Sigma DNA separation buffer, 0.4%HEC, and 0.75% polyacrylamide with Sigma bufferand HEC producing the best results. Increasing thebuffer concentration resulted in improved resolutionbut increased analysis time. Shortening the columnlength from 7 to 2 cm had decreased analysis timefrom 4.5 to ∼1.1 min without significant loss ofresolution. Further decrease of the column length to1 cm shortened the analysis time to about 0.6 minwith some loss of resolution resulting from poorlyoptimized injection. This system was used to analyzewild-type and mutant PCR products of the TGF-â1gene. Figure 26 shows the separation of PCR prod-ucts fortified with the 20-1000 bp ladder performedon 2 cm long capillary using an electric field of 260V/cm. This less than a minute separation demon-strates clear distinction between mutant and wild-type PCR products and also allows determination oftheir size. This rapid separation system can poten-tially be used for high-throughput detection of disease-causing mutations.
High-throughput detection of single-point muta-tions has significant importance in medical diagnosis.
Barta et al. developed a system for detection of single-point mutations based on a rapid separation.195 Todetect single-point mutations, the authors used aPCR-based multiallele specific amplification tech-nique in conjunction with capillary gel electrophore-sis-LIF for detection of the PCR products. The mainadvantage of this method is the ability to simulta-neous detect several single-point mutations. To de-velop the separation part of the method, a testmixture of 11 DNA fragments ranging from 72 to1353 base pairs in size was separated in less than2.5 min using 50 mM Tris/TAPS buffer containing 2mM EDTA (pH 8.3) and 4% polyacrylamide with 400V/cm over an 8 cm effective length. Using thismethod, the authors were able to simultaneouslyidentify several mutations on the 21-hydroxylasegene of a patient with congenital adrenal hyper-plasea.
Muller and co-workers have used a constant de-naturant capillary electrophoresis (CDCE) for theanalysis of the single-base mutation.196 In CDCE, amigration time shift depending on the degree ofthermal denaturation (melting) is induced for differ-ent DNA species. Strands containing mismatchesmelt at lower temperatures than wild-type strands.A fast separation was developed in order to shortenCDCE analysis time. The authors performed exten-sive theoretical analysis to determine the best electricfield strength and capillary length. Using a 3 cmeffective length of the capillary with the electric fieldof 800 V/cm, 11 fragments of the ΦX174/HaeIII digestwere separated in 30 s. Using similar experimentalparameters, the authors were able to detect a muta-tion in a mixture of a wild-type/mutant mitochondrialDNA. To further develop the capability of the separa-tion, the authors also examined the analysis of ss-DNA. As a result of this experiment, single-baseresolution was observed up to 300 bases in 3 min ofanalysis time.
Microchip devices had been used extensively toperform DNA separation.96,197 A more complete re-view of microchip DNA separations will be presentedin a separate article of Chemical Reviews. As in thecapillary DNA separations, microchip separationsinvolve sizing media. Effenhouser et al. described oneof the first successful uses of microchannels filledwith non-cross-linked polyacrylamide.198 Using an
Figure 25. Comparison of DC and pulsed field electro-pherograms of DNA. DC ) 200 V/cm. Pulsed field ) 35 Hzsquare wave, 300% modulation. The fragment lengths are(1) 0.21 Mbp, (2) 0.28 Mbp, (3) 0.35 Mbp, (4) 0.44 Mbo, (5)0.55 Mbp, (6) 0.60 Mbp, (7) 0.68 Mbp, (8) 0.75 Mbp, (9) 0.79Mbp, (10) 0.83 Mbp, (11) 0.94 Mbp, (12) 0.97 Mbp, (13) 0.97Mbp, (14) 1.6 Mbp, (15) 1.9 Mbp. (Reprinted with permis-sion from ref 189. Copyright 1996.)
Figure 26. Separation of the wild-type and mutant TGF-â1 PCR products fortified with the 20 1000 bp ladder. A2-cm effective length of capillary and 260 V/cm were used.(Reprinted with permission from ref 193. Copyright 1997.)
Fast Analytical-Scale Separations by CE and LC Chemical Reviews, 1999, Vol. 99, No. 10 3103
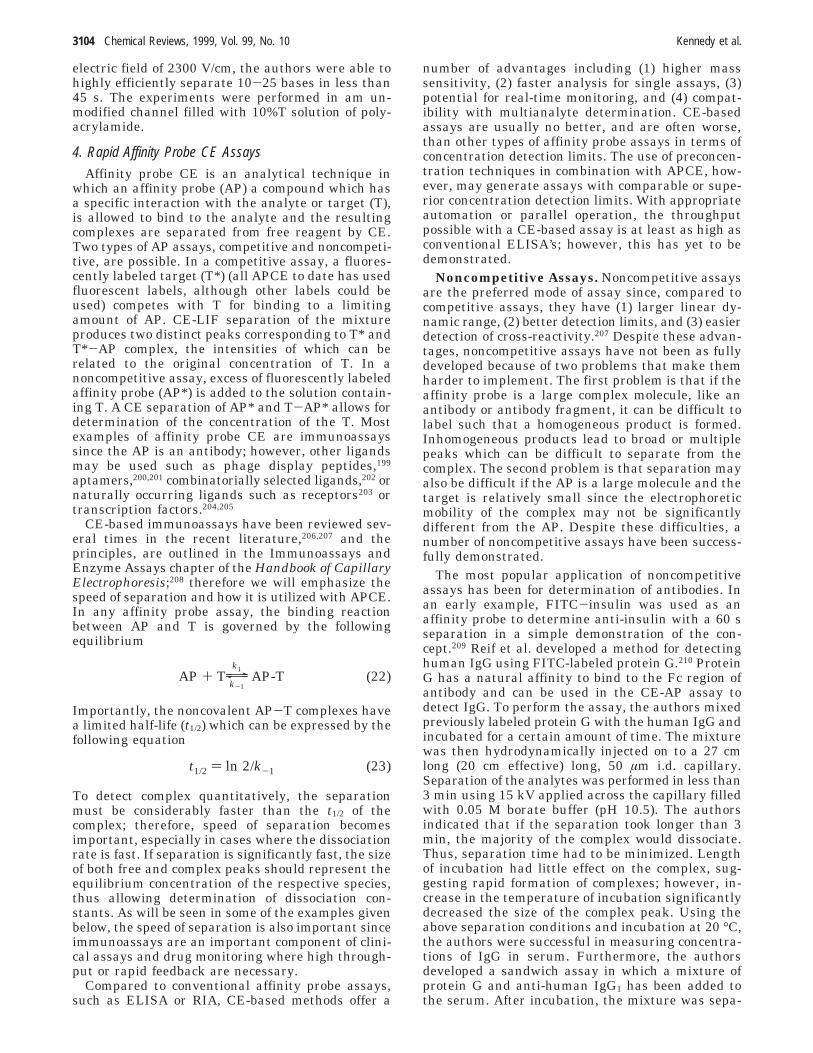
electric field of 2300 V/cm, the authors were able tohighly efficiently separate 10-25 bases in less than45 s. The experiments were performed in am un-modified channel filled with 10%T solution of poly-acrylamide.
4. Rapid Affinity Probe CE AssaysAffinity probe CE is an analytical technique in
which an affinity probe (AP) a compound which hasa specific interaction with the analyte or target (T),is allowed to bind to the analyte and the resultingcomplexes are separated from free reagent by CE.Two types of AP assays, competitive and noncompeti-tive, are possible. In a competitive assay, a fluores-cently labeled target (T*) (all APCE to date has usedfluorescent labels, although other labels could beused) competes with T for binding to a limitingamount of AP. CE-LIF separation of the mixtureproduces two distinct peaks corresponding to T* andT*-AP complex, the intensities of which can berelated to the original concentration of T. In anoncompetitive assay, excess of fluorescently labeledaffinity probe (AP*) is added to the solution contain-ing T. A CE separation of AP* and T-AP* allows fordetermination of the concentration of the T. Mostexamples of affinity probe CE are immunoassayssince the AP is an antibody; however, other ligandsmay be used such as phage display peptides,199
aptamers,200,201 combinatorially selected ligands,202 ornaturally occurring ligands such as receptors203 ortranscription factors.204,205
CE-based immunoassays have been reviewed sev-eral times in the recent literature,206,207 and theprinciples, are outlined in the Immunoassays andEnzyme Assays chapter of the Handbook of CapillaryElectrophoresis;208 therefore we will emphasize thespeed of separation and how it is utilized with APCE.In any affinity probe assay, the binding reactionbetween AP and T is governed by the followingequilibrium
Importantly, the noncovalent AP-T complexes havea limited half-life (t1/2) which can be expressed by thefollowing equation
To detect complex quantitatively, the separationmust be considerably faster than the t1/2 of thecomplex; therefore, speed of separation becomesimportant, especially in cases where the dissociationrate is fast. If separation is significantly fast, the sizeof both free and complex peaks should represent theequilibrium concentration of the respective species,thus allowing determination of dissociation con-stants. As will be seen in some of the examples givenbelow, the speed of separation is also important sinceimmunoassays are an important component of clini-cal assays and drug monitoring where high through-put or rapid feedback are necessary.
Compared to conventional affinity probe assays,such as ELISA or RIA, CE-based methods offer a
number of advantages including (1) higher masssensitivity, (2) faster analysis for single assays, (3)potential for real-time monitoring, and (4) compat-ibility with multianalyte determination. CE-basedassays are usually no better, and are often worse,than other types of affinity probe assays in terms ofconcentration detection limits. The use of preconcen-tration techniques in combination with APCE, how-ever, may generate assays with comparable or supe-rior concentration detection limits. With appropriateautomation or parallel operation, the throughputpossible with a CE-based assay is at least as high asconventional ELISA’s; however, this has yet to bedemonstrated.
Noncompetitive Assays. Noncompetitive assaysare the preferred mode of assay since, compared tocompetitive assays, they have (1) larger linear dy-namic range, (2) better detection limits, and (3) easierdetection of cross-reactivity.207 Despite these advan-tages, noncompetitive assays have not been as fullydeveloped because of two problems that make themharder to implement. The first problem is that if theaffinity probe is a large complex molecule, like anantibody or antibody fragment, it can be difficult tolabel such that a homogeneous product is formed.Inhomogeneous products lead to broad or multiplepeaks which can be difficult to separate from thecomplex. The second problem is that separation mayalso be difficult if the AP is a large molecule and thetarget is relatively small since the electrophoreticmobility of the complex may not be significantlydifferent from the AP. Despite these difficulties, anumber of noncompetitive assays have been success-fully demonstrated.
The most popular application of noncompetitiveassays has been for determination of antibodies. Inan early example, FITC-insulin was used as anaffinity probe to determine anti-insulin with a 60 sseparation in a simple demonstration of the con-cept.209 Reif et al. developed a method for detectinghuman IgG using FITC-labeled protein G.210 ProteinG has a natural affinity to bind to the Fc region ofantibody and can be used in the CE-AP assay todetect IgG. To perform the assay, the authors mixedpreviously labeled protein G with the human IgG andincubated for a certain amount of time. The mixturewas then hydrodynamically injected on to a 27 cmlong (20 cm effective) long, 50 µm i.d. capillary.Separation of the analytes was performed in less than3 min using 15 kV applied across the capillary filledwith 0.05 M borate buffer (pH 10.5). The authorsindicated that if the separation took longer than 3min, the majority of the complex would dissociate.Thus, separation time had to be minimized. Lengthof incubation had little effect on the complex, sug-gesting rapid formation of complexes; however, in-crease in the temperature of incubation significantlydecreased the size of the complex peak. Using theabove separation conditions and incubation at 20 °C,the authors were successful in measuring concentra-tions of IgG in serum. Furthermore, the authorsdeveloped a sandwich assay in which a mixture ofprotein G and anti-human IgG1 has been added tothe serum. After incubation, the mixture was sepa-
AP + Ty\zk1
k-1AP-T (22)
t1/2 ) ln 2/k-1 (23)
3104 Chemical Reviews, 1999, Vol. 99, No. 10 Kennedy et al.
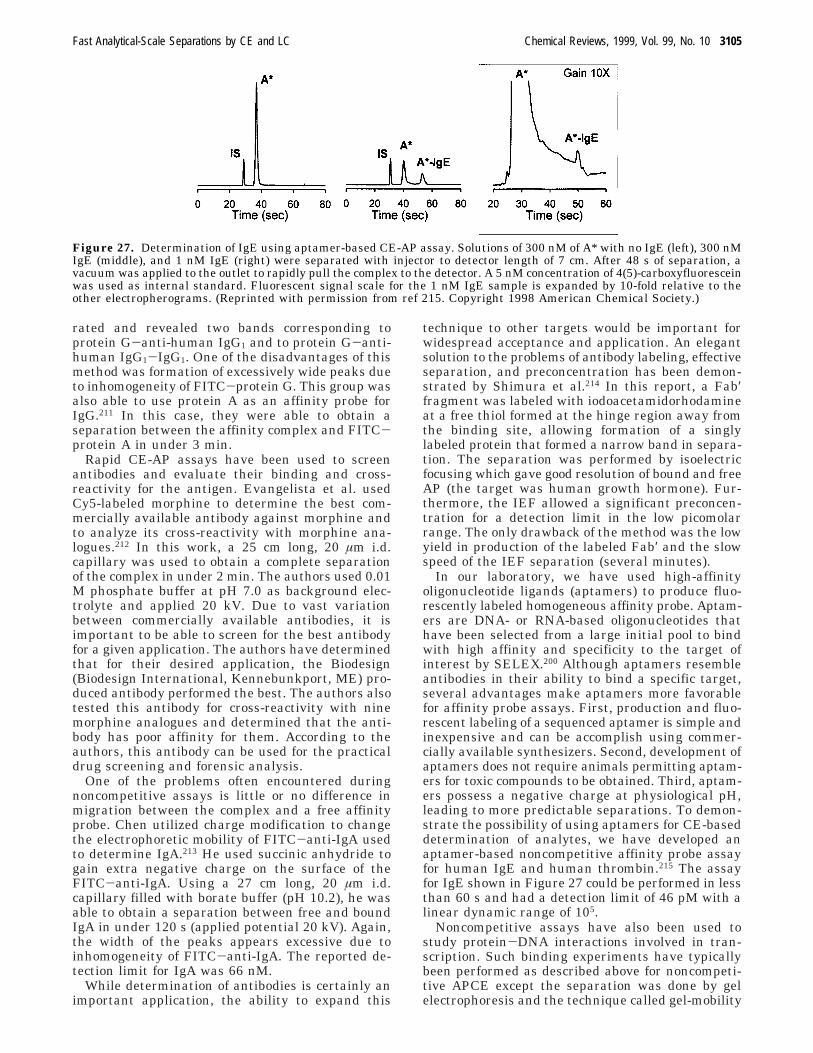
rated and revealed two bands corresponding toprotein G-anti-human IgG1 and to protein G-anti-human IgG1-IgG1. One of the disadvantages of thismethod was formation of excessively wide peaks dueto inhomogeneity of FITC-protein G. This group wasalso able to use protein A as an affinity probe forIgG.211 In this case, they were able to obtain aseparation between the affinity complex and FITC-protein A in under 3 min.
Rapid CE-AP assays have been used to screenantibodies and evaluate their binding and cross-reactivity for the antigen. Evangelista et al. usedCy5-labeled morphine to determine the best com-mercially available antibody against morphine andto analyze its cross-reactivity with morphine ana-logues.212 In this work, a 25 cm long, 20 µm i.d.capillary was used to obtain a complete separationof the complex in under 2 min. The authors used 0.01M phosphate buffer at pH 7.0 as background elec-trolyte and applied 20 kV. Due to vast variationbetween commercially available antibodies, it isimportant to be able to screen for the best antibodyfor a given application. The authors have determinedthat for their desired application, the Biodesign(Biodesign International, Kennebunkport, ME) pro-duced antibody performed the best. The authors alsotested this antibody for cross-reactivity with ninemorphine analogues and determined that the anti-body has poor affinity for them. According to theauthors, this antibody can be used for the practicaldrug screening and forensic analysis.
One of the problems often encountered duringnoncompetitive assays is little or no difference inmigration between the complex and a free affinityprobe. Chen utilized charge modification to changethe electrophoretic mobility of FITC-anti-IgA usedto determine IgA.213 He used succinic anhydride togain extra negative charge on the surface of theFITC-anti-IgA. Using a 27 cm long, 20 µm i.d.capillary filled with borate buffer (pH 10.2), he wasable to obtain a separation between free and boundIgA in under 120 s (applied potential 20 kV). Again,the width of the peaks appears excessive due toinhomogeneity of FITC-anti-IgA. The reported de-tection limit for IgA was 66 nM.
While determination of antibodies is certainly animportant application, the ability to expand this
technique to other targets would be important forwidespread acceptance and application. An elegantsolution to the problems of antibody labeling, effectiveseparation, and preconcentration has been demon-strated by Shimura et al.214 In this report, a Fab′fragment was labeled with iodoacetamidorhodamineat a free thiol formed at the hinge region away fromthe binding site, allowing formation of a singlylabeled protein that formed a narrow band in separa-tion. The separation was performed by isoelectricfocusing which gave good resolution of bound and freeAP (the target was human growth hormone). Fur-thermore, the IEF allowed a significant preconcen-tration for a detection limit in the low picomolarrange. The only drawback of the method was the lowyield in production of the labeled Fab′ and the slowspeed of the IEF separation (several minutes).
In our laboratory, we have used high-affinityoligonucleotide ligands (aptamers) to produce fluo-rescently labeled homogeneous affinity probe. Aptam-ers are DNA- or RNA-based oligonucleotides thathave been selected from a large initial pool to bindwith high affinity and specificity to the target ofinterest by SELEX.200 Although aptamers resembleantibodies in their ability to bind a specific target,several advantages make aptamers more favorablefor affinity probe assays. First, production and fluo-rescent labeling of a sequenced aptamer is simple andinexpensive and can be accomplish using commer-cially available synthesizers. Second, development ofaptamers does not require animals permitting aptam-ers for toxic compounds to be obtained. Third, aptam-ers possess a negative charge at physiological pH,leading to more predictable separations. To demon-strate the possibility of using aptamers for CE-baseddetermination of analytes, we have developed anaptamer-based noncompetitive affinity probe assayfor human IgE and human thrombin.215 The assayfor IgE shown in Figure 27 could be performed in lessthan 60 s and had a detection limit of 46 pM with alinear dynamic range of 105.
Noncompetitive assays have also been used tostudy protein-DNA interactions involved in tran-scription. Such binding experiments have typicallybeen performed as described above for noncompeti-tive APCE except the separation was done by gelelectrophoresis and the technique called gel-mobility
Figure 27. Determination of IgE using aptamer-based CE-AP assay. Solutions of 300 nM of A* with no IgE (left), 300 nMIgE (middle), and 1 nM IgE (right) were separated with injector to detector length of 7 cm. After 48 s of separation, avacuum was applied to the outlet to rapidly pull the complex to the detector. A 5 nM concentration of 4(5)-carboxyfluoresceinwas used as internal standard. Fluorescent signal scale for the 1 nM IgE sample is expanded by 10-fold relative to theother electropherograms. (Reprinted with permission from ref 215. Copyright 1998 American Chemical Society.)
Fast Analytical-Scale Separations by CE and LC Chemical Reviews, 1999, Vol. 99, No. 10 3105
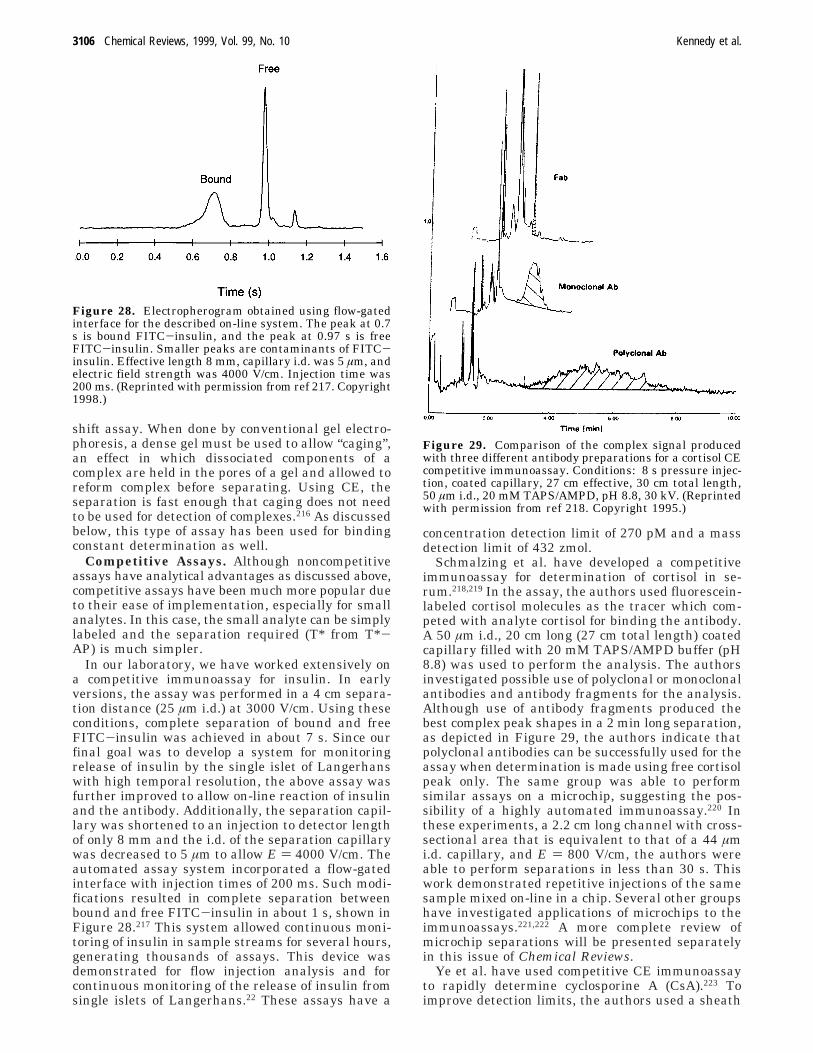
shift assay. When done by conventional gel electro-phoresis, a dense gel must be used to allow “caging”,an effect in which dissociated components of acomplex are held in the pores of a gel and allowed toreform complex before separating. Using CE, theseparation is fast enough that caging does not needto be used for detection of complexes.216 As discussedbelow, this type of assay has been used for bindingconstant determination as well.
Competitive Assays. Although noncompetitiveassays have analytical advantages as discussed above,competitive assays have been much more popular dueto their ease of implementation, especially for smallanalytes. In this case, the small analyte can be simplylabeled and the separation required (T* from T*-AP) is much simpler.
In our laboratory, we have worked extensively ona competitive immunoassay for insulin. In earlyversions, the assay was performed in a 4 cm separa-tion distance (25 µm i.d.) at 3000 V/cm. Using theseconditions, complete separation of bound and freeFITC-insulin was achieved in about 7 s. Since ourfinal goal was to develop a system for monitoringrelease of insulin by the single islet of Langerhanswith high temporal resolution, the above assay wasfurther improved to allow on-line reaction of insulinand the antibody. Additionally, the separation capil-lary was shortened to an injection to detector lengthof only 8 mm and the i.d. of the separation capillarywas decreased to 5 µm to allow E ) 4000 V/cm. Theautomated assay system incorporated a flow-gatedinterface with injection times of 200 ms. Such modi-fications resulted in complete separation betweenbound and free FITC-insulin in about 1 s, shown inFigure 28.217 This system allowed continuous moni-toring of insulin in sample streams for several hours,generating thousands of assays. This device wasdemonstrated for flow injection analysis and forcontinuous monitoring of the release of insulin fromsingle islets of Langerhans.22 These assays have a
concentration detection limit of 270 pM and a massdetection limit of 432 zmol.
Schmalzing et al. have developed a competitiveimmunoassay for determination of cortisol in se-rum.218,219 In the assay, the authors used fluorescein-labeled cortisol molecules as the tracer which com-peted with analyte cortisol for binding the antibody.A 50 µm i.d., 20 cm long (27 cm total length) coatedcapillary filled with 20 mM TAPS/AMPD buffer (pH8.8) was used to perform the analysis. The authorsinvestigated possible use of polyclonal or monoclonalantibodies and antibody fragments for the analysis.Although use of antibody fragments produced thebest complex peak shapes in a 2 min long separation,as depicted in Figure 29, the authors indicate thatpolyclonal antibodies can be successfully used for theassay when determination is made using free cortisolpeak only. The same group was able to performsimilar assays on a microchip, suggesting the pos-sibility of a highly automated immunoassay.220 Inthese experiments, a 2.2 cm long channel with cross-sectional area that is equivalent to that of a 44 µmi.d. capillary, and E ) 800 V/cm, the authors wereable to perform separations in less than 30 s. Thiswork demonstrated repetitive injections of the samesample mixed on-line in a chip. Several other groupshave investigated applications of microchips to theimmunoassays.221,222 A more complete review ofmicrochip separations will be presented separatelyin this issue of Chemical Reviews.
Ye et al. have used competitive CE immunoassayto rapidly determine cyclosporine A (CsA).223 Toimprove detection limits, the authors used a sheath
Figure 28. Electropherogram obtained using flow-gatedinterface for the described on-line system. The peak at 0.7s is bound FITC-insulin, and the peak at 0.97 s is freeFITC-insulin. Smaller peaks are contaminants of FITC-insulin. Effective length 8 mm, capillary i.d. was 5 µm, andelectric field strength was 4000 V/cm. Injection time was200 ms. (Reprinted with permission from ref 217. Copyright1998.)
Figure 29. Comparison of the complex signal producedwith three different antibody preparations for a cortisol CEcompetitive immunoassay. Conditions: 8 s pressure injec-tion, coated capillary, 27 cm effective, 30 cm total length,50 µm i.d., 20 mM TAPS/AMPD, pH 8.8, 30 kV. (Reprintedwith permission from ref 218. Copyright 1995.)
3106 Chemical Reviews, 1999, Vol. 99, No. 10 Kennedy et al.
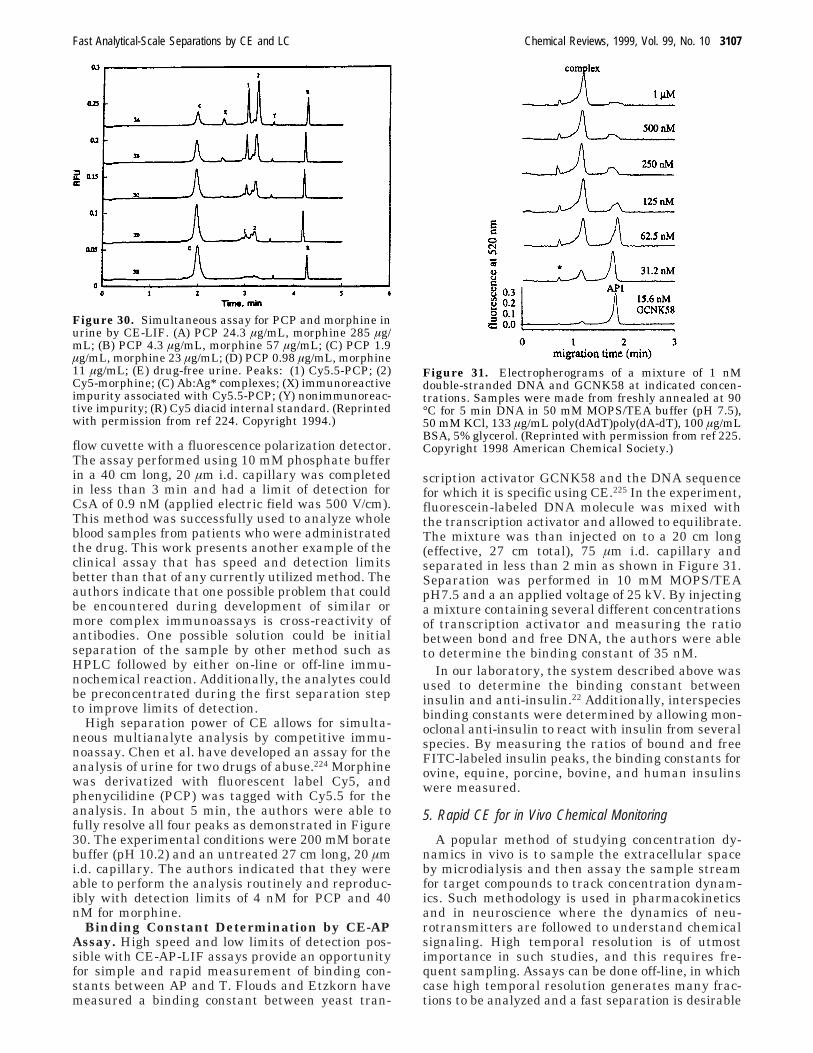
flow cuvette with a fluorescence polarization detector.The assay performed using 10 mM phosphate bufferin a 40 cm long, 20 µm i.d. capillary was completedin less than 3 min and had a limit of detection forCsA of 0.9 nM (applied electric field was 500 V/cm).This method was successfully used to analyze wholeblood samples from patients who were administratedthe drug. This work presents another example of theclinical assay that has speed and detection limitsbetter than that of any currently utilized method. Theauthors indicate that one possible problem that couldbe encountered during development of similar ormore complex immunoassays is cross-reactivity ofantibodies. One possible solution could be initialseparation of the sample by other method such asHPLC followed by either on-line or off-line immu-nochemical reaction. Additionally, the analytes couldbe preconcentrated during the first separation stepto improve limits of detection.
High separation power of CE allows for simulta-neous multianalyte analysis by competitive immu-noassay. Chen et al. have developed an assay for theanalysis of urine for two drugs of abuse.224 Morphinewas derivatized with fluorescent label Cy5, andphenycilidine (PCP) was tagged with Cy5.5 for theanalysis. In about 5 min, the authors were able tofully resolve all four peaks as demonstrated in Figure30. The experimental conditions were 200 mM boratebuffer (pH 10.2) and an untreated 27 cm long, 20 µmi.d. capillary. The authors indicated that they wereable to perform the analysis routinely and reproduc-ibly with detection limits of 4 nM for PCP and 40nM for morphine.
Binding Constant Determination by CE-APAssay. High speed and low limits of detection pos-sible with CE-AP-LIF assays provide an opportunityfor simple and rapid measurement of binding con-stants between AP and T. Flouds and Etzkorn havemeasured a binding constant between yeast tran-
scription activator GCNK58 and the DNA sequencefor which it is specific using CE.225 In the experiment,fluorescein-labeled DNA molecule was mixed withthe transcription activator and allowed to equilibrate.The mixture was than injected on to a 20 cm long(effective, 27 cm total), 75 µm i.d. capillary andseparated in less than 2 min as shown in Figure 31.Separation was performed in 10 mM MOPS/TEApH7.5 and a an applied voltage of 25 kV. By injectinga mixture containing several different concentrationsof transcription activator and measuring the ratiobetween bond and free DNA, the authors were ableto determine the binding constant of 35 nM.
In our laboratory, the system described above wasused to determine the binding constant betweeninsulin and anti-insulin.22 Additionally, interspeciesbinding constants were determined by allowing mon-oclonal anti-insulin to react with insulin from severalspecies. By measuring the ratios of bound and freeFITC-labeled insulin peaks, the binding constants forovine, equine, porcine, bovine, and human insulinswere measured.
5. Rapid CE for in Vivo Chemical Monitoring
A popular method of studying concentration dy-namics in vivo is to sample the extracellular spaceby microdialysis and then assay the sample streamfor target compounds to track concentration dynam-ics. Such methodology is used in pharmacokineticsand in neuroscience where the dynamics of neu-rotransmitters are followed to understand chemicalsignaling. High temporal resolution is of utmostimportance in such studies, and this requires fre-quent sampling. Assays can be done off-line, in whichcase high temporal resolution generates many frac-tions to be analyzed and a fast separation is desirable
Figure 30. Simultaneous assay for PCP and morphine inurine by CE-LIF. (A) PCP 24.3 µg/mL, morphine 285 µg/mL; (B) PCP 4.3 µg/mL, morphine 57 µg/mL; (C) PCP 1.9µg/mL, morphine 23 µg/mL; (D) PCP 0.98 µg/mL, morphine11 µg/mL; (E) drug-free urine. Peaks: (1) Cy5.5-PCP; (2)Cy5-morphine; (C) Ab:Ag* complexes; (X) immunoreactiveimpurity associated with Cy5.5-PCP; (Y) nonimmunoreac-tive impurity; (R) Cy5 diacid internal standard. (Reprintedwith permission from ref 224. Copyright 1994.)
Figure 31. Electropherograms of a mixture of 1 nMdouble-stranded DNA and GCNK58 at indicated concen-trations. Samples were made from freshly annealed at 90°C for 5 min DNA in 50 mM MOPS/TEA buffer (pH 7.5),50 mM KCl, 133 µg/mL poly(dAdT)poly(dA-dT), 100 µg/mLBSA, 5% glycerol. (Reprinted with permission from ref 225.Copyright 1998 American Chemical Society.)
Fast Analytical-Scale Separations by CE and LC Chemical Reviews, 1999, Vol. 99, No. 10 3107
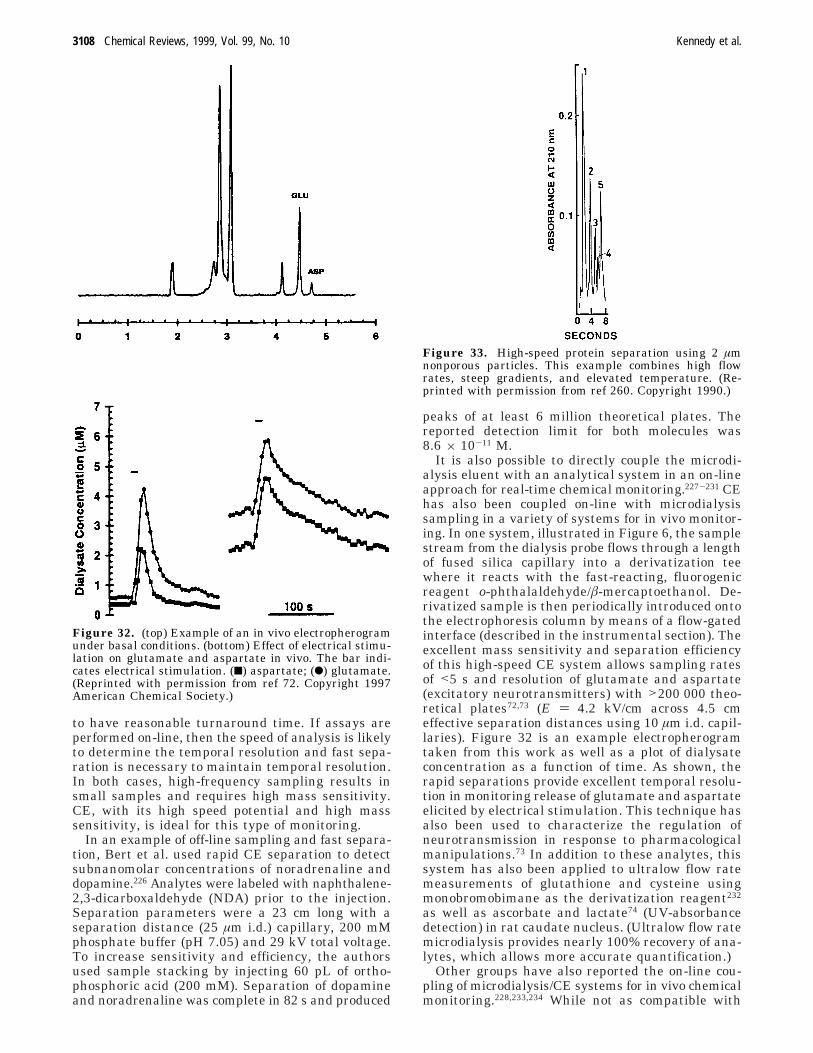
to have reasonable turnaround time. If assays areperformed on-line, then the speed of analysis is likelyto determine the temporal resolution and fast sepa-ration is necessary to maintain temporal resolution.In both cases, high-frequency sampling results insmall samples and requires high mass sensitivity.CE, with its high speed potential and high masssensitivity, is ideal for this type of monitoring.
In an example of off-line sampling and fast separa-tion, Bert et al. used rapid CE separation to detectsubnanomolar concentrations of noradrenaline anddopamine.226 Analytes were labeled with naphthalene-2,3-dicarboxaldehyde (NDA) prior to the injection.Separation parameters were a 23 cm long with aseparation distance (25 µm i.d.) capillary, 200 mMphosphate buffer (pH 7.05) and 29 kV total voltage.To increase sensitivity and efficiency, the authorsused sample stacking by injecting 60 pL of ortho-phosphoric acid (200 mM). Separation of dopamineand noradrenaline was complete in 82 s and produced
peaks of at least 6 million theoretical plates. Thereported detection limit for both molecules was8.6 × 10-11 M.
It is also possible to directly couple the microdi-alysis eluent with an analytical system in an on-lineapproach for real-time chemical monitoring.227-231 CEhas also been coupled on-line with microdialysissampling in a variety of systems for in vivo monitor-ing. In one system, illustrated in Figure 6, the samplestream from the dialysis probe flows through a lengthof fused silica capillary into a derivatization teewhere it reacts with the fast-reacting, fluorogenicreagent o-phthalaldehyde/â-mercaptoethanol. De-rivatized sample is then periodically introduced ontothe electrophoresis column by means of a flow-gatedinterface (described in the instrumental section). Theexcellent mass sensitivity and separation efficiencyof this high-speed CE system allows sampling ratesof <5 s and resolution of glutamate and aspartate(excitatory neurotransmitters) with >200 000 theo-retical plates72,73 (E ) 4.2 kV/cm across 4.5 cmeffective separation distances using 10 µm i.d. capil-laries). Figure 32 is an example electropherogramtaken from this work as well as a plot of dialysateconcentration as a function of time. As shown, therapid separations provide excellent temporal resolu-tion in monitoring release of glutamate and aspartateelicited by electrical stimulation. This technique hasalso been used to characterize the regulation ofneurotransmission in response to pharmacologicalmanipulations.73 In addition to these analytes, thissystem has also been applied to ultralow flow ratemeasurements of glutathione and cysteine usingmonobromobimane as the derivatization reagent232
as well as ascorbate and lactate74 (UV-absorbancedetection) in rat caudate nucleus. (Ultralow flow ratemicrodialysis provides nearly 100% recovery of ana-lytes, which allows more accurate quantification.)
Other groups have also reported the on-line cou-pling of microdialysis/CE systems for in vivo chemicalmonitoring.228,233,234 While not as compatible with
Figure 32. (top) Example of an in vivo electropherogramunder basal conditions. (bottom) Effect of electrical stimu-lation on glutamate and aspartate in vivo. The bar indi-cates electrical stimulation. (9) aspartate; (b) glutamate.(Reprinted with permission from ref 72. Copyright 1997American Chemical Society.)
Figure 33. High-speed protein separation using 2 µmnonporous particles. This example combines high flowrates, steep gradients, and elevated temperature. (Re-printed with permission from ref 260. Copyright 1990.)
3108 Chemical Reviews, 1999, Vol. 99, No. 10 Kennedy et al.
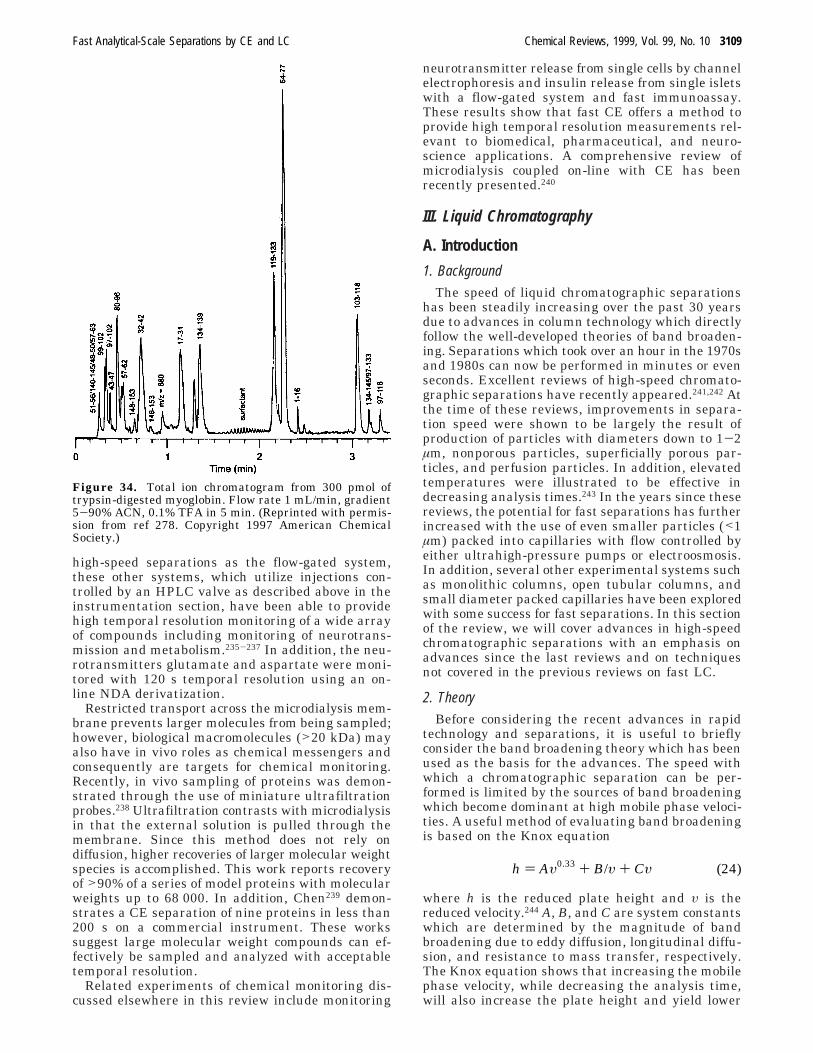
high-speed separations as the flow-gated system,these other systems, which utilize injections con-trolled by an HPLC valve as described above in theinstrumentation section, have been able to providehigh temporal resolution monitoring of a wide arrayof compounds including monitoring of neurotrans-mission and metabolism.235-237 In addition, the neu-rotransmitters glutamate and aspartate were moni-tored with 120 s temporal resolution using an on-line NDA derivatization.
Restricted transport across the microdialysis mem-brane prevents larger molecules from being sampled;however, biological macromolecules (>20 kDa) mayalso have in vivo roles as chemical messengers andconsequently are targets for chemical monitoring.Recently, in vivo sampling of proteins was demon-strated through the use of miniature ultrafiltrationprobes.238 Ultrafiltration contrasts with microdialysisin that the external solution is pulled through themembrane. Since this method does not rely ondiffusion, higher recoveries of larger molecular weightspecies is accomplished. This work reports recoveryof >90% of a series of model proteins with molecularweights up to 68 000. In addition, Chen239 demon-strates a CE separation of nine proteins in less than200 s on a commercial instrument. These workssuggest large molecular weight compounds can ef-fectively be sampled and analyzed with acceptabletemporal resolution.
Related experiments of chemical monitoring dis-cussed elsewhere in this review include monitoring
neurotransmitter release from single cells by channelelectrophoresis and insulin release from single isletswith a flow-gated system and fast immunoassay.These results show that fast CE offers a method toprovide high temporal resolution measurements rel-evant to biomedical, pharmaceutical, and neuro-science applications. A comprehensive review ofmicrodialysis coupled on-line with CE has beenrecently presented.240
III. Liquid Chromatography
A. Introduction
1. BackgroundThe speed of liquid chromatographic separations
has been steadily increasing over the past 30 yearsdue to advances in column technology which directlyfollow the well-developed theories of band broaden-ing. Separations which took over an hour in the 1970sand 1980s can now be performed in minutes or evenseconds. Excellent reviews of high-speed chromato-graphic separations have recently appeared.241,242 Atthe time of these reviews, improvements in separa-tion speed were shown to be largely the result ofproduction of particles with diameters down to 1-2µm, nonporous particles, superficially porous par-ticles, and perfusion particles. In addition, elevatedtemperatures were illustrated to be effective indecreasing analysis times.243 In the years since thesereviews, the potential for fast separations has furtherincreased with the use of even smaller particles (<1µm) packed into capillaries with flow controlled byeither ultrahigh-pressure pumps or electroosmosis.In addition, several other experimental systems suchas monolithic columns, open tubular columns, andsmall diameter packed capillaries have been exploredwith some success for fast separations. In this sectionof the review, we will cover advances in high-speedchromatographic separations with an emphasis onadvances since the last reviews and on techniquesnot covered in the previous reviews on fast LC.
2. TheoryBefore considering the recent advances in rapid
technology and separations, it is useful to brieflyconsider the band broadening theory which has beenused as the basis for the advances. The speed withwhich a chromatographic separation can be per-formed is limited by the sources of band broadeningwhich become dominant at high mobile phase veloci-ties. A useful method of evaluating band broadeningis based on the Knox equation
where h is the reduced plate height and υ is thereduced velocity.244 A, B, and C are system constantswhich are determined by the magnitude of bandbroadening due to eddy diffusion, longitudinal diffu-sion, and resistance to mass transfer, respectively.The Knox equation shows that increasing the mobilephase velocity, while decreasing the analysis time,will also increase the plate height and yield lower
Figure 34. Total ion chromatogram from 300 pmol oftrypsin-digested myoglobin. Flow rate 1 mL/min, gradient5-90% ACN, 0.1% TFA in 5 min. (Reprinted with permis-sion from ref 278. Copyright 1997 American ChemicalSociety.)
h ) Aυ0.33 + B/υ + Cυ (24)
Fast Analytical-Scale Separations by CE and LC Chemical Reviews, 1999, Vol. 99, No. 10 3109
resolution. This well-known problem is of coursedistinct from the situation with CE.
For well-packed columns using porous supportsand unretained solutes, it is expected that A ) 1, B) 2, and C ) 0.05.244 For a column with these figuresof merit, the C term will dominate the band broaden-ing at high mobile phase velocities. For example, atυ of 150, the resistance to mass transfer accounts forover 60% of the total plate height. The C term isdependent upon the capacity factor and can becomeeven more dominant for retained compounds. The Cterm is an aggregate term that includes effects ofslow desorption-sorption kinetics, inhomogeneousflow, and slow diffusion out of the stagnant mobilephase in porous particles. It is frequently observedthat the majority of the C term, especially for largecompounds like proteins, arises from slow diffusionin and out of stagnant mobile phase in pores. In caseswhere the C term is sufficiently reduced, the A termcan dominate band broadening, even at high flowrates.245 As discussed below, certain capillary columnconfigurations can reduce or eliminate the A term forimproved performance at high flow rates. Since theA and C terms both increase with increasing particlediameter, it is also apparent that smaller particleswill aid performance at high flow rates. This neces-sitates the use of higher pressures. These consider-ations will also be discussed in more detail below.
All of the concerns with regard to extra-columnband broadening that were discussed with capillaryelectrophoresis apply to fast chromatographic sepa-rations as well. The main difference is that fastchromatographic separations do not necessarily de-mand miniaturization; therefore, small volume, ul-trahigh sensitivity detectors are not required. Manyseparations, for example, are performed using con-ventional UV-absorbance detectors with perhapssome modifications of the reduced cell and connectingtube volume. The main requirement of course is afast responding detector. Also, the ease of precon-centration on HPLC columns lessens the require-ments of small injection volumes that were discussedwith fast CE. A frequently found limiting factor inthe speed of the separations, especially for largercolumns, is pumping capacity. In a conventionallysized HPLC column, a high-speed separation mayrequire flow rates >10 mL/min. Such flow rates areonly available with preparative-scale pumps whichare not typically part of an analytical system.
B. Nonporous and Superficially Porous ParticlesOne of the most common ways of obtaining im-
proved performance at high flow rates in chromatog-raphy is the use of pellicular or nonporous particles.In nonporous particles, the stationary phase is coatedon the outside of a solid microsphere, thus eliminat-ing any stagnant mobile phase in the column. Withno stagnant mobile phase, the C term is significantlyreduced compared to porous particles resulting in flatvan Deemter curves and high efficiency at high flowrates compared to porous particles of the same size.Pellicular glass beads with large diameters (>40 µm)were used as stationary phase supports early in thedevelopment of liquid chromatography but they lost
favor with the advent of porous silica particles withmuch smaller diameters <10 µm which provided highsurface area (and therefore high capacity) and higherefficiency. Improvements in synthetic methods forpellicular particles have allowed production of mono-disperse beads with diameters <3 µm.246 This im-provement, coinciding with increased demand forhigher speed separation, has sparked renewed inter-est in nonporous particles.
1. Preparation of Nonporous Particles
The synthesis of nonporous particles has beenreviewed for a variety of supports.247,248 The mostcommon synthetic method for nonporous silica in-volves hydrolysis of alkyl silicates and subsequentcondensation of silicic acid in alcoholic solutions toproduce highly mondisperse (2% variation in diam-eter) particles. 246,249 The production of nonporouszirconia beads coated with reversed-phase stationaryphase has also been described.250 These particles,with diameters <3 µm, were found to yield rapid,high-efficiency separations for a variety of analytesincluding polycyclic aromatic hydrocarbons, alkyl-benzenes, oligosaccharides, amino acids, peptides,and proteins. With appropriate end-capping and useof polymeric surface coverage with stationary phase,the particles had little metallic interactions andyielded quasi-homoenergetic interactions. Alternativeapproaches to producing monodisperse, nonporouschromatographic supports include filling in the poresof porous particles with polymer 251 and renderingporous particles nonporous by sintering at hightemperatures.252 Nonporous supports based on or-ganic polymers are produced by suspension polym-erization techniques which allow control of particlediameter.253,254 At present, nonporous particles in thesize range of 1-3 µm can be obtained in prepackedcolumns from several vendors (see Table 1).
2. Characterization of Nonporous Particles
Unger’s group performed an in depth evaluationof nonporous particles with a 1.5 µm diameter for theseparation of proteins and peptides in a series ofpapers.255-258 In a comparison of pellicular and porousparticles for reversed-phase chromatography of pep-tides and proteins, several differences were observed.One difference was that the capacity factor of ananalyte was much less sensitive to changes in thepercentage of organic solvent modifier compared toporous particles.255 Plots of log(k′) versus organicphase ratio yielded slopes 10 times more shallow thanwould be expected with porous particles. This effectrequires adjustment of gradient development andwas attributed to the proteins having free access tothe stationary phase on the surface rather than beingrequired to diffuse into pores. We note, however, thatfor small molecules, nonporous columns have beenreported to be more sensitive to organic content withthe slope of log(k′) vs organic content being twice assteep for nonporous reversed-phase columns.262
The main observable difference between nonporousand porous particles was an increase in peak capacityfor small, nonporous beads compared to columnspacked with porous particles.256 For example, in one
3110 Chemical Reviews, 1999, Vol. 99, No. 10 Kennedy et al.
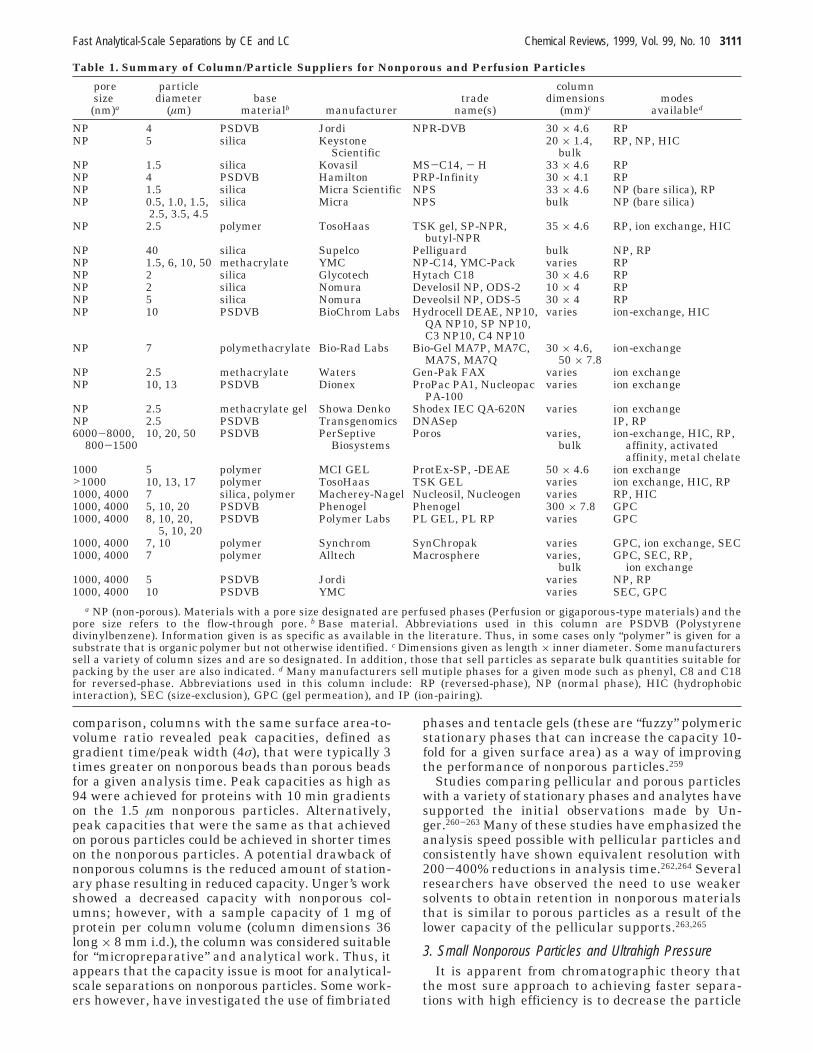
comparison, columns with the same surface area-to-volume ratio revealed peak capacities, defined asgradient time/peak width (4σ), that were typically 3times greater on nonporous beads than porous beadsfor a given analysis time. Peak capacities as high as94 were achieved for proteins with 10 min gradientson the 1.5 µm nonporous particles. Alternatively,peak capacities that were the same as that achievedon porous particles could be achieved in shorter timeson the nonporous particles. A potential drawback ofnonporous columns is the reduced amount of station-ary phase resulting in reduced capacity. Unger’s workshowed a decreased capacity with nonporous col-umns; however, with a sample capacity of 1 mg ofprotein per column volume (column dimensions 36long × 8 mm i.d.), the column was considered suitablefor “micropreparative” and analytical work. Thus, itappears that the capacity issue is moot for analytical-scale separations on nonporous particles. Some work-ers however, have investigated the use of fimbriated
phases and tentacle gels (these are “fuzzy” polymericstationary phases that can increase the capacity 10-fold for a given surface area) as a way of improvingthe performance of nonporous particles.259
Studies comparing pellicular and porous particleswith a variety of stationary phases and analytes havesupported the initial observations made by Un-ger.260-263 Many of these studies have emphasized theanalysis speed possible with pellicular particles andconsistently have shown equivalent resolution with200-400% reductions in analysis time.262,264 Severalresearchers have observed the need to use weakersolvents to obtain retention in nonporous materialsthat is similar to porous particles as a result of thelower capacity of the pellicular supports.263,265
3. Small Nonporous Particles and Ultrahigh PressureIt is apparent from chromatographic theory that
the most sure approach to achieving faster separa-tions with high efficiency is to decrease the particle
Table 1. Summary of Column/Particle Suppliers for Nonporous and Perfusion Particles
poresize(nm)a
particlediameter
(µm)base
materialb manufacturertrade
name(s)
columndimensions
(mm)cmodes
availabled
NP 4 PSDVB Jordi NPR-DVB 30 × 4.6 RPNP 5 silica Keystone
Scientific20 × 1.4,
bulkRP, NP, HIC
NP 1.5 silica Kovasil MS-C14, - H 33 × 4.6 RPNP 4 PSDVB Hamilton PRP-Infinity 30 × 4.1 RPNP 1.5 silica Micra Scientific NPS 33 × 4.6 NP (bare silica), RPNP 0.5, 1.0, 1.5,
2.5, 3.5, 4.5silica Micra NPS bulk NP (bare silica)
NP 2.5 polymer TosoHaas TSK gel, SP-NPR,butyl-NPR
35 × 4.6 RP, ion exchange, HIC
NP 40 silica Supelco Pelliguard bulk NP, RPNP 1.5, 6, 10, 50 methacrylate YMC NP-C14, YMC-Pack varies RPNP 2 silica Glycotech Hytach C18 30 × 4.6 RPNP 2 silica Nomura Develosil NP, ODS-2 10 × 4 RPNP 5 silica Nomura Deveolsil NP, ODS-5 30 × 4 RPNP 10 PSDVB BioChrom Labs Hydrocell DEAE, NP10,
QA NP10, SP NP10,C3 NP10, C4 NP10
varies ion-exchange, HIC
NP 7 polymethacrylate Bio-Rad Labs Bio-Gel MA7P, MA7C,MA7S, MA7Q
30 × 4.6,50 × 7.8
ion-exchange
NP 2.5 methacrylate Waters Gen-Pak FAX varies ion exchangeNP 10, 13 PSDVB Dionex ProPac PA1, Nucleopac
PA-100varies ion exchange
NP 2.5 methacrylate gel Showa Denko Shodex IEC QA-620N varies ion exchangeNP 2.5 PSDVB Transgenomics DNASep IP, RP6000-8000,
800-150010, 20, 50 PSDVB PerSeptive
BiosystemsPoros varies,
bulkion-exchange, HIC, RP,
affinity, activatedaffinity, metal chelate
1000 5 polymer MCI GEL ProtEx-SP, -DEAE 50 × 4.6 ion exchange>1000 10, 13, 17 polymer TosoHaas TSK GEL varies ion exchange, HIC, RP1000, 4000 7 silica, polymer Macherey-Nagel Nucleosil, Nucleogen varies RP, HIC1000, 4000 5, 10, 20 PSDVB Phenogel Phenogel 300 × 7.8 GPC1000, 4000 8, 10, 20,
5, 10, 20PSDVB Polymer Labs PL GEL, PL RP varies GPC
1000, 4000 7, 10 polymer Synchrom SynChropak varies GPC, ion exchange, SEC1000, 4000 7 polymer Alltech Macrosphere varies,
bulkGPC, SEC, RP,
ion exchange1000, 4000 5 PSDVB Jordi varies NP, RP1000, 4000 10 PSDVB YMC varies SEC, GPC
a NP (non-porous). Materials with a pore size designated are perfused phases (Perfusion or gigaporous-type materials) and thepore size refers to the flow-through pore. b Base material. Abbreviations used in this column are PSDVB (Polystyrenedivinylbenzene). Information given is as specific as available in the literature. Thus, in some cases only “polymer” is given for asubstrate that is organic polymer but not otherwise identified. c Dimensions given as length × inner diameter. Some manufacturerssell a variety of column sizes and are so designated. In addition, those that sell particles as separate bulk quantities suitable forpacking by the user are also indicated. d Many manufacturers sell mutiple phases for a given mode such as phenyl, C8 and C18for reversed-phase. Abbreviations used in this column include: RP (reversed-phase), NP (normal phase), HIC (hydrophobicinteraction), SEC (size-exclusion), GPC (gel permeation), and IP (ion-pairing).
Fast Analytical-Scale Separations by CE and LC Chemical Reviews, 1999, Vol. 99, No. 10 3111
size. Over the past 30 years, decreases in the particlesize have indeed resulted in impressive decreases inthe analysis time while maintaining comparableefficiencies. Decreasing the particle size requiresincreased pressures, and at present, most chromato-graphic equipment has approximately a 6000 psilimit. With this pressure limit, it is difficult to furtherimprove separation speed by going to particles lessthan 2 µm because of the extremely high pressuresrequired to achieve high flow rates. Another factorthat limits the utility of smaller particles is the hightemperatures generated due to the friction associatedwith flow through a packed bed. It is calculated thata 1 mL/min flow rate on a typical 4.6 mm column at3500 bar (50 000 psi) will generate over 5 W of power,much more than could be dissipated.266
The temperature problem can be solved by usingpacked capillaries due to their small diameter andexcellent ability to dissipate heat. A 30 µm i.d.capillary operated at 4100 bar (60 000 psi) is expectedto generate approximately 0.4 mW of power, whichcan easily be dissipated across the capillary. A routeto increasing the pressure limit has recently beenreported with the development of high-pressurepumping equipment compatible with HPLC solventsconsisting of a modified, three-stage pneumatic am-plifier pump that can supply 4500 bar (65 000 psi).Special high-pressure fittings to connect capillarycolumns to the high-pressure system were alsodescribed. The pump was used with 50-70 cm longby 30 µm i.d. capillary columns packed with 1.5 µmnonporous particles. The optimum flow rate required1300 bar (19 000 psi) of pressure for 30 min analysesand generated up to 330 000 plates (52 cm column)for a lightly retained compound. At 4 100 bar (59 000psi), analysis times were less than 10 min and stillproduced 190 000 plates. More recently, the use of 1µm particles yielded efficiencies of 200 000 plates in6 min for a small solute with k′ ≈ 1.267 Using anexponential dilution method to form a gradient, adifferent type of high-pressure pump (syringe designwith maximum pressure of 130 000 psi) was used togenerate a peak capacity of 300 in a 30 min analysistime on a 27 cm long column.
While emphasis of these initial reports using ul-trahigh-pressure LC was on high efficiency and notspeed, it is apparent that the availability of such highpressures could be used for fast separations inshorter, packed capillaries. Also, while all workpublished so far with ultrahigh-pressure columns hasutilized nonporous particles, it is clear that similarequipment could be used with small, porous particlesto achieve high flow rates and fast analysis.
4. Superficially Porous Particles
Although nonporous particles are gaining popular-ity, some disadvantages can be noted. Most impor-tantly is the lower capacity. Furthermore, the use ofsmall particles, which is typical with the nonporousmaterial, requires high pressures (which are still notcommonly available), and the resulting shear forcesbetween particles can harm delicate macromolecules.As a way to take advantage of the short diffusionpaths associated with small particles, but at lower
pressures and with higher capacity, Kirkland devel-oped superficially porous particles.268 These particlesconsist of a solid 5 µm core coated with a layer ofporous microspheres (1 µm diameter with 300 Åpores). The particles are produced by spray drying amixture of silica sol and pellicular particles. Theefficiency of the columns was equivalent to columnspacked with 1-2 µm totally porous particles but hadthe back pressure of 7 µm particles. Their applicationto high-speed separations was demonstrated by theseparation of three polystyrene samples by SEC andfive test proteins by reversed-phase HPLC, both inabout 90 s.
5. Examples and Applications of Fast Separations onNonporous Particles
Numerous examples of impressively fast separa-tions on columns packed with pellicular supports cannow be found in the literature.269-275 In the sectionsbelow we discuss some examples of these separations.Table 2 summarizes many other examples.
Peptides and Proteins. Certainly the most likelyapplication for pellicular supports is in the area oflarge molecule separations since their efficiency ismost often limited by the slow diffusion in and outof the stagnant mobile phase. In the early work ofUnger, the capability of fast separations for proteinswas shown by the separation of eight test proteinsunder increasing flow rate and gradient steepness.Even the highest flow rates (4 mL/min) and steepestgradients (2.5-0 mM (NH4)2SO4 in 0.1 M phosphatein 2.5 min) allowed resolution of the eight proteinsin 2.5 min.258 In an example of pushing the limits, 2µm diameter nonporous particles were used with asteep gradient and elevated temperature to separatefive proteins in 8 s (Figure 33).260 Several examplesof separations of proteins and protein digests on 1.5µm diameter reversed-phase particles were reportedincluding one demonstration of separation of 79peptides from a digest of bovine serum albumin in22 min on a 3.3 cm long by 4.6 mm i.d. column.276
A whole cell lysate of human erythroleukemia cellswas analyzed for its protein content using a columnwith 1.5 µm C-18 particles.277 The column was heldat 60 °C, and a multistep gradient was utilized toseparate over 100 peaks in 30 min. In a few cases,fractions with coeluting peaks were subjected to asecond chromatographic step with a shallow gradientto aid in identification. Fractions of each componentwere collected, enzymatically digested, and the re-sulting peptides were analyzed by MALDI. Theresulting spectra were compared to a protein data-base to determine identity.
As discussed in the electrophoresis section, increas-ing the speed of separation poses special problemswhen coupling the instrument to a mass spectrom-eter. Given the tremendous importance of LC-MS,especially for proteomic research, and the increasingspeed of separations, it is clear that considerableeffort will be needed to make fast separations com-patible with MS. Banks and Gulcicek have exploredthe use of electrospray interfaced to a time-of-flightmass spectrometer for detection of peptides separatedon nonporous media. Simple peptide mixtures were
3112 Chemical Reviews, 1999, Vol. 99, No. 10 Kennedy et al.
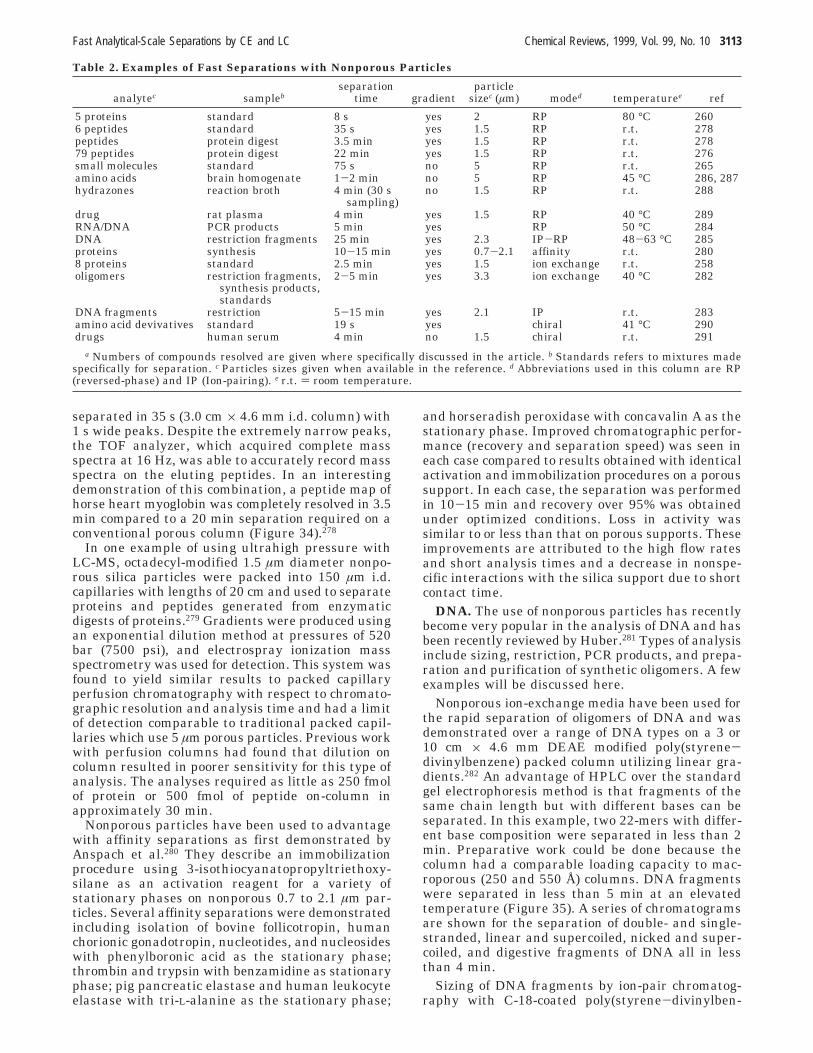
separated in 35 s (3.0 cm × 4.6 mm i.d. column) with1 s wide peaks. Despite the extremely narrow peaks,the TOF analyzer, which acquired complete massspectra at 16 Hz, was able to accurately record massspectra on the eluting peptides. In an interestingdemonstration of this combination, a peptide map ofhorse heart myoglobin was completely resolved in 3.5min compared to a 20 min separation required on aconventional porous column (Figure 34).278
In one example of using ultrahigh pressure withLC-MS, octadecyl-modified 1.5 µm diameter nonpo-rous silica particles were packed into 150 µm i.d.capillaries with lengths of 20 cm and used to separateproteins and peptides generated from enzymaticdigests of proteins.279 Gradients were produced usingan exponential dilution method at pressures of 520bar (7500 psi), and electrospray ionization massspectrometry was used for detection. This system wasfound to yield similar results to packed capillaryperfusion chromatography with respect to chromato-graphic resolution and analysis time and had a limitof detection comparable to traditional packed capil-laries which use 5 µm porous particles. Previous workwith perfusion columns had found that dilution oncolumn resulted in poorer sensitivity for this type ofanalysis. The analyses required as little as 250 fmolof protein or 500 fmol of peptide on-column inapproximately 30 min.
Nonporous particles have been used to advantagewith affinity separations as first demonstrated byAnspach et al.280 They describe an immobilizationprocedure using 3-isothiocyanatopropyltriethoxy-silane as an activation reagent for a variety ofstationary phases on nonporous 0.7 to 2.1 µm par-ticles. Several affinity separations were demonstratedincluding isolation of bovine follicotropin, humanchorionic gonadotropin, nucleotides, and nucleosideswith phenylboronic acid as the stationary phase;thrombin and trypsin with benzamidine as stationaryphase; pig pancreatic elastase and human leukocyteelastase with tri-L-alanine as the stationary phase;
and horseradish peroxidase with concavalin A as thestationary phase. Improved chromatographic perfor-mance (recovery and separation speed) was seen ineach case compared to results obtained with identicalactivation and immobilization procedures on a poroussupport. In each case, the separation was performedin 10-15 min and recovery over 95% was obtainedunder optimized conditions. Loss in activity wassimilar to or less than that on porous supports. Theseimprovements are attributed to the high flow ratesand short analysis times and a decrease in nonspe-cific interactions with the silica support due to shortcontact time.
DNA. The use of nonporous particles has recentlybecome very popular in the analysis of DNA and hasbeen recently reviewed by Huber.281 Types of analysisinclude sizing, restriction, PCR products, and prepa-ration and purification of synthetic oligomers. A fewexamples will be discussed here.
Nonporous ion-exchange media have been used forthe rapid separation of oligomers of DNA and wasdemonstrated over a range of DNA types on a 3 or10 cm × 4.6 mm DEAE modified poly(styrene-divinylbenzene) packed column utilizing linear gra-dients.282 An advantage of HPLC over the standardgel electrophoresis method is that fragments of thesame chain length but with different bases can beseparated. In this example, two 22-mers with differ-ent base composition were separated in less than 2min. Preparative work could be done because thecolumn had a comparable loading capacity to mac-roporous (250 and 550 Å) columns. DNA fragmentswere separated in less than 5 min at an elevatedtemperature (Figure 35). A series of chromatogramsare shown for the separation of double- and single-stranded, linear and supercoiled, nicked and super-coiled, and digestive fragments of DNA all in lessthan 4 min.
Sizing of DNA fragments by ion-pair chromatog-raphy with C-18-coated poly(styrene-divinylben-
Table 2. Examples of Fast Separations with Nonporous Particles
analytec samplebseparation
time gradientparticle
sizec (µm) moded temperaturee ref
5 proteins standard 8 s yes 2 RP 80 °C 2606 peptides standard 35 s yes 1.5 RP r.t. 278peptides protein digest 3.5 min yes 1.5 RP r.t. 27879 peptides protein digest 22 min yes 1.5 RP r.t. 276small molecules standard 75 s no 5 RP r.t. 265amino acids brain homogenate 1-2 min no 5 RP 45 °C 286, 287hydrazones reaction broth 4 min (30 s
sampling)no 1.5 RP r.t. 288
drug rat plasma 4 min yes 1.5 RP 40 °C 289RNA/DNA PCR products 5 min yes RP 50 °C 284DNA restriction fragments 25 min yes 2.3 IP-RP 48-63 °C 285proteins synthesis 10-15 min yes 0.7-2.1 affinity r.t. 2808 proteins standard 2.5 min yes 1.5 ion exchange r.t. 258oligomers restriction fragments,
synthesis products,standards
2-5 min yes 3.3 ion exchange 40 °C 282
DNA fragments restriction 5-15 min yes 2.1 IP r.t. 283amino acid devivatives standard 19 s yes chiral 41 °C 290drugs human serum 4 min no 1.5 chiral r.t. 291
a Numbers of compounds resolved are given where specifically discussed in the article. b Standards refers to mixtures madespecifically for separation. c Particles sizes given when available in the reference. d Abbreviations used in this column are RP(reversed-phase) and IP (Ion-pairing). e r.t. ) room temperature.
Fast Analytical-Scale Separations by CE and LC Chemical Reviews, 1999, Vol. 99, No. 10 3113
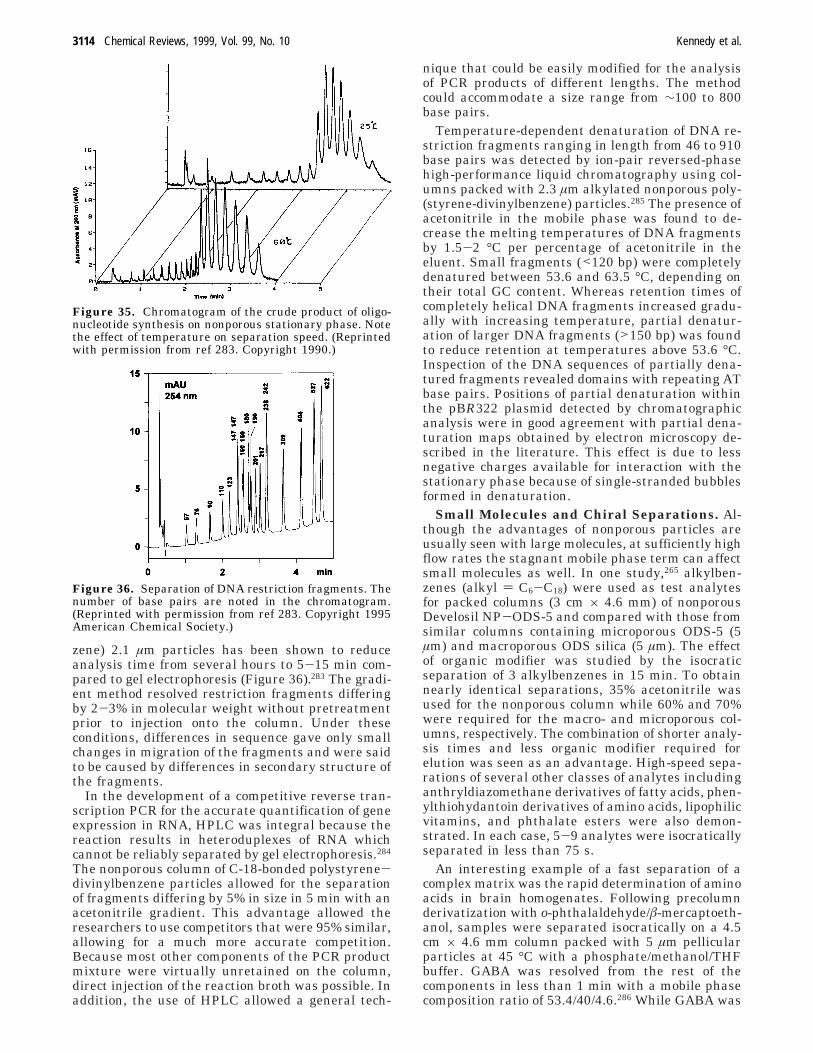
zene) 2.1 µm particles has been shown to reduceanalysis time from several hours to 5-15 min com-pared to gel electrophoresis (Figure 36).283 The gradi-ent method resolved restriction fragments differingby 2-3% in molecular weight without pretreatmentprior to injection onto the column. Under theseconditions, differences in sequence gave only smallchanges in migration of the fragments and were saidto be caused by differences in secondary structure ofthe fragments.
In the development of a competitive reverse tran-scription PCR for the accurate quantification of geneexpression in RNA, HPLC was integral because thereaction results in heteroduplexes of RNA whichcannot be reliably separated by gel electrophoresis.284
The nonporous column of C-18-bonded polystyrene-divinylbenzene particles allowed for the separationof fragments differing by 5% in size in 5 min with anacetonitrile gradient. This advantage allowed theresearchers to use competitors that were 95% similar,allowing for a much more accurate competition.Because most other components of the PCR productmixture were virtually unretained on the column,direct injection of the reaction broth was possible. Inaddition, the use of HPLC allowed a general tech-
nique that could be easily modified for the analysisof PCR products of different lengths. The methodcould accommodate a size range from ∼100 to 800base pairs.
Temperature-dependent denaturation of DNA re-striction fragments ranging in length from 46 to 910base pairs was detected by ion-pair reversed-phasehigh-performance liquid chromatography using col-umns packed with 2.3 µm alkylated nonporous poly-(styrene-divinylbenzene) particles.285 The presence ofacetonitrile in the mobile phase was found to de-crease the melting temperatures of DNA fragmentsby 1.5-2 °C per percentage of acetonitrile in theeluent. Small fragments (<120 bp) were completelydenatured between 53.6 and 63.5 °C, depending ontheir total GC content. Whereas retention times ofcompletely helical DNA fragments increased gradu-ally with increasing temperature, partial denatur-ation of larger DNA fragments (>150 bp) was foundto reduce retention at temperatures above 53.6 °C.Inspection of the DNA sequences of partially dena-tured fragments revealed domains with repeating ATbase pairs. Positions of partial denaturation withinthe pBR322 plasmid detected by chromatographicanalysis were in good agreement with partial dena-turation maps obtained by electron microscopy de-scribed in the literature. This effect is due to lessnegative charges available for interaction with thestationary phase because of single-stranded bubblesformed in denaturation.
Small Molecules and Chiral Separations. Al-though the advantages of nonporous particles areusually seen with large molecules, at sufficiently highflow rates the stagnant mobile phase term can affectsmall molecules as well. In one study,265 alkylben-zenes (alkyl ) C6-C18) were used as test analytesfor packed columns (3 cm × 4.6 mm) of nonporousDevelosil NP-ODS-5 and compared with those fromsimilar columns containing microporous ODS-5 (5µm) and macroporous ODS silica (5 µm). The effectof organic modifier was studied by the isocraticseparation of 3 alkylbenzenes in 15 min. To obtainnearly identical separations, 35% acetonitrile wasused for the nonporous column while 60% and 70%were required for the macro- and microporous col-umns, respectively. The combination of shorter analy-sis times and less organic modifier required forelution was seen as an advantage. High-speed sepa-rations of several other classes of analytes includinganthryldiazomethane derivatives of fatty acids, phen-ylthiohydantoin derivatives of amino acids, lipophilicvitamins, and phthalate esters were also demon-strated. In each case, 5-9 analytes were isocraticallyseparated in less than 75 s.
An interesting example of a fast separation of acomplex matrix was the rapid determination of aminoacids in brain homogenates. Following precolumnderivatization with o-phthalaldehyde/â-mercaptoeth-anol, samples were separated isocratically on a 4.5cm × 4.6 mm column packed with 5 µm pellicularparticles at 45 °C with a phosphate/methanol/THFbuffer. GABA was resolved from the rest of thecomponents in less than 1 min with a mobile phasecomposition ratio of 53.4/40/4.6.286 While GABA was
Figure 35. Chromatogram of the crude product of oligo-nucleotide synthesis on nonporous stationary phase. Notethe effect of temperature on separation speed. (Reprintedwith permission from ref 283. Copyright 1990.)
Figure 36. Separation of DNA restriction fragments. Thenumber of base pairs are noted in the chromatogram.(Reprinted with permission from ref 283. Copyright 1995American Chemical Society.)
3114 Chemical Reviews, 1999, Vol. 99, No. 10 Kennedy et al.
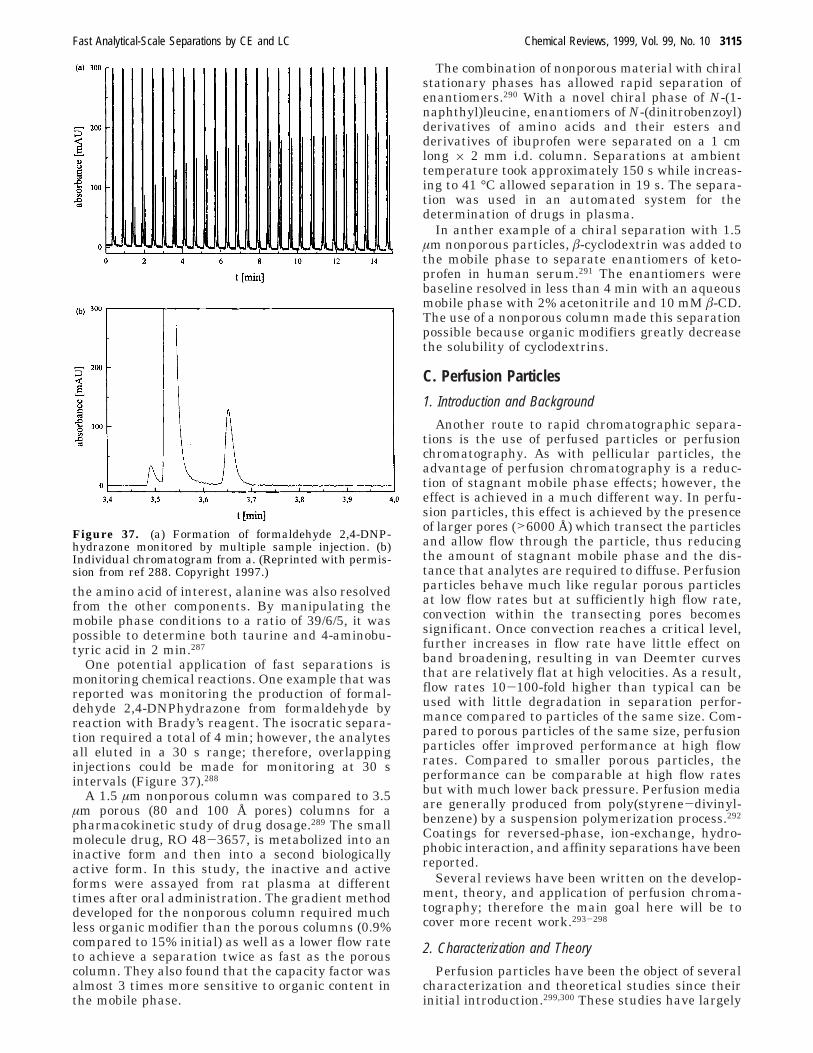
the amino acid of interest, alanine was also resolvedfrom the other components. By manipulating themobile phase conditions to a ratio of 39/6/5, it waspossible to determine both taurine and 4-aminobu-tyric acid in 2 min.287
One potential application of fast separations ismonitoring chemical reactions. One example that wasreported was monitoring the production of formal-dehyde 2,4-DNPhydrazone from formaldehyde byreaction with Brady’s reagent. The isocratic separa-tion required a total of 4 min; however, the analytesall eluted in a 30 s range; therefore, overlappinginjections could be made for monitoring at 30 sintervals (Figure 37).288
A 1.5 µm nonporous column was compared to 3.5µm porous (80 and 100 Å pores) columns for apharmacokinetic study of drug dosage.289 The smallmolecule drug, RO 48-3657, is metabolized into aninactive form and then into a second biologicallyactive form. In this study, the inactive and activeforms were assayed from rat plasma at differenttimes after oral administration. The gradient methoddeveloped for the nonporous column required muchless organic modifier than the porous columns (0.9%compared to 15% initial) as well as a lower flow rateto achieve a separation twice as fast as the porouscolumn. They also found that the capacity factor wasalmost 3 times more sensitive to organic content inthe mobile phase.
The combination of nonporous material with chiralstationary phases has allowed rapid separation ofenantiomers.290 With a novel chiral phase of N-(1-naphthyl)leucine, enantiomers of N-(dinitrobenzoyl)derivatives of amino acids and their esters andderivatives of ibuprofen were separated on a 1 cmlong × 2 mm i.d. column. Separations at ambienttemperature took approximately 150 s while increas-ing to 41 °C allowed separation in 19 s. The separa-tion was used in an automated system for thedetermination of drugs in plasma.
In anther example of a chiral separation with 1.5µm nonporous particles, â-cyclodextrin was added tothe mobile phase to separate enantiomers of keto-profen in human serum.291 The enantiomers werebaseline resolved in less than 4 min with an aqueousmobile phase with 2% acetonitrile and 10 mM â-CD.The use of a nonporous column made this separationpossible because organic modifiers greatly decreasethe solubility of cyclodextrins.
C. Perfusion Particles
1. Introduction and Background
Another route to rapid chromatographic separa-tions is the use of perfused particles or perfusionchromatography. As with pellicular particles, theadvantage of perfusion chromatography is a reduc-tion of stagnant mobile phase effects; however, theeffect is achieved in a much different way. In perfu-sion particles, this effect is achieved by the presenceof larger pores (>6000 Å) which transect the particlesand allow flow through the particle, thus reducingthe amount of stagnant mobile phase and the dis-tance that analytes are required to diffuse. Perfusionparticles behave much like regular porous particlesat low flow rates but at sufficiently high flow rate,convection within the transecting pores becomessignificant. Once convection reaches a critical level,further increases in flow rate have little effect onband broadening, resulting in van Deemter curvesthat are relatively flat at high velocities. As a result,flow rates 10-100-fold higher than typical can beused with little degradation in separation perfor-mance compared to particles of the same size. Com-pared to porous particles of the same size, perfusionparticles offer improved performance at high flowrates. Compared to smaller porous particles, theperformance can be comparable at high flow ratesbut with much lower back pressure. Perfusion mediaare generally produced from poly(styrene-divinyl-benzene) by a suspension polymerization process.292
Coatings for reversed-phase, ion-exchange, hydro-phobic interaction, and affinity separations have beenreported.
Several reviews have been written on the develop-ment, theory, and application of perfusion chroma-tography; therefore the main goal here will be tocover more recent work.293-298
2. Characterization and Theory
Perfusion particles have been the object of severalcharacterization and theoretical studies since theirinitial introduction.299,300 These studies have largely
Figure 37. (a) Formation of formaldehyde 2,4-DNP-hydrazone monitored by multiple sample injection. (b)Individual chromatogram from a. (Reprinted with permis-sion from ref 288. Copyright 1997.)
Fast Analytical-Scale Separations by CE and LC Chemical Reviews, 1999, Vol. 99, No. 10 3115
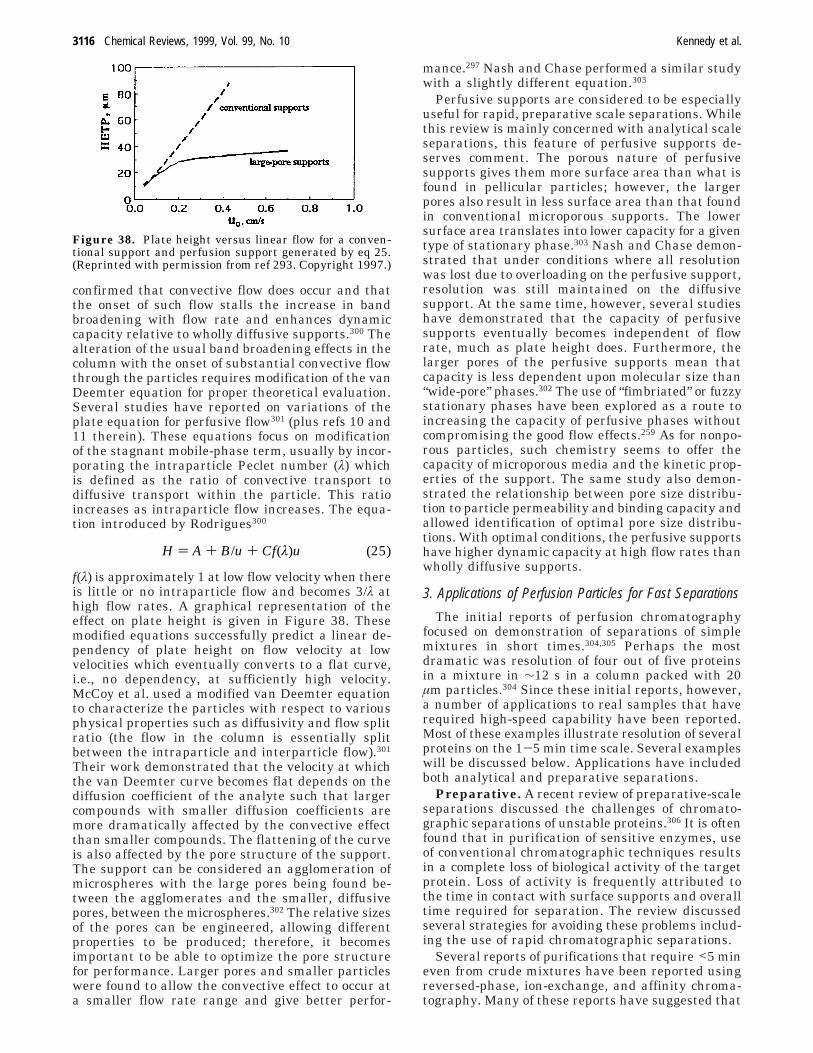
confirmed that convective flow does occur and thatthe onset of such flow stalls the increase in bandbroadening with flow rate and enhances dynamiccapacity relative to wholly diffusive supports.300 Thealteration of the usual band broadening effects in thecolumn with the onset of substantial convective flowthrough the particles requires modification of the vanDeemter equation for proper theoretical evaluation.Several studies have reported on variations of theplate equation for perfusive flow301 (plus refs 10 and11 therein). These equations focus on modificationof the stagnant mobile-phase term, usually by incor-porating the intraparticle Peclet number (λ) whichis defined as the ratio of convective transport todiffusive transport within the particle. This ratioincreases as intraparticle flow increases. The equa-tion introduced by Rodrigues300
f(λ) is approximately 1 at low flow velocity when thereis little or no intraparticle flow and becomes 3/λ athigh flow rates. A graphical representation of theeffect on plate height is given in Figure 38. Thesemodified equations successfully predict a linear de-pendency of plate height on flow velocity at lowvelocities which eventually converts to a flat curve,i.e., no dependency, at sufficiently high velocity.McCoy et al. used a modified van Deemter equationto characterize the particles with respect to variousphysical properties such as diffusivity and flow splitratio (the flow in the column is essentially splitbetween the intraparticle and interparticle flow).301
Their work demonstrated that the velocity at whichthe van Deemter curve becomes flat depends on thediffusion coefficient of the analyte such that largercompounds with smaller diffusion coefficients aremore dramatically affected by the convective effectthan smaller compounds. The flattening of the curveis also affected by the pore structure of the support.The support can be considered an agglomeration ofmicrospheres with the large pores being found be-tween the agglomerates and the smaller, diffusivepores, between the microspheres.302 The relative sizesof the pores can be engineered, allowing differentproperties to be produced; therefore, it becomesimportant to be able to optimize the pore structurefor performance. Larger pores and smaller particleswere found to allow the convective effect to occur ata smaller flow rate range and give better perfor-
mance.297 Nash and Chase performed a similar studywith a slightly different equation.303
Perfusive supports are considered to be especiallyuseful for rapid, preparative scale separations. Whilethis review is mainly concerned with analytical scaleseparations, this feature of perfusive supports de-serves comment. The porous nature of perfusivesupports gives them more surface area than what isfound in pellicular particles; however, the largerpores also result in less surface area than that foundin conventional microporous supports. The lowersurface area translates into lower capacity for a giventype of stationary phase.303 Nash and Chase demon-strated that under conditions where all resolutionwas lost due to overloading on the perfusive support,resolution was still maintained on the diffusivesupport. At the same time, however, several studieshave demonstrated that the capacity of perfusivesupports eventually becomes independent of flowrate, much as plate height does. Furthermore, thelarger pores of the perfusive supports mean thatcapacity is less dependent upon molecular size than“wide-pore” phases.302 The use of “fimbriated” or fuzzystationary phases have been explored as a route toincreasing the capacity of perfusive phases withoutcompromising the good flow effects.259 As for nonpo-rous particles, such chemistry seems to offer thecapacity of microporous media and the kinetic prop-erties of the support. The same study also demon-strated the relationship between pore size distribu-tion to particle permeability and binding capacity andallowed identification of optimal pore size distribu-tions. With optimal conditions, the perfusive supportshave higher dynamic capacity at high flow rates thanwholly diffusive supports.
3. Applications of Perfusion Particles for Fast Separations
The initial reports of perfusion chromatographyfocused on demonstration of separations of simplemixtures in short times.304,305 Perhaps the mostdramatic was resolution of four out of five proteinsin a mixture in ∼12 s in a column packed with 20µm particles.304 Since these initial reports, however,a number of applications to real samples that haverequired high-speed capability have been reported.Most of these examples illustrate resolution of severalproteins on the 1-5 min time scale. Several exampleswill be discussed below. Applications have includedboth analytical and preparative separations.
Preparative. A recent review of preparative-scaleseparations discussed the challenges of chromato-graphic separations of unstable proteins.306 It is oftenfound that in purification of sensitive enzymes, useof conventional chromatographic techniques resultsin a complete loss of biological activity of the targetprotein. Loss of activity is frequently attributed tothe time in contact with surface supports and overalltime required for separation. The review discussedseveral strategies for avoiding these problems includ-ing the use of rapid chromatographic separations.
Several reports of purifications that require <5 mineven from crude mixtures have been reported usingreversed-phase, ion-exchange, and affinity chroma-tography. Many of these reports have suggested that
Figure 38. Plate height versus linear flow for a conven-tional support and perfusion support generated by eq 25.(Reprinted with permission from ref 293. Copyright 1997.)
H ) A + B/u + Cf(λ)u (25)
3116 Chemical Reviews, 1999, Vol. 99, No. 10 Kennedy et al.
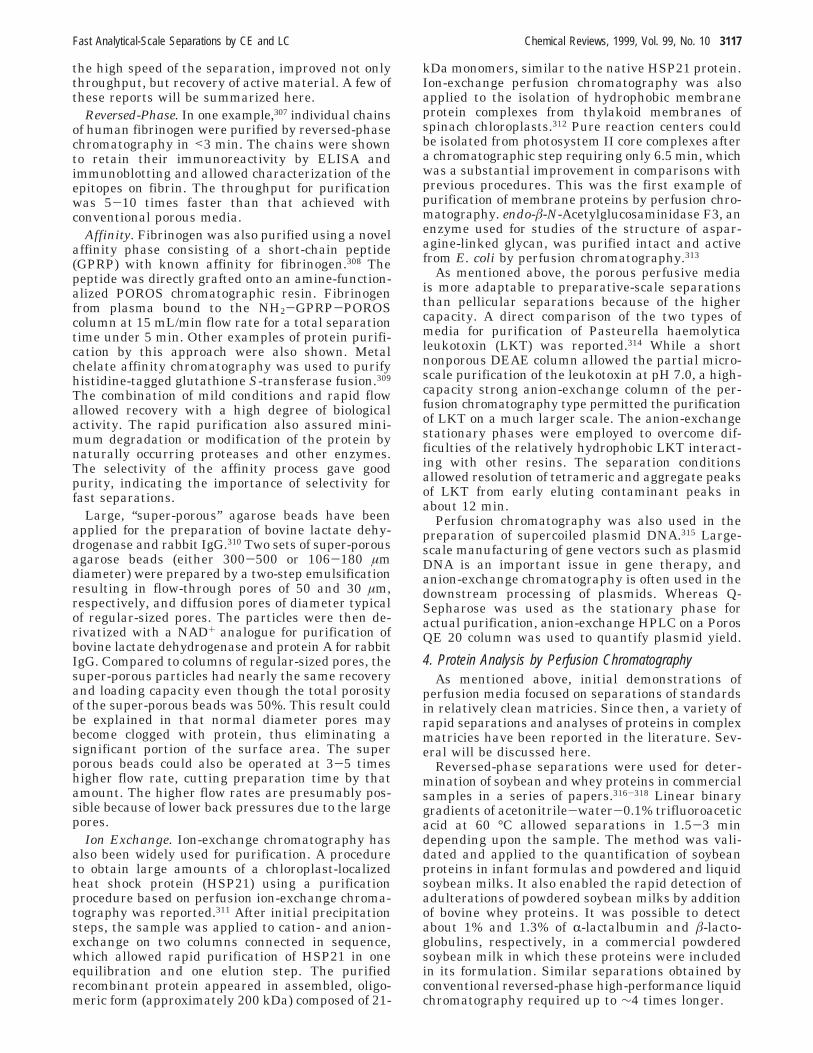
the high speed of the separation, improved not onlythroughput, but recovery of active material. A few ofthese reports will be summarized here.
Reversed-Phase. In one example,307 individual chainsof human fibrinogen were purified by reversed-phasechromatography in <3 min. The chains were shownto retain their immunoreactivity by ELISA andimmunoblotting and allowed characterization of theepitopes on fibrin. The throughput for purificationwas 5-10 times faster than that achieved withconventional porous media.
Affinity. Fibrinogen was also purified using a novelaffinity phase consisting of a short-chain peptide(GPRP) with known affinity for fibrinogen.308 Thepeptide was directly grafted onto an amine-function-alized POROS chromatographic resin. Fibrinogenfrom plasma bound to the NH2-GPRP-POROScolumn at 15 mL/min flow rate for a total separationtime under 5 min. Other examples of protein purifi-cation by this approach were also shown. Metalchelate affinity chromatography was used to purifyhistidine-tagged glutathione S-transferase fusion.309
The combination of mild conditions and rapid flowallowed recovery with a high degree of biologicalactivity. The rapid purification also assured mini-mum degradation or modification of the protein bynaturally occurring proteases and other enzymes.The selectivity of the affinity process gave goodpurity, indicating the importance of selectivity forfast separations.
Large, “super-porous” agarose beads have beenapplied for the preparation of bovine lactate dehy-drogenase and rabbit IgG.310 Two sets of super-porousagarose beads (either 300-500 or 106-180 µmdiameter) were prepared by a two-step emulsificationresulting in flow-through pores of 50 and 30 µm,respectively, and diffusion pores of diameter typicalof regular-sized pores. The particles were then de-rivatized with a NAD+ analogue for purification ofbovine lactate dehydrogenase and protein A for rabbitIgG. Compared to columns of regular-sized pores, thesuper-porous particles had nearly the same recoveryand loading capacity even though the total porosityof the super-porous beads was 50%. This result couldbe explained in that normal diameter pores maybecome clogged with protein, thus eliminating asignificant portion of the surface area. The superporous beads could also be operated at 3-5 timeshigher flow rate, cutting preparation time by thatamount. The higher flow rates are presumably pos-sible because of lower back pressures due to the largepores.
Ion Exchange. Ion-exchange chromatography hasalso been widely used for purification. A procedureto obtain large amounts of a chloroplast-localizedheat shock protein (HSP21) using a purificationprocedure based on perfusion ion-exchange chroma-tography was reported.311 After initial precipitationsteps, the sample was applied to cation- and anion-exchange on two columns connected in sequence,which allowed rapid purification of HSP21 in oneequilibration and one elution step. The purifiedrecombinant protein appeared in assembled, oligo-meric form (approximately 200 kDa) composed of 21-
kDa monomers, similar to the native HSP21 protein.Ion-exchange perfusion chromatography was alsoapplied to the isolation of hydrophobic membraneprotein complexes from thylakoid membranes ofspinach chloroplasts.312 Pure reaction centers couldbe isolated from photosystem II core complexes aftera chromatographic step requiring only 6.5 min, whichwas a substantial improvement in comparisons withprevious procedures. This was the first example ofpurification of membrane proteins by perfusion chro-matography. endo-â-N-Acetylglucosaminidase F3, anenzyme used for studies of the structure of aspar-agine-linked glycan, was purified intact and activefrom E. coli by perfusion chromatography.313
As mentioned above, the porous perfusive mediais more adaptable to preparative-scale separationsthan pellicular separations because of the highercapacity. A direct comparison of the two types ofmedia for purification of Pasteurella haemolyticaleukotoxin (LKT) was reported.314 While a shortnonporous DEAE column allowed the partial micro-scale purification of the leukotoxin at pH 7.0, a high-capacity strong anion-exchange column of the per-fusion chromatography type permitted the purificationof LKT on a much larger scale. The anion-exchangestationary phases were employed to overcome dif-ficulties of the relatively hydrophobic LKT interact-ing with other resins. The separation conditionsallowed resolution of tetrameric and aggregate peaksof LKT from early eluting contaminant peaks inabout 12 min.
Perfusion chromatography was also used in thepreparation of supercoiled plasmid DNA.315 Large-scale manufacturing of gene vectors such as plasmidDNA is an important issue in gene therapy, andanion-exchange chromatography is often used in thedownstream processing of plasmids. Whereas Q-Sepharose was used as the stationary phase foractual purification, anion-exchange HPLC on a PorosQE 20 column was used to quantify plasmid yield.
4. Protein Analysis by Perfusion ChromatographyAs mentioned above, initial demonstrations of
perfusion media focused on separations of standardsin relatively clean matricies. Since then, a variety ofrapid separations and analyses of proteins in complexmatricies have been reported in the literature. Sev-eral will be discussed here.
Reversed-phase separations were used for deter-mination of soybean and whey proteins in commercialsamples in a series of papers.316-318 Linear binarygradients of acetonitrile-water-0.1% trifluoroaceticacid at 60 °C allowed separations in 1.5-3 mindepending upon the sample. The method was vali-dated and applied to the quantification of soybeanproteins in infant formulas and powdered and liquidsoybean milks. It also enabled the rapid detection ofadulterations of powdered soybean milks by additionof bovine whey proteins. It was possible to detectabout 1% and 1.3% of R-lactalbumin and â-lacto-globulins, respectively, in a commercial powderedsoybean milk in which these proteins were includedin its formulation. Similar separations obtained byconventional reversed-phase high-performance liquidchromatography required up to ∼4 times longer.
Fast Analytical-Scale Separations by CE and LC Chemical Reviews, 1999, Vol. 99, No. 10 3117
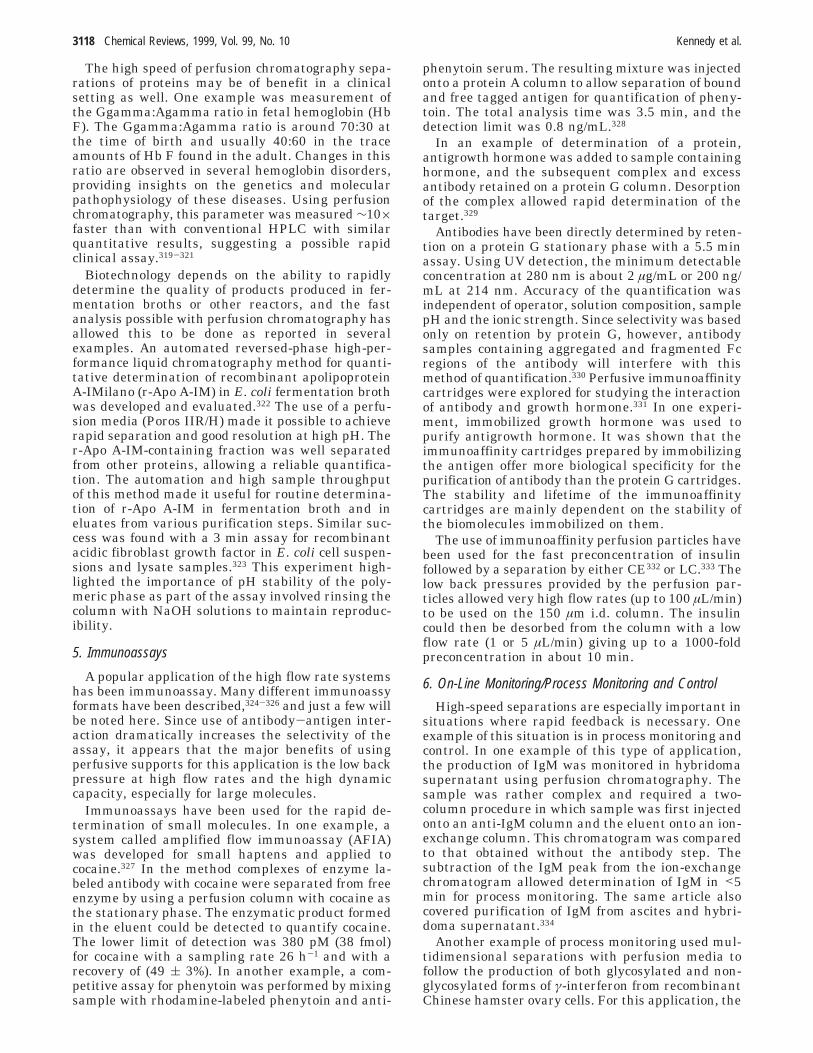
The high speed of perfusion chromatography sepa-rations of proteins may be of benefit in a clinicalsetting as well. One example was measurement ofthe Ggamma:Agamma ratio in fetal hemoglobin (HbF). The Ggamma:Agamma ratio is around 70:30 atthe time of birth and usually 40:60 in the traceamounts of Hb F found in the adult. Changes in thisratio are observed in several hemoglobin disorders,providing insights on the genetics and molecularpathophysiology of these diseases. Using perfusionchromatography, this parameter was measured ∼10×faster than with conventional HPLC with similarquantitative results, suggesting a possible rapidclinical assay.319-321
Biotechnology depends on the ability to rapidlydetermine the quality of products produced in fer-mentation broths or other reactors, and the fastanalysis possible with perfusion chromatography hasallowed this to be done as reported in severalexamples. An automated reversed-phase high-per-formance liquid chromatography method for quanti-tative determination of recombinant apolipoproteinA-IMilano (r-Apo A-IM) in E. coli fermentation brothwas developed and evaluated.322 The use of a perfu-sion media (Poros IIR/H) made it possible to achieverapid separation and good resolution at high pH. Ther-Apo A-IM-containing fraction was well separatedfrom other proteins, allowing a reliable quantifica-tion. The automation and high sample throughputof this method made it useful for routine determina-tion of r-Apo A-IM in fermentation broth and ineluates from various purification steps. Similar suc-cess was found with a 3 min assay for recombinantacidic fibroblast growth factor in E. coli cell suspen-sions and lysate samples.323 This experiment high-lighted the importance of pH stability of the poly-meric phase as part of the assay involved rinsing thecolumn with NaOH solutions to maintain reproduc-ibility.
5. Immunoassays
A popular application of the high flow rate systemshas been immunoassay. Many different immunoassyformats have been described,324-326 and just a few willbe noted here. Since use of antibody-antigen inter-action dramatically increases the selectivity of theassay, it appears that the major benefits of usingperfusive supports for this application is the low backpressure at high flow rates and the high dynamiccapacity, especially for large molecules.
Immunoassays have been used for the rapid de-termination of small molecules. In one example, asystem called amplified flow immunoassay (AFIA)was developed for small haptens and applied tococaine.327 In the method complexes of enzyme la-beled antibody with cocaine were separated from freeenzyme by using a perfusion column with cocaine asthe stationary phase. The enzymatic product formedin the eluent could be detected to quantify cocaine.The lower limit of detection was 380 pM (38 fmol)for cocaine with a sampling rate 26 h-1 and with arecovery of (49 ( 3%). In another example, a com-petitive assay for phenytoin was performed by mixingsample with rhodamine-labeled phenytoin and anti-
phenytoin serum. The resulting mixture was injectedonto a protein A column to allow separation of boundand free tagged antigen for quantification of pheny-toin. The total analysis time was 3.5 min, and thedetection limit was 0.8 ng/mL.328
In an example of determination of a protein,antigrowth hormone was added to sample containinghormone, and the subsequent complex and excessantibody retained on a protein G column. Desorptionof the complex allowed rapid determination of thetarget.329
Antibodies have been directly determined by reten-tion on a protein G stationary phase with a 5.5 minassay. Using UV detection, the minimum detectableconcentration at 280 nm is about 2 µg/mL or 200 ng/mL at 214 nm. Accuracy of the quantification wasindependent of operator, solution composition, samplepH and the ionic strength. Since selectivity was basedonly on retention by protein G, however, antibodysamples containing aggregated and fragmented Fcregions of the antibody will interfere with thismethod of quantification.330 Perfusive immunoaffinitycartridges were explored for studying the interactionof antibody and growth hormone.331 In one experi-ment, immobilized growth hormone was used topurify antigrowth hormone. It was shown that theimmunoaffinity cartridges prepared by immobilizingthe antigen offer more biological specificity for thepurification of antibody than the protein G cartridges.The stability and lifetime of the immunoaffinitycartridges are mainly dependent on the stability ofthe biomolecules immobilized on them.
The use of immunoaffinity perfusion particles havebeen used for the fast preconcentration of insulinfollowed by a separation by either CE332 or LC.333 Thelow back pressures provided by the perfusion par-ticles allowed very high flow rates (up to 100 µL/min)to be used on the 150 µm i.d. column. The insulincould then be desorbed from the column with a lowflow rate (1 or 5 µL/min) giving up to a 1000-foldpreconcentration in about 10 min.
6. On-Line Monitoring/Process Monitoring and Control
High-speed separations are especially important insituations where rapid feedback is necessary. Oneexample of this situation is in process monitoring andcontrol. In one example of this type of application,the production of IgM was monitored in hybridomasupernatant using perfusion chromatography. Thesample was rather complex and required a two-column procedure in which sample was first injectedonto an anti-IgM column and the eluent onto an ion-exchange column. This chromatogram was comparedto that obtained without the antibody step. Thesubtraction of the IgM peak from the ion-exchangechromatogram allowed determination of IgM in <5min for process monitoring. The same article alsocovered purification of IgM from ascites and hybri-doma supernatant.334
Another example of process monitoring used mul-tidimensional separations with perfusion media tofollow the production of both glycosylated and non-glycosylated forms of γ-interferon from recombinantChinese hamster ovary cells. For this application, the
3118 Chemical Reviews, 1999, Vol. 99, No. 10 Kennedy et al.
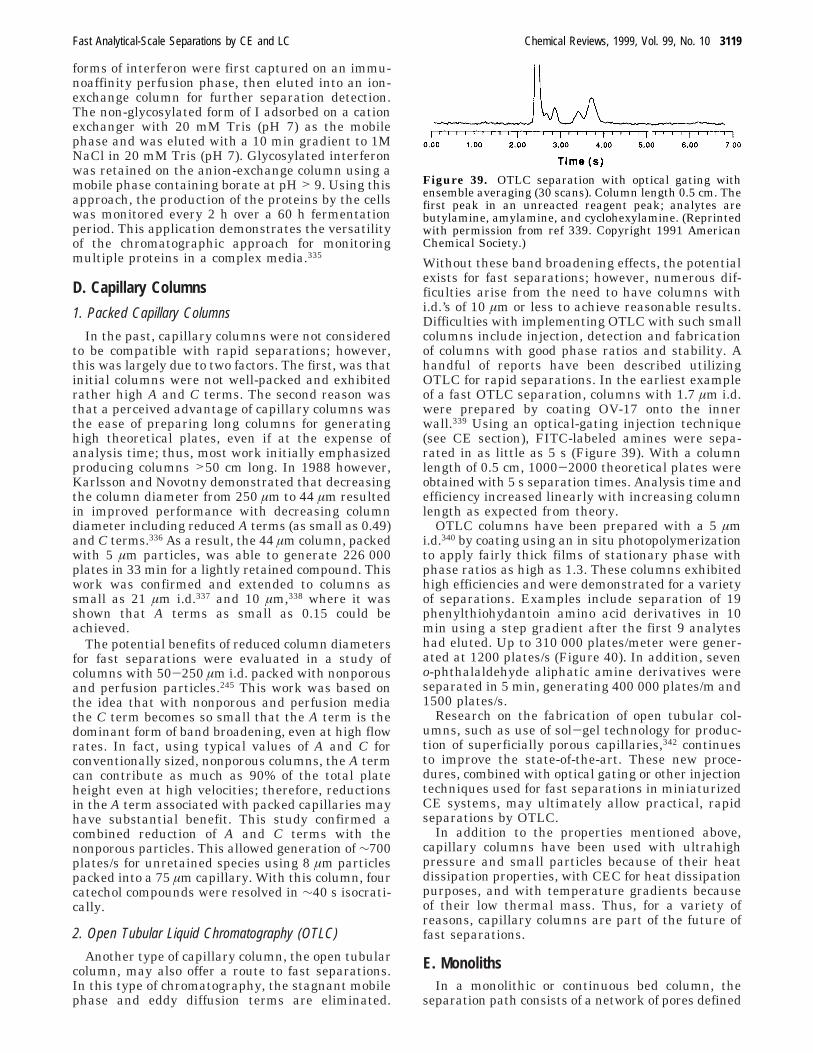
forms of interferon were first captured on an immu-noaffinity perfusion phase, then eluted into an ion-exchange column for further separation detection.The non-glycosylated form of I adsorbed on a cationexchanger with 20 mM Tris (pH 7) as the mobilephase and was eluted with a 10 min gradient to 1MNaCl in 20 mM Tris (pH 7). Glycosylated interferonwas retained on the anion-exchange column using amobile phase containing borate at pH > 9. Using thisapproach, the production of the proteins by the cellswas monitored every 2 h over a 60 h fermentationperiod. This application demonstrates the versatilityof the chromatographic approach for monitoringmultiple proteins in a complex media.335
D. Capillary Columns
1. Packed Capillary Columns
In the past, capillary columns were not consideredto be compatible with rapid separations; however,this was largely due to two factors. The first, was thatinitial columns were not well-packed and exhibitedrather high A and C terms. The second reason wasthat a perceived advantage of capillary columns wasthe ease of preparing long columns for generatinghigh theoretical plates, even if at the expense ofanalysis time; thus, most work initially emphasizedproducing columns >50 cm long. In 1988 however,Karlsson and Novotny demonstrated that decreasingthe column diameter from 250 µm to 44 µm resultedin improved performance with decreasing columndiameter including reduced A terms (as small as 0.49)and C terms.336 As a result, the 44 µm column, packedwith 5 µm particles, was able to generate 226 000plates in 33 min for a lightly retained compound. Thiswork was confirmed and extended to columns assmall as 21 µm i.d.337 and 10 µm,338 where it wasshown that A terms as small as 0.15 could beachieved.
The potential benefits of reduced column diametersfor fast separations were evaluated in a study ofcolumns with 50-250 µm i.d. packed with nonporousand perfusion particles.245 This work was based onthe idea that with nonporous and perfusion mediathe C term becomes so small that the A term is thedominant form of band broadening, even at high flowrates. In fact, using typical values of A and C forconventionally sized, nonporous columns, the A termcan contribute as much as 90% of the total plateheight even at high velocities; therefore, reductionsin the A term associated with packed capillaries mayhave substantial benefit. This study confirmed acombined reduction of A and C terms with thenonporous particles. This allowed generation of ∼700plates/s for unretained species using 8 µm particlespacked into a 75 µm capillary. With this column, fourcatechol compounds were resolved in ∼40 s isocrati-cally.
2. Open Tubular Liquid Chromatography (OTLC)
Another type of capillary column, the open tubularcolumn, may also offer a route to fast separations.In this type of chromatography, the stagnant mobilephase and eddy diffusion terms are eliminated.
Without these band broadening effects, the potentialexists for fast separations; however, numerous dif-ficulties arise from the need to have columns withi.d.’s of 10 µm or less to achieve reasonable results.Difficulties with implementing OTLC with such smallcolumns include injection, detection and fabricationof columns with good phase ratios and stability. Ahandful of reports have been described utilizingOTLC for rapid separations. In the earliest exampleof a fast OTLC separation, columns with 1.7 µm i.d.were prepared by coating OV-17 onto the innerwall.339 Using an optical-gating injection technique(see CE section), FITC-labeled amines were sepa-rated in as little as 5 s (Figure 39). With a columnlength of 0.5 cm, 1000-2000 theoretical plates wereobtained with 5 s separation times. Analysis time andefficiency increased linearly with increasing columnlength as expected from theory.
OTLC columns have been prepared with a 5 µmi.d.340 by coating using an in situ photopolymerizationto apply fairly thick films of stationary phase withphase ratios as high as 1.3. These columns exhibitedhigh efficiencies and were demonstrated for a varietyof separations. Examples include separation of 19phenylthiohydantoin amino acid derivatives in 10min using a step gradient after the first 9 analyteshad eluted. Up to 310 000 plates/meter were gener-ated at 1200 plates/s (Figure 40). In addition, seveno-phthalaldehyde aliphatic amine derivatives wereseparated in 5 min, generating 400 000 plates/m and1500 plates/s.
Research on the fabrication of open tubular col-umns, such as use of sol-gel technology for produc-tion of superficially porous capillaries,342 continuesto improve the state-of-the-art. These new proce-dures, combined with optical gating or other injectiontechniques used for fast separations in miniaturizedCE systems, may ultimately allow practical, rapidseparations by OTLC.
In addition to the properties mentioned above,capillary columns have been used with ultrahighpressure and small particles because of their heatdissipation properties, with CEC for heat dissipationpurposes, and with temperature gradients becauseof their low thermal mass. Thus, for a variety ofreasons, capillary columns are part of the future offast separations.
E. MonolithsIn a monolithic or continuous bed column, the
separation path consists of a network of pores defined
Figure 39. OTLC separation with optical gating withensemble averaging (30 scans). Column length 0.5 cm. Thefirst peak in an unreacted reagent peak; analytes arebutylamine, amylamine, and cyclohexylamine. (Reprintedwith permission from ref 339. Copyright 1991 AmericanChemical Society.)
Fast Analytical-Scale Separations by CE and LC Chemical Reviews, 1999, Vol. 99, No. 10 3119
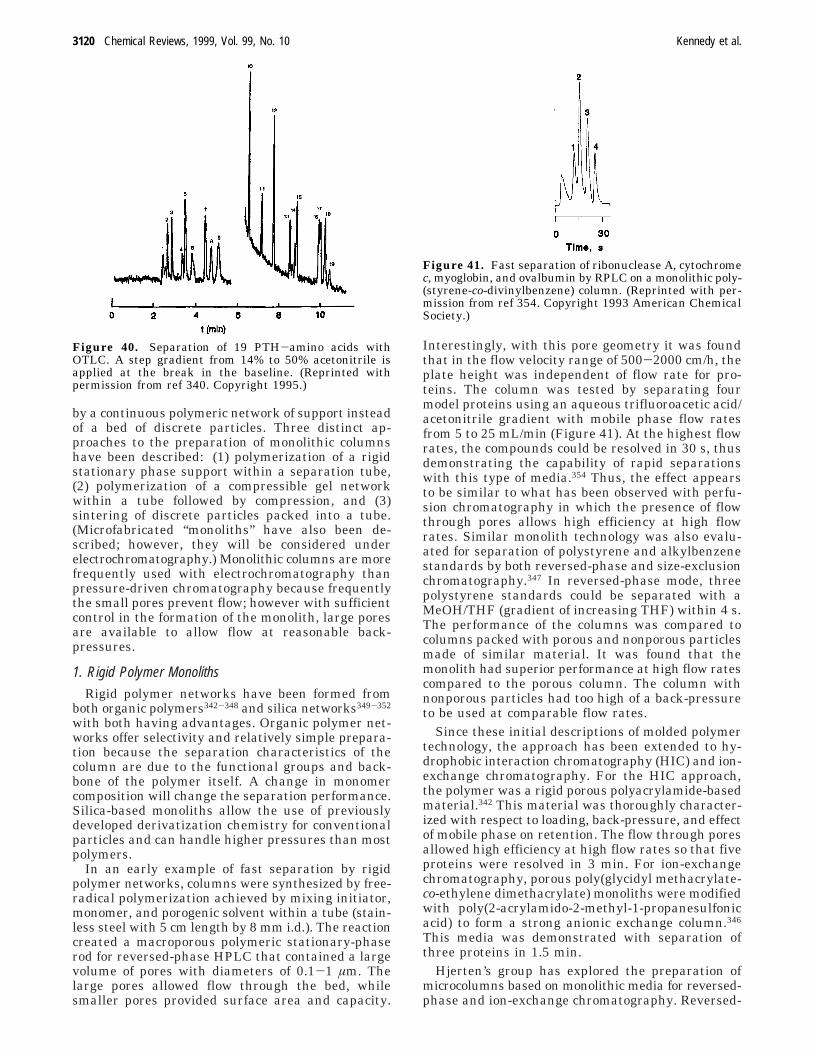
by a continuous polymeric network of support insteadof a bed of discrete particles. Three distinct ap-proaches to the preparation of monolithic columnshave been described: (1) polymerization of a rigidstationary phase support within a separation tube,(2) polymerization of a compressible gel networkwithin a tube followed by compression, and (3)sintering of discrete particles packed into a tube.(Microfabricated “monoliths” have also been de-scribed; however, they will be considered underelectrochromatography.) Monolithic columns are morefrequently used with electrochromatography thanpressure-driven chromatography because frequentlythe small pores prevent flow; however with sufficientcontrol in the formation of the monolith, large poresare available to allow flow at reasonable back-pressures.
1. Rigid Polymer MonolithsRigid polymer networks have been formed from
both organic polymers342-348 and silica networks349-352
with both having advantages. Organic polymer net-works offer selectivity and relatively simple prepara-tion because the separation characteristics of thecolumn are due to the functional groups and back-bone of the polymer itself. A change in monomercomposition will change the separation performance.Silica-based monoliths allow the use of previouslydeveloped derivatization chemistry for conventionalparticles and can handle higher pressures than mostpolymers.
In an early example of fast separation by rigidpolymer networks, columns were synthesized by free-radical polymerization achieved by mixing initiator,monomer, and porogenic solvent within a tube (stain-less steel with 5 cm length by 8 mm i.d.). The reactioncreated a macroporous polymeric stationary-phaserod for reversed-phase HPLC that contained a largevolume of pores with diameters of 0.1-1 µm. Thelarge pores allowed flow through the bed, whilesmaller pores provided surface area and capacity.
Interestingly, with this pore geometry it was foundthat in the flow velocity range of 500-2000 cm/h, theplate height was independent of flow rate for pro-teins. The column was tested by separating fourmodel proteins using an aqueous trifluoroacetic acid/acetonitrile gradient with mobile phase flow ratesfrom 5 to 25 mL/min (Figure 41). At the highest flowrates, the compounds could be resolved in 30 s, thusdemonstrating the capability of rapid separationswith this type of media.354 Thus, the effect appearsto be similar to what has been observed with perfu-sion chromatography in which the presence of flowthrough pores allows high efficiency at high flowrates. Similar monolith technology was also evalu-ated for separation of polystyrene and alkylbenzenestandards by both reversed-phase and size-exclusionchromatography.347 In reversed-phase mode, threepolystyrene standards could be separated with aMeOH/THF (gradient of increasing THF) within 4 s.The performance of the columns was compared tocolumns packed with porous and nonporous particlesmade of similar material. It was found that themonolith had superior performance at high flow ratescompared to the porous column. The column withnonporous particles had too high of a back-pressureto be used at comparable flow rates.
Since these initial descriptions of molded polymertechnology, the approach has been extended to hy-drophobic interaction chromatography (HIC) and ion-exchange chromatography. For the HIC approach,the polymer was a rigid porous polyacrylamide-basedmaterial.342 This material was thoroughly character-ized with respect to loading, back-pressure, and effectof mobile phase on retention. The flow through poresallowed high efficiency at high flow rates so that fiveproteins were resolved in 3 min. For ion-exchangechromatography, porous poly(glycidyl methacrylate-co-ethylene dimethacrylate) monoliths were modifiedwith poly(2-acrylamido-2-methyl-1-propanesulfonicacid) to form a strong anionic exchange column.346
This media was demonstrated with separation ofthree proteins in 1.5 min.
Hjerten’s group has explored the preparation ofmicrocolumns based on monolithic media for reversed-phase and ion-exchange chromatography. Reversed-
Figure 40. Separation of 19 PTH-amino acids withOTLC. A step gradient from 14% to 50% acetonitrile isapplied at the break in the baseline. (Reprinted withpermission from ref 340. Copyright 1995.)
Figure 41. Fast separation of ribonuclease A, cytochromec, myoglobin, and ovalbumin by RPLC on a monolithic poly-(styrene-co-divinylbenzene) column. (Reprinted with per-mission from ref 354. Copyright 1993 American ChemicalSociety.)
3120 Chemical Reviews, 1999, Vol. 99, No. 10 Kennedy et al.
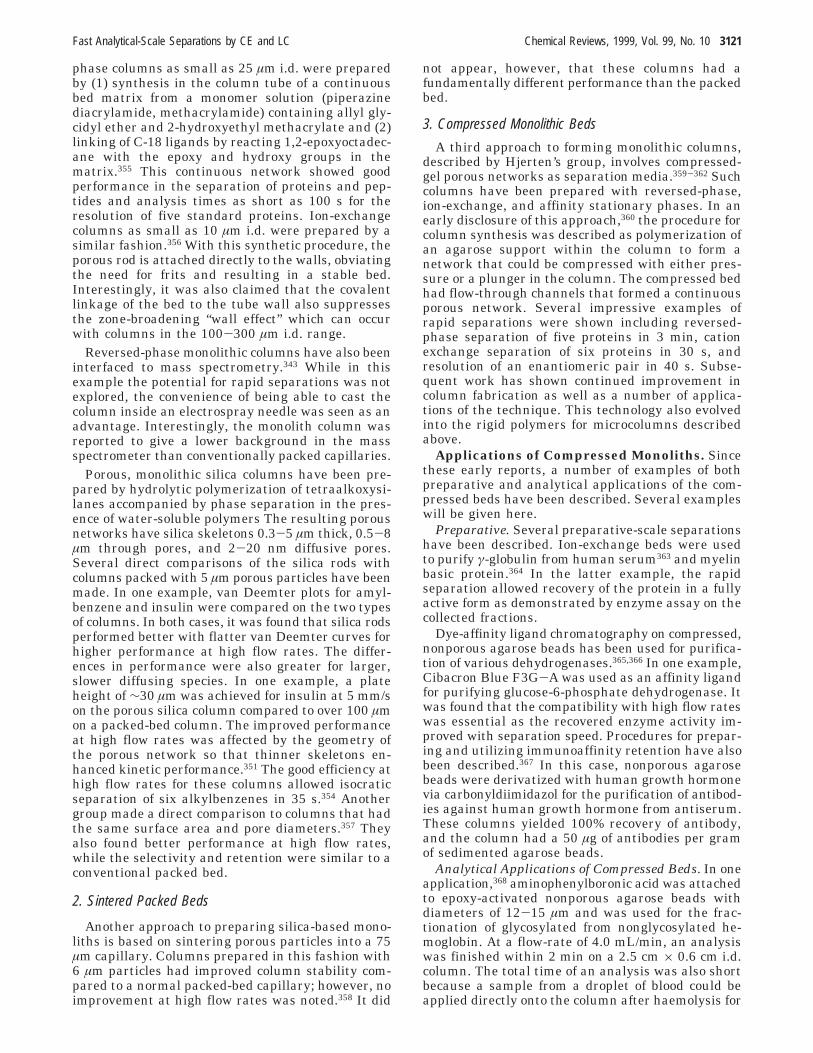
phase columns as small as 25 µm i.d. were preparedby (1) synthesis in the column tube of a continuousbed matrix from a monomer solution (piperazinediacrylamide, methacrylamide) containing allyl gly-cidyl ether and 2-hydroxyethyl methacrylate and (2)linking of C-18 ligands by reacting 1,2-epoxyoctadec-ane with the epoxy and hydroxy groups in thematrix.355 This continuous network showed goodperformance in the separation of proteins and pep-tides and analysis times as short as 100 s for theresolution of five standard proteins. Ion-exchangecolumns as small as 10 µm i.d. were prepared by asimilar fashion.356 With this synthetic procedure, theporous rod is attached directly to the walls, obviatingthe need for frits and resulting in a stable bed.Interestingly, it was also claimed that the covalentlinkage of the bed to the tube wall also suppressesthe zone-broadening “wall effect” which can occurwith columns in the 100-300 µm i.d. range.
Reversed-phase monolithic columns have also beeninterfaced to mass spectrometry.343 While in thisexample the potential for rapid separations was notexplored, the convenience of being able to cast thecolumn inside an electrospray needle was seen as anadvantage. Interestingly, the monolith column wasreported to give a lower background in the massspectrometer than conventionally packed capillaries.
Porous, monolithic silica columns have been pre-pared by hydrolytic polymerization of tetraalkoxysi-lanes accompanied by phase separation in the pres-ence of water-soluble polymers The resulting porousnetworks have silica skeletons 0.3-5 µm thick, 0.5-8µm through pores, and 2-20 nm diffusive pores.Several direct comparisons of the silica rods withcolumns packed with 5 µm porous particles have beenmade. In one example, van Deemter plots for amyl-benzene and insulin were compared on the two typesof columns. In both cases, it was found that silica rodsperformed better with flatter van Deemter curves forhigher performance at high flow rates. The differ-ences in performance were also greater for larger,slower diffusing species. In one example, a plateheight of ∼30 µm was achieved for insulin at 5 mm/son the porous silica column compared to over 100 µmon a packed-bed column. The improved performanceat high flow rates was affected by the geometry ofthe porous network so that thinner skeletons en-hanced kinetic performance.351 The good efficiency athigh flow rates for these columns allowed isocraticseparation of six alkylbenzenes in 35 s.354 Anothergroup made a direct comparison to columns that hadthe same surface area and pore diameters.357 Theyalso found better performance at high flow rates,while the selectivity and retention were similar to aconventional packed bed.
2. Sintered Packed Beds
Another approach to preparing silica-based mono-liths is based on sintering porous particles into a 75µm capillary. Columns prepared in this fashion with6 µm particles had improved column stability com-pared to a normal packed-bed capillary; however, noimprovement at high flow rates was noted.358 It did
not appear, however, that these columns had afundamentally different performance than the packedbed.
3. Compressed Monolithic Beds
A third approach to forming monolithic columns,described by Hjerten’s group, involves compressed-gel porous networks as separation media.359-362 Suchcolumns have been prepared with reversed-phase,ion-exchange, and affinity stationary phases. In anearly disclosure of this approach,360 the procedure forcolumn synthesis was described as polymerization ofan agarose support within the column to form anetwork that could be compressed with either pres-sure or a plunger in the column. The compressed bedhad flow-through channels that formed a continuousporous network. Several impressive examples ofrapid separations were shown including reversed-phase separation of five proteins in 3 min, cationexchange separation of six proteins in 30 s, andresolution of an enantiomeric pair in 40 s. Subse-quent work has shown continued improvement incolumn fabrication as well as a number of applica-tions of the technique. This technology also evolvedinto the rigid polymers for microcolumns describedabove.
Applications of Compressed Monoliths. Sincethese early reports, a number of examples of bothpreparative and analytical applications of the com-pressed beds have been described. Several exampleswill be given here.
Preparative. Several preparative-scale separationshave been described. Ion-exchange beds were usedto purify γ-globulin from human serum363 and myelinbasic protein.364 In the latter example, the rapidseparation allowed recovery of the protein in a fullyactive form as demonstrated by enzyme assay on thecollected fractions.
Dye-affinity ligand chromatography on compressed,nonporous agarose beads has been used for purifica-tion of various dehydrogenases.365,366 In one example,Cibacron Blue F3G-A was used as an affinity ligandfor purifying glucose-6-phosphate dehydrogenase. Itwas found that the compatibility with high flow rateswas essential as the recovered enzyme activity im-proved with separation speed. Procedures for prepar-ing and utilizing immunoaffinity retention have alsobeen described.367 In this case, nonporous agarosebeads were derivatized with human growth hormonevia carbonyldiimidazol for the purification of antibod-ies against human growth hormone from antiserum.These columns yielded 100% recovery of antibody,and the column had a 50 µg of antibodies per gramof sedimented agarose beads.
Analytical Applications of Compressed Beds. In oneapplication,368 aminophenylboronic acid was attachedto epoxy-activated nonporous agarose beads withdiameters of 12-15 µm and was used for the frac-tionation of glycosylated from nonglycosylated he-moglobin. At a flow-rate of 4.0 mL/min, an analysiswas finished within 2 min on a 2.5 cm × 0.6 cm i.d.column. The total time of an analysis was also shortbecause a sample from a droplet of blood could beapplied directly onto the column after haemolysis for
Fast Analytical-Scale Separations by CE and LC Chemical Reviews, 1999, Vol. 99, No. 10 3121
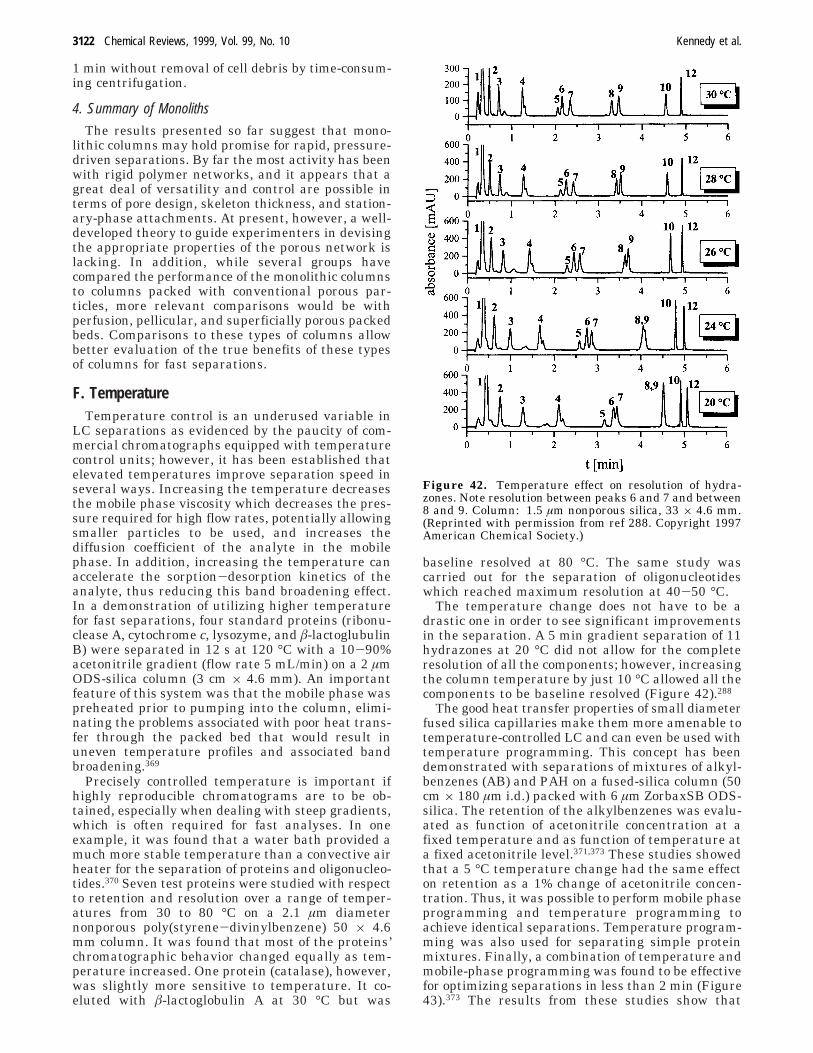
1 min without removal of cell debris by time-consum-ing centrifugation.
4. Summary of Monoliths
The results presented so far suggest that mono-lithic columns may hold promise for rapid, pressure-driven separations. By far the most activity has beenwith rigid polymer networks, and it appears that agreat deal of versatility and control are possible interms of pore design, skeleton thickness, and station-ary-phase attachments. At present, however, a well-developed theory to guide experimenters in devisingthe appropriate properties of the porous network islacking. In addition, while several groups havecompared the performance of the monolithic columnsto columns packed with conventional porous par-ticles, more relevant comparisons would be withperfusion, pellicular, and superficially porous packedbeds. Comparisons to these types of columns allowbetter evaluation of the true benefits of these typesof columns for fast separations.
F. TemperatureTemperature control is an underused variable in
LC separations as evidenced by the paucity of com-mercial chromatographs equipped with temperaturecontrol units; however, it has been established thatelevated temperatures improve separation speed inseveral ways. Increasing the temperature decreasesthe mobile phase viscosity which decreases the pres-sure required for high flow rates, potentially allowingsmaller particles to be used, and increases thediffusion coefficient of the analyte in the mobilephase. In addition, increasing the temperature canaccelerate the sorption-desorption kinetics of theanalyte, thus reducing this band broadening effect.In a demonstration of utilizing higher temperaturefor fast separations, four standard proteins (ribonu-clease A, cytochrome c, lysozyme, and â-lactoglubulinB) were separated in 12 s at 120 °C with a 10-90%acetonitrile gradient (flow rate 5 mL/min) on a 2 µmODS-silica column (3 cm × 4.6 mm). An importantfeature of this system was that the mobile phase waspreheated prior to pumping into the column, elimi-nating the problems associated with poor heat trans-fer through the packed bed that would result inuneven temperature profiles and associated bandbroadening.369
Precisely controlled temperature is important ifhighly reproducible chromatograms are to be ob-tained, especially when dealing with steep gradients,which is often required for fast analyses. In oneexample, it was found that a water bath provided amuch more stable temperature than a convective airheater for the separation of proteins and oligonucleo-tides.370 Seven test proteins were studied with respectto retention and resolution over a range of temper-atures from 30 to 80 °C on a 2.1 µm diameternonporous poly(styrene-divinylbenzene) 50 × 4.6mm column. It was found that most of the proteins’chromatographic behavior changed equally as tem-perature increased. One protein (catalase), however,was slightly more sensitive to temperature. It co-eluted with â-lactoglobulin A at 30 °C but was
baseline resolved at 80 °C. The same study wascarried out for the separation of oligonucleotideswhich reached maximum resolution at 40-50 °C.
The temperature change does not have to be adrastic one in order to see significant improvementsin the separation. A 5 min gradient separation of 11hydrazones at 20 °C did not allow for the completeresolution of all the components; however, increasingthe column temperature by just 10 °C allowed all thecomponents to be baseline resolved (Figure 42).288
The good heat transfer properties of small diameterfused silica capillaries make them more amenable totemperature-controlled LC and can even be used withtemperature programming. This concept has beendemonstrated with separations of mixtures of alkyl-benzenes (AB) and PAH on a fused-silica column (50cm × 180 µm i.d.) packed with 6 µm ZorbaxSB ODS-silica. The retention of the alkylbenzenes was evalu-ated as function of acetonitrile concentration at afixed temperature and as function of temperature ata fixed acetonitrile level.371,373 These studies showedthat a 5 °C temperature change had the same effecton retention as a 1% change of acetonitrile concen-tration. Thus, it was possible to perform mobile phaseprogramming and temperature programming toachieve identical separations. Temperature program-ming was also used for separating simple proteinmixtures. Finally, a combination of temperature andmobile-phase programming was found to be effectivefor optimizing separations in less than 2 min (Figure43).373 The results from these studies show that
Figure 42. Temperature effect on resolution of hydra-zones. Note resolution between peaks 6 and 7 and between8 and 9. Column: 1.5 µm nonporous silica, 33 × 4.6 mm.(Reprinted with permission from ref 288. Copyright 1997American Chemical Society.)
3122 Chemical Reviews, 1999, Vol. 99, No. 10 Kennedy et al.
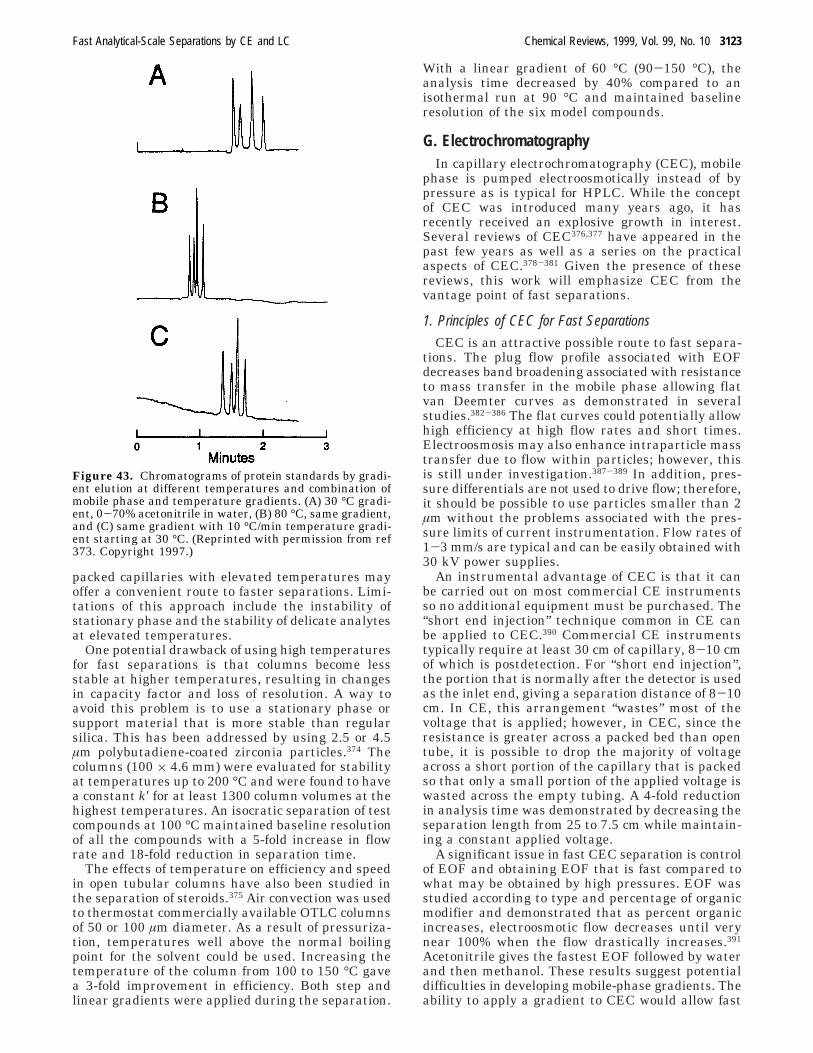
packed capillaries with elevated temperatures mayoffer a convenient route to faster separations. Limi-tations of this approach include the instability ofstationary phase and the stability of delicate analytesat elevated temperatures.
One potential drawback of using high temperaturesfor fast separations is that columns become lessstable at higher temperatures, resulting in changesin capacity factor and loss of resolution. A way toavoid this problem is to use a stationary phase orsupport material that is more stable than regularsilica. This has been addressed by using 2.5 or 4.5µm polybutadiene-coated zirconia particles.374 Thecolumns (100 × 4.6 mm) were evaluated for stabilityat temperatures up to 200 °C and were found to havea constant k′ for at least 1300 column volumes at thehighest temperatures. An isocratic separation of testcompounds at 100 °C maintained baseline resolutionof all the compounds with a 5-fold increase in flowrate and 18-fold reduction in separation time.
The effects of temperature on efficiency and speedin open tubular columns have also been studied inthe separation of steroids.375 Air convection was usedto thermostat commercially available OTLC columnsof 50 or 100 µm diameter. As a result of pressuriza-tion, temperatures well above the normal boilingpoint for the solvent could be used. Increasing thetemperature of the column from 100 to 150 °C gavea 3-fold improvement in efficiency. Both step andlinear gradients were applied during the separation.
With a linear gradient of 60 °C (90-150 °C), theanalysis time decreased by 40% compared to anisothermal run at 90 °C and maintained baselineresolution of the six model compounds.
G. ElectrochromatographyIn capillary electrochromatography (CEC), mobile
phase is pumped electroosmotically instead of bypressure as is typical for HPLC. While the conceptof CEC was introduced many years ago, it hasrecently received an explosive growth in interest.Several reviews of CEC376,377 have appeared in thepast few years as well as a series on the practicalaspects of CEC.378-381 Given the presence of thesereviews, this work will emphasize CEC from thevantage point of fast separations.
1. Principles of CEC for Fast Separations
CEC is an attractive possible route to fast separa-tions. The plug flow profile associated with EOFdecreases band broadening associated with resistanceto mass transfer in the mobile phase allowing flatvan Deemter curves as demonstrated in severalstudies.382-386 The flat curves could potentially allowhigh efficiency at high flow rates and short times.Electroosmosis may also enhance intraparticle masstransfer due to flow within particles; however, thisis still under investigation.387-389 In addition, pres-sure differentials are not used to drive flow; therefore,it should be possible to use particles smaller than 2µm without the problems associated with the pres-sure limits of current instrumentation. Flow rates of1-3 mm/s are typical and can be easily obtained with30 kV power supplies.
An instrumental advantage of CEC is that it canbe carried out on most commercial CE instrumentsso no additional equipment must be purchased. The“short end injection” technique common in CE canbe applied to CEC.390 Commercial CE instrumentstypically require at least 30 cm of capillary, 8-10 cmof which is postdetection. For “short end injection”,the portion that is normally after the detector is usedas the inlet end, giving a separation distance of 8-10cm. In CE, this arrangement “wastes” most of thevoltage that is applied; however, in CEC, since theresistance is greater across a packed bed than opentube, it is possible to drop the majority of voltageacross a short portion of the capillary that is packedso that only a small portion of the applied voltage iswasted across the empty tubing. A 4-fold reductionin analysis time was demonstrated by decreasing theseparation length from 25 to 7.5 cm while maintain-ing a constant applied voltage.
A significant issue in fast CEC separation is controlof EOF and obtaining EOF that is fast compared towhat may be obtained by high pressures. EOF wasstudied according to type and percentage of organicmodifier and demonstrated that as percent organicincreases, electroosmotic flow decreases until verynear 100% when the flow drastically increases.391
Acetonitrile gives the fastest EOF followed by waterand then methanol. These results suggest potentialdifficulties in developing mobile-phase gradients. Theability to apply a gradient to CEC would allow fast
Figure 43. Chromatograms of protein standards by gradi-ent elution at different temperatures and combination ofmobile phase and temperature gradients. (A) 30 °C gradi-ent, 0-70% acetonitrile in water, (B) 80 °C, same gradient,and (C) same gradient with 10 °C/min temperature gradi-ent starting at 30 °C. (Reprinted with permission from ref373. Copyright 1997.)
Fast Analytical-Scale Separations by CE and LC Chemical Reviews, 1999, Vol. 99, No. 10 3123
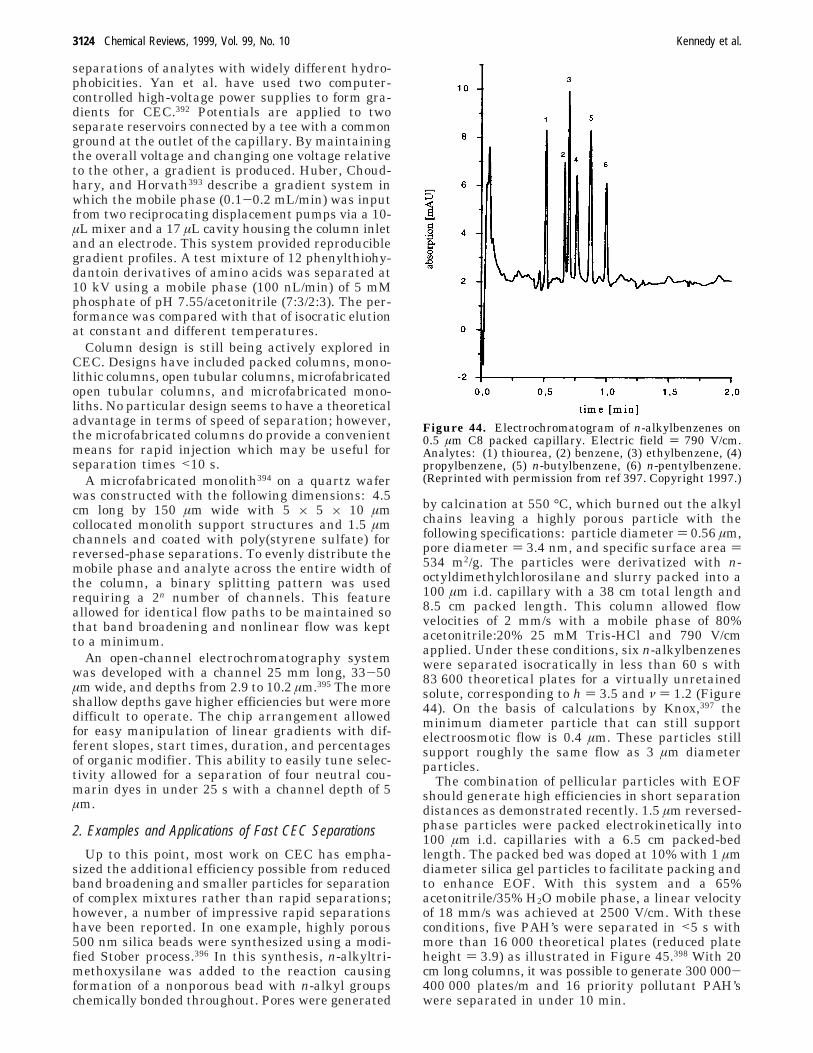
separations of analytes with widely different hydro-phobicities. Yan et al. have used two computer-controlled high-voltage power supplies to form gra-dients for CEC.392 Potentials are applied to twoseparate reservoirs connected by a tee with a commonground at the outlet of the capillary. By maintainingthe overall voltage and changing one voltage relativeto the other, a gradient is produced. Huber, Choud-hary, and Horvath393 describe a gradient system inwhich the mobile phase (0.1-0.2 mL/min) was inputfrom two reciprocating displacement pumps via a 10-µL mixer and a 17 µL cavity housing the column inletand an electrode. This system provided reproduciblegradient profiles. A test mixture of 12 phenylthiohy-dantoin derivatives of amino acids was separated at10 kV using a mobile phase (100 nL/min) of 5 mMphosphate of pH 7.55/acetonitrile (7:3/2:3). The per-formance was compared with that of isocratic elutionat constant and different temperatures.
Column design is still being actively explored inCEC. Designs have included packed columns, mono-lithic columns, open tubular columns, microfabricatedopen tubular columns, and microfabricated mono-liths. No particular design seems to have a theoreticaladvantage in terms of speed of separation; however,the microfabricated columns do provide a convenientmeans for rapid injection which may be useful forseparation times <10 s.
A microfabricated monolith394 on a quartz waferwas constructed with the following dimensions: 4.5cm long by 150 µm wide with 5 × 5 × 10 µmcollocated monolith support structures and 1.5 µmchannels and coated with poly(styrene sulfate) forreversed-phase separations. To evenly distribute themobile phase and analyte across the entire width ofthe column, a binary splitting pattern was usedrequiring a 2n number of channels. This featureallowed for identical flow paths to be maintained sothat band broadening and nonlinear flow was keptto a minimum.
An open-channel electrochromatography systemwas developed with a channel 25 mm long, 33-50µm wide, and depths from 2.9 to 10.2 µm.395 The moreshallow depths gave higher efficiencies but were moredifficult to operate. The chip arrangement allowedfor easy manipulation of linear gradients with dif-ferent slopes, start times, duration, and percentagesof organic modifier. This ability to easily tune selec-tivity allowed for a separation of four neutral cou-marin dyes in under 25 s with a channel depth of 5µm.
2. Examples and Applications of Fast CEC Separations
Up to this point, most work on CEC has empha-sized the additional efficiency possible from reducedband broadening and smaller particles for separationof complex mixtures rather than rapid separations;however, a number of impressive rapid separationshave been reported. In one example, highly porous500 nm silica beads were synthesized using a modi-fied Stober process.396 In this synthesis, n-alkyltri-methoxysilane was added to the reaction causingformation of a nonporous bead with n-alkyl groupschemically bonded throughout. Pores were generated
by calcination at 550 °C, which burned out the alkylchains leaving a highly porous particle with thefollowing specifications: particle diameter ) 0.56 µm,pore diameter ) 3.4 nm, and specific surface area )534 m2/g. The particles were derivatized with n-octyldimethylchlorosilane and slurry packed into a100 µm i.d. capillary with a 38 cm total length and8.5 cm packed length. This column allowed flowvelocities of 2 mm/s with a mobile phase of 80%acetonitrile:20% 25 mM Tris-HCl and 790 V/cmapplied. Under these conditions, six n-alkylbenzeneswere separated isocratically in less than 60 s with83 600 theoretical plates for a virtually unretainedsolute, corresponding to h ) 3.5 and ν ) 1.2 (Figure44). On the basis of calculations by Knox,397 theminimum diameter particle that can still supportelectroosmotic flow is 0.4 µm. These particles stillsupport roughly the same flow as 3 µm diameterparticles.
The combination of pellicular particles with EOFshould generate high efficiencies in short separationdistances as demonstrated recently. 1.5 µm reversed-phase particles were packed electrokinetically into100 µm i.d. capillaries with a 6.5 cm packed-bedlength. The packed bed was doped at 10% with 1 µmdiameter silica gel particles to facilitate packing andto enhance EOF. With this system and a 65%acetonitrile/35% H2O mobile phase, a linear velocityof 18 mm/s was achieved at 2500 V/cm. With theseconditions, five PAH’s were separated in <5 s withmore than 16 000 theoretical plates (reduced plateheight ) 3.9) as illustrated in Figure 45.398 With 20cm long columns, it was possible to generate 300 000-400 000 plates/m and 16 priority pollutant PAH’swere separated in under 10 min.
Figure 44. Electrochromatogram of n-alkylbenzenes on0.5 µm C8 packed capillary. Electric field ) 790 V/cm.Analytes: (1) thiourea, (2) benzene, (3) ethylbenzene, (4)propylbenzene, (5) n-butylbenzene, (6) n-pentylbenzene.(Reprinted with permission from ref 397. Copyright 1997.)
3124 Chemical Reviews, 1999, Vol. 99, No. 10 Kennedy et al.
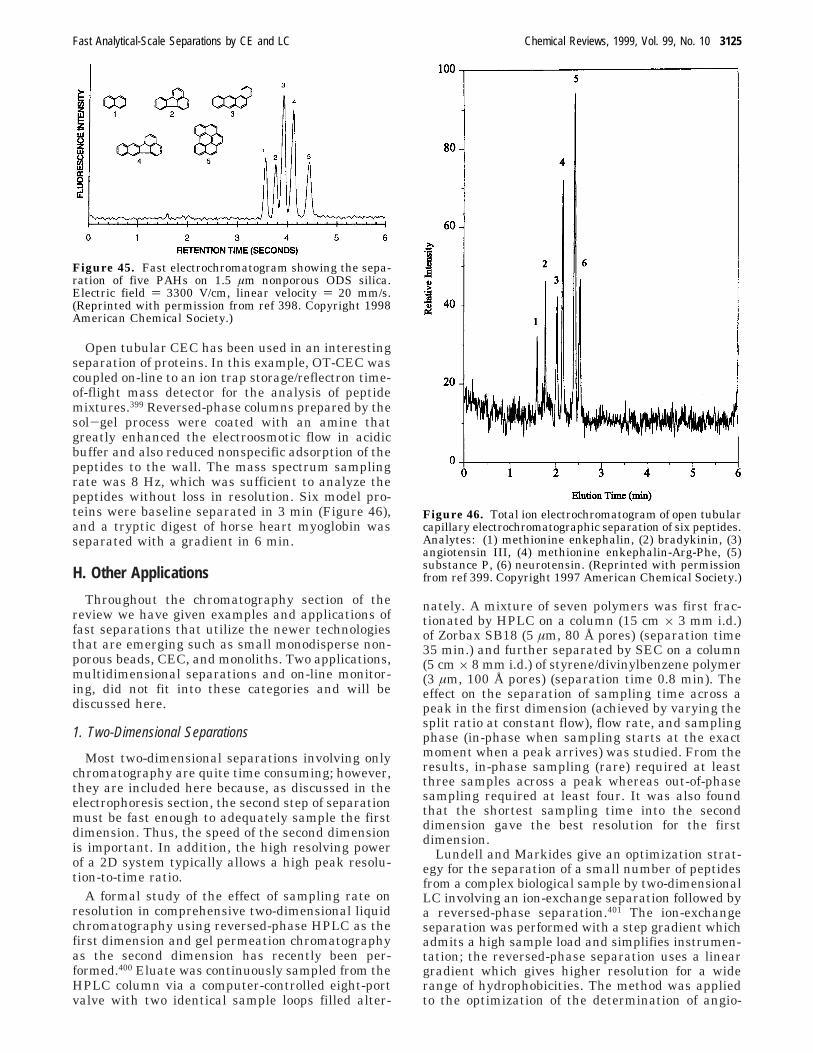
Open tubular CEC has been used in an interestingseparation of proteins. In this example, OT-CEC wascoupled on-line to an ion trap storage/reflectron time-of-flight mass detector for the analysis of peptidemixtures.399 Reversed-phase columns prepared by thesol-gel process were coated with an amine thatgreatly enhanced the electroosmotic flow in acidicbuffer and also reduced nonspecific adsorption of thepeptides to the wall. The mass spectrum samplingrate was 8 Hz, which was sufficient to analyze thepeptides without loss in resolution. Six model pro-teins were baseline separated in 3 min (Figure 46),and a tryptic digest of horse heart myoglobin wasseparated with a gradient in 6 min.
H. Other Applications
Throughout the chromatography section of thereview we have given examples and applications offast separations that utilize the newer technologiesthat are emerging such as small monodisperse non-porous beads, CEC, and monoliths. Two applications,multidimensional separations and on-line monitor-ing, did not fit into these categories and will bediscussed here.
1. Two-Dimensional Separations
Most two-dimensional separations involving onlychromatography are quite time consuming; however,they are included here because, as discussed in theelectrophoresis section, the second step of separationmust be fast enough to adequately sample the firstdimension. Thus, the speed of the second dimensionis important. In addition, the high resolving powerof a 2D system typically allows a high peak resolu-tion-to-time ratio.
A formal study of the effect of sampling rate onresolution in comprehensive two-dimensional liquidchromatography using reversed-phase HPLC as thefirst dimension and gel permeation chromatographyas the second dimension has recently been per-formed.400 Eluate was continuously sampled from theHPLC column via a computer-controlled eight-portvalve with two identical sample loops filled alter-
nately. A mixture of seven polymers was first frac-tionated by HPLC on a column (15 cm × 3 mm i.d.)of Zorbax SB18 (5 µm, 80 Å pores) (separation time35 min.) and further separated by SEC on a column(5 cm × 8 mm i.d.) of styrene/divinylbenzene polymer(3 µm, 100 Å pores) (separation time 0.8 min). Theeffect on the separation of sampling time across apeak in the first dimension (achieved by varying thesplit ratio at constant flow), flow rate, and samplingphase (in-phase when sampling starts at the exactmoment when a peak arrives) was studied. From theresults, in-phase sampling (rare) required at leastthree samples across a peak whereas out-of-phasesampling required at least four. It was also foundthat the shortest sampling time into the seconddimension gave the best resolution for the firstdimension.
Lundell and Markides give an optimization strat-egy for the separation of a small number of peptidesfrom a complex biological sample by two-dimensionalLC involving an ion-exchange separation followed bya reversed-phase separation.401 The ion-exchangeseparation was performed with a step gradient whichadmits a high sample load and simplifies instrumen-tation; the reversed-phase separation uses a lineargradient which gives higher resolution for a widerange of hydrophobicities. The method was appliedto the optimization of the determination of angio-
Figure 45. Fast electrochromatogram showing the sepa-ration of five PAHs on 1.5 µm nonporous ODS silica.Electric field ) 3300 V/cm, linear velocity ) 20 mm/s.(Reprinted with permission from ref 398. Copyright 1998American Chemical Society.)
Figure 46. Total ion electrochromatogram of open tubularcapillary electrochromatographic separation of six peptides.Analytes: (1) methionine enkephalin, (2) bradykinin, (3)angiotensin III, (4) methionine enkephalin-Arg-Phe, (5)substance P, (6) neurotensin. (Reprinted with permissionfrom ref 399. Copyright 1997 American Chemical Society.)
Fast Analytical-Scale Separations by CE and LC Chemical Reviews, 1999, Vol. 99, No. 10 3125
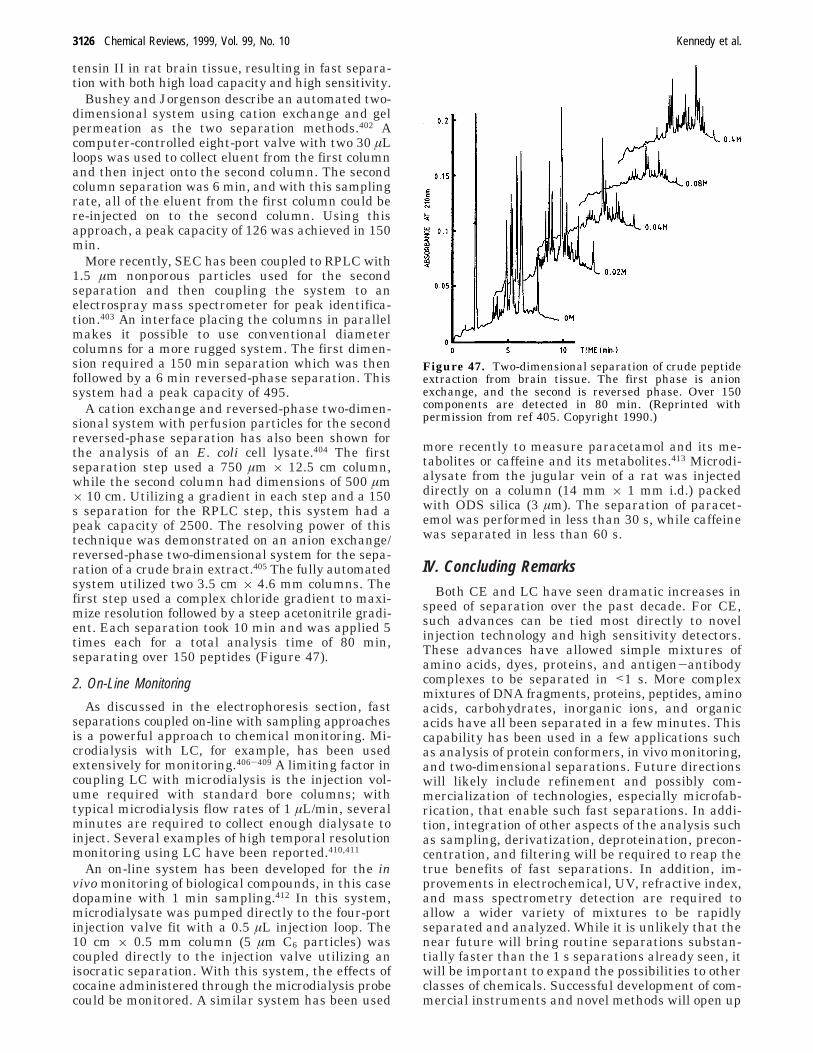
tensin II in rat brain tissue, resulting in fast separa-tion with both high load capacity and high sensitivity.
Bushey and Jorgenson describe an automated two-dimensional system using cation exchange and gelpermeation as the two separation methods.402 Acomputer-controlled eight-port valve with two 30 µLloops was used to collect eluent from the first columnand then inject onto the second column. The secondcolumn separation was 6 min, and with this samplingrate, all of the eluent from the first column could bere-injected on to the second column. Using thisapproach, a peak capacity of 126 was achieved in 150min.
More recently, SEC has been coupled to RPLC with1.5 µm nonporous particles used for the secondseparation and then coupling the system to anelectrospray mass spectrometer for peak identifica-tion.403 An interface placing the columns in parallelmakes it possible to use conventional diametercolumns for a more rugged system. The first dimen-sion required a 150 min separation which was thenfollowed by a 6 min reversed-phase separation. Thissystem had a peak capacity of 495.
A cation exchange and reversed-phase two-dimen-sional system with perfusion particles for the secondreversed-phase separation has also been shown forthe analysis of an E. coli cell lysate.404 The firstseparation step used a 750 µm × 12.5 cm column,while the second column had dimensions of 500 µm× 10 cm. Utilizing a gradient in each step and a 150s separation for the RPLC step, this system had apeak capacity of 2500. The resolving power of thistechnique was demonstrated on an anion exchange/reversed-phase two-dimensional system for the sepa-ration of a crude brain extract.405 The fully automatedsystem utilized two 3.5 cm × 4.6 mm columns. Thefirst step used a complex chloride gradient to maxi-mize resolution followed by a steep acetonitrile gradi-ent. Each separation took 10 min and was applied 5times each for a total analysis time of 80 min,separating over 150 peptides (Figure 47).
2. On-Line Monitoring
As discussed in the electrophoresis section, fastseparations coupled on-line with sampling approachesis a powerful approach to chemical monitoring. Mi-crodialysis with LC, for example, has been usedextensively for monitoring.406-409 A limiting factor incoupling LC with microdialysis is the injection vol-ume required with standard bore columns; withtypical microdialysis flow rates of 1 µL/min, severalminutes are required to collect enough dialysate toinject. Several examples of high temporal resolutionmonitoring using LC have been reported.410,411
An on-line system has been developed for the invivo monitoring of biological compounds, in this casedopamine with 1 min sampling.412 In this system,microdialysate was pumped directly to the four-portinjection valve fit with a 0.5 µL injection loop. The10 cm × 0.5 mm column (5 µm C6 particles) wascoupled directly to the injection valve utilizing anisocratic separation. With this system, the effects ofcocaine administered through the microdialysis probecould be monitored. A similar system has been used
more recently to measure paracetamol and its me-tabolites or caffeine and its metabolites.413 Microdi-alysate from the jugular vein of a rat was injecteddirectly on a column (14 mm × 1 mm i.d.) packedwith ODS silica (3 µm). The separation of paracet-emol was performed in less than 30 s, while caffeinewas separated in less than 60 s.
IV. Concluding Remarks
Both CE and LC have seen dramatic increases inspeed of separation over the past decade. For CE,such advances can be tied most directly to novelinjection technology and high sensitivity detectors.These advances have allowed simple mixtures ofamino acids, dyes, proteins, and antigen-antibodycomplexes to be separated in <1 s. More complexmixtures of DNA fragments, proteins, peptides, aminoacids, carbohydrates, inorganic ions, and organicacids have all been separated in a few minutes. Thiscapability has been used in a few applications suchas analysis of protein conformers, in vivo monitoring,and two-dimensional separations. Future directionswill likely include refinement and possibly com-mercialization of technologies, especially microfab-rication, that enable such fast separations. In addi-tion, integration of other aspects of the analysis suchas sampling, derivatization, deproteination, precon-centration, and filtering will be required to reap thetrue benefits of fast separations. In addition, im-provements in electrochemical, UV, refractive index,and mass spectrometry detection are required toallow a wider variety of mixtures to be rapidlyseparated and analyzed. While it is unlikely that thenear future will bring routine separations substan-tially faster than the 1 s separations already seen, itwill be important to expand the possibilities to otherclasses of chemicals. Successful development of com-mercial instruments and novel methods will open up
Figure 47. Two-dimensional separation of crude peptideextraction from brain tissue. The first phase is anionexchange, and the second is reversed phase. Over 150components are detected in 80 min. (Reprinted withpermission from ref 405. Copyright 1990.)
3126 Chemical Reviews, 1999, Vol. 99, No. 10 Kennedy et al.
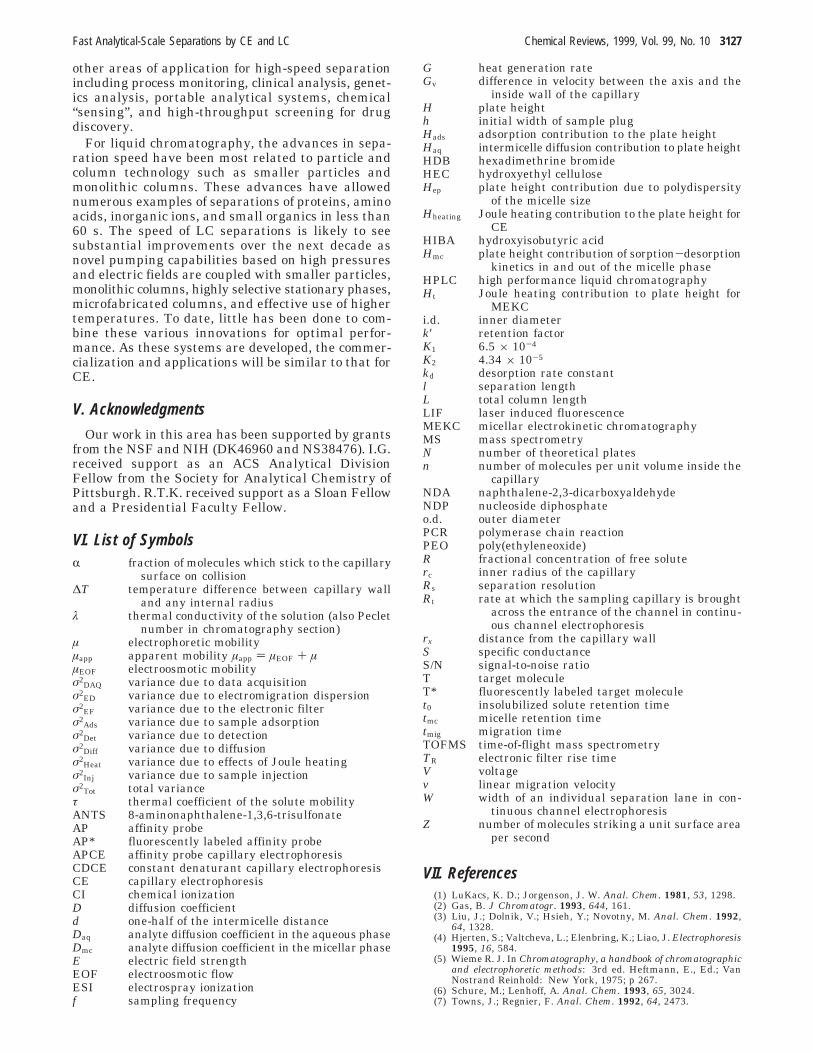
other areas of application for high-speed separationincluding process monitoring, clinical analysis, genet-ics analysis, portable analytical systems, chemical“sensing”, and high-throughput screening for drugdiscovery.
For liquid chromatography, the advances in sepa-ration speed have been most related to particle andcolumn technology such as smaller particles andmonolithic columns. These advances have allowednumerous examples of separations of proteins, aminoacids, inorganic ions, and small organics in less than60 s. The speed of LC separations is likely to seesubstantial improvements over the next decade asnovel pumping capabilities based on high pressuresand electric fields are coupled with smaller particles,monolithic columns, highly selective stationary phases,microfabricated columns, and effective use of highertemperatures. To date, little has been done to com-bine these various innovations for optimal perfor-mance. As these systems are developed, the commer-cialization and applications will be similar to that forCE.
V. Acknowledgments
Our work in this area has been supported by grantsfrom the NSF and NIH (DK46960 and NS38476). I.G.received support as an ACS Analytical DivisionFellow from the Society for Analytical Chemistry ofPittsburgh. R.T.K. received support as a Sloan Fellowand a Presidential Faculty Fellow.
VI. List of SymbolsR fraction of molecules which stick to the capillary
surface on collision∆T temperature difference between capillary wall
and any internal radiusλ thermal conductivity of the solution (also Peclet
number in chromatography section)µ electrophoretic mobilityµapp apparent mobility µapp ) µEOF + µµEOF electroosmotic mobilityσ2
DAQ variance due to data acquisitionσ2
ED variance due to electromigration dispersionσ2
EF variance due to the electronic filterσ2
Ads variance due to sample adsorptionσ2
Det variance due to detectionσ2
Diff variance due to diffusionσ2
Heat variance due to effects of Joule heatingσ2
Inj variance due to sample injectionσ2
Tot total varianceτ thermal coefficient of the solute mobilityANTS 8-aminonaphthalene-1,3,6-trisulfonateAP affinity probeAP* fluorescently labeled affinity probeAPCE affinity probe capillary electrophoresisCDCE constant denaturant capillary electrophoresisCE capillary electrophoresisCI chemical ionizationD diffusion coefficientd one-half of the intermicelle distanceDaq analyte diffusion coefficient in the aqueous phaseDmc analyte diffusion coefficient in the micellar phaseE electric field strengthEOF electroosmotic flowESI electrospray ionizationf sampling frequency
G heat generation rateGv difference in velocity between the axis and the
inside wall of the capillaryH plate heighth initial width of sample plugHads adsorption contribution to the plate heightHaq intermicelle diffusion contribution to plate heightHDB hexadimethrine bromideHEC hydroxyethyl celluloseHep plate height contribution due to polydispersity
of the micelle sizeHheating Joule heating contribution to the plate height for
CEHIBA hydroxyisobutyric acidHmc plate height contribution of sorption-desorption
kinetics in and out of the micelle phaseHPLC high performance liquid chromatographyHt Joule heating contribution to plate height for
MEKCi.d. inner diameterk′ retention factorK1 6.5 × 10⁻⁴
K2 4.34 × 10⁻⁵
kd desorption rate constantl separation lengthL total column lengthLIF laser induced fluorescenceMEKC micellar electrokinetic chromatographyMS mass spectrometryN number of theoretical platesn number of molecules per unit volume inside the
capillaryNDA naphthalene-2,3-dicarboxyaldehydeNDP nucleoside diphosphateo.d. outer diameterPCR polymerase chain reactionPEO poly(ethyleneoxide)R fractional concentration of free soluterc inner radius of the capillaryRs separation resolutionRt rate at which the sampling capillary is brought
across the entrance of the channel in continu-ous channel electrophoresis
rx distance from the capillary wallS specific conductanceS/N signal-to-noise ratioT target moleculeT* fluorescently labeled target moleculet0 insolubilized solute retention timetmc micelle retention timetmig migration timeTOFMS time-of-flight mass spectrometryTR electronic filter rise timeV voltagev linear migration velocityW width of an individual separation lane in con-
tinuous channel electrophoresisZ number of molecules striking a unit surface area
per second
VII. References(1) LuKacs, K. D.; Jorgenson, J. W. Anal. Chem. 1981, 53, 1298.(2) Gas, B. J Chromatogr. 1993, 644, 161.(3) Liu, J.; Dolnik, V.; Hsieh, Y.; Novotny, M. Anal. Chem. 1992,
64, 1328.(4) Hjerten, S.; Valtcheva, L.; Elenbring, K.; Liao, J. Electrophoresis
1995, 16, 584.(5) Wieme R. J. In Chromatography, a handbook of chromatographic
and electrophoretic methods: 3rd ed. Heftmann, E., Ed.; VanNostrand Reinhold: New York, 1975; p 267.
(6) Schure, M.; Lenhoff, A. Anal. Chem. 1993, 65, 3024.(7) Towns, J.; Regnier, F. Anal. Chem. 1992, 64, 2473.
Fast Analytical-Scale Separations by CE and LC Chemical Reviews, 1999, Vol. 99, No. 10 3127

(8) Bello, M.; Zhukov, M.; Righetti, P. J. Chromatogr. A 1995, 693,113.
(9) Minarik, M.; Gas, B.; Rizzi, A.; Kenndler, E. J. CapillaryElectrophor. 1995, 2, 89.
(10) Stedry, M.; Gas, B.; Kenndler, E. Electrophoresis 1995, 16, 2027.(11) Moore, A. W.; Jorgenson, J. W. Anal. Chem. 1993, 65, 3550.(12) Tao, L.; Thompson, J. E.; Kennedy, R. T. Anal. Chem. 1998, 70,
4015.(13) Hjerten, S.; Kubo, K. Electrophoresis 1993, 14, 390.(14) Ng, C.; Lee, H.; Li, S. F. J. Chromatogr. A 1994, 659, 427.(15) Zhu, M.; Rodriguez, R.; Hanson, D.; Wehr, T. J. Chromatogr.
1990, 516, 123.(16) McCormick, R. Anal. Chem. 1988, 60, 2322.(17) Green, J.; Jorgenson, J. J. Chromatogr. 1989, 478, 63.(18) Bullock, J.; Yuan, L. J. Microcolumn Sep. 1991, 3, 241.(19) Bushey, M.; Jorgenson, J. J. Chromatogr. 1989, 480, 301.(20) Shakuntala, M.; Colyer C.; Harrison, J. J. Chromatogr. A 1997,
781, 271.(21) Chiem, N.; Harrison, J. Clin. Chem. 1998, 44, 591.(22) Tao, L.; Kennedy, R. T. Anal. Chem. 1996, 68, 3899.(23) Schultz, N.; Huang, L.; Kennedy, R. T. Anal. Chem. 1995, 67,
924.(24) Schultz, N.; Kennedy, R. T. Anal. Chem. 1993, 65, 3161.(25) Chen, D. Y.; Dovichi, N. J. Chromatogr. A 1994, 657, 265.(26) Fister, J.; Jacobson, S.; Davis, L.; Ramsey, J. Anal. Chem. 1998,
70, 431.(27) Bardelmeijer, H.; Waterval, J.; Lingeman, H.; van’t Hof, R.; Bult,
A.; Underbug, W. Electrophoresis 1997, 18, 2214.(28) Ewing, A.; Mesaros, J.; Gavin, P. Anal. Chem. 1994, 66, 527a.(29) Ewing, A.; Olefirowitz, T. Anal. Chem. 1990, 62, 1872.(30) Huang, X.; Zare, R.; Sloss, S.; Ewing, A. Anal. Chem. 1991, 63,
189.(31) Huang, X.; Zare, R. Anal. Chem. 1991, 63, 2193.(32) Huang, X.; Pang, T.; Gordon, M.; Zare, R. Anal. Chem. 1987,
59, 2747.(33) Wallingford, R.; Ewing, A. Anal. Chem. 1988, 60, 1762.(34) Oshea, T.; Greenhagen, R.; Lunte, S.; Smyth, M.; Radzik, D.;
Watanabe, N. J. Chromatogr. 1992, 593, 305.(35) Woolley, A. T.; Lao, K.; Glazer, A. N.; Mathies, R. Anal. Chem.
1998, 70, 684.(36) Chervet, J. P.; van Soest, R. E.; Urmsem, M. LC Packings 1990,
tech comm.(37) Wang, T.; Aiken, J.; Huie, C.; Hartwick, R. Anal. Chem. 1991,
63, 1372.(38) Tsuda, T.; Zare, R.; Sweedler, J. Anal. Chem. 1990, 62, 2149.(39) Heiger, D.; Kaltenbach, P.; Sievert, H. Electrophoresis 1994, 15,
1234.(40) Xue, Y.; Yeung, E. Anal. Chem. 1994, 66, 3575.(41) Culbertson, C.; Jorgenson, J. Anal. Chem. 1998, 70, 2629.(42) Cifuentes, A.; Poppe, H. Chromatographia 1994, 39, 391.(43) Cifuentes, A.; Poppe, H. Electrophoresis 1995, 16, 2051.(44) Cifuentes, A.; Xu, X.; Kok, W. T.; Poppe, H. J. Chromatogr. A
1996, 742, 211.(45) Yu, M.; Dovichi, N. Mikrochim. Acta III 1988, 27.(46) Yu, M.; Dovichi, N. Anal. Chem. 1989, 61, 37.(47) Yu, M.; Dovichi, N. Appl. Spectrosc. 1989, 43, 196.(48) Bornhop, D.; Dovichi, N. Anal. Chem. 1987, 59, 1632.(49) Waldron, K.; Dovichi, N. Anal. Chem. 1992, 64, 1396.(50) Chen, M.; Waldron, K.; Zhao, Y.; Dovichi, N. Electrophoresis
1994, 15, 1290.(51) Bruno, A.; Paulus, A.; Bornhop, D. Appl. Spectrosc. 1991, 45,
462.(52) Fenn, J.; Mann, M.; Meng, C.; Wong, S. F.; Whitehouse, C. Mass
Spectrom. Rev. 1990, 9, 37.(53) Sheppard, R.; Tong, X.; Cai, J.; Henion, J. Anal. Chem. 1995,
67, 2054.(54) Lyubarskaya, Y.; Carr, S.; Dunnington D.; Prichett, W.; Fisher,
S.; Appelbaum, E.; Jones, C.; Karger, B. Anal. Chem. 1998, 70,4761.
(55) Smith, R.; Olivares, J.; Nguyen, N.; Udseth, H. Anal. Chem.1988, 60, 436.
(56) Johansson, I.; Huang, E.; Henion, J.; Zweigenbaum, J. J.Chromatogr. 1991, 554, 311.
(57) Severs, J.; Harms, A.; Smith, R. Rapid Commun. Mass Spectrum1996, 10, 1175.
(58) Olivares, J.; Nguyen, N.; Yonker, C.; Smith, R. Anal. Chem. 1987,59, 1230.
(59) Ramsey, R.; Ramsey, J. Anal. Chem. 1997, 69, 1174.(60) Takada, Y.; Sakairi, M.; Koizumi, H. Anal. Chem. 1995, 67, 1474.(61) Takada, Y.; Sakairi, M.; Koizumi, H. Rapid Commun. Mass
Spectrom. 1995, 9, 488.(62) Lazar, I.; Xin, B.; Lee, M.; Lee, E.; Rockwood, A. L.; Fabbi, J.;
Lee, H. Anal. Chem. 1997, 69, 3205.(63) Severs, J.; Smith, R. Capillary Electrophoresis-Mass Spectrom-
etry Handbook of CE, 2nd ed.; Landers, J., ed.; 1997; Chapter28, pp 791-826.
(64) Jacobson, S.; Culbertson, C.; Daler, J.; Ramsey, M. Anal. Chem.1998, 70, 3476.
(65) Monnig, C.; Jorgenson, J. Anal. Chem. 1991, 63, 802.
(66) Monnig, C.; Dohmeier, D.; Jorgenson, J. Anal. Chem. 1991, 63,807.
(67) Moore, A.; Jorgenson, J. Anal. Chem. 1995, 67, 3448.(68) Moore, A.; Jorgenson, J. Anal. Chem. 1995, 67, 3456.(69) Lemmo, A.; Jorgenson, J. Anal. Chem. 1993, 65, 1576.(70) Hooker, T.; Jorgenson, J. Anal. Chem. 1997, 69, 4134.(71) Lada, M. W.; Vickroy, T.; Kennedy, R. T. Anal. Chem. 1996, 68,
2790.(72) Lada, M. W.; Vickroy, T.; Kennedy, R. T. Anal. Chem. 1997, 69,
4560.(73) Lada, M. W.; Vickroy, T.; Kennedy, R. T. J. Neurochem. 1998,
70, 617.(74) Lada, M. W.; Vickroy, T.; Kennedy, R. T. J. Neurosci. Meth. 1995,
6, 147.(75) Yuji, S.; Zuo, H.; Stobaugh, J.; Lunte, C.; Lunte, S. Anal. Chem.
1995, 67, 594.(76) Hogan, B.; Lunte, S.; Stobaugh, J.; Lunte, C. Anal. Chem. 1994,
66, 596.(77) Effenhauser, C.; Manz, A.; Widmer, H. Anal. Chem. 1993, 65,
2637.(78) Jacobson, S.; Hergenroder, R.; Koutny, L.; Warmack, R.; Ramsey,
M. Anal. Chem. 1994, 66, 1107.(79) Waters, L.; Jacobson, S.; Kroutchinina, N.; Khandurina, J.;
Foote, R.; Ramsey, J. M. Anal. Chem. 1998, 70, 158.(80) Kopp, M.; DeMello, A.; Manz, A. Science 1998, 280, 1046.(81) Jacobson, S.; Ramsey, J. M. Anal. Chem. 1997, 69, 3212.(82) Jacobson, S.; Hergenroder, R.; Moore, A.; Ramsey, J. M. Anal.
Chem. 1994, 66, 4127.(83) Jacobson, S.; Koutny, L.; Hergenroder, R.; Moore, A.; Ramsey,
J. M. Anal. Chem. 1994, 66, 3472.(84) Fluri, K.; Fitzpatrick, C.; Chiem, N.; Harrison, J. Anal. Chem.
1996, 68, 4285.(85) Kheterpal, I.; Mathies, R. Anal. Chem. 1999, 71, 31A.(86) Huang, X.; Quesada, M.; Mathies, R. A. Anal. Chem. 1992, 64,
967.(87) Mathies, R.; Huang, X. Nature 1992, 359, 167.(88) Clark, S.; Mathies, R. Anal. Biochem. 1993, 215, 163.(89) Wang, Y.; Ju, J.; Carpenter, B.; Atherton, J.; Sensabaugh, G.;
Mathies, R. Anal. Chem. 1995, 67, 1197.(90) Wang, Y.; Wallin, J.; Ju, J.; Sensabaugh, G.; Mathies, R.
Electrophoresis 1996, 17, 1485.(91) Kheterpal, I.; Scherer, J.; Clark, S.; Radhakrishnan, A.; Ju, J.;
Ginther, C.; Sensabaugh, G.; Mathies, R. Electrophoresis 1996,17, 1852.
(92) Takahashi, S.; Murakami, K.; Anazawa, T.; Kambara, H. Anal.Chem. 1994, 66, 1021.
(93) Ueno, K.; Yeung, E. S. Anal. Chem. 1994, 66, 1424.(94) Bashkin, J.; Bartosiewicz, M.; Roach, D.; Leong, J.; Barker, D.;
Johnston, R. J. Capillary Electropor. 1996, 3, 61.(95) Anazawa, T.; Takahashi, S.; Kambara, H. Anal. Chem. 1996,
68, 2699.(96) Woolley, A.; Sensabaugh, G.; Mathies, R. Anal. Chem. 1997, 69,
2181.(97) Woolley, A.; Mathies, R. Proc. Natl. Acad. Sci. 1994, 91, 11348.(98) Woolley, A.; Mathies, R. Anal. Chem. 1995, 67, 3676.(99) Raymond, D.; Manz, A.; Widmer, H. M. Anal. Chem. 1994, 66,
2858.(100) Balch, J. W.; Davidson, C.; Gingrich, J.; Sharaf, M.; Brewer, L.;
Koo, J. W.; Smith, D.; Albin, M.; Carrano, A. Genome Sequencingand Analysis Conference VI, Hilton Head, SC, September 17-21, 1994, Abstract C2.
(101) Ewing, A.; Gavin, P.; Beyer Hietpas, P.; Bullard, K. Nature Med.1997, 3, 97.
(102) Bullard, K.; Beyer Hietpas, P.; Ewing, A. Electrophoresis 1998,19, 71.
(103) Schmalzing, D.; Koutney, L.; Adourian, A.; Belgrader, P.; Mat-sudaira, P.; Ehrlich, D. Proc. Natl. Acad. Sci. 1997, 94, 10273.
(104) Schmalzing, D.; Adourian, A.; Koutny, L.; Ziaugra, L.; Matsu-daira P.; Ehrlich, D. Anal. Chem. 1998, 70, 2303.
(105) Beyer Hietpas, P.; Bullard, K.; Gutman, D.; Ewing, A. Anal.Chem. 1997, 69, 2292.
(106) Zagursky, R.; McCormick, R. BioTechniques 1990, 9, 74.(107) Huang, X.; Quesada, M.; Mathies, R. A. Anal. Chem. 1992, 64,
2149.(108) Taylor, J.; Yeung, E. Anal. Chem. 1993, 65, 956.(109) Venter, J.; Adams, M.; Sutton, G.; Kerlavage, A.; Smith, H.;
Hunkapiller, M. Science 1998, 280, 1540.(110) Gavin, P. Ewing, A. J. Am. Chem. Soc. 1996, 118, 8932.(111) Mesaros, J.; Luo, G.; Roeraade, J.; Ewing, A. Anal. Chem. 1993,
65, 3313.(112) Mesaros, J.; Ewing, A. J. Microcolumn Sep. 1994, 6, 483.(113) Mesaros, J.; Gavin, P.; Ewing, A. Anal. Chem. 1996, 68, 3441.(114) Liu, Y.; Sweedler, J. J. Am. Chem. Soc. 1995, 17, 8871.(115) Liu, Y.; Sweedler, J. Anal. Chem. 1996, 68, 8, 2471.(116) Liu, Y.; Sweedler, J. Anal. Chem. 1996, 68, 3928.(117) Gavin, P.; Ewing, A. Anal. Chem. 1997, 69, 9, 3838.(118) Liu, Y.; Moroz, T.; Sweedler, J. Anal. Chem. 1999, 71, 28.(119) Gavin, P.; Ewing, A. J. Microcolumn Sep. 1998,10, 357.
3128 Chemical Reviews, 1999, Vol. 99, No. 10 Kennedy et al.
(120) Gavin, P.; Ewing, A. In Handbook of Capillary Electrophoresis,2nd ed.; Landers, J. P., Ed; CRC: New York: 1997; Chapter26, p 741.
(121) Terabe, S.; Otsuka, K.; Ichikawa, K.; Tsuchiya, A.; Ando, T. Anal.Chem. 1984, 56, 111.
(122) Terabe, S.; Otsuka, K.; Ando, T. Anal. Chem. 1989, 61, 251.(123) Moore, A.; Jacobson, S.; Ramsey, J. M. Anal. Chem. 1995, 67,
4184.(124) Lee, H. G. J. Chromatogr. A 1997, 790, 215-223.(125) Schmitz, G.; Mollers, C.; Richter, V.; Electrophoresis 1997, 18,
1807-1813.(126) Lauer, H. H.; McManigill, D. Anal. Chem. 1986, 53, 166.(127) Green, J. S.; Jorgenson, J. W. J. Chromatogr. 1989, 478, 41.(128) Hjerten, S. Methods Enzymology, 1996, 270, 296-319.(129) Chen, F.-T. J. Chromatogr. 1991, 559, 445-453.(130) Yildiz, E.; Grubler, G.; Horger, S.; Zimmermann, H.; Echner,
H.; Stoeva, S.; Voelter, W. Electrophoresis 1992, 13, 683-686.(131) Vessillier, S.; Bernillon, J.; Saulnier, J.; Wallach, J. J. Chro-
matogr. A 1997, 776, 133-137.(132) Banks, J. F.; Dresch, T. Anal. Chem. 1996, 68, 1480-1485.(133) Lausch, R.; Scheper, T.; Reif, O.-W.; Schloesser, J.; Fleishcher,
J.; Freitag, R. J. Chromatogr. A 1993, 654, 190-195.(134) Benedek, K.; Guttman, A. J. Chromatogr. A 1994, 680, 375-
381.(135) Heo, Y. J.; Kim, S. Y.; Kim, E.; Lee, K.-J. J. Chromatogr. 1997,
781, 251-261.(136) Kilar, F.; Hjerten, S. J. Chromatogr. 1993, 638, 269-276.(137) Nall, B. T. Comments Mol. Cell. Biophys. 1985, 3, 123-143.(138) Rathore, A. S.; Horvath, C. Electrophoresis 1997, 18, 2935-2943.(139) Moore, A. W.; Jorgenson, J. W. Anal. Chem. 1995, 67, 3464-
3475.(140) Tong, W.; Yeung, E. S. J. Chromatogr. B 1997, 689, 321-325.(141) Tong, W.; Yeung, E. S. J. Neurosci. Methods 1997, 76, 193-
201.(142) Moore, A. W.; Larmann, J. P.; Lemmo, A. V.; Jorgenson, J. W.
Methods Enzymol. 1996, 270, 401-419.(143) Murphy, R. E.; Schure, M. R.; Foley, J. P. Anal. Chem. 1998,
70, 4353-4360.(144) Lemmo, A. V.; Jorgenson, J. W. J. Chromatogr. 1993, 633, 213-
220.(145) Larmann, J. P., Jr.; Lemmo, A. V.; Moore, A. W., Jr.; Jorgenson,
J. W. Electrophoresis 1993, 14, 439-447.(146) Hynek, R.; Kasicka, V.; Kucerova, Z.; Kas, J. J. Chromatogr. B
1996, 681, 37-45.(147) Hynek, R.; Kasicka, V.; Kucerova, Z.; Kas, J. J. Chromatogr. B
1997, 688, 213-220.(148) Lemmo, A. V.; Jorgenson, J. W. Anal. Chem. 1993, 65, 1576-
1581.(149) Chen, J.; Preston, B. P.; Zimmerman, M. J. J. Chromatogr. A
1997, 781, 205-213.(150) Zemann, A.; Nguyen D. T.; Bonn, G. Electrophoresis 1997, 18,
1142-1147.(151) Sudor, J.; Novotny M. Natl. Acad. Sci. U.S.A. 1993, 90, 9451-
9455.(152) Stefansson, M.; Novotny, M. Anal.Chem, 1994, 66, 3466-3471.(153) Stefansson, M.; Novotny, M. Anal. Chem. 1994, 66, 1134-1140.(154) Huotylainen, T.; Siren, H.; Riekkola M.-L. J. Chromatogr. A
1996, 738, 439-447.(155) Perrett, D.; Ross, G. A. J. Chromatogr. A 1995, 700, 179-186.(156) Foret, F.; Fanali, S.; Nardi, A.; Bocek, P. Electrophoresis 1990,
11, 780-783.(157) Shi, Y. C.; Fritz, J. S. J. Chromatogr. 1993, 640, 473-479.(158) Zemann, A. J. J. Chromatogr. A 1997, 669, 113-123.(159) Jones, W. R.; Jandik, P. J. J. Chromatogr. 1991, 546, 445-458.(160) Pawliszyn, J.; Wu, J. J. Chromatogr. 1991, 559, 111-118.(161) Fan, Z. H.; Harrison, D. J. Anal. Chem. 1994, 66, 177-184.(162) Seiler, K.; Fan, Z. H.; Fluri, K.; Harrison, D. J. Anal. Chem. 1994,
66, 3485-3491.(163) Effenhauser, C. S.; Manz, A.; Widmer, H. M. Anal. Chem. 1993,
65, 2637-2642.(164) Wren, S. J. Chromatogr. 1993, 636, 57.(165) Wren, S.; Rowe, R. J. Chromatogr. 1992, 603, 235.(166) Wren, S.; Rowe, R. J. Chromatogr. 1993, 635, 113.(167) Rawjee, Y.; Vigh, G. Anal. Chem. 1994, 66, 619.(168) Surapaneni, S.; Ruterbories, K.; Lindstrom, T. J. Chromatogr.
1997, 761, 249.(169) Fanali, S J. Chromatogr. A 1997, 792, 227.(170) Gozel, P.; Gassmann, E.; Michelson, H.; Zare, R. Anal. Chem.
1987, 59, 44.(171) Guttman, A.; Paulus, A.; Cohen, A.; Grinberg, N.; Karger, B. J.
Chromatogr. A 1988, 448, 41.(172) Kuhn, R.; Hoffstetter-Kuhn, S. Chromatographia 1992, 34, 505.(173) Armstrong, D.; Rundlett, K.; Reid, G. L. Anal. Chem. 1994, 66,
1690.(174) Aumatell, A.; Guttman, A. J. Chromatogr. A 1995, 717, 229.(175) Thompson, J.; Vickroy, T.; Kennedy, R. T. Anal. Chem. 1999,
71, 2379.(176) Dovichi, N. J. Electrophoresis 1997, 18, 2393-2399.
(177) Effenhauser, C. S.; Bruin, G. J. M.; Paulus A. Electrophoresis1997, 18, 2203-2213.
(178) Chang, H.-T.; Yeung, E. S. J. Chromatogr. B 1995, 669, 113-123.
(179) Kamahory, M.; Kambara, H. Electrophoresis 1996, 17, 1476-1484.
(180) Muth, J.; Williams, P. M.; Williams, S. J.; Brown, M. D.; Wallace,D. C.; Karger, B. L. Electrophoresis 1996, 17, 1875-1883.
(181) Ruiz-Martinez, M. C.; Berka, J.; Belenkii, A.; Foret, F.; Miller,A. W.; Karger, B. L. Anal. Chem. 1993, 65, 2851-2858.
(182) Drossman, H.; Luchey, J. A.; Kostichka, A. J.; D′Chunha, J.;Smith, L. M. Anal. Chem. 1990, 62, 900-903.
(183) Zang, J.; Fang, Y.; Hou, J. Y.; Ren, H. J.; Jiang, R.; Roos, P.;Dovichi, N. J. Anal. Chem. 1995, 67, 4589-4593.
(184) Ruiz-Martinez, M. C.; Carrilho, E.; Berka, J.; Kieleczawa, J.;Foret, F.; Miller, A. W.; Carson, S.; Karger, B. L. Biotechniques1996, 20, 1058-1069.
(185) Carrilho, E.; Ruiz-Martinez, M. C.; Berka, J.; Smirnov, I.;Foetzinger, W.; Miller, A. W.; Brady, D.; Karger, B. L. Anal.Chem. 1996, 68, 3305-3313.
(186) Fung, E. N.; Yeung E. S. Anal. Chem. 1995, 67, 1913-1919.(187) Oana, H.; Hammond, R. W.; Schwinefus J. J.; Wang, S.-C.; Doi,
M.; Morris, M. D. Anal. Chem. 1998, 70, 574-579.(188) Schwinefus J. J.; Morris, M. D. Analyst 1998, 123, 1481-1485.(189) Kim, Y.; Morris, M. D. Electrophoresis 1996, 17, 152-160.(190) Morris, M. D.; Kim, Y.; Hammond, R. SPIE 1996, 2680, 219-
224.(191) Shi, X.; Hammond, R.; Morris, M. D. Anal. Chem. 1995, 67,
3219-3222.(192) Chan, K. C.; Muschik, G. M.; Issaq, H. J.; Garvey, K. J.;
Generlette, P. L. Anal. Biochem. 1996, 243, 133-139.(193) Chan, K. C.; Muschik, G. M.; Issaq, H. J. J. Chromatogr. B 1997,
695, 113-115.(194) Issaq, H. J.; Chan, K. C.; Muschik, G. M. Electrophoresis 1997,
18, 1153-1158.(195) Barta, C.; Sasvari-Szekely, M.; Guttman, A. J. Chromatogr. A
1998, 817, 281-286.(196) Muller, O.; Minarik, M.; Foret, F. Electrophoresis 1998, 19,
1436-1444.(197) Effenhauser, C. S.; Bruin, G. J. M.; Paulus, A.; Ejrat, M. Anal.
Chem. 1997, 69, 3451-3457.(198) Effenhauser, C. S.; Bruin, G. J. M.; Paulus, A.; Widmer, H. M.
Anal. Chem. 1994, 66, 2949-2953.(199) Smith, G. P.; Petrenko, V. A. Chem. Rev. 1997, 97, 391-410.(200) Tuerk, C.; Gold, L. Science 1990, 249, 505-510.(201) Osborne, S. E.; Ellington, A. D. Chem. Rev. 1997, 97, 349-370.(202) Lam, K. S.; Lebl, M.; Krchnak, V. Chem. Rev. 1997, 97, 411-
448.(203) Oftebro, H.; Falch, J. A.; Holmberg, I,; Haug, E. Clin. Chim. Acta
1988, 176, 157-168.(204) Xue, B.; et al. J. Capillary Electrophor. 1997, 4, 225-231.(205) Stebbins M. A. et al. J. Chromatogr. B 1996, 683, 77-84.(206) Schmalzing, D.; Nashabeh, W. Electrophoresis 1997, 18, 2184-
2193.(207) Bao, J. J. J. Chromatogr. B 1997, 699, 463-480.(208) Kennedy, R. T.; Tao, L. Schultz, N. M.; Rose, D. R. Immuno-
assays and Enzyme Assays Using CE. In CRC Handbook ofCapillary Electrophoresis; Landers, J., Ed.; CRC Press: BocaRaton, FL, 1997, Chapter 22, pp 523-545.
(209) Schultz, N. M.; Huang, L.; Kennedy, R. T. Anal. Chem. 1995,67, 924-929.
(210) Reif, O.; Lausch, R.; Scheper, T.; Freitag, R. Anal. Chem. 1994,66, 4027-4033.
(211) Lausch, R.; Reif, O.; Riechel, P.; Scheper, T. Electrophoresis 1995,16, 636-641.
(212) Evangelista, R. A.; Chen, F. A. J. Chromatogr. A 1994, 680, 587-591.
(213) Chen, F. A. J. Chromatogr. A 1994, 680, 419-423.(214) Shimura, K.; Karger, B. Anal. Chem. 1994, 66, 9-15.(215) German, I.; Buchanan, D. D.; Kennedy, R. T. Anal. Chem. 1998,
70, 4540-4545.(216) Cann, J. R. Electrophoresis 1998, 19, 127-141.(217) Tao, L.; Aspinwall, C. A.; Kennedy, R. T. Electrophoresis 1998,
19, 403-408.(218) Schmalzing, D.; Nashabeh, W.; Fuchs, M. Clin. Chem. 1995, 41,
1403-1406.(219) Schmalzing, D.; Nashabeh, W.; Yao, X.; Mhatre, R.; Regnier, F.
E.; Afeyan, N. B.; Fuchs, M. Anal. Chem. 1995, 67, 606-612.(220) Kounty, L. B.; Schmalzing, D.; Taylor, T. A.; Fuchs, M. Anal.
Chem. 1996, 68, 18-22.(221) Bruin, G. J. M.; Paulus, A. Anal. Methods. Instrum. 1995, 2,
3-26.(222) Chiem, N.; Harrison, D. J. Anal. Chem. 1997, 69, 373-378.(223) Ye, L.; Le, C.; Xing, J. Z.; Ma, M.; Yatscoff, R. J. Chromatogr. B
1998, 714, 59-67.(224) Chen, F.; Evangelista, R. A. Clin. Chem. 1994, 40, 1819-1822.(225) Foulds, G. J.; Etzkorn, F. A. Nucleic Acids Res. 1998, 26, 4304-
4305.
Fast Analytical-Scale Separations by CE and LC Chemical Reviews, 1999, Vol. 99, No. 10 3129
(226) Bert, L.; Robert, F.; Denoroy, L.; Renaud, B. Electrophoresis1996, 17, 523-525.
(227) Kuhr, W.; Korf, J. J. Cerebr. Blood Flow Metab. 1988, 8, 130.(228) Caprioli, R.; Lin, S. Proc. Natl. Acad. Sci. 1990, 87, 240.(229) Zhou, S.; Zuo, H.; Stobaugh, J.; Lunte, C.; Lunte, S. Anal. Chem.
1995, 67, 594.(230) Chen, A.; Lunte, C. J. Chromatogr. A 1995, 691, 29.(231) Church, W.; Justice, J. Anal. Chem. 1987, 59, 712.(232) Lada, M.; Kennedy, R. T. J. Neurosci. Methods 1997, 72, 153.(233) Hogan, B.; Lunte S.; Stobaugh, J.; Lunte, C. Anal. Chem. 1994,
66, 596.(234) Hernandez, L.; Escalona, J.; Verdeguer, P.; Guzman, N. J Liq.
Chromatogr. 1993, 16, 2149.(235) Stenken, J.; Sthle, L.; Southard, M.; Lunte, C. J. Pharm. Sci.
1998, 8, 311.(236) Hanson, D.; Davies, M.; Lunte, S.; Lunte C. J. Pharm. Sci. 1999,
88, 14.(237) Hanson, D.; Lunte, S. J. Chromatogr. A 1997, 781, 81.(238) Schneiderheinze, J.; Hogan, B. Anal. Chem. 1996, 68, 3758.(239) Chen, F. J. Chromatogr. 1991, 559, 445.(240) Davies, M.; Lunte, C. Chem. Soc. Rev. 1997, 26, 215.(241) Chen, H.; Horvath, C. J. Chromatogr. A 1995, 705, 3.(242) Paliwal, S. K.; de Frutos, M.; Regnier, F. E. Methods Enzymol.
1996, 270, 133.(243) Chen, H.; Horvath, C. Anal. Methods Instrum. 1993, 1, 213.(244) Knox, J. H.; Parcher, J. F. Anal. Chem. 1969, 41, 1599.(245) Cole, L. J.; Schultz, N.; Kennedy, R. T. J. Microcolumn Sep. 1993,
5, 433.(246) Unger, K. K.; Giesche, H. German Patent DE-3534 143.1, 1985.(247) Hanson; Unger, K. K. LC-GC 1997, 15, 170.(248) Lee, W.-C. J. Chromatogr. B 1997, 699, 29.(249) Stober, W.; Kink, A.; Bohn, E. J. Colloid Interface Sci. 1968, 26,
2.(250) Dunlap, C. J.; Carr, P. W.; Blackwell, J. A. Biotechnol. Prog.
1994, 10, 561.(251) Hjerten, S.; Mohammad, J.; Eriksson, K.-O.; Liao, J.-L. Chro-
matographia 1991, 31, 85.(252) German R. M. Ceramics and Glasses, Engineered Materials
Handbook; ASM International: Materials Park, OH, 1987; 260.(253) Maa, Y.-F.; Horvath, C. J. Chromatogr. 1988, 445, 71.(254) Sinibaldi, M.; Castellani, L.; Federici, F.; Messina, A.; Girelli,
A. M.; Lentini, A.; Tesarova, E. J. Liq. Chromatogr. 1995, 18,3187.
(255) Unger, K. K.; Jilge, G.; Kinkel, J. N.; Hearn, M. T. W. J.Chromatogr. 1986, 359, 61.
(256) Jilge, G.; Janzen, R.; Giesche, H.; Unger, K. K.; Kinkel, J. N.;Hearn, M. T. W. J. Chromatogr. 1987, 397, 71.
(257) Janzen, R.; Unger, K. K.; Giesche, H.; Kinkel, J. N.; Hearn, M.T. W. J Chromatogr. 1987, 397, 81.
(258) Janzen, R.; Unger, K. K.; Giesche, H.; Kinkel, J. N.; Hearn, M.T. W. J Chromatogr. 1987, 397, 91.
(259) Varady, L.; Ning, M.; Yang, Y. B.; Cook, S. E.; Afeyan, N.;Regnier, F. E. J. Chromatogr. 1993, 631, 107.
(260) Kalghatgi, K. J. Chromatogr. 1990, 499, 267.(261) Barder, T. J.; Wohlman, P. J.; Thrall, C.; Dubois, P. D. LC-GC
1997, 15, 918.(262) Jenke, D. R. J. Chromatogr. Sci. 1996, 34, 362.(263) Lommen, D. C.; Snyder, L. R. LC-GC 1993, 11, 222.(264) Hurley, M. B.; Rowarth, J. S. J. Chromatogr. Sci. 1998, 36, 345.(265) Itoh, H.; Kinoshita, T.; Nimura, N. J. Liq. Chromatogr. 1993,
16, 809.(266) MacNair, J. E.; Lewis, K. C.; Jorgenson, J. W. Anal. Chem. 1997,
69, 983.(267) MacNair, J. E.; Patel, K. D.; Jorgenson, J. W. Anal. Chem. 1999,
71, 700.(268) Kirkland, J. J. Anal.Chem. 1992, 64, 1239.(269) Bischoff, K. LaborPraxis 1996, 20, 56.(270) Roxing, G. P.; Goetz, H. J. Chromatogr. 1989, 476, 3.(271) Hanson, M.; Unger, K. K.; Schomburg, G. J. Chromatogr. 1990,
517, 269.(272) Ohmacht, R.; Kiss, I. Magyar Kemiai Folyoirat 1997, 103, 506.(273) Venema, E.; Kraak, J. C.; Poppe, H.; Tijssen, R. J. Chromatogr.
A 1996, 740, 159.(274) Kraak, J. C. Oostervink, R.; Poppe, H.; Esser, U.; Unger, K. K.
Chromatographia 1989, 27, 585.(275) Moriyama, H.; Anegayama, M.; Kato, Y. J. Chromatogr. A 1996,
729, 81.(276) Ohmacht, R.; Kiss, O. Chromatographia 1996, 43, 505.(277) Chen, Y.; Wall, D.; Lubman, M. Rapid Commun. Mass Spectrom.
1998, 12, 1994.(278) Banks, J. F.; Gulcicek, E. E. Anal. Chem. 1997, 69, 3973.(279) MacNair, J. E.; Opiteck, G. J.; Jorgenson, J. W.; Mosely, M. A.
Rapid Commun. Mass Spectrom. 1998, 11, 1279.(280) Anspach, F. B.; Wirth, H.-J.; Unger, K. K.; Stanton, P.; Davies,
J. R.; Hearn, M. T. W. Anal. Biochem. 1989, 179, 171.(281) Huber, C. G. J. Chromatogr. A 1998, 806, 3.(282) Maa, Y. F.; Lin, S. C.; Horvath, C.; Yang, U. C.; Crothers, D. M.
J. Chromatogr. 1990, 508, 61.
(283) Huber, C. G.; Oefner, P. J.; Bonn, G. K. Anal.Chem. 1995, 67,578.
(284) Hayward, A. L.; Oefner, P. J.; Sbatini, S. Kainer, D. B.; Hinojos,C. A.; Doris, P. A. Nucleic Acids Res. 1998, 26, 2511.
(285) Huber, C. G.; Berti, G. N. Anal. Chem. 1996, 68, 2959.(286) Murai, S.; Saito, H.; Hagahama, H.; Miyate, H.; Masuda, Y.; Itoh,
T. J. Chromatogr. Biomed. Appl. 1989, 89, 363.(287) Murai, S.; Saito, H.; Masuda, Y.; Itoh, T. J. Pharmacol. Methods
1990, 23, 195.(288) Poetter, W.; Lamotte, S.; Engelhardt, H.; Karst, U. J. Chro-
matogr. A 1997, 786, 47.(289) Paasch, B. D.; Lin, Y. S.; Porter, S.; Modi, N. B.; Marder, T. J.
J Chromatogr. B 1997, 704, 231.(290) Perrin, S. R. Chirality 1991, 3, 188.(291) Ameyibor, E.; Stewart, J. T. J. Pharm. Biomed. Anal. 1998, 17,
83.(292) U.S. Patent No. 5,019,270.(293) Rodriguez, A. E. J. Chromatogr. B., Biomed. Appl. 1997, 699,
47.(294) Afeyan, N. B.; Gordon, W. F.; Mazsaroff, I.; Varady, L.; Fulton,
S. P.; Yang, Y. B.; Regnier, F. E. J. Chromatogr. 1990, 519, 1.(295) Regnier, F. E. Nature 1991, 350, 634.(296) Xu, Y.; Liapis, A. I. J. Chromatogr. A 1996, 724, 12.(297) McCoy, M. A.; Liapis, A. I.; Unger, K. K. J. Chromatogr. 1993,
644, 1.(298) Collins, W. E. Sep. Purif. Methods. 1997, 26, 215.(299) Liapis, A. I.; McCoy, M. A. J. Chromatogr. 1992, 599, 87.(300) Rodriques, A. E.; Loureiro, J. M.; Chenou, C.; de la Vega, M. R.
J. Chromatogr. B 1995, 664, 233.(301) McCoy, M.; Kalghatgi, K.; Regnier, F. E.; Afeyan, N. J. Chro-
matogr. A 1996, 743, 221.(302) Whitney, D.; McCoy, M.; Gordon, N.; Afeyan, N. J. Chromatogr.
A 1998, 807, 165.(303) Nash, D. C.; Chase, H. A. J. Chromatogr. A 1998, 807, 185.(304) Fulton, S. P.; Afeyan, N. B.; Gordon, N. F.; Regnier, F. E. J.
Chromatogr. 1991, 547, 452.(305) Fulton, S. P.; Meys, M.; Varady, L.; Jansen, R.; Afeyan, N. B.
Biotechniques 1991, 11, 226.(306) Rodriques, A. E. J. Chromatogr. B 1997, 699, 347.(307) Raut, S.; Corran, P. H.; Gaffney, P. J. J. Chromatogr. B 1994,
660, 390.(308) Pingali, A.; McGuinness, B.; Keshishian, H.; Jing, F. W.; Varady,
L. Regnier, F. J. Mol. Recognit. 1996, 5-6, 426.(309) Schmidbauer, S. B.; Strobel, O. K. Front. Biosci. 1997, 2, 6.(310) Gustavsson, P.-E.; Mosbach, K.; Nilsson, K.; Larsson, P.-O. J.
Chromatogr. A. 1997, 776, 197.(311) Harndahl, U.; Tufvesson, E.; Sundby, C. Protein Exp. Purif. 1998,
1, 87.(312) Roobol-Boza, M.; Andersson, B. Anal. Biochem. 1996, 235, 127.(313) Tarentino, A. L.; Quinones, G.; Plummer, T. H., Jr. Glycobiology
1995, 5, 599.(314) El Rassi, Z.; Clinkenbeard, P. A.; Clinkenbeard, K. D. J.
Chromatogr. A 1998, 808, 167.(315) Prazeres, D. M.; Schuep, T.; Cooney, C. J. Chromatogr. A 1998,
806, 31.(316) Garcia, M. C.; Torre, M.; Marina, M. L. J. Chromatogr. Sci. 1998,
36, 527.(317) Garcia, M. C.; Torre, M.; Marina, M. L. J. Chromatogr. A 1998,
822, 225.(318) Torre, M.; Cohen, M. E.; Corzo, N.; Rodriguez, M. A.; Diez-Masa,
J. C. J. Chromatogr. A 1996, 729, 99.(319) Wajcman, H.; Calacteros, F.; Ducrocq, R. Blood 1996, 87, 1655.(320) Wajcman, H.; Calacteros, F.; Ducrocq, R. Hemoglobin 1998, 22,
469.(321) Wajcman, H.; Calacteros, F.; Ducrocq, R. Anal. Biochem. 1996,
237, 80.(322) Mulugeta, E.; Carno, S.; Becker, S.; Hagman, A.; Mascher, E.
J. Chromatogr. A 1998, 798, 83.(323) DePhillips, P.; Buckland, B.; Gbewonyo, K.; Yamazaki, S.; Sitrin,
R. J. Chromatogr. A 1994, 663, 43.(324) de Frutos, M.; Paliwal, S. K.; Regnier, F. E. Methods Enzymol.
1996, 270, 82.(325) de Frutos, M.; Regnier, F. E. Anal. Chem. 1993, 65, A17.(326) Johns, M. A.; Rosengarten, L. K.; Jackson, M.; Regnier, F. E. J.
Chromatogr. A 1996, 743, 195.(327) Bauer, C. G.; Eremenko, A. V.; Kuhn, A.; Kurzinger, K.;
Makower, A.; Scheller, F. W. Anal. Chem. 1998, 70, 4624.(328) Evans, M.; Palmer, D. A.; Miller, J. N.; French, M. T. Anal. Proc.
1994, 31, 7.(329) Zou, H.; Zhang, Y.; Lu, P.; Krull, I. S. Biomed. Chromatogr. 1996,
10, 78.(330) Gadowski, L.; Abdul-Wajid, A. J. Chromatogr. A 1995, 715, 241.(331) Zou, H.; Zhang, Y.; Lu, P.; Krull, I. S. Biomed. Chromatogr. 1996,
10, 122.(332) Cole, L. J.; Kennedy, R. T. Electophoresis 1995, 16, 549.(333) Shen, H.; Aspinwall, C. A.; Kennedy, R. T. J. Chromatogr. B
1997, 689, 295.(334) McCarthy, E.; Vella, G.; Mhatre, R.; Lim, Y. P. J. Chromatogr.
A 1996, 743, 163.
3130 Chemical Reviews, 1999, Vol. 99, No. 10 Kennedy et al.
(335) Regnier, F. J. Chromatogr. A 1997, 659, 317.(336) Karlsson, K. E.; Novotny, M. Anal. Chem. 1988, 60, 1662.(337) Kennedy, R. T.; Jorgenson, J. W. Anal. Chem. 1989, 61, 1128.(338) Hsieh, S.; Jorgenson, J. W. Anal. Chem. 1996, 68, 1212.(339) Monnig, C. A.; Dohmeier, B. M.; Jorgenson, J. W. Anal. Chem.
1991, 63, 807.(340) Swart, R.; Kraak, J. C.; Poppe, H. Chromatographia 1995, 40,
587.(341) Guo, Y.; Colon, L. A. Anal. Chem. 1995, 67, 2511.(342) Xie, S.; Svec, F.; Frechet, J. M. J. Chromatogr. A 1997, 775, 65.(343) Moore, R. E.; Licklider, L.; Schumann, D.; Lee, T. D. Anal. Chem.
1998, 70, 4879.(344) Ciovannini, R.; Freitag, R.; Tennikove, T. B. Anal. Chem. 1998,
70, 3348.(345) Tennikov, M. B.; Gazdina, N. V.; Tennikova, T. B.; Svec, F. J.
Chromatgr. A 1998, 798, 55.(346) Viklund, C.; Svec, F.; Frechet, J. M.; Irgum, K. Biotechnol. Prog.
1997, 13, 597.(347) Petro, M.; Svec, F. Frechet, J. M. J. Chromatogr. A. 1996, 752,
59.(348) Petro, M.; Svec, F.; Gitsov, I.; Frechet, J. M. Anal. Chem. 1996,
68, 315.(349) Ishizuka, N.; Minakuchi, H.; Nakanishi, K.; Soga, N.; Tanaka,
N. J. Chromatogr. A 1998, 797, 133.(350) Fujimoto, C.; Kino, J.; Sawada, H. J. Chromatogr. A 1997, 762,
135.(351) Minakuchi, H.; et al. J. Chromatogr. A 1995, 716, 107.(352) Minakuchi, H.; Nakanishi, K.; Soga, N.; Ishizuka, N.; Tanaka,
N. J. Chromatogr. A 1998, 797, 121.(353) Cabrera, K.; et al. Anal. Chem. 1996, 68, 3498.(354) Wang, Q. C.; Svec, F.; Frechet, J. M. J. Anal. Chem. 1993, 65,
2243.(355) Liao, J. L.; Li, Y. M.; Hjerten, S. Anal. Biochem. 1996, 234, 27.(356) Li, Y. M.; Liao, J. L.; Kakazato, K.; Mohammad, J.; Terenius,
L.; Hjerten, S. Anal. Biochem. 1994, 223, 153.(357) Cabrera, K.; Wieland, G.; Lubda, D.; Nakanishi, K.; Soga, N.;
Minakuchi, H.; Unger, K. K. Trends Anal. Chem. 1998, 17, 50.(358) Asiaie, R.; Huang, X.; Farnan, D.; Horvath, C. J. Chromatogr.
A 1998, 806, 251.(359) Hjerten, S.; Li, Y. M.; Liao, J. L.; Mohammad, J.; Nakazato, K.;
Pettersson, G. Nature 1992, 356, 810.(360) Ericson, C.; Liao, J. L.; Nakazato, K.; Hjerten, S. Anal. Biochem.
1996, 241, 195.(361) Liao, J. L.; Zeng, L. M.; Palm, A.; Hjerten, S. Anal. Chem. 1996,
68, 3468.(362) Hjerten, S.; Nakazato, K.; Mohammad, J.; Eaker, D. Chro-
matographia 1993, 37, 287.(363) Mohammad, J.; Hjerten, S. J. Biochem. Biophys. Methods 1994,
28, 32.(364) Sedzik, J.; Mohammad, J.; Hjerten, S. Neurochem. Res. 1995,
20, 651.(365) Li, J. P.; Eriksson, K. O.; Hjerten, S. Prepr. Biochem. 1990, 20,
107.(366) Mohammad, J.; Zeerak, A.; Hjerten, S. Biomed. Chromatogr.
1995, 9, 80.(367) Li, J. P.; Hjerten, S. J Biochem. Biophys Methods 1991, 22, 311.(368) Hjerten, S.; Li, J. P. J. Chromatogr. 1990, 500, 543.(369) Chen, H.; Horvath, C. Anal. Methods Instrum. 1993, 1, 213.(370) Huber, C. G.; Oefner, P. J.; Bonn, G. K. Chromatographia 1993,
37, 653.(371) Poppe, H.; Kraak, J. C. J. Chromatogr. 1983, 282, 399.(372) Poppe, H.; Kraak, J. C.; Huber, J. F. K.; Van den Berg, J. H. M.
Chromatographia 1981, 14, 515.(373) Chen, M. H.; Horvath, C. J. Chromatogr. A 1997, 788, 51.(374) Li, J.; Hu, Y.; Carr, P. W. Anal. Chem. 1997, 69, 3884.(375) Ryan, K.; Djordfjevic, N. M.; Erni, F. J. Liq. Chromatogr., Relat.
Technol. 1996, 19, 2089.
(376) Colon, L. A.; Guo, Y.; Fermier, A. Anal. Chem. 1997, 69, 461A.(377) Crego, A. L.; Gonzalez, A.; Marina, M. L. Crit. Rev. Anal. Chem.
1996, 26, 261.(378) Dittmann, M. M.; Rozing, G. P. Biomed. Chromatogr. 1998, 12,
136.(379) Dittmann, M. M.; Rozing, G. P.; Rees, G.; Adam, T.; Unger, K.
K. J. Capillary Electrophor. 1997, 4, 201.(380) Dittmann, M. M.; Rozing, G. P. J. Chromatogr. A 1996, 744, 63.(381) Dittmann, M. M.; Wienard, K.; Bek, F.; Rozing, G. P. LC-GC
1995, 13, 800.(382) Knox, J. H.; Grant, I. H. Chromatographia 1991, 32, 317.(383) Seifar, R. M.; Kok, W. Th.; Kraak, J. C.; Poppe, H. Chro-
matographia 1997, 46, 131.(384) Zhang, Y.; Shi, W.; Zhang, L.; Zou, H. J. Chromatogr. A 1998,
802, 59.(385) Yamamoto, H.; Baumann, J.; Erni, F. J. Chromatogr. 1992, 593,
313.(386) Yan, C.; Dadoo, R.; Zhao, H.; Zare, R. N. Anal. Chem. 1995, 67,
2026.(387) Van den Bosch, S. E.; Heemstra, S.; Kraak, J. C.; Poppe, H. J.
Chromatogr. A 1996, 755, 165.(388) Choudhary, G.; Horvath, C. J. Chromatogr. A 1997, 781, 161.(389) Seifar, P. M.; Heemstra, S.; Kok, W. Th.; Kraak, J. C.; Poppe,
K. H. J. Microcolumn Sep. 1998, 10, 41.(390) Euerby, M. R.; Johnson, C. M.; Cikalo, M.; Bartle, K. D.
Chromatographia 1998, 47, 135.(391) Wright, P. B.; Lister, A. S.; Dorsey, J. G. Anal. Chem. 1997, 69,
3251.(392) Yan, C.; Dadoo, R.; Zare, R. N.; Rakestraw, D. T.; Anex, D. S.
Anal. Chem. 1996, 68, 2726.(393) Huber, C. G.; Choudhary, G.; Horvath, C. Anal. Chem. 1997,
69, 4429.(394) He, B.; Tait, N.; Regnier, F. Anal. Chem. 1998, 70, 3790.(395) Kutter, J. P.; Jacobson, S. C.; Matsubara, N.; Ramsey, M. J. Anal.
Chem. 1998, 70, 3291.(396) Luedtke, S.; Adam, T.; Unger, K. K. J. Chromatogr. A 1997, 786,
229.(397) Knox, J. H.; Grant, I. H. Chromatographia 1987, 24, 135.(398) Dadoo, R.; Zare, R. N.; Yan, C.; Anex, D. S. Anal. Chem. 1998,
70, 4787.(399) Wu, J. T.; Huang, P.; Li, M. X.; Qian, M. G.; Lubman, D. M.
Anal. Chem. 1997, 69, 320.(400) Murphey, R. E.; Schure, M. R.; Foley, J. P. Anal. Chem. 1998,
70, 1585.(401) Lundell, N.; Markides, K. Chromatographia 1992, 34, 369.(402) Bushey, M. M.; Jorgenson, J. W. Anal. Chem. 1990, 62, 161.(403) Opiteck, G. J.; Jorgenson, J. W.; Anderegg, R. J. Anal. Chem.
1997, 69, 2283.(404) Opiteck, G. J.; Lewis, K. C.; Jorgenson, J. W.; Anderegg, R. J.
Anal. Chem. 1997, 69, 1518.(405) Matsuoka, K.; Taoka, M.; Isobe, T.; Okuyama, T.; Kato, Y. J.
Chromatogr. 1990, 515, 313.(406) Davies, M. J. Anal. Chim. Acta 1999, 379, 227.(407) Tonto, N.; Laurell, T.; Gorton, L.; Marko-Varga, G. Anal. Chim.
Acta 1999, 379, 281.(408) Davies, M. I.; Lunte, C. E. Chem. Soc. Rev. 1997, 26, 215.(409) Vanstaden, J. F. Fresenius J. Anal. Chem. 1995, 352, 271.(410) Church, W. H.; Justice, J. B., Jr. Anal. Chem. 1987, 59, 712.(411) Chen, A.; Lunte, C. E. J. Chromatogr. A 1995, 61, 29.(412) Newton, A. P.; Justice, J. B. Anal. Chem. 1994, 66, 1468.(413) Chen, A.; Lunte, C. E. J. Chromatogr. A 1995, 691, 29.(414) Lada, M. W. Ph.D. Dissertation, University of Florida, 1997.
CR980134J
Fast Analytical-Scale Separations by CE and LC Chemical Reviews, 1999, Vol. 99, No. 10 3131


![Review Analytical-scale supercritical fluid extraction: a ...quimica.udea.edu.co/~carlopez/cromatogc/sfe polluntants... · Analytical-scale supercritical fluid extraction ... [lo],](https://img.pdfslide.us/doc/110x75/5ab139fa7f8b9a6b468c4025/review-analytical-scale-supercritical-fluid-extraction-a-carlopezcromatogcsfe.jpg)