Embed Size (px)
Citation preview

The 7th Jordanian International Mechanical Engineering Conference (JIMEC’7)
27 - 29 September 2010, Amman – Jordan
ELECTRONICALLY CONTROLLED EXPANSION VALVE FOR USE IN A
GEOTHERMAL HEAT PUMP SYSTEM
Hosni I. Abu-Mulaweh, [email protected] Department of Mechanical Engineering, Purdue
University at Fort Wayne, Indiana, USA
Hossein Oloomi, [email protected] Department of Electrical Engineering, Purdue University at
Fort Wayne, Indiana, USA
ABSTRACT
This paper presents a detailed design of a development control board that can control an electronic
expansion valve in a geothermal heat pump. The design utilized a microcontroller based system with a
fuzzy control algorithm, and a temperature and pressure sensor configuration at the inlet of the
compressor. The fuzzy control was designed and simulated using Simulink in Matlab. The control
algorithm takes the information that the microcontroller obtained from the pressure and temperature
sensor and adjusts the valve accordingly to control the amount of superheat. The controller was able to
bring the superheat to the desired set point of 10°F ±2°F and maintain it.
Keywords: Expansion valve, Geothermal, Electronic control, Heat pump
1. INTRODUCTION
A traditional geothermal heat pump consists of five basic components: compressor, condenser,
evaporator, reversing valve, and expansion device. In a geothermal system, the earth loop is located
below the frost line to take advantage of the earth’s constant temperature. A coolant line from the
earth loop is connected to the coax heat exchanger in the heat pump system. The coax heat exchanger
acts as an evaporator in the heating mode (Fig. 1a), and a condenser in the cooling mode (Fig. 1b).
The expansion devices come in different forms, such as capillary tubes which are used in refrigerators
and window air conditioners, thermal expansion valves which are used in many geothermal heat
pumps, and electronic expansion valves which allow for use with variable speed compressors.
Capillary tube is simple and not expensive. However, its flow regulation is limited to a very small
range of flow conditions. Thermostatic expansion valves are more advanced and they use a
proportional feedback action control mechanism to keep evaporator superheat at constant value.
However, they are not appropriate for a wide range of flow conditions because its control system is
simple (see for example; [Broersen and Van Der Jagt, 1980], and [Mithraratnel and Wijeysundera,
2002], [Chen, et al., 2002]). It is controlled by springs, bellows, and push rods. On the other hand, the

The 7th Jordanian International Mechanical Engineering Conference (JIMEC’7)
27 - 29 September 2010, Amman – Jordan
electronic expansion valve has a much more sophisticated design. Electronic expansion valves provide
higher system efficiency, can be used on different tonnage systems and can be controlled more
precisely than other types of expansion valves (see for example; [Outtagart, et al., 1997], [Aprea and
Mastrullo, 2002], [Lazzarin, et al., 2008], and [Lazzarin and Noro, 2008]. In order to use an electronic
expansion valve in a system, a controller that integrates into the thermal system must be used.
Figure 1a: Schematics of the geothermal heat pump compression vapor cycle (heating mode)
Figure 1b: Schematics of the geothermal heat pump compression vapor cycle (cooling mode)
3
2
4
Air Coil
Expansion Valve
Coax
Reversing Valve
Compressor
1
3
2
4
Air Coil
Expansion Valve
Coax
Compressor
Reversing Valve
1

The 7th Jordanian International Mechanical Engineering Conference (JIMEC’7)
27 - 29 September 2010, Amman – Jordan
There are two types of electronic expansion valves: the superheat control expansion valve and the
intermediate pressure control expansion valve. These electronic expansion valves expand the liquid
refrigerant and converts it into a low-temperature, low-pressure atomized refrigerant. At the same
time, they regulate the amount of refrigerant to be supplied to the interior evaporator or to the exterior
heat exchanger.
WaterFurnace International in Fort Wayne, Indiana, has the need for a control board that can control
an electronic expansion valve (EEV) in a reversible heat pump (heating and cooling modes). The
board must be able to control superheat in the refrigeration circuit of a geothermal heating/cooling
system to a specific set point of 10°F +/-2°F of superheat at the inlet of the compressor. The board will
be designed to control a 12V DC stepper motor that will be used to open and close an electronic
expansion valve.
This paper presents a detailed design of the control board that was requested by the sponsor of this
project. Four different system tests are presented to validate the proposed design.
2. THE DESIGN PROCESS AND SPECIFICATIONS
The design process that was employed is the one outlined by [Bejan et al., 1996] and [Jaluria, 1980].
The first essential and basic feature of this process is the formulation of the problem statement. The
formulation of the design problem statement involves determining the requirements of the system, the
given parameters, the design variables, any limitations or constraints, and any additional
considerations arising from safety, financial, environmental, or other concerns. The following is a
summary of the guidelines:
• Refrigerant – 410A refrigerant will be used in this system and must be controlled
within/throughout the following components:
Superheated vapor must exit the compressor
The inlet of the compressor must have 10°F of superheat +/-2°F
A refrigerant temperature of 15°F to 250°F throughout the entire system
As the superheat in the system rises above the set point of 10°F +/- 2°F the control will
need to open the expansion valve to bring the superheat value down.
As the superheat in the system falls below the set point the control board will need to
close the valve to raise the superheat back to the acceptable level.
• Control Operating Voltage
The board must operate with a supply voltage of 18 to 30 Volts AC at 50/60Hz.
The board must have low voltage protection that will suspend operation of the board if the
supply voltage falls below 18 Volts AC.

The 7th Jordanian International Mechanical Engineering Conference (JIMEC’7)
27 - 29 September 2010, Amman – Jordan
• Temperature or Pressure Transducers – Two or more sensors, either temperature or pressure,
must be interfaced with the control board. All temperature sensors that the board uses must be
a 10KΩ negative temperature coefficient type.
Pressure sensors are used to calculate saturation temperature, Tsat. The operating range for
the temperature sensor is 0 to 1000 psi.
Temperature sensors are used to calculate superheat temperature, T*, from the Tsat
measurement.
• Software – Must be able to control stepper motor of the EEV to regulate the mass flow rate of
refrigerant.
After the problem statement was formulated, several conceptual designs were considered and
evaluated. Each design concept was evaluated by the following criteria: Effectiveness, Cost, Safety,
and Size. The final design that was developed and constructed consisted of a microcontroller based
board loaded with a fuzzy control algorithm, and interfaced with one pressure sensor and one
temperature sensor. The fuzzy control algorithm takes the information that the microcontroller
obtained from the pressure and temperature sensor and then adjusts the valve accordingly to control
the amount of superheat.
Fuzzy control
A fuzzy control is a control that is designed around a set of if-then rules. The fuzzy controller is also
made up of an inference mechanism, a fuzzification inference, and a defuzzification inference. Figure
2 illustrates a simplified block diagram of a proportional derivative (PD) fuzzy controller.
Figure 2: Block diagram of fuzzy controller
In Figure 2 the following variables are used to create the base rules:
e: error, which is the superheat temperature going into the compressor.
: change in error. Change in superheat with respect to the change in time.
G1: Integral of the superheat.
h: Gain for the system.
u: Amount of steps the EEV needs adjusted.
r
e u y
Fuzzy
Controller
G1
h EEV _

The 7th Jordanian International Mechanical Engineering Conference (JIMEC’7)
27 - 29 September 2010, Amman – Jordan
Each of these three variables (e and as inputs and u as the output) will need to have ranges assigned
to them so that rules can be wrote for the system. The fuzzy control can be designed and simulated
using Simulink in Matlab.
Simulink
MatLab’s Simulink is used for simulation purposes of the EEV fuzzy control. Figure 3 is a diagram of
the model used to simulate how the fuzzy control will be able to adjust the EEV to reach the target
superheat of 10°F.
dT/dtXY Graph
z
1
Unit Delay
Superheat
18
Set Point
Superheatsignal2signal3
1
s
Integrator
-K-
GainFuzzy Logic
Controllerdu/dt
DerivativeRunning
Sum
Cumulative
Sum
Clock
Superheat
Figure 3: Simulink model
Each of the elements in the diagram performs different tasks. The set point block is the initial
superheat value being given to the system. The fuzzy logic controller must receive three inputs; the
superheat temperature, the derivative of the superheat and the integral of the superheat. Since the
fuzzy logic control outputs the number of steps the valve needs to be changed, these steps need to be
converted into a delta superheat temperature in order to make the simulation work. To do this
conversion a gain block is used. The value the gain block uses is 4 degrees of superheat for every 10
valve steps (numbers based on testing). The unit delay is set to the number of seconds that will pass
between each sample taken by the system, which in this case is 10 seconds. The unit delay also allows
the derivative block to function. The cumulative sum box keeps track of the delta superheat
temperatures by summing up the delta superheat temperatures for ever iteration of the system. The XY
Graph and scope blocks are used to view the superheat and derivative of the superheat in the form of a
time based plot. Running the model with an initial superheat of 18°F over a time span of 100 seconds
with 10 second intervals produces the plots seen in Figures 4 and 5. Figure 4 shows that the fuzzy
EEV simulation can be used to control the superheat at the inlet of the compressor to the needed value
of 10°F.

The 7th Jordanian International Mechanical Engineering Conference (JIMEC’7)
27 - 29 September 2010, Amman – Jordan
0 10 20 30 40 50 60 70 80 90 1009
10
11
12
13
14
15
16
17
18
Time(sec)
Superh
eat(deg F
)
Figure 4: Superheat as controlled by the fuzzy control
0 10 20 30 40 50 60 70 80 90 100-0.6
-0.4
-0.2
0
0.2
0.4
0.6
0.8
Time(sec)
dT/d
t
Figure 5: Derivative of superheat
Electronic Control Hardware
The design of the hardware for the electronic control was broken up into five parts: power
conditioning, motor drive, user output, system input and data analysis.
Power conditioning – The purpose of this portion of the circuit is to convert the input AC voltage to
DC voltage that can be used by the integrated circuits and the stepper motor. The power conditioning
circuit is required to supply up to1A at 12VDC and 25mA @ 3.3VDC.

The 7th Jordanian International Mechanical Engineering Conference (JIMEC’7)
27 - 29 September 2010, Amman – Jordan
System input – System input refers to the different sensors in the system and control signals from the
control board. This circuit needs to be able to interface the sensors to the control board and provide
the control with input data from the system.
Motor drive – The motor drive portion of the control is required to be able to commutate the stepper
motor by means of signals from the microcontroller. In order to commutate the motor one complete
step, a series of pulses to different phases of the motor windings is required. The microcontroller will
be used to synchronize these pulses to the motor.
User output – An LCD screen will be attached to the control board and will display valve position to
the user. This will be used as a debugging tool and will not remain on the control board for
production; therefore the LCD itself will not be factored into the cost constraint.
Data analysis and control – This portion of the control is the computational part of the circuit and
controls and monitors the entirety of the circuit. This section is voltage sensitive and requires tight
tolerance.
3. DESCRIPTION OF THE DESIGN
The sensor layout utilizes one pressure sensor and one temperature sensor at one state (the inlet of the
compressor) in the compression vapor cycle of the geothermal heat pump (refer to Fig. 1). This sensor
layout allows for a very accurate superheat calculation at this state in both heating and cooling modes.
The superheat can be calculated by using the saturated temperature that corresponds to the pressure at
this state and subtracting it from the actual temperature. As the superheat temperature changes going
into the compressor, the control system will be able to adjust the expansion valve so that the superheat
stays within the 10°F ± 2°F range. Because there are no sensors located on either side of the expansion
valve the control system will only be able to react to the superheat change at the inlet of the
compressor. Also great care will need to be taken to make sure that the control system does not under
or over compensate for the changes in the superheat by opening the valve too slowly or too quickly.
The electronic control for the EEV is based around a microcontroller for data processing of the fuzzy
control algorithm. The microcontroller interfaces with the sensors, the stepper motor and the LED
display. The microcontroller analyzes the state points in the system by sampling the output of the
sensors and then adjusts the stepper motor accordingly. The display is controlled by the
microcontroller as well, displaying the valve position. The microcontroller uses board space and does
not require hardware interfacing with external memory.
The EEV changes the orifice opening by changing the position of the pin inside of the valve. The pin
is attached to a permanent magnet rotor that is rotated by applying a specific series of voltages to the
coils of the stator ring on the exterior of the valve. The valve and stepper motor were supplied by

The 7th Jordanian International Mechanical Engineering Conference (JIMEC’7)
27 - 29 September 2010, Amman – Jordan
WaterFurnace. The motor is rated at 12 Volts DC and 0.26 Amperes per phase. In order to commutate
the motor a driving circuit must be used because the voltage and current requirements of the stepper
motor exceed what the microcontroller can deliver. A Darlington driver was selected to interface the
stepper motor with the microcontroller. The four inputs to the Darlington driver are delivered from the
microcontroller and the corresponding outputs of the Darlington driver are connected to the stepper
motor.
The other facet of the electrical/electronic design is the software. The software is downloaded into the
microcontroller and controls the functionality of the entire control. The software was written in the C
programming language and compiled and developed in Atmel’s software development environment,
AVR Studio. AVR Studio connects to the Atmel STK500 development board through an RS232 serial
cable. AVR Studio checks the code for errors, compiles the code and then communicates with the
microcontroller to download the machine code to it.
The development board has features that make future design changes easier to implement. Some of
these features include:
• A socket design for a removable microcontroller
• An increase in analog-to-digital ports for future sensor design layouts
• Readable display that outputs pressure, temperature, superheat and other calculations it is
programmed to display.
The addition of more analog-to-digital ports allows more methods of control in the future, or to be
used to improve the overall performance of the system. The socket for the microcontroller is useful
because it allows the microcontroller to be removed from the development board, be programmed on
the Atmel programming board and then placed back on the development board quickly. The display
offers the user the benefit of displaying three-digit integer values, such as temperature and pressure
that can be used for debugging purposes. This allows one to see if there are any issues with
calculations or sensors.
4. PARAMETERS TESTING AND PROCEDURE
In order to obtain accurate and valid test results, the heat pump system needs to be setup by
WaterFurnace to their specified test parameters. The room must be allowed to stabilize for a
minimum of 15 minutes prior to testing to obtain initial readings of the system.
Before the testing begins 24VAC must be applied to the input of the switching power supply and the
development board should then be turned on. The first test is to download the code to the
The 7th Jordanian International Mechanical Engineering Conference (JIMEC’7)
27 - 29 September 2010, Amman – Jordan
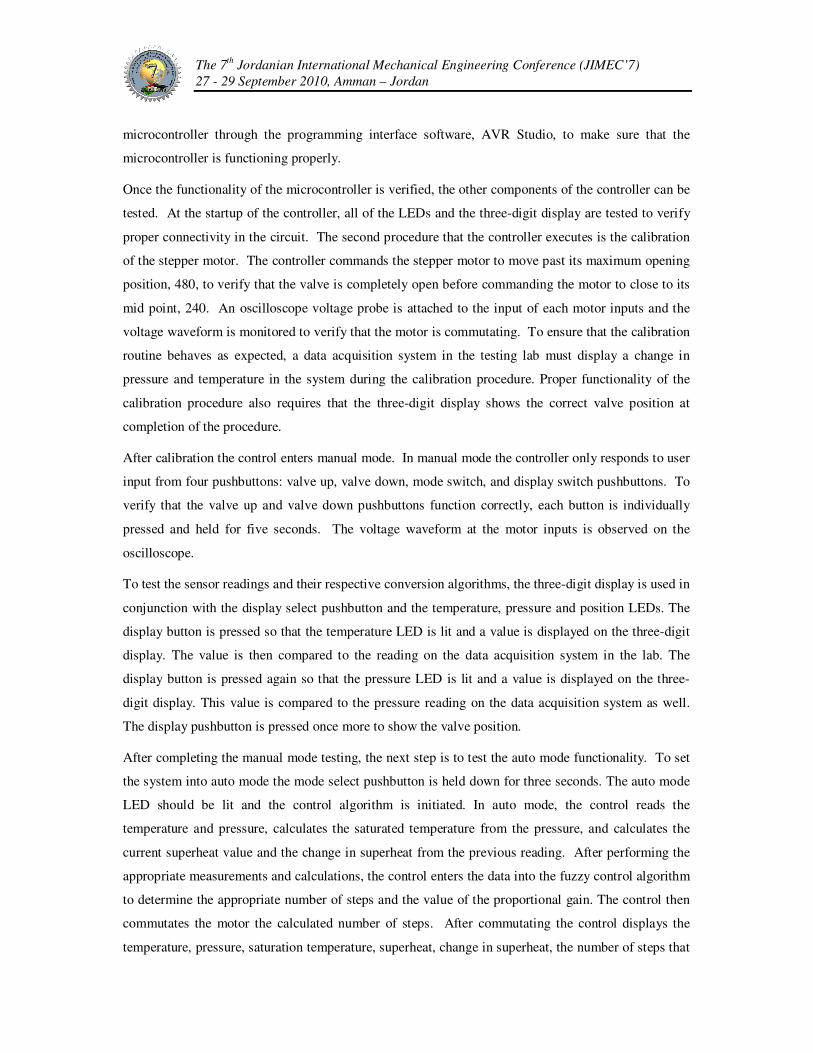
microcontroller through the programming interface software, AVR Studio, to make sure that the
microcontroller is functioning properly.
Once the functionality of the microcontroller is verified, the other components of the controller can be
tested. At the startup of the controller, all of the LEDs and the three-digit display are tested to verify
proper connectivity in the circuit. The second procedure that the controller executes is the calibration
of the stepper motor. The controller commands the stepper motor to move past its maximum opening
position, 480, to verify that the valve is completely open before commanding the motor to close to its
mid point, 240. An oscilloscope voltage probe is attached to the input of each motor inputs and the
voltage waveform is monitored to verify that the motor is commutating. To ensure that the calibration
routine behaves as expected, a data acquisition system in the testing lab must display a change in
pressure and temperature in the system during the calibration procedure. Proper functionality of the
calibration procedure also requires that the three-digit display shows the correct valve position at
completion of the procedure.
After calibration the control enters manual mode. In manual mode the controller only responds to user
input from four pushbuttons: valve up, valve down, mode switch, and display switch pushbuttons. To
verify that the valve up and valve down pushbuttons function correctly, each button is individually
pressed and held for five seconds. The voltage waveform at the motor inputs is observed on the
oscilloscope.
To test the sensor readings and their respective conversion algorithms, the three-digit display is used in
conjunction with the display select pushbutton and the temperature, pressure and position LEDs. The
display button is pressed so that the temperature LED is lit and a value is displayed on the three-digit
display. The value is then compared to the reading on the data acquisition system in the lab. The
display button is pressed again so that the pressure LED is lit and a value is displayed on the three-
digit display. This value is compared to the pressure reading on the data acquisition system as well.
The display pushbutton is pressed once more to show the valve position.
After completing the manual mode testing, the next step is to test the auto mode functionality. To set
the system into auto mode the mode select pushbutton is held down for three seconds. The auto mode
LED should be lit and the control algorithm is initiated. In auto mode, the control reads the
temperature and pressure, calculates the saturated temperature from the pressure, and calculates the
current superheat value and the change in superheat from the previous reading. After performing the
appropriate measurements and calculations, the control enters the data into the fuzzy control algorithm
to determine the appropriate number of steps and the value of the proportional gain. The control then
commutates the motor the calculated number of steps. After commutating the control displays the
temperature, pressure, saturation temperature, superheat, change in superheat, the number of steps that

The 7th Jordanian International Mechanical Engineering Conference (JIMEC’7)
27 - 29 September 2010, Amman – Jordan
the valve commutated, and the valve position. This display sequence is used to verify the fuzzy
algorithm’s functionality by comparing the displayed values to the values of temperature, pressure,
and superheat of the system from the data acquisition system in the lab. Auto mode will loop
indefinitely keeping the system to a user specified superheat set point, even with the addition of a
disturbance to the system.
Disturbance testing can be observed during testing by monitoring the data acquisition system’s
readings for temperature, pressure and superheat. Once the system reaches steady-state, a disturbance
can be introduced into the system. The most rapid and severe disturbance to the system is a rapid
change in the water temperature flowing through the coax heat exchanger. For example, in cooling
mode the inlet water temperature can be increased from 77°F to 90°F to simulate a very hot day. Once
the disturbance is introduced, the control display and laboratory data acquisition system will display
the control’s reaction.
Component Testing Results
All of the major components were individually tested and proven to work as designed. This includes
the LEDs, pushbuttons, microcontroller, and sensors. The components worked together properly, and
the logic of the control board interfaces with each component correctly. The fuzzy control algorithm
was verified with hand calculations. This allows proper control of superheat using all of the
components.
The user input and display interface operated according to the design specifications allowing the user
to select the display mode, move the valve position up or down in manual mode and switch between
manual and automatic mode. The pushbuttons provided an easy way for the user to control the
position of the valve and gather the temperature, pressure, and position data. A recommendation to
provide the user with more control of the board in manual mode is to implement a method of allowing
the user to calibrate the valve when desired instead of manually having to reset the board.
5. SYSTEM TESTING RESULTS AND DISCUSSION
The control was tested with a 3-ton geothermal heat pump system to ensure all of the design
requirements were being met. This was done by interfacing the temperature and pressure sensors at
the inlet of the compressor. Using the control board in auto mode, the EEV will commutate as an
attempt to regulate superheat. The readings of temperature, pressure and superheat are displayed on
the 7 segment LEDs on the board. These readings are then compared to values on WaterFurnace’s lab
equipment. The superheat values, as well as the time it takes to reach 10°F ± 2°F are recorded and
evaluated. Four different system texts were carried out. All of these system tests were done at

The 7th Jordanian International Mechanical Engineering Conference (JIMEC’7)
27 - 29 September 2010, Amman – Jordan
WaterFurnace’s development lab using a variety of equipment. The temperature and pressure ware
monitored at the inlet and outlet of cycle components and displayed using data acquisition software.
The development laboratory allows an implementation of real world conditions to be simulated such
as air temperature, humidity, static pressure, and water flow rate and temperature at the inlet and outlet
of the coax heat exchanger.
Test #1: Normal Operation Conditions
The system was tested in the cooling mode (water is used in the coax to exchange heat from the
refrigerant to the earth loop of a geothermal system) under normal operation conditions listed in Table
1. The lab was set to these conditions until steady-state was reached. At these listed conditions the
superheat temperature was approximately 26°F at the inlet of the compressor. As shown in Fig. 6, the
valve was capable of reducing the superheat to the set point of 10°F ± 2°F at these conditions. It took
about 5 minutes to reduce the initial superheat of 26°F to the set point of 10°F ± 2°F.
Table 1 Normal operation conditions
Parameter oF
Entering dry bulb air temperature 80
Entering wet bulb air temperature 66
Leaving dry bulb air temperature 66
Leaving wet bulb air temperature 40
Entering water temperature 77
Leaving water temperature 90
Test #2: Operation with a change in coax inlet water temperature – Disturbance 1
In the normal operation conditions stated Table 1 above, the inlet temperature of the coax water is
77°F. In order to confirm that the control can handle a disturbance, such as an increase in the inlet
water temperature was created. First the system was allowed to reach steady-state at normal operation
conditions as described in Table 1. Next the inlet water temperature was increased from 77°F to 90°F.
This rapid increase in temperature is the worst-case disturbance that can only be realized in the lab.
Figure 7 shows that as the water temperature changes, the level of the superheat changes. When this
occurred, the fuzzy control algorithm begins to adjust the valve in order to bring the level of superheat
to the desired point. The rate of change in the inlet water temperature was too great for the control to
hold the superheat within the range initially. Once the water temperature stabilized at 90°F the fuzzy
control algorithm was able to bring the superheat back down to the desired point. It should be noted

The 7th Jordanian International Mechanical Engineering Conference (JIMEC’7)
27 - 29 September 2010, Amman – Jordan
that the inlet water temperature is typically 50°F to 77°F, and this test was an exaggerated disturbance.
This proves the control’s functionality and capability during disturbances.
5
10
15
20
25
30
0 100 200 300 400 500 600 700 800
Time [sec]
Superh
eat [°
F]
Figure 6: Superheat control under normal operation conditions (Test #1)
Test #3: Operation with a mode switch – Disturbance 2
In order to further prove the control’s ability to handle disturbance, another disturbance such as mode
switching was introduced again from normal operation. The unit was again allowed to run in normal
operation as described in Table 1 until steady-state was reached. The unit was then changed from
cooling mode to heating mode. Figures 1a and 1b show how the refrigerant switches directions when
the mode (cooling and heating) is switched. When this happens the compressor turns off, then the
reversing valve is switched to a different position. The compressor is then turned back on. This mode
switching is done automatically with the unit’s main controller. While the compressor is off, the EEV
begins to recalibrate. When recalibrated, the EEV returns to the mid-way open point of 240 steps.
The control is then put back into automatic mode to control the superheat temperature. Figure 8 shows
the superheat with respect to time during the mode switching process. As can be seen from the figure,
the fuzzy control algorithm begins to adjust the valve in order to bring the level of superheat to the
desired point when a switching in mode occurs.

The 7th Jordanian International Mechanical Engineering Conference (JIMEC’7)
27 - 29 September 2010, Amman – Jordan
6
8
10
12
14
16
18
20
0 100 200 300 400 500 600
Time [sec]
Superh
eat [°F]
Figure 7: Superheat control with a change in coax inlet water temperature (Test #2)
5
10
15
20
25
30
0 100 200 300 400 500 600 700 800
Time [sec]
Superh
eat [°
F]
Figure 8: Superheat control with a mode switch (Test #3)
Test #4: Change in superheat set point
Test #4 is used to illustrate the fuzzy algorithm’s ability to handle different set points of superheat. It
could be possible for WaterFurnace to want a different set point of superheat at the inlet of the
compressor in the future to accommodate design requirements. The set points of 5°F, 10°F and 15°F
of superheat were programmed (note that only one set point can be programmed at a time) into the

The 7th Jordanian International Mechanical Engineering Conference (JIMEC’7)
27 - 29 September 2010, Amman – Jordan
fuzzy logic portion of the code while the system was operating under normal conditions described in
Table 1. After each set point was loaded, the superheat was measured until that set point was met.
Figure 9 shows the control’s ability to have a variety of set points programmed into it and function
properly. The 5°F set point was not able to be reached because the valve was all the way open. It did
however get in the 5°F± 2°F range.
0
5
10
15
20
25
30
0 100 200 300 400 500 600 700 800 900
Time [sec]
Sup
erh
eat
[°F
]
T_SH = 5 T_SH = 10 T_SH = 15
Figure 9: Superheat control for different superheat values (Test #4)
5. CONCLUSION
A development control board for an electronic expansion valve used in geothermal heat pump systems
was designed and developed for the growing industry of energy conservation. The specific
requirements of the board were given to the group by WaterFurnace, a geothermal heating and cooling
system manufacturer. The design utilized a microcontroller based system with a fuzzy control
algorithm, and a temperature and pressure sensor configuration at the inlet of the compressor. Then a
bread board prototype was constructed and tested.
The controller was able to bring the superheat to the desired set point of 10°F ±2°F and maintain it
there. A recommendation to further improve the performance of the controller is to implement another

The 7th Jordanian International Mechanical Engineering Conference (JIMEC’7)
27 - 29 September 2010, Amman – Jordan
variable gain in the fuzzy control algorithm to improve the controller when the superheat is at or near
the desired set point. This would lower the settling time of the controller when it is near the set point.
6. ACKNOWLEDGEMENT
The present study was supported by Water Furnace International, Inc., Fort Wayne, Indiana, USA.
REFERENCES
1. Broersen, P.M.T. and Van Der Jagt, M.F., (1980), “Hunting of Evaporators Controlled by a
Thermostatic Expansion Valve,” ASME Transactions 1, pp. 130-135.
2. Mithraratnel, P. and Wijeysundera, N.E., (2002), “An Experimental and Numerical Study of
Hunting in Thermostatic-Expansion-Valve-Controlled Evaporator,” International Journal of
Refrigeration 25, pp. 992-998.
3. Chen, W., Chen, Z., Zho, R., and Wu, Y., (2002), “Experimental Investigation of a Minimum
Stable Superheat Control System of an Evaporator,” International Journal of Refrigeration 25, pp.
1137-1142.
4. Outtagart, A., Haberschill, P., and Lallemand, M., (1997), “The Transient Response of an
Evaporator fed through an Electronic Expansion Valve,” International Journal of Energy Research 21,
pp. 793-807.
5. Aprea, C. and Mastrullo, R., (2002), “Experimental Evaluation of Electronic and Thermostatic
Expansion Valves Performances Using R22 and R407C,” Applied Thermal Engineering 22, pp. 205-
218.
6. Lazzarin, R., Nardotto, D., and Noro, M. , (2008), “Energy Savings and Economic Benefits of
Using Electronic Expansion Valves in Supermarket Display Cabinets,” International Journal of Low-
Carbon Technologies 3, 147-157.
7. Lazzarin, R. and Noro, M., (2008), “Experimental Comparison of Electronic and Thermostatic
Expansion Valves Performances in an Air Conditioning Plant,” International Journal of Refrigeration
31, pp. 113-118.
8. Bejan, A., Tsatsaronis, G., and Moran, M., (1996), “Thermal Design & Optimization,” John
Wiley & Sons, Inc., New York.
9. Jaluria, Y., (1980), “Design and Optimization of Thermal Systems,” McGraw-Hill, New York.