Embed Size (px)
Citation preview
1
ELECTRONIC SUPPLEMENTARY INFORMATION
for the paper entitled
Interaction of 6,6’’-bis(5,5,8,8-tetramethyl-5,6,7,8-tetrahydro-1,2,4-
benzotriazin-3-yl)-2,2’:6’,2’’-terpyridine (CyMe4-BTTP) with some
Trivalent Ions such as Lanthanide(III) Ions and Americium(III)
Frank W. Lewis,*a Laurence M. Harwood,*a Michael J. Hudson,a Michael G. B. Drew,a
Giuseppe Modolo,b Michal Sypula,b Jean F. Desreux,c Nouri Bouslimanic and Geoffrey
Vidickc
a Department of Chemistry, The University of Reading, Whiteknights, Reading RG6 6AD, UK.
E-mail: [email protected], [email protected] b Forschungszentrum Jülich GmbH, Sicherheitsforschung und Reaktortechnik, D-52425
Jülich, Germany. E-mail: [email protected] c Coordination and Radiochemistry, University of Liège, Sart Tilman B16,
B-4000 Liège, Belgium. E-mail: [email protected]
Electronic Supplementary Information for Dalton TransactionsThis journal is © The Royal Society of Chemistry 2010
2
CONTENTS PAGE
1. Figure S1. Mass spectrum of a 5:Gd(ClO4)3
mixture (2.5:1 ratio) 3
2. Figure S2. Expanded view of the mass peak at
m/z = 460.19 of [Gd(5)2]3+ 3
3. Figure S3. Computer simulation of the isotope
distribution pattern of [Gd(5)2]3+ 4
4. Figure S4. Mass Spectrum of a 5:Yb(NO3)3
mixture (1:1 ratio) 4
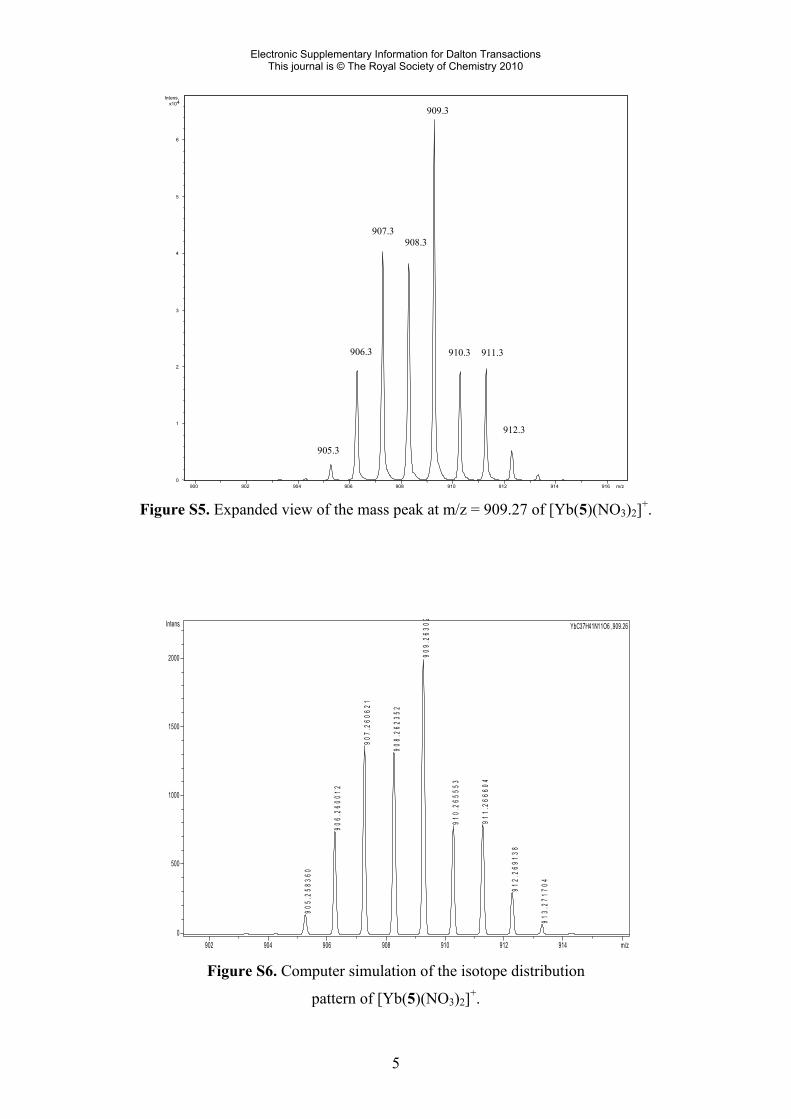
5. Figure S5. Expanded view of the mass peak at
m/z = 909.27 of [Yb(5)(NO3)2]+ 5
6. Figure S6. Computer simulation of the isotope
distribution pattern of [Yb(5)(NO3)2]+ 5
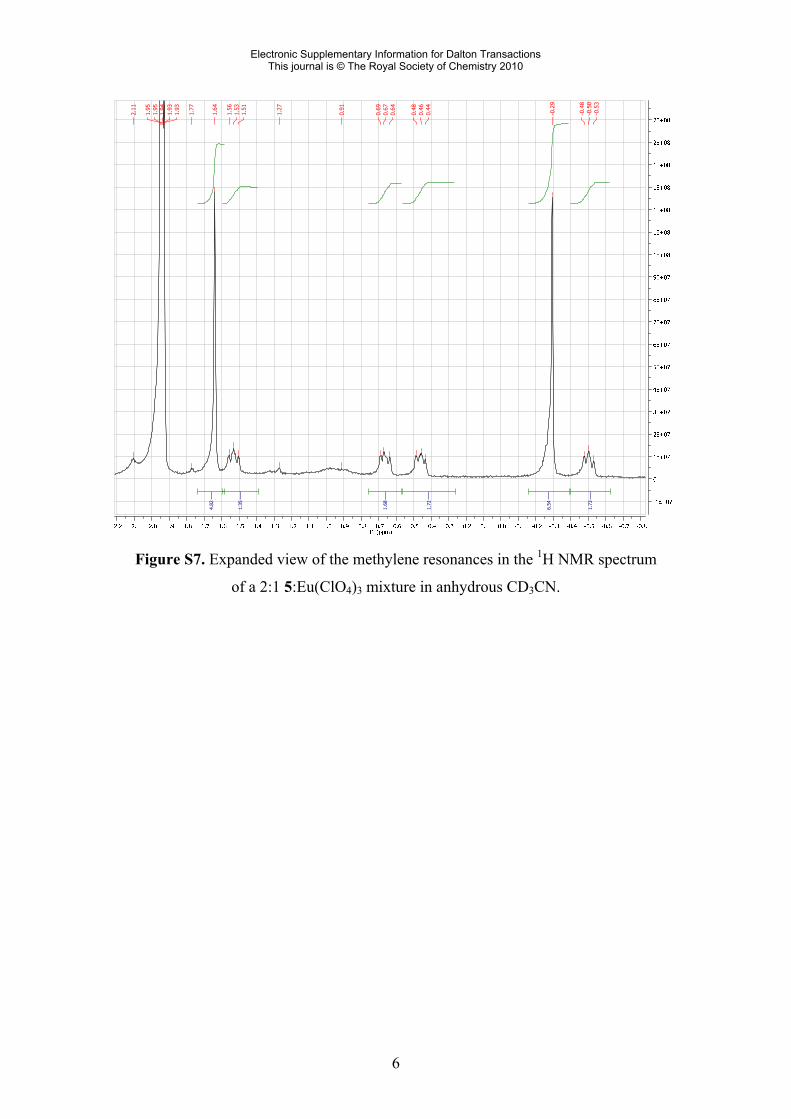
7. Figure S7. Expanded view of the methylene
resonances in the 1H NMR spectrum of a 2:1
5:Eu(ClO4)3 mixture in anhydrous CD3CN 6
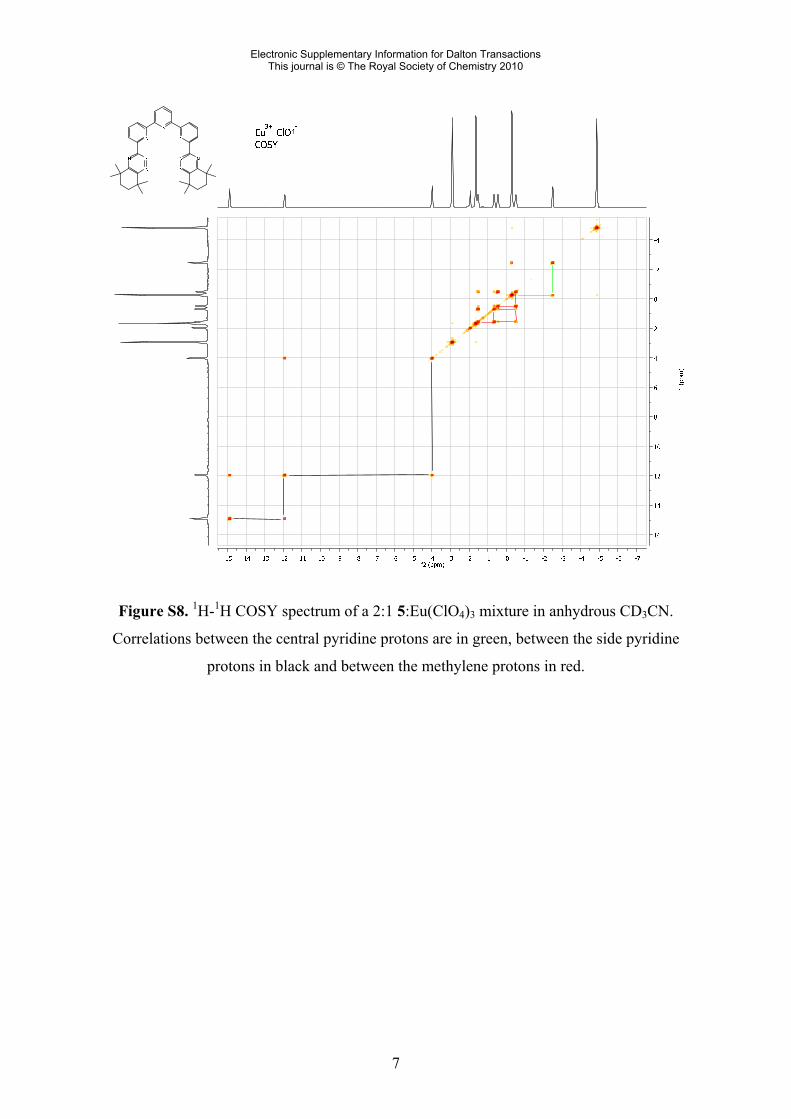
8. Figure S8. 1H-1H COSY spectrum of a 2:1
5:Eu(ClO4)3 mixture in anhydrous CD3CN 7
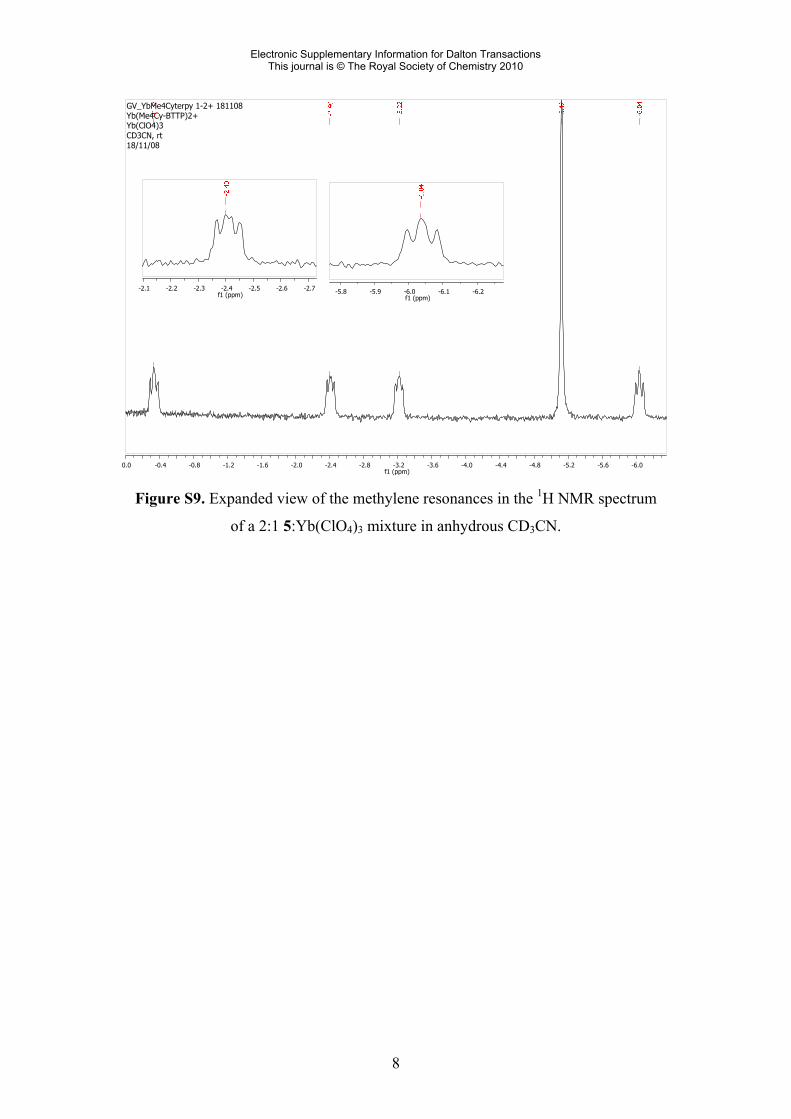
9. Figure S9. Expanded view of the methylene
resonances in the 1H NMR spectrum of a 2:1
5:Yb(ClO4)3 mixture in anhydrous CD3CN 8
10. Figure S10. 1H-1H COSY spectrum of a 2:1
5:Yb(ClO4)3 mixture in anhydrous CD3CN 9
11. Figure S11. 1H-13C HSQC correlation of a 2:1
5:Yb(ClO4)3 mixture in anhydrous CD3CN 10
12. Figure S12. Correlation between the calculated
and experimental paramagnetic shifts in the
1H NMR spectrum of [Yb(5)](NO3)3 11
13. Figure S13. Expanded view of the mass peak at
m/z = 358.6264 of the Pd2+ complex of
CyMe4-BTTP 5 11
14. Figure S14. Computer simulation of the isotope
distribution pattern of the 1:1 complex [Pd(5)]2+ 12
15. Figure S15. Computer simulation of the isotope
distribution pattern of the 2:2 complex [Pd2(5)2]4+ 12
Electronic Supplementary Information for Dalton TransactionsThis journal is © The Royal Society of Chemistry 2010
3
460.19
612.33
634.31
0.0
0.2
0.4
0.6
0.8
1.0
1.2
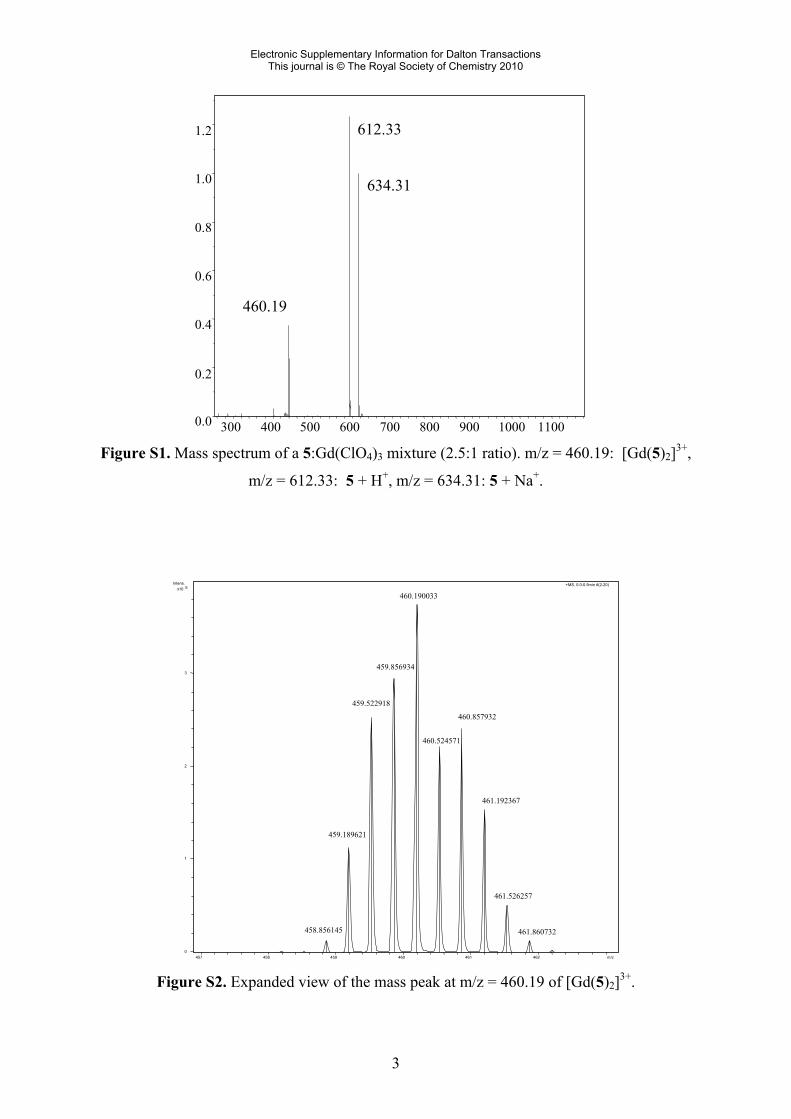
300 400 500 600 700 800 900 1000 1100 Figure S1. Mass spectrum of a 5:Gd(ClO4)3 mixture (2.5:1 ratio). m/z = 460.19: [Gd(5)2]3+,
m/z = 612.33: 5 + H+, m/z = 634.31: 5 + Na+.
458.856145
459.189621
459.522918
459.856934
460.190033
460.524571
460.857932
461.192367
461.526257
461.860732
+MS, 0.0-0.5min #(2-20)
0
1
2
3
5 x10 Intens.
457 458 459 460 461 462 m/z Figure S2. Expanded view of the mass peak at m/z = 460.19 of [Gd(5)2]3+.
Electronic Supplementary Information for Dalton TransactionsThis journal is © The Royal Society of Chemistry 2010
4
458.872120
459.206032
459.539620
459.873484
460.207033
460.541083
460.874529
461.208586
461.542808
461.877074
C74 H82 N18 Gd ,1380.62
0
500
1000
1500
2000
Intens.
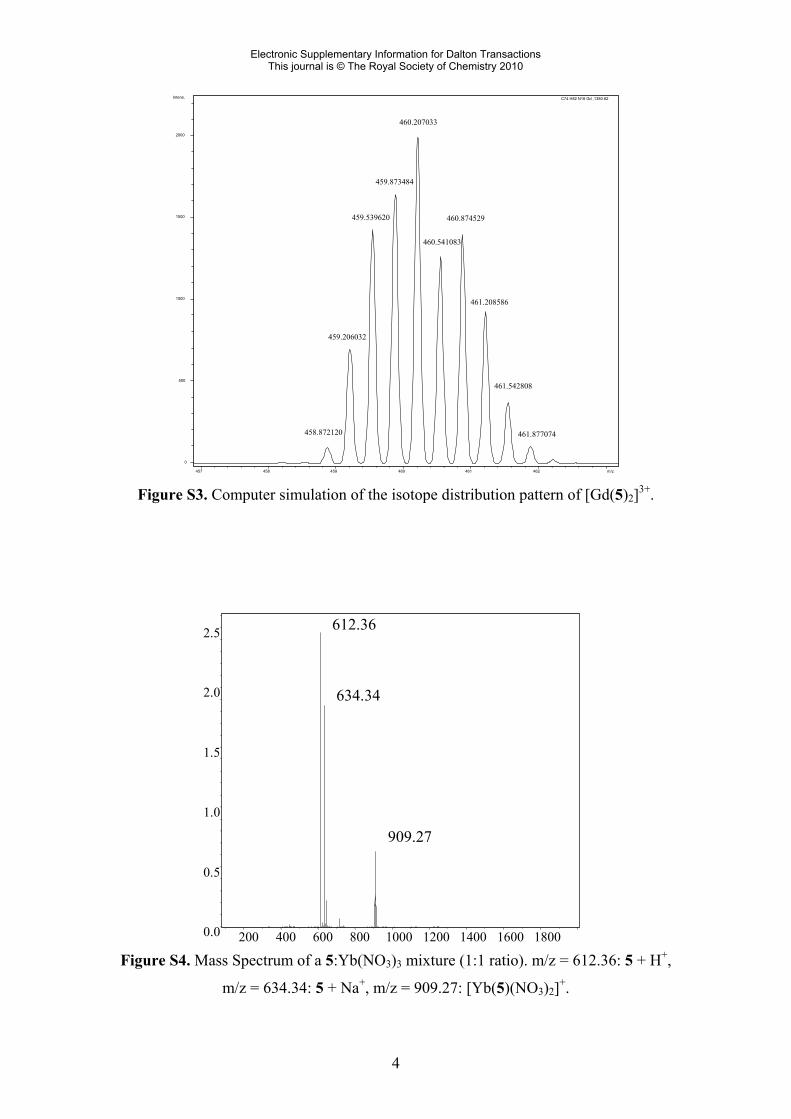
457 458 459 460 461 462 m/z Figure S3. Computer simulation of the isotope distribution pattern of [Gd(5)2]3+.
612.36
634.34
909.27
0.0
0.5
1.0
1.5
2.0
2.5
200 400 600 800 1000 1200 1400 1600 1800 Figure S4. Mass Spectrum of a 5:Yb(NO3)3 mixture (1:1 ratio). m/z = 612.36: 5 + H+,
m/z = 634.34: 5 + Na+, m/z = 909.27: [Yb(5)(NO3)2]+.
Electronic Supplementary Information for Dalton TransactionsThis journal is © The Royal Society of Chemistry 2010
5
905.3
906.3
907.3908.3
909.3
910.3 911.3
912.3
0
1
2
3
4
5
6
4 x10 Intens.
900 902 904 906 908 910 912 914 916 m/z Figure S5. Expanded view of the mass peak at m/z = 909.27 of [Yb(5)(NO3)2]+.
905.
2583
60
906.
2600
12
907.
2606
21
908.
2623
52
909.
2630
2
910.
2655
53
911.
2666
04
912.
2691
38
913.
2717
04
YbC37H41N11O6 ,909.26
0
500
1000
1500
2000
Intens.
902 904 906 908 910 912 914 m/z Figure S6. Computer simulation of the isotope distribution
pattern of [Yb(5)(NO3)2]+.
Electronic Supplementary Information for Dalton TransactionsThis journal is © The Royal Society of Chemistry 2010
6
1.73
6.54
1.72
1.68
1.35
4.82
-0.5
3-0
.50
-0.4
8
-0.2
9
0.44
0.46
0.48
0.64
0.67
0.69
0.91
1.27
1.51
1.53
1.56
1.64
1.77
1.93
1.93
1.94
1.95
1.95
2.11
Figure S7. Expanded view of the methylene resonances in the 1H NMR spectrum
of a 2:1 5:Eu(ClO4)3 mixture in anhydrous CD3CN.
Electronic Supplementary Information for Dalton TransactionsThis journal is © The Royal Society of Chemistry 2010
7
Figure S8. 1H-1H COSY spectrum of a 2:1 5:Eu(ClO4)3 mixture in anhydrous CD3CN.
Correlations between the central pyridine protons are in green, between the side pyridine
protons in black and between the methylene protons in red.
Electronic Supplementary Information for Dalton TransactionsThis journal is © The Royal Society of Chemistry 2010
8
-6.0-5.6-5.2-4.8-4.4-4.0-3.6-3.2-2.8-2.4-2.0-1.6-1.2-0.8-0.40.0f1 (ppm)
GV_YbMe4Cyterpy 1-2+ 181108Yb(Me4Cy-BTTP)2+Yb(ClO4)3CD3CN, rt18/11/08
-2.7-2.6-2.5-2.4-2.3-2.2-2.1f1 (ppm) -6.2-6.1-6.0-5.9-5.8
f1 (ppm)
Figure S9. Expanded view of the methylene resonances in the 1H NMR spectrum
of a 2:1 5:Yb(ClO4)3 mixture in anhydrous CD3CN.
Electronic Supplementary Information for Dalton TransactionsThis journal is © The Royal Society of Chemistry 2010
9
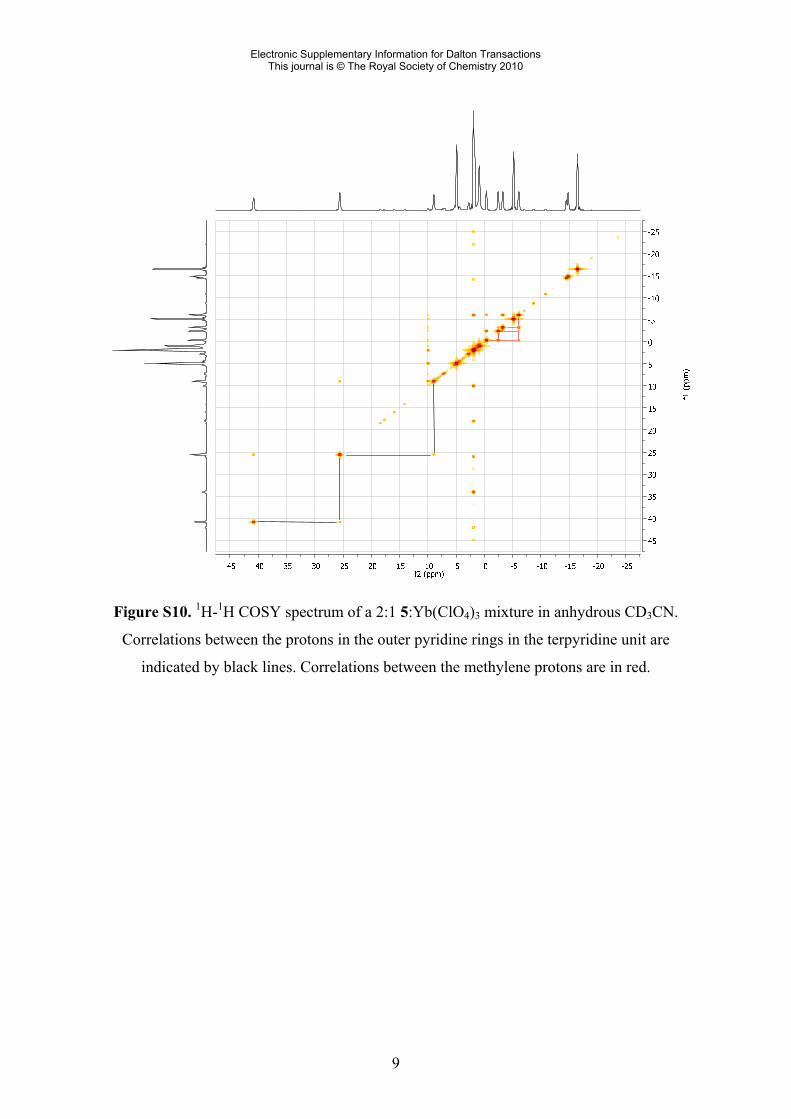
Figure S10. 1H-1H COSY spectrum of a 2:1 5:Yb(ClO4)3 mixture in anhydrous CD3CN.
Correlations between the protons in the outer pyridine rings in the terpyridine unit are
indicated by black lines. Correlations between the methylene protons are in red.
Electronic Supplementary Information for Dalton TransactionsThis journal is © The Royal Society of Chemistry 2010
10
-25-20-15-10-5051015202530354045f2 (ppm)
0
20
40
60
80
100
120
140
160
180
f1 (
ppm
)
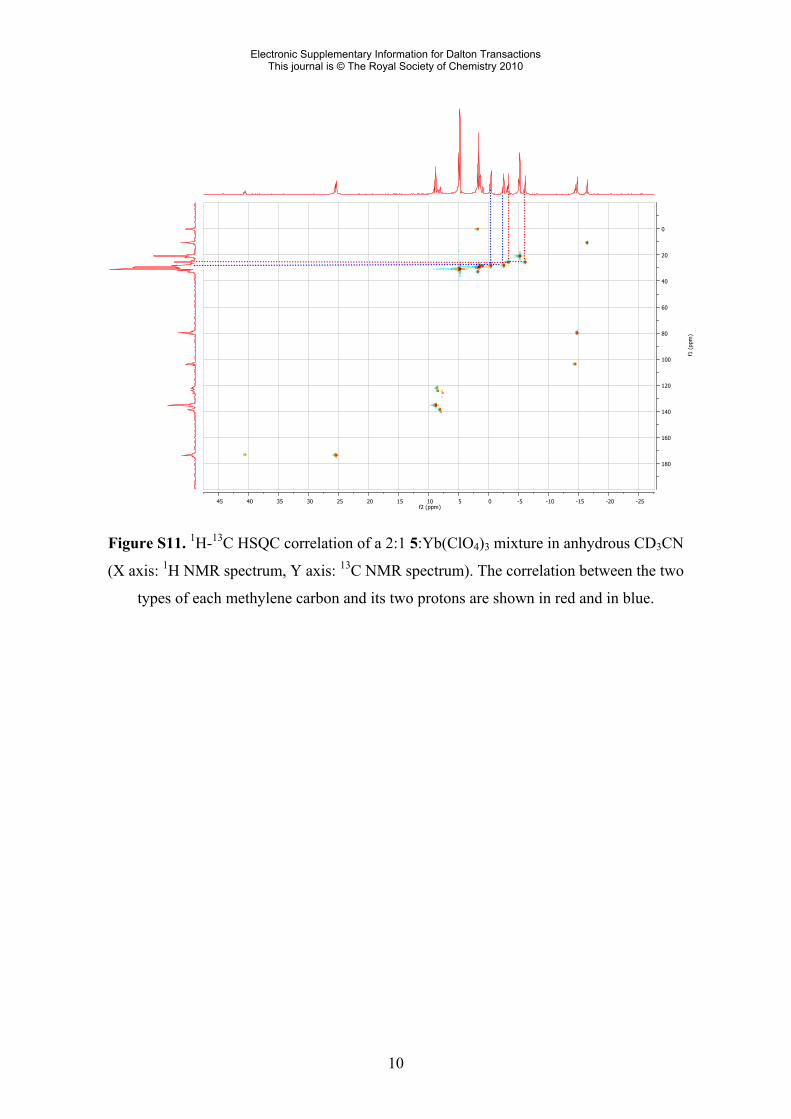
Figure S11. 1H-13C HSQC correlation of a 2:1 5:Yb(ClO4)3 mixture in anhydrous CD3CN
(X axis: 1H NMR spectrum, Y axis: 13C NMR spectrum). The correlation between the two
types of each methylene carbon and its two protons are shown in red and in blue.
Electronic Supplementary Information for Dalton TransactionsThis journal is © The Royal Society of Chemistry 2010
11
Experimental paramagnetic shift, ppm
-12 -10 -8 -6 -4 -2 0 2 4 6 8 10
Cal
cula
ted
para
mag
netic
shi
ft, p
pm
-15
-10
-5
0
5
10
15
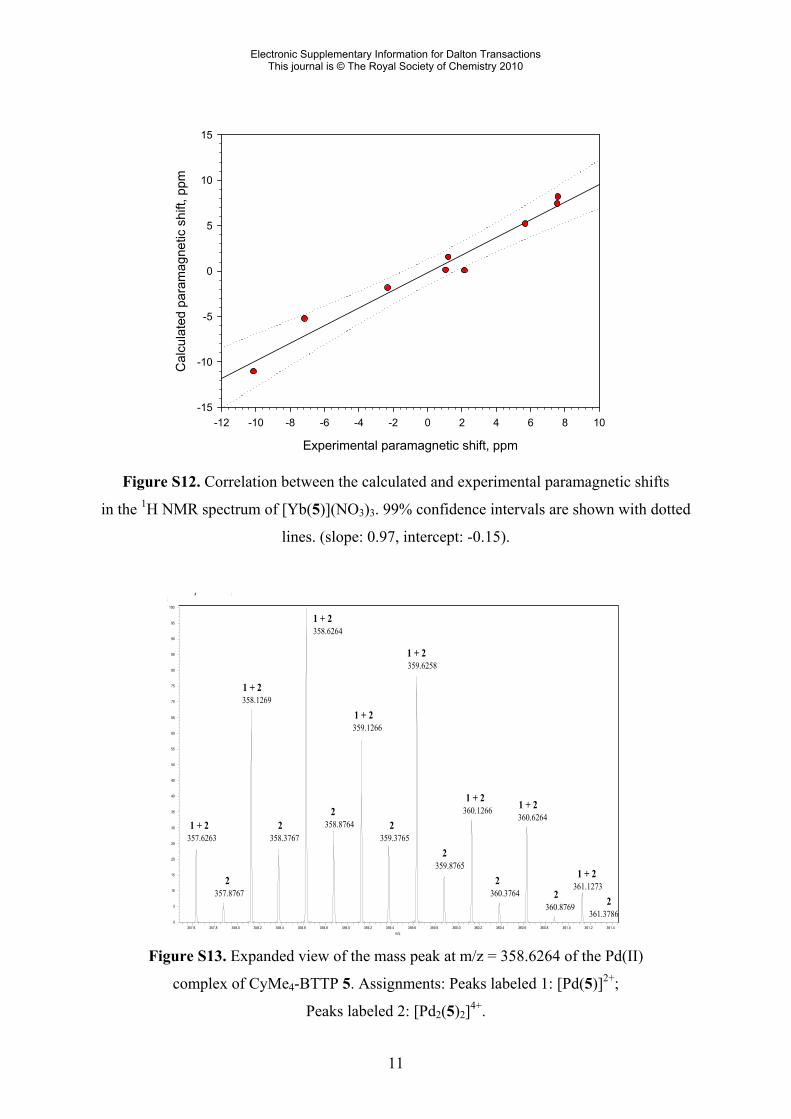
Figure S12. Correlation between the calculated and experimental paramagnetic shifts
in the 1H NMR spectrum of [Yb(5)](NO3)3. 99% confidence intervals are shown with dotted
lines. (slope: 0.97, intercept: -0.15).
# : :
357.6 357.8 358.0 358.2 358.4 358.6 358.8 359.0 359.2 359.4 359.6 359.8 360.0 360.2 360.4 360.6 360.8 361.0 361.2 361.4 m/z
0
5
10
15
20
25
30
35
40
45
50
55
60
65
70
75
80
85
90
95
100
358.6264
359.6258
358.1269
359.1266
360.1266360.6264
358.8764359.3765358.3767 357.6263
359.8765
361.1273 360.3764357.8767
360.8769 361.3786
1 + 2
2
2 2
2
2
22
1 + 2
1 + 2
1 + 2
1 + 2
1 + 2 1 + 2
1 + 2
2
Figure S13. Expanded view of the mass peak at m/z = 358.6264 of the Pd(II)
complex of CyMe4-BTTP 5. Assignments: Peaks labeled 1: [Pd(5)]2+;
Peaks labeled 2: [Pd2(5)2]4+.
Electronic Supplementary Information for Dalton TransactionsThis journal is © The Royal Society of Chemistry 2010
12
356.
6265
02
357.
6257
46
358.
1264
08
358.
6261
0
359.
1272
56
359.
6259
32
360.
1271
91
360.
6266
83
361.
1278
72
361.
6292
44
PdC37H41N9 ,717.25
0
500
1000
1500
2000
Intens.
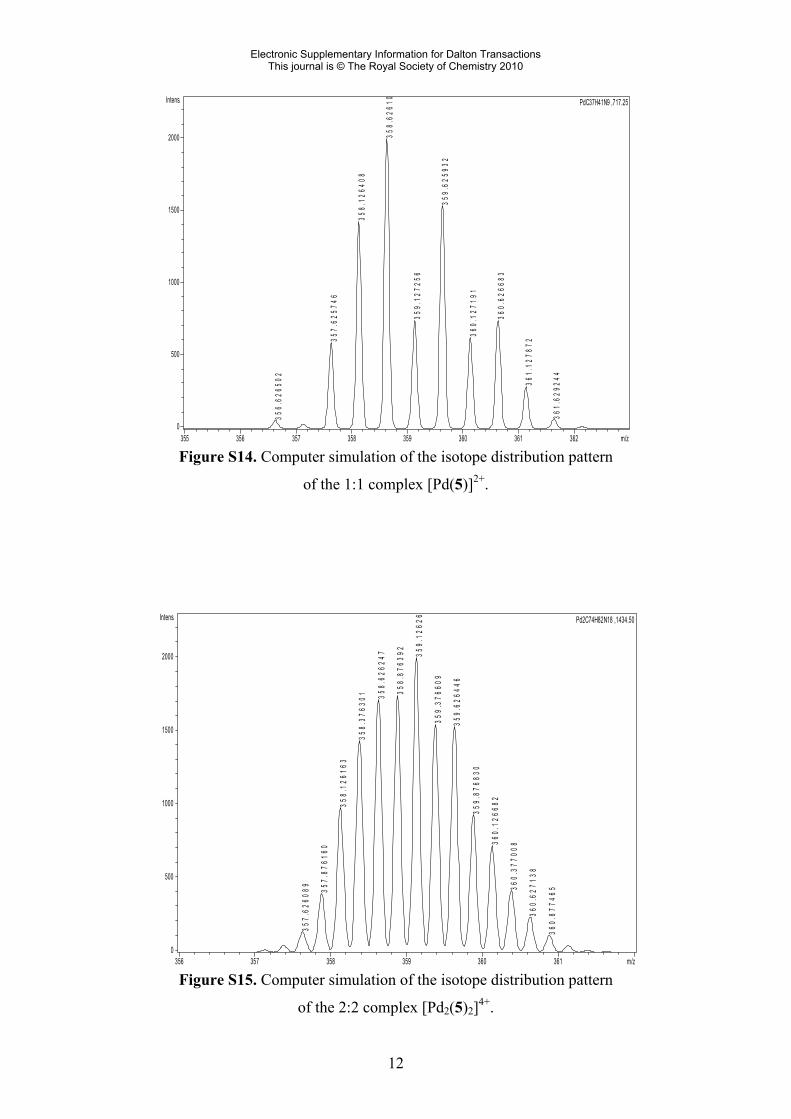
355 356 357 358 359 360 361 362 m/z Figure S14. Computer simulation of the isotope distribution pattern
of the 1:1 complex [Pd(5)]2+.
357.
6260
89 357.
8761
60
358.
1261
63
358.
3763
01 358.
6262
47
358.
8763
92 359.
1262
6
359.
3766
09
359.
6264
46
359.
8768
30
360.
1266
82
360.
3770
08
360.
6271
38
360.
8774
65
Pd2C74H82N18 ,1434.50
0
500
1000
1500
2000
Intens.
356 357 358 359 360 361 m/z Figure S15. Computer simulation of the isotope distribution pattern
of the 2:2 complex [Pd2(5)2]4+.
Electronic Supplementary Information for Dalton TransactionsThis journal is © The Royal Society of Chemistry 2010