Embed Size (px)
Citation preview
Description of Supplementary Files
File Name: Supplementary Information Description: Supplementary Figures, Supplementary Tables and Supplementary References
File Name: Supplementary Data 1 Description: RNAseq data related to Figure 1
File Name: Supplementary Data 2 Description: GO term enrichment data related to Figure 1
File Name: Supplementary Data 3 Description: HU sensitivity suppressor screen data related to Figure 2
File Name: Supplementary Data 4 Description: RNAseq data related to Figure 6
File Name: Supplementary Data 5 Description: Fitness data related to Figure 6.
File Name: Supplementary Software 1 Description: R scripts and Cellprofiler pipelines used for the analysis of the data generated in this manuscript
File Name: Peer Review File
1h 2h 4h
Num
ber
of g
enes
050
010
0015
0020
0025
00
553880
1178493
830
1134
increased abundancedecreased abundance
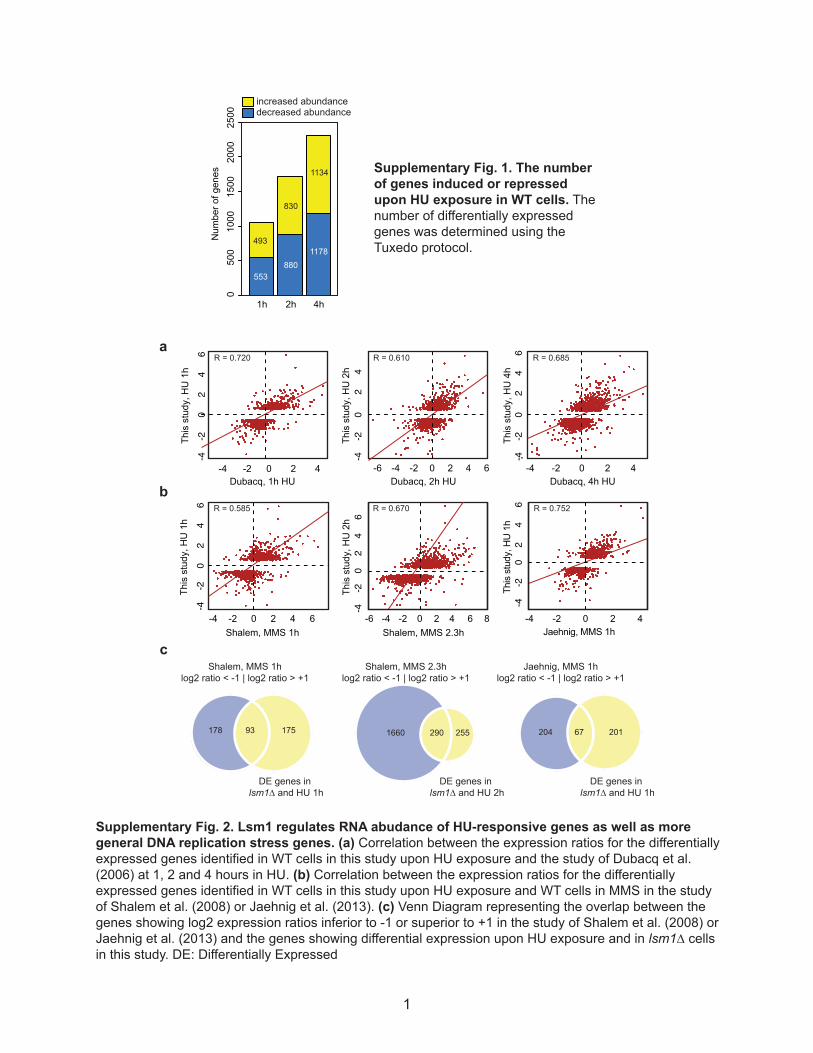
Supplementary Fig. 1. The number of genes induced or repressed upon HU exposure in WT cells. The number of differentially expressed genes was determined using the Tuxedo protocol.
a
-4 -2 0 2 4 6Shalem, MMS 1h
Thi
s st
udy,
HU
1h
Shalem, MMS 2.3h
Thi
s st
udy,
HU
2h
-4 -2 0 2 4Jaehnig, MMS 1h
This
stu
dy, H
U 1
h
-4 -2 0 2 4
-4-2
02
46
Dubacq, 1h HU
Thi
s st
udy,
HU
1h
-6 -4 -2 0 2 4 6Dubacq, 2h HU
Thi
s st
udy,
HU
2h
-4 -2 0 2 4Dubacq, 4h HU
Thi
s st
udy,
HU
4h
-4-2
02
46
-4-2
02
4
-4-2
02
46
-6 -4 -2 0 2 4 6 8
-4-2
02
46
-4-2
02
46
b
R = 0.720 R = 0.610 R = 0.685
R = 0.752R = 0.670R = 0.585
204 67 2011660 290 255178 93 175
Shalem, MMS 1hlog2 ratio < -1 | log2 ratio > +1
DE genes in lsm1∆ and HU 1h
Shalem, MMS 2.3hlog2 ratio < -1 | log2 ratio > +1
Jaehnig, MMS 1hlog2 ratio < -1 | log2 ratio > +1
DE genes in lsm1∆ and HU 2h
DE genes in lsm1∆ and HU 1h
c
Supplementary Fig. 2. Lsm1 regulates RNA abudance of HU-responsive genes as well as more general DNA replication stress genes. (a) Correlation between the expression ratios for the differentially expressed genes identified in WT cells in this study upon HU exposure and the study of Dubacq et al. (2006) at 1, 2 and 4 hours in HU. (b) Correlation between the expression ratios for the differentially expressed genes identified in WT cells in this study upon HU exposure and WT cells in MMS in the study of Shalem et al. (2008) or Jaehnig et al. (2013). (c) Venn Diagram representing the overlap between the genes showing log2 expression ratios inferior to -1 or superior to +1 in the study of Shalem et al. (2008) or Jaehnig et al. (2013) and the genes showing differential expression upon HU exposure and in lsm1∆ cells in this study. DE: Differentially Expressed
1
1C 2C 1C 2C 1C 2C 1C 2C
0h
1h
2h
3h
4h
0h
1h
2h
3h
4h
WT lsm1∆
No Drug HU 200 mM No Drug HU 200 mM
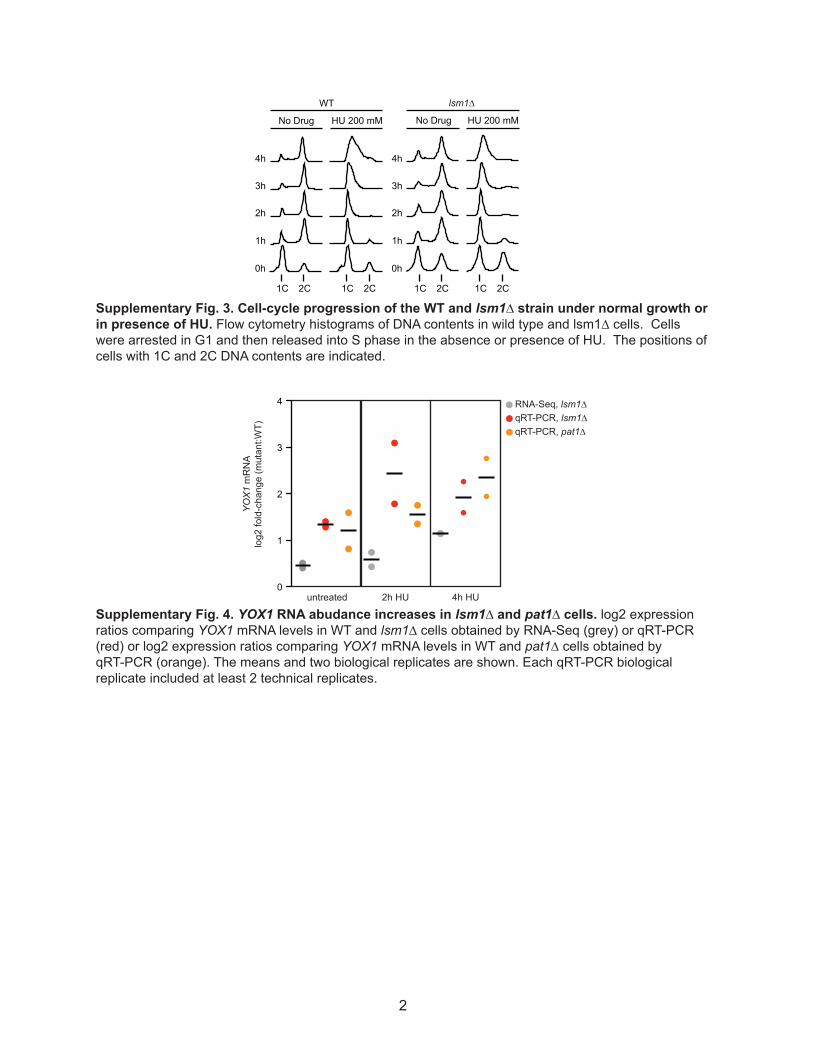
Supplementary Fig. 3. Cell-cycle progression of the WT and lsm1∆ strain under normal growth or in presence of HU. Flow cytometry histograms o NA contents in wild type and lsm1∆ cells. Cells were arrested in G1 and then released into S phase in the absence or presence o HU. The positions o cells with 1C and 2C NA contents are indicated.
0
1
2
3
4
untreated 2h HU 4h HU
RNA-Seq, lsm1∆qRT-PCR, lsm1∆qRT-PCR, pat1∆
YO
X1
mR
NA
log2
fold
-cha
nge
(mut
ant:W
T)
Supplementary Fig. 4. YOX1 RNA abudance increases in lsm1∆ and pat1∆ cells. log2 expression ratios comparing YOX1 mRNA levels in WT and lsm1∆ cells obtained by RNA-Seq (grey) or qRT-PCR (red) or log2 expression ratios comparing YOX1 mRNA levels in WT and pat1∆ cells obtained by qRT-PCR (orange). The means and two biological replicates are shown. Each qRT-PCR biological replicate included at least 2 technical replicates.
2
3
untreated 1h HU-2
-1
0
1 RNA-Seq, lsm1∆qRT-PCR, lsm1∆
ALD
6 m
RN
Alo
g2 fo
ld-c
hang
e (ls
m1∆
:WT)
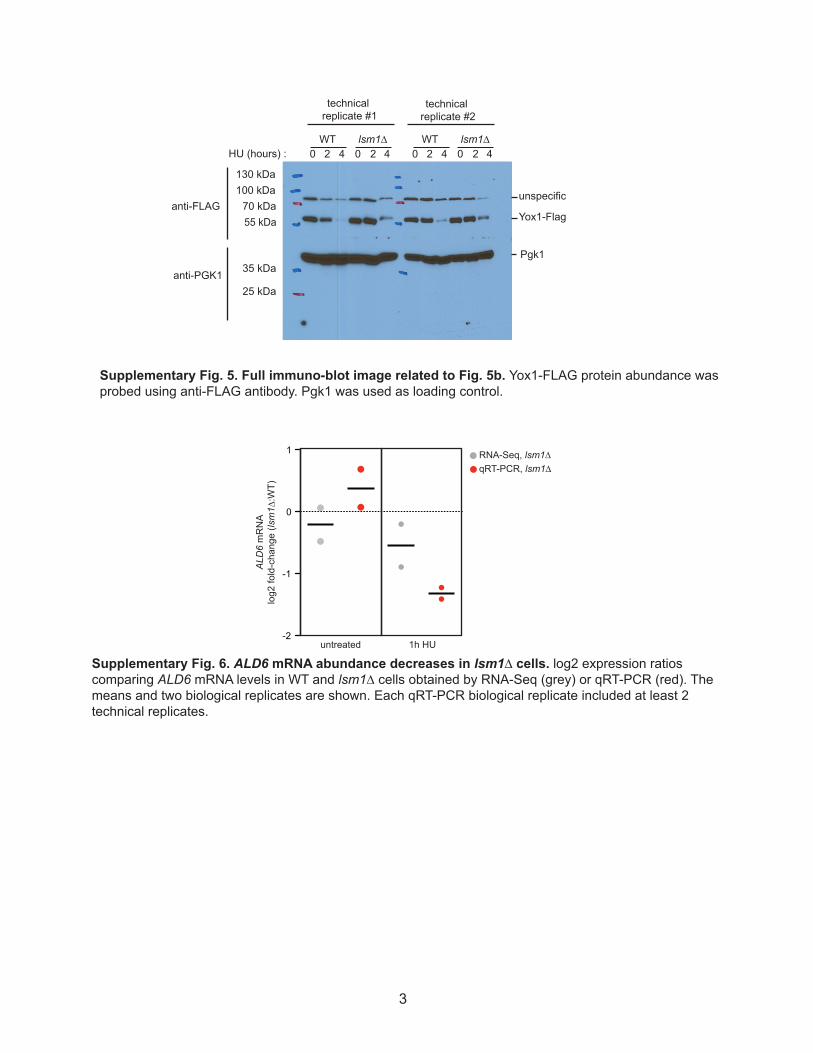
Supplementary Fig. 6. ALD6 mRNA abundance decreases in lsm1∆ cells. log2 expression ratios comparing ALD6 mRNA levels in WT and lsm1∆ cells obtained by RNA-Seq (grey) or qRT-PCR (red). The means and two biological replicates are shown. Each qRT-PCR biological replicate included at least 2 technical replicates.
130 kDa100 kDa
70 kDa55 kDa
35 kDa
25 kDa
anti-FLAG
anti-PGK1
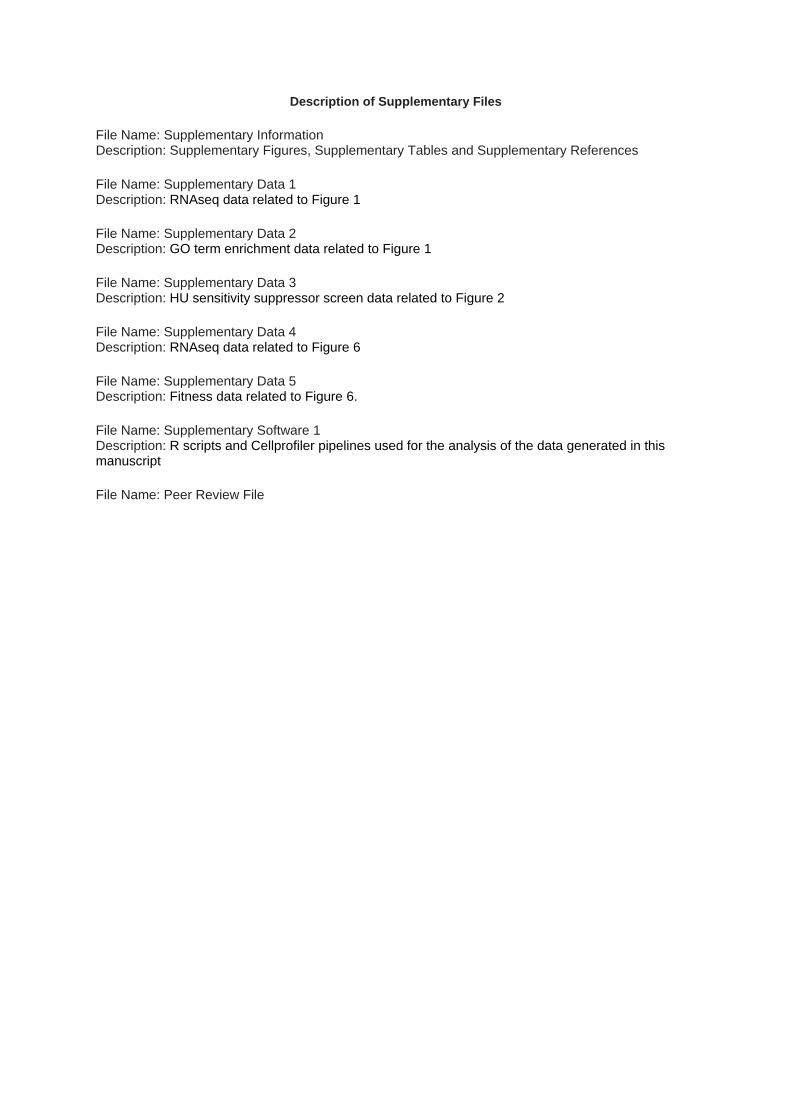
Supplementary Fig. 5. Full immuno-blot image related to Fig. 5b. Yox1-FLAG protein abundance was probed using anti-FLAG antibody. Pgk1 was used as loading control.
Yox1-Flag
Pgk1
lsm1∆WTHU (hours) : 0 2 4 0 2 4
lsm1∆WT0 2 4 0 2 4
unspecific
technical replicate #1
technical replicate #2
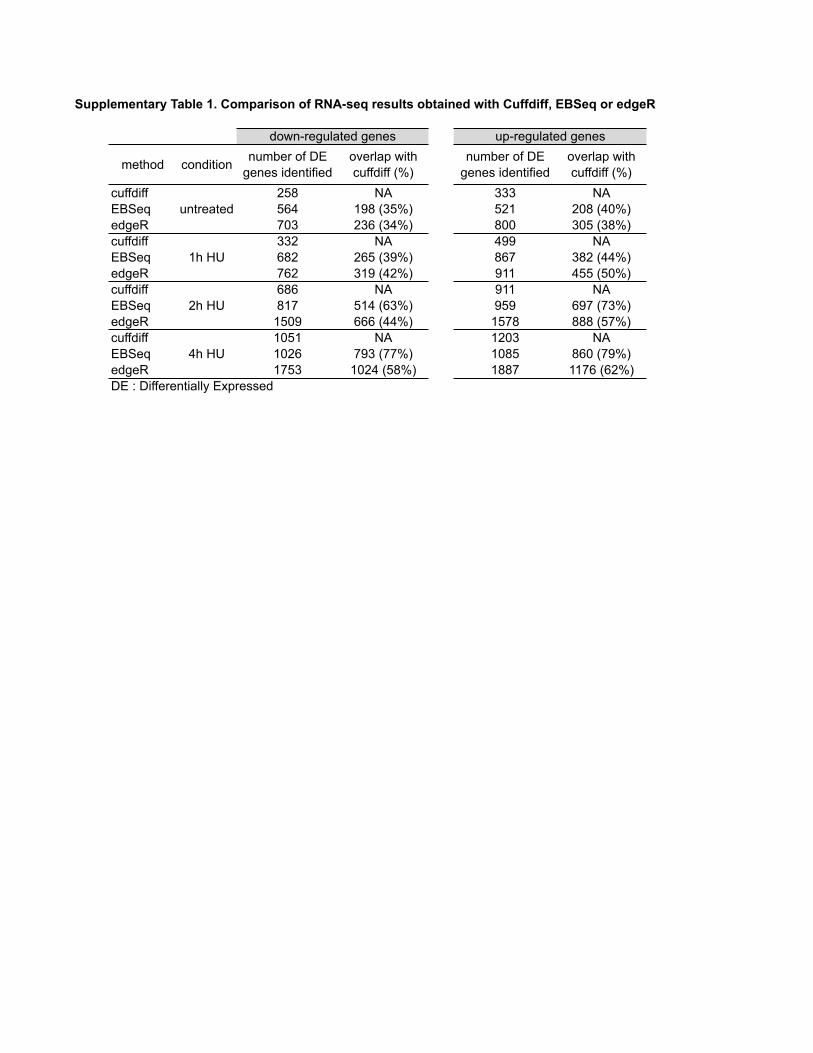
Supplementary Table 1. Comparison of RNA-seq results obtained with Cuffdiff, EBSeq or edgeR
cuffdiff 258 NA 333 NAEBSeq 564 198 (35%) 521 208 (40%)edgeR 703 236 (34%) 800 305 (38%)cuffdiff 332 NA 499 NAEBSeq 682 265 (39%) 867 382 (44%)edgeR 762 319 (42%) 911 455 (50%)cuffdiff 686 NA 911 NAEBSeq 817 514 (63%) 959 697 (73%)edgeR 1509 666 (44%) 1578 888 (57%)cuffdiff 1051 NA 1203 NAEBSeq 1026 793 (77%) 1085 860 (79%)edgeR 1753 1024 (58%) 1887 1176 (62%)DE : Differentially Expressed
2h HU
4h HU
number of DE genes identified
number of DE genes identified
overlap with cuffdiff (%)
untreated
conditionmethod
1h HU
down-regulated genesoverlap with cuffdiff (%)
up-regulated genes
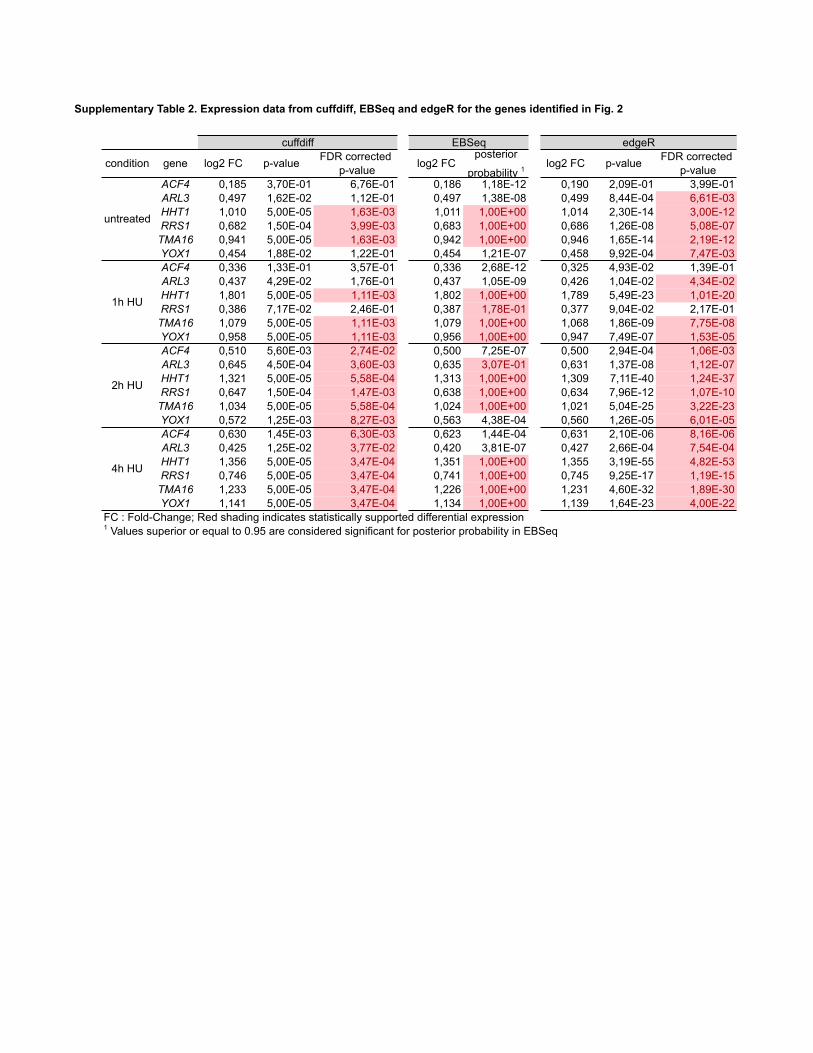
Supplementary Table 2. Expression data from cuffdiff, EBSeq and edgeR for the genes identified in Fig. 2
ACF4 0,185 3,70E-01 6,76E-01 0,186 1,18E-12 0,190 2,09E-01 3,99E-01ARL3 0,497 1,62E-02 1,12E-01 0,497 1,38E-08 0,499 8,44E-04 6,61E-03HHT1 1,010 5,00E-05 1,63E-03 1,011 1,00E+00 1,014 2,30E-14 3,00E-12RRS1 0,682 1,50E-04 3,99E-03 0,683 1,00E+00 0,686 1,26E-08 5,08E-07TMA16 0,941 5,00E-05 1,63E-03 0,942 1,00E+00 0,946 1,65E-14 2,19E-12YOX1 0,454 1,88E-02 1,22E-01 0,454 1,21E-07 0,458 9,92E-04 7,47E-03ACF4 0,336 1,33E-01 3,57E-01 0,336 2,68E-12 0,325 4,93E-02 1,39E-01ARL3 0,437 4,29E-02 1,76E-01 0,437 1,05E-09 0,426 1,04E-02 4,34E-02HHT1 1,801 5,00E-05 1,11E-03 1,802 1,00E+00 1,789 5,49E-23 1,01E-20RRS1 0,386 7,17E-02 2,46E-01 0,387 1,78E-01 0,377 9,04E-02 2,17E-01TMA16 1,079 5,00E-05 1,11E-03 1,079 1,00E+00 1,068 1,86E-09 7,75E-08YOX1 0,958 5,00E-05 1,11E-03 0,956 1,00E+00 0,947 7,49E-07 1,53E-05ACF4 0,510 5,60E-03 2,74E-02 0,500 7,25E-07 0,500 2,94E-04 1,06E-03ARL3 0,645 4,50E-04 3,60E-03 0,635 3,07E-01 0,631 1,37E-08 1,12E-07HHT1 1,321 5,00E-05 5,58E-04 1,313 1,00E+00 1,309 7,11E-40 1,24E-37RRS1 0,647 1,50E-04 1,47E-03 0,638 1,00E+00 0,634 7,96E-12 1,07E-10TMA16 1,034 5,00E-05 5,58E-04 1,024 1,00E+00 1,021 5,04E-25 3,22E-23YOX1 0,572 1,25E-03 8,27E-03 0,563 4,38E-04 0,560 1,26E-05 6,01E-05ACF4 0,630 1,45E-03 6,30E-03 0,623 1,44E-04 0,631 2,10E-06 8,16E-06ARL3 0,425 1,25E-02 3,77E-02 0,420 3,81E-07 0,427 2,66E-04 7,54E-04HHT1 1,356 5,00E-05 3,47E-04 1,351 1,00E+00 1,355 3,19E-55 4,82E-53RRS1 0,746 5,00E-05 3,47E-04 0,741 1,00E+00 0,745 9,25E-17 1,19E-15TMA16 1,233 5,00E-05 3,47E-04 1,226 1,00E+00 1,231 4,60E-32 1,89E-30YOX1 1,141 5,00E-05 3,47E-04 1,134 1,00E+00 1,139 1,64E-23 4,00E-22
FC : Fold-Change; Red shading indicates statistically supported differential expression1 Values superior or equal to 0.95 are considered significant for posterior probability in EBSeq
2h HU
gene
4h HU
cuffdiff
log2 FClog2 FC FDR corrected p-valuep-value
untreated
1h HU
posterior
probability 1
EBSeq
condition
edgeR
log2 FC p-value FDR corrected p-value
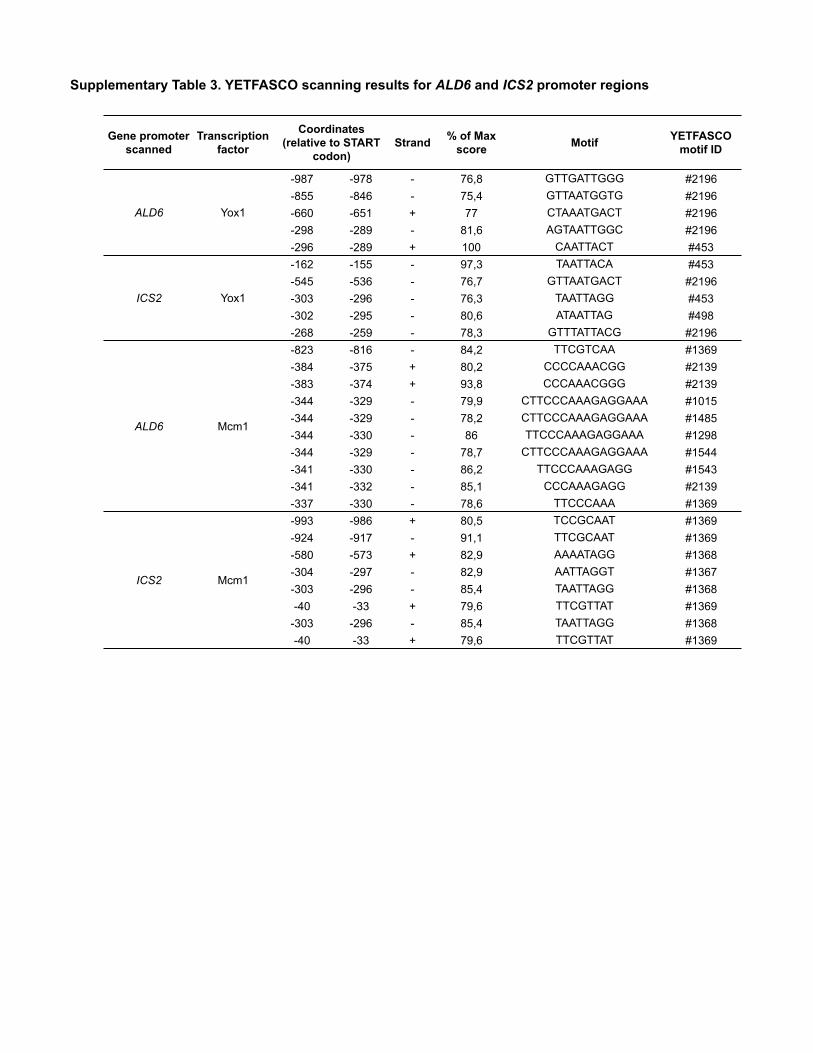
Supplementary Table 3. YETFASCO scanning results for ALD6 and ICS2 promoter regions
Gene promoter scanned
Transcription factor Strand % of Max
score Motif YETFASCO motif ID
-987 -978 - 76,8 GTTGATTGGG #2196-855 -846 - 75,4 GTTAATGGTG #2196-660 -651 + 77 CTAAATGACT #2196-298 -289 - 81,6 AGTAATTGGC #2196-296 -289 + 100 CAATTACT #453-162 -155 - 97,3 TAATTACA #453-545 -536 - 76,7 GTTAATGACT #2196-303 -296 - 76,3 TAATTAGG #453-302 -295 - 80,6 ATAATTAG #498-268 -259 - 78,3 GTTTATTACG #2196-823 -816 - 84,2 TTCGTCAA #1369-384 -375 + 80,2 CCCCAAACGG #2139-383 -374 + 93,8 CCCAAACGGG #2139-344 -329 - 79,9 CTTCCCAAAGAGGAAA #1015-344 -329 - 78,2 CTTCCCAAAGAGGAAA #1485-344 -330 - 86 TTCCCAAAGAGGAAA #1298-344 -329 - 78,7 CTTCCCAAAGAGGAAA #1544-341 -330 - 86,2 TTCCCAAAGAGG #1543-341 -332 - 85,1 CCCAAAGAGG #2139-337 -330 - 78,6 TTCCCAAA #1369-993 -986 + 80,5 TCCGCAAT #1369-924 -917 - 91,1 TTCGCAAT #1369-580 -573 + 82,9 AAAATAGG #1368-304 -297 - 82,9 AATTAGGT #1367-303 -296 - 85,4 TAATTAGG #1368-40 -33 + 79,6 TTCGTTAT #1369-303 -296 - 85,4 TAATTAGG #1368-40 -33 + 79,6 TTCGTTAT #1369
ALD6
ICS2
ALD6
ICS2
Coordinates(relative to START
codon)
Yox1
Yox1
Mcm1
Mcm1
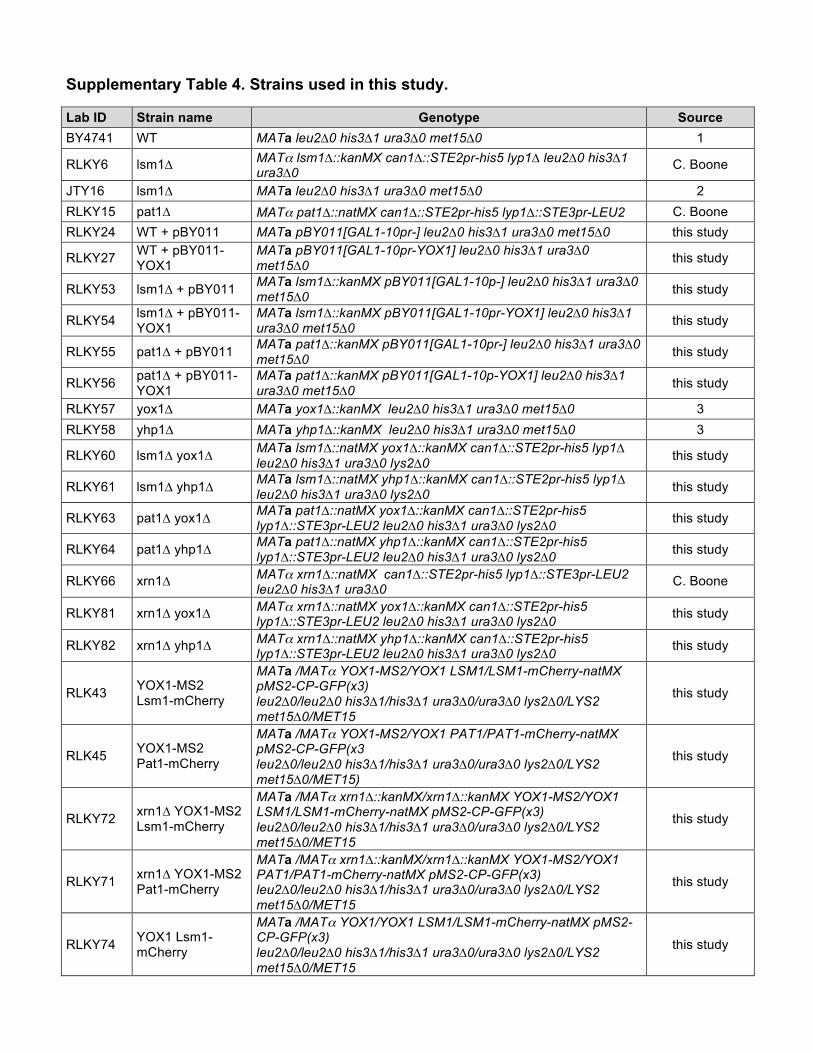
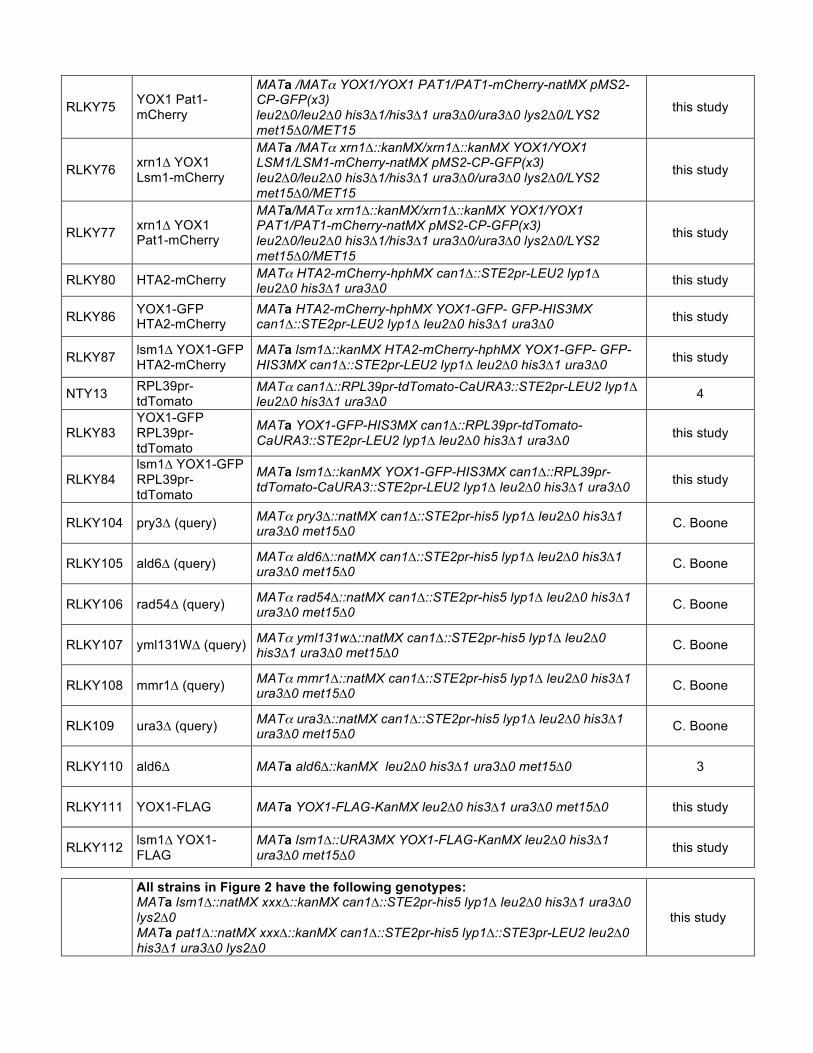
Supplementary Table 4. Strains used in this study.
Lab ID Strain name Genotype Source BY4741 WT MATa leu2∆0 his3∆1 ura3∆0 met15∆0 1
RLKY6 lsm1∆ MATα lsm1∆::kanMX can1∆::STE2pr-his5 lyp1∆ leu2∆0 his3∆1 ura3∆0 C. Boone
JTY16 lsm1∆ MATa leu2∆0 his3∆1 ura3∆0 met15∆0 2 RLKY15 pat1∆ MATα pat1∆::natMX can1∆::STE2pr-his5 lyp1∆::STE3pr-LEU2 C. Boone RLKY24 WT + pBY011 MATa pBY011[GAL1-10pr-] leu2∆0 his3∆1 ura3∆0 met15∆0 this study
RLKY27 WT + pBY011-YOX1
MATa pBY011[GAL1-10pr-YOX1] leu2∆0 his3∆1 ura3∆0 met15∆0 this study
RLKY53 lsm1∆ + pBY011 MATa lsm1∆::kanMX pBY011[GAL1-10p-] leu2∆0 his3∆1 ura3∆0 met15∆0 this study
RLKY54 lsm1∆ + pBY011-YOX1
MATa lsm1∆::kanMX pBY011[GAL1-10pr-YOX1] leu2∆0 his3∆1 ura3∆0 met15∆0 this study
RLKY55 pat1∆ + pBY011 MATa pat1∆::kanMX pBY011[GAL1-10pr-] leu2∆0 his3∆1 ura3∆0 met15∆0 this study
RLKY56 pat1∆ + pBY011-YOX1
MATa pat1∆::kanMX pBY011[GAL1-10p-YOX1] leu2∆0 his3∆1 ura3∆0 met15∆0 this study
RLKY57 yox1∆ MATa yox1∆::kanMX leu2∆0 his3∆1 ura3∆0 met15∆0 3 RLKY58 yhp1∆ MATa yhp1∆::kanMX leu2∆0 his3∆1 ura3∆0 met15∆0 3
RLKY60 lsm1∆ yox1∆ MATa lsm1∆::natMX yox1∆::kanMX can1∆::STE2pr-his5 lyp1∆ leu2∆0 his3∆1 ura3∆0 lys2∆0 this study
RLKY61 lsm1∆ yhp1∆ MATa lsm1∆::natMX yhp1∆::kanMX can1∆::STE2pr-his5 lyp1∆ leu2∆0 his3∆1 ura3∆0 lys2∆0 this study
RLKY63 pat1∆ yox1∆ MATa pat1∆::natMX yox1∆::kanMX can1∆::STE2pr-his5 lyp1∆::STE3pr-LEU2 leu2∆0 his3∆1 ura3∆0 lys2∆0 this study
RLKY64 pat1∆ yhp1∆ MATa pat1∆::natMX yhp1∆::kanMX can1∆::STE2pr-his5 lyp1∆::STE3pr-LEU2 leu2∆0 his3∆1 ura3∆0 lys2∆0 this study
RLKY66 xrn1∆ MATα xrn1∆::natMX can1∆::STE2pr-his5 lyp1∆::STE3pr-LEU2 leu2∆0 his3∆1 ura3∆0 C. Boone
RLKY81 xrn1∆ yox1∆ MATα xrn1∆::natMX yox1∆::kanMX can1∆::STE2pr-his5 lyp1∆::STE3pr-LEU2 leu2∆0 his3∆1 ura3∆0 lys2∆0 this study
RLKY82 xrn1∆ yhp1∆ MATα xrn1∆::natMX yhp1∆::kanMX can1∆::STE2pr-his5 lyp1∆::STE3pr-LEU2 leu2∆0 his3∆1 ura3∆0 lys2∆0 this study
RLK43 YOX1-MS2 Lsm1-mCherry
MATa /MATα YOX1-MS2/YOX1 LSM1/LSM1-mCherry-natMX pMS2-CP-GFP(x3) leu2∆0/leu2∆0 his3∆1/his3∆1 ura3∆0/ura3∆0 lys2∆0/LYS2 met15∆0/MET15
this study
RLK45 YOX1-MS2 Pat1-mCherry
MATa /MATα YOX1-MS2/YOX1 PAT1/PAT1-mCherry-natMX pMS2-CP-GFP(x3 leu2∆0/leu2∆0 his3∆1/his3∆1 ura3∆0/ura3∆0 lys2∆0/LYS2 met15∆0/MET15)
this study
RLKY72 xrn1∆ YOX1-MS2 Lsm1-mCherry
MATa /MATα xrn1∆::kanMX/xrn1∆::kanMX YOX1-MS2/YOX1 LSM1/LSM1-mCherry-natMX pMS2-CP-GFP(x3) leu2∆0/leu2∆0 his3∆1/his3∆1 ura3∆0/ura3∆0 lys2∆0/LYS2 met15∆0/MET15
this study
RLKY71 xrn1∆ YOX1-MS2 Pat1-mCherry
MATa /MATα xrn1∆::kanMX/xrn1∆::kanMX YOX1-MS2/YOX1 PAT1/PAT1-mCherry-natMX pMS2-CP-GFP(x3) leu2∆0/leu2∆0 his3∆1/his3∆1 ura3∆0/ura3∆0 lys2∆0/LYS2 met15∆0/MET15
this study
RLKY74 YOX1 Lsm1-mCherry
MATa /MATα YOX1/YOX1 LSM1/LSM1-mCherry-natMX pMS2-CP-GFP(x3) leu2∆0/leu2∆0 his3∆1/his3∆1 ura3∆0/ura3∆0 lys2∆0/LYS2 met15∆0/MET15
this study
RLKY75 YOX1 Pat1-mCherry
MATa /MATα YOX1/YOX1 PAT1/PAT1-mCherry-natMX pMS2-CP-GFP(x3) leu2∆0/leu2∆0 his3∆1/his3∆1 ura3∆0/ura3∆0 lys2∆0/LYS2 met15∆0/MET15
this study
RLKY76 xrn1∆ YOX1 Lsm1-mCherry
MATa /MATα xrn1∆::kanMX/xrn1∆::kanMX YOX1/YOX1 LSM1/LSM1-mCherry-natMX pMS2-CP-GFP(x3) leu2∆0/leu2∆0 his3∆1/his3∆1 ura3∆0/ura3∆0 lys2∆0/LYS2 met15∆0/MET15
this study
RLKY77 xrn1∆ YOX1 Pat1-mCherry
MATa/MATα xrn1∆::kanMX/xrn1∆::kanMX YOX1/YOX1 PAT1/PAT1-mCherry-natMX pMS2-CP-GFP(x3) leu2∆0/leu2∆0 his3∆1/his3∆1 ura3∆0/ura3∆0 lys2∆0/LYS2 met15∆0/MET15
this study
RLKY80 HTA2-mCherry MATα HTA2-mCherry-hphMX can1∆::STE2pr-LEU2 lyp1∆ leu2∆0 his3∆1 ura3∆0 this study
RLKY86 YOX1-GFP HTA2-mCherry
MATa HTA2-mCherry-hphMX YOX1-GFP- GFP-HIS3MX can1∆::STE2pr-LEU2 lyp1∆ leu2∆0 his3∆1 ura3∆0 this study
RLKY87 lsm1∆ YOX1-GFP HTA2-mCherry
MATa lsm1∆::kanMX HTA2-mCherry-hphMX YOX1-GFP- GFP-HIS3MX can1∆::STE2pr-LEU2 lyp1∆ leu2∆0 his3∆1 ura3∆0 this study
NTY13 RPL39pr-tdTomato
MATα can1∆::RPL39pr-tdTomato-CaURA3::STE2pr-LEU2 lyp1∆ leu2∆0 his3∆1 ura3∆0 4
RLKY83 YOX1-GFP RPL39pr-tdTomato
MATa YOX1-GFP-HIS3MX can1∆::RPL39pr-tdTomato-CaURA3::STE2pr-LEU2 lyp1∆ leu2∆0 his3∆1 ura3∆0 this study
RLKY84 lsm1∆ YOX1-GFP RPL39pr-tdTomato
MATa lsm1∆::kanMX YOX1-GFP-HIS3MX can1∆::RPL39pr-tdTomato-CaURA3::STE2pr-LEU2 lyp1∆ leu2∆0 his3∆1 ura3∆0 this study
RLKY104 pry3∆ (query) MATα pry3∆::natMX can1∆::STE2pr-his5 lyp1∆ leu2∆0 his3∆1 ura3∆0 met15∆0 C. Boone
RLKY105 ald6∆ (query) MATα ald6∆::natMX can1∆::STE2pr-his5 lyp1∆ leu2∆0 his3∆1 ura3∆0 met15∆0 C. Boone
RLKY106 rad54∆ (query) MATα rad54∆::natMX can1∆::STE2pr-his5 lyp1∆ leu2∆0 his3∆1 ura3∆0 met15∆0 C. Boone
RLKY107 yml131W∆ (query) MATα yml131w∆::natMX can1∆::STE2pr-his5 lyp1∆ leu2∆0 his3∆1 ura3∆0 met15∆0 C. Boone
RLKY108 mmr1∆ (query) MATα mmr1∆::natMX can1∆::STE2pr-his5 lyp1∆ leu2∆0 his3∆1 ura3∆0 met15∆0 C. Boone
RLK109 ura3∆ (query) MATα ura3∆::natMX can1∆::STE2pr-his5 lyp1∆ leu2∆0 his3∆1 ura3∆0 met15∆0 C. Boone
RLKY110 ald6∆ MATa ald6∆::kanMX leu2∆0 his3∆1 ura3∆0 met15∆0 3
RLKY111 YOX1-FLAG MATa YOX1-FLAG-KanMX leu2∆0 his3∆1 ura3∆0 met15∆0 this study
RLKY112 lsm1∆ YOX1-FLAG
MATa lsm1∆::URA3MX YOX1-FLAG-KanMX leu2∆0 his3∆1 ura3∆0 met15∆0 this study
All strains in Figure 2 have the following genotypes: MATa lsm1∆::natMX xxx∆::kanMX can1∆::STE2pr-his5 lyp1∆ leu2∆0 his3∆1 ura3∆0 lys2∆0�MATa pat1∆::natMX xxx∆::kanMX can1∆::STE2pr-his5 lyp1∆::STE3pr-LEU2 leu2∆0 his3∆1 ura3∆0 lys2∆0
this study

All strains in Figure 6 have the following genotypes: MATa xxx∆::kanMX yyy∆::natMX leu2∆0 his3∆1 ura3∆0 lyp1∆0 can1∆0::STE2pr-SpHIS5
this study
All strains in Figure 7a-b have the following genotypes: MATa lsm1∆::kanMX leu2∆0 his3∆1 ura3∆0 met15∆0 pBY011[GAL1-10pr-] �MATa lsm1∆::kanMX leu2∆0 his3∆1 ura3∆0 met15∆0 pBY011[GAL1-10pr-XXX]
this study
All strains in Figure 7f-g have the following genotypes: MATa xxx∆::NatMX RNR3-GFP-HIS3MX can1pr::RPL39pr-tdTomato-CaURA3 can1∆::STE2pr-LEU2 leu2∆0 his3∆1 ura3∆0 met15∆0 lyp1∆0
this study
References
1. Brachmann, C. B. et al. Designer deletion strains derived from Saccharomyces cerevisiae
S288C: a useful set of strains and plasmids for PCR-mediated gene disruption and other applications. Yeast 14, 115–32 (1998).
2. Tkach, J. M. et al. Dissecting DNA damage response pathways by analysing protein localization and abundance changes during DNA replication stress. Nat. Cell Biol. 14, 966–76 (2012).
3. Giaever, G. et al. Functional profiling of the Saccharomyces cerevisiae genome. Nature 418, 387–391 (2002).
4. Hendry, J. A., Tan, G., Ou, J., Boone, C. & Brown, G. W. Leveraging DNA damage response signaling to identify yeast genes controlling genome stability. G3 (Bethesda). 5, 997–1006 (2015).