Embed Size (px)
Citation preview

S1
Electronic Supplementary Information
Hydrogen evolution catalyzed by MoS3 and MoS2 particles
Heron Vrubel, Daniel Merki and Xile Hu*
Laboratory of Inorganic Synthesis and Catalysis, Institute of Chemical Sciences and
Engineering, Ecole Polytechnique Fédérale de Lausanne (EPFL), SB-ISIC-LSCI, BCH 3305,
Lausanne, CH 1015, Switzerland
* To whom correspondence should be addressed. E-mail: [email protected]
Electronic Supplementary Material (ESI) for Energy & Environmental ScienceThis journal is © The Royal Society of Chemistry 2012

S2
Ohmic drop correction:
The ohmic drop correction of polarization curves has been performed according to the method
given in the literature [1-3]. The overpotential η (V) observed during an experiment is given by
equation (1):
η = a + bln j + jR (1)
where a (V) is the Tafel constant, b (V dec-1) is the Tafel slope, j (A cm-2) is the current density
and R (Ω cm2) is the total area-specific uncompensated resistance of the system, which is
assumed to be constant. The derivative of Eq. (1) with respect to current density gives Eq. (2)
from which b and R can be easily obtained by plotting dη/dj as a function of 1/j.
dηdj
=bj+ R (2)
The estimation of R allows correcting the experimental overpotential by subtracting the ohmic
drop jR according to equation (3):
ηcorr = η − jR (3)
During the calculations, the derivative dη/dj was replaced by their finite elements Δη/Δj
estimated from each pair of consecutive experimental points.
Reference
[1] D.M. Schub, M.F. Reznik, Elektrokhimiya, 21 (1985) 937
[2] N. Krstajic, S. Trasatti, Journal of Applied Electrochemistry. 28 (1998) 1291
[3] L.A. De Faria, J.F.C. Boodts, S. Trasatti, Journal of Applied Electrochemistry, 26 (1996)
1195
Electronic Supplementary Material (ESI) for Energy & Environmental ScienceThis journal is © The Royal Society of Chemistry 2012

S3
1080 960 840 720 600 480 360 240 120 0
Binding energy (eV)
O KLL
O 1s
Mo 3p
C 1s
Mo 3d
S 2p
1080 960 840 720 600 480 360 240 120 0
S 2p
Mo 3d
C 1s
Mo 3p
O 1s
Sn 3d
Sn 3p
Binding energy (eV)
O KLL
Fig. S1. XPS survey spectra of the MoS3 particles before (top) and after (bottom) polarization.
Electronic Supplementary Material (ESI) for Energy & Environmental ScienceThis journal is © The Royal Society of Chemistry 2012

S4
-0.3 -0.2 -0.1 0.0-12
-10
-8
-6
-4
-2
0
Cur
rent
den
sity
(mA/
cm2 )
Potential (V vs. RHE)
53 μg/cm2, scan 1 53 μg/cm2, scan 2 53 μg/cm2, scan 3 53 μg/cm2, scan 4 53 μg/cm2, scan 5 53 μg/cm2, scan 6
Fig. S2. Consecutive polarization curves of a freshly prepared MoS3-modified FTO electrode
(drop casting) recorded at pH = 0 (1.0 M H2SO4); scan rate: 5 mV/s.
Table S1. HER activity of drop-casted MoS3-modified FTO electrodes according to polarization measurements.
Loading (μg/cm2) log j0 (log[mA/cm2]) Tafel Slope
(mV/decade) jη=150
(mA/cm2) jη=200
(mA/cm2) 13 -4.0 60a -0.019 -0.14 27 -4.0 52b -0.056 -0.49 40 -3.7 53c -0.13 -0.79 53 -3.4 56d -0.18 -1.1 75 -2.9 61e -0.22 -1.0
a Determined at η = 140 – 196 mV; b Determined at η = 140 – 190 mV; c Determined at η = 119
– 158 mV; d Determined at η = 119 – 166 mV; e Determined at η = 112 - 158 mV.
Electronic Supplementary Material (ESI) for Energy & Environmental ScienceThis journal is © The Royal Society of Chemistry 2012

S5
Table S2. HER activity of spray-casted MoS3-modified FTO electrodes according to polarization measurements.
Loading (μg/cm2) log j0 (log[mA/cm2]) Tafel Slope
(mV/decade) jη=150
(mA/cm2) jη=200
(mA/cm2) 18 -4.8 45a 0.040 0.47 100 -4.4 38b 0.40 2.8 200 -3.8 40c 0.73 3.6 300 -3.3 44d 1.02 3.9 400 -3.2 45e 1.03 3.9
a Determined at η = 146 - 186 mV; b Determined at η = 109 - 145 mV; c Determined at η = 110 -
134 mV; d Determined at η = 98 - 125 mV; e Determined at η = 97 - 124 mV.
Electronic Supplementary Material (ESI) for Energy & Environmental ScienceThis journal is © The Royal Society of Chemistry 2012

S6
-0.3 -0.2 -0.1 0.0 0.1 0.2
-18
-16
-14
-12
-10
-8
-6
-4
-2
0
2
Cur
rent
den
sity
(mA
/cm
2 )
Potential (V vs. RHE)
a: 8 μg/cm2
b: 16 μg/cm2
c: 32 μg/cm2
d: 64 μg/cm2
e: 128 μg/cm2
baed
c
10 100-2.5
-2.0
-1.5
-1.0
-0.5
0.0
curr
ent d
ensi
ty (m
A/c
m2 )
loading (μg/cm2)
a: 150 mV overpotentialb: 200 mV overpotential
a
b
Fig. S3 (Top) Polarization curves of spray-casted MoS3-modified glassy carbon electrodes
recorded at pH = 0 (1.0 M H2SO4); scan rate: 5 mV/s. (Bottom) Loading-dependence of current
densities.
Electronic Supplementary Material (ESI) for Energy & Environmental ScienceThis journal is © The Royal Society of Chemistry 2012

S7
Table S3. HER activity of spray-casted MoS3-modified glassy carbon electrodes according to polarization measurements.
Loading (μg/cm2) log j0 (log[mA/cm2]) Tafel Slope
(mV/decade) jη=150
(mA/cm2) jη=200
(mA/cm2) 26 -4.6 43a 0.083 0.95 77 -4.4 40b 0.26 2.5 129 -4.2 39c 0.48 4.4 180 -4.1 39d 0.49 4.1 231 -3.9 41e 0.58 3.5
a Determined at η = 139 - 175 mV; b Determined at η = 125 - 159 mV; c Determined at η = 112 -
153 mV; d Determined at η = 113 -151 mV; e Determined at η = 107 - 144 mV.
-0.3 -0.2 -0.1 0.0 0.1 0.2-40
-35
-30
-25
-20
-15
-10
-5
0
5
Cur
rent
den
sity
(mA
/cm
2 )
Potential (V vs. RHE)
MoS3, no MWCNT MoS3 : MWCNT = 1 : 1 MoS3 : MWCNT = 1 : 2
Fig. S4 Polarization curves of spray-casted MoS3-modified glassy carbon electrodes, with
MWCNT as additive, recorded at pH = 0 (1.0 M H2SO4); scan rate: 5 mV/s. The loading of
MoS3 is always 130 μg/cm2.
Electronic Supplementary Material (ESI) for Energy & Environmental ScienceThis journal is © The Royal Society of Chemistry 2012

S8
Fig. S5 The home-made working electrode filled with conductive graphite powder.
Electronic Supplementary Material (ESI) for Energy & Environmental ScienceThis journal is © The Royal Society of Chemistry 2012

S9
-0.4 -0.3 -0.2 -0.1 0.0 0.1 0.2-7
-6
-5
-4
-3
-2
-1
0
1
MoS3 particles drop-casted on FTO (ca. 16 μg).Consecutive polarization curves in 1.0 M H2SO4 (Ti counter electrode not separated).
DM4-10-Tcell Ti
Cur
rent
den
sity
(mA
/cm
2 )
Potential (V vs. RHE)
scan 1 scan 2 scan 3 scan 4 scan 5 scan 6
Fig. S6 Consecutive polarization curves of a freshly prepared MoS3-modified FTO electrode
(drop casting) recorded at pH = 0 (1.0 M H2SO4); scan rate: 5 mV/s. Ti electrode was used as a
counter electrode.
Electronic Supplementary Material (ESI) for Energy & Environmental ScienceThis journal is © The Royal Society of Chemistry 2012

S10
238 236 234 232 230 228 226 224 222
Binding energy (eV)
Mo 3d3/2
231.6
Mo 3d5/2
228.55
172 170 168 166 164 162 160 158 156
Experimental data I 2p3/2
I 2p1/2
II 2p3/2
II 2p1/2
Curve fitting
Binding energy (eV)
Fig. S7 XPS spectra of the MoS3-modified electrode after five minutes of electrolysis. (Top) Mo
spectrum; (bottom) S 2p spectrum.
Electronic Supplementary Material (ESI) for Energy & Environmental ScienceThis journal is © The Royal Society of Chemistry 2012
S11
238 236 234 232 230 228 226 224 222
Binding energy (eV)
Mo 3d5/2
228.55
Mo 3d3/2
231.6
172 170 168 166 164 162 160 158 156
Experimental data I 2p3/2
I 2p1/2
II 2p3/2
II 2p1/2
Curve fitting
Binding energy (eV)
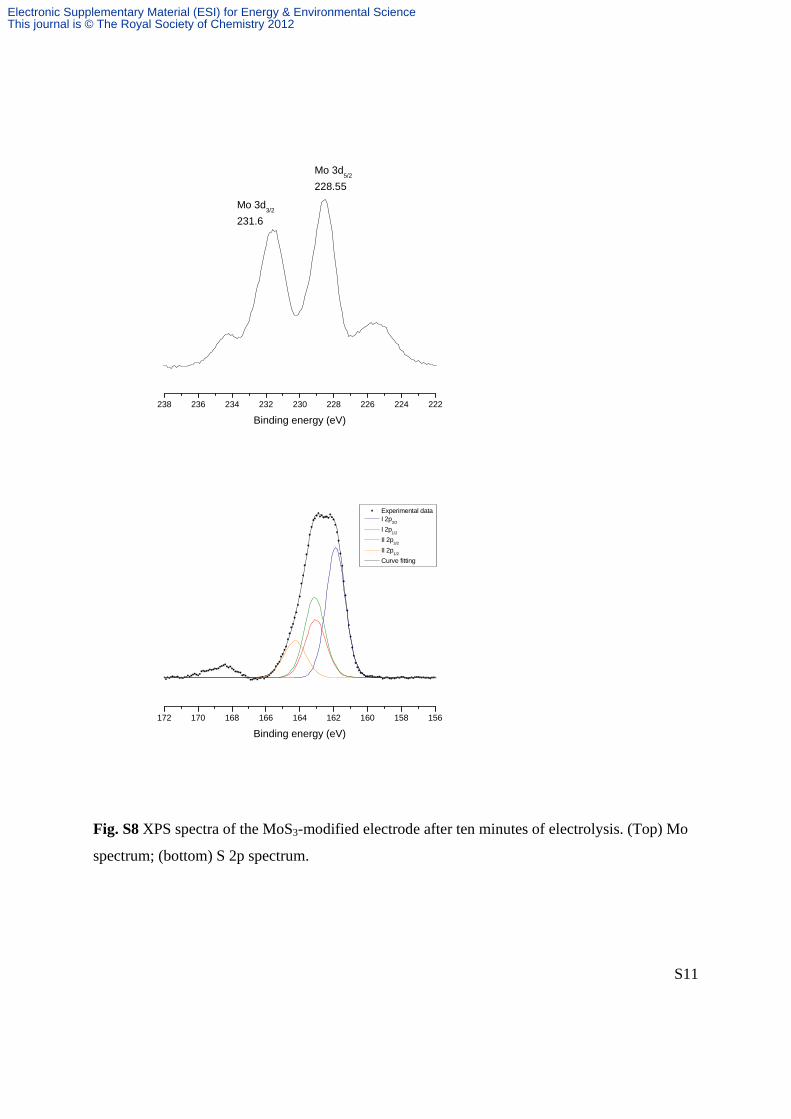
Fig. S8 XPS spectra of the MoS3-modified electrode after ten minutes of electrolysis. (Top) Mo
spectrum; (bottom) S 2p spectrum.
Electronic Supplementary Material (ESI) for Energy & Environmental ScienceThis journal is © The Royal Society of Chemistry 2012

S12
237.6 235.8 234.0 232.2 230.4 228.6 226.8 225.0 223.2
Binding energy (eV)
Mo 3d5/2
228.3
Mo 3d3/2
231.4
172 170 168 166 164 162 160 158 156
Experimental data I 2p3/2
I 2p1/2
II 2p3/2
II 2p1/2
Curve fitting
Binding energy (eV)
Fig. S9 XPS spectra of the MoSx species prepared by reduction of MoS3 with NaBH4. (Top) Mo
spectrum; (bottom) S 2p spectrum.
Electronic Supplementary Material (ESI) for Energy & Environmental ScienceThis journal is © The Royal Society of Chemistry 2012

S13
-0.4 -0.3 -0.2 -0.1 0.0 0.1-9
-8
-7
-6
-5
-4
-3
-2
-1
0
1
Cur
rent
den
sity
(mA
/cm
2 )
Potential (V vs RHE)
MoSx - from reduction by NaBH
4
MoS3
Fig. S10 Polarization curves of FTO electrodes modified by MoSx species prepared by reduction
with NaBH4, and by MoS3 particles recorded at pH = 0 (1.0 M H2SO4); scan rate: 5 mV/s. The
electrodes were made using the same loading of catalysts and drop casting.
Electronic Supplementary Material (ESI) for Energy & Environmental ScienceThis journal is © The Royal Society of Chemistry 2012

S14
240 238 236 234 232 230 228 226 224 222
Binding energy (eV)
Mo 3d5/2
228.8
Mo 3d3/2
231.9
170 168 166 164 162 160 158
Experimental data I 2p3/2
I 2p1/2
II 2p3/2
II 2p1/2
Curve fitting
Binding energy (eV)
Electronic Supplementary Material (ESI) for Energy & Environmental ScienceThis journal is © The Royal Society of Chemistry 2012
S15
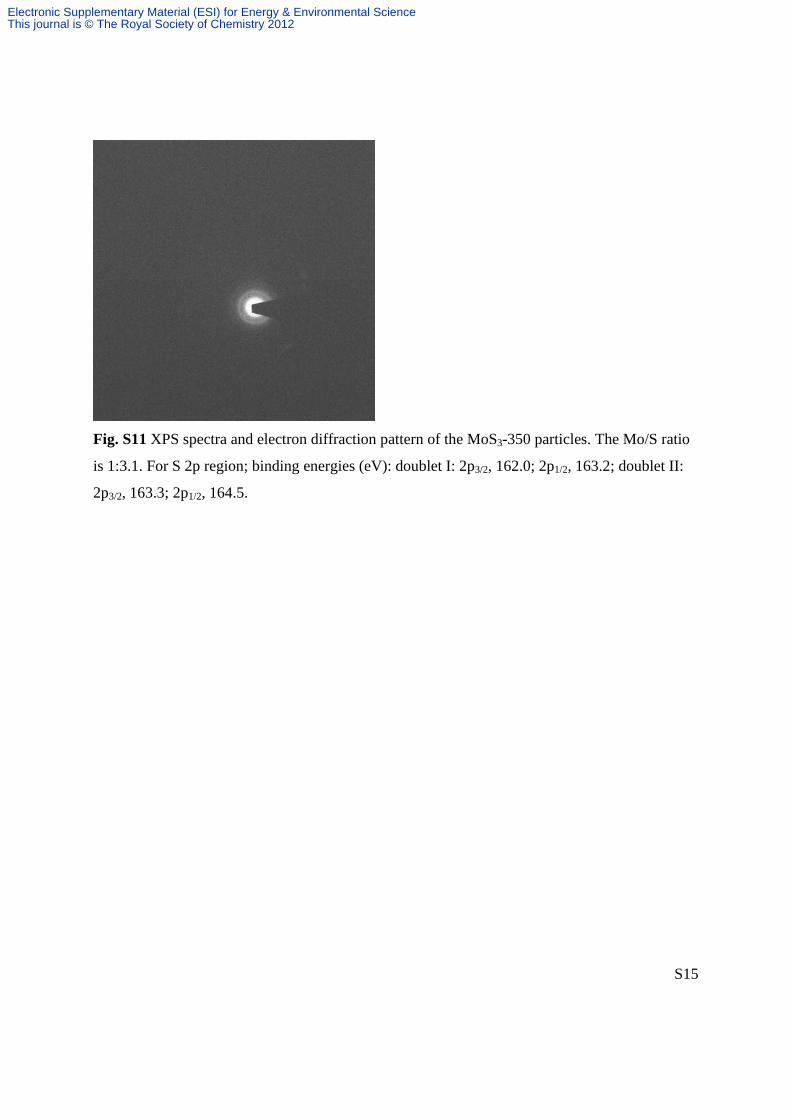
Fig. S11 XPS spectra and electron diffraction pattern of the MoS3-350 particles. The Mo/S ratio
is 1:3.1. For S 2p region; binding energies (eV): doublet I: 2p3/2, 162.0; 2p1/2, 163.2; doublet II:
2p3/2, 163.3; 2p1/2, 164.5.
Electronic Supplementary Material (ESI) for Energy & Environmental ScienceThis journal is © The Royal Society of Chemistry 2012

S16
240 238 236 234 232 230 228 226 224 222
Binding energy (eV)
Mo 3d3/2
231.8
Mo 3d5/2
228.7
S 2s
170 168 166 164 162 160 158
Experimental data S2- 2p3/2
S2- 2p1/2
Curve fitting
Binding energy (eV)
Electronic Supplementary Material (ESI) for Energy & Environmental ScienceThis journal is © The Royal Society of Chemistry 2012
S17
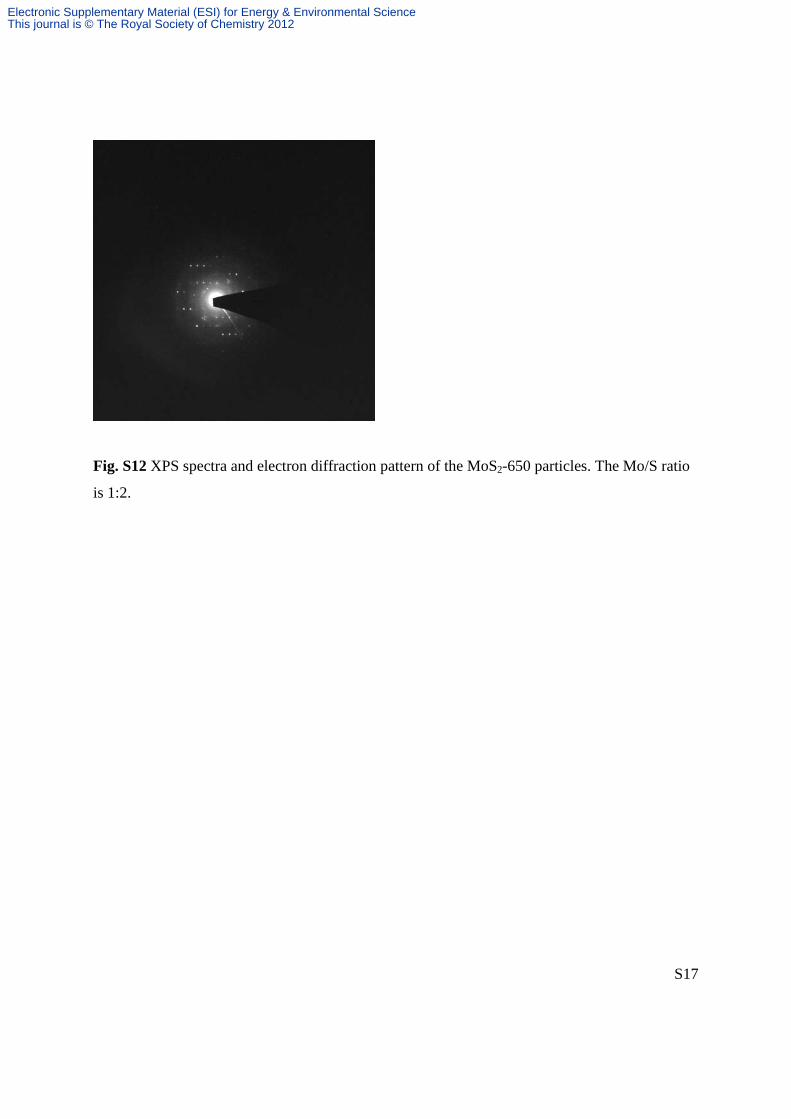
Fig. S12 XPS spectra and electron diffraction pattern of the MoS2-650 particles. The Mo/S ratio
is 1:2.
Electronic Supplementary Material (ESI) for Energy & Environmental ScienceThis journal is © The Royal Society of Chemistry 2012

S18
238 236 234 232 230 228 226 224 222
Binding Energy (eV)
Mo 3d5/2
228.55
Mo 3d3/2
231.65
Electronic Supplementary Material (ESI) for Energy & Environmental ScienceThis journal is © The Royal Society of Chemistry 2012

S19
174 172 170 168 166 164 162 160 158 156
Binding energy (eV)
162.3
163.5
S 2p1/2
S 2p3/2
Fig. S13 (Top) TEM image (left) and electron diffraction pattern of commercial MoS2 particles.
(Middle) XPS Mo spectrum of commercial MoS2 particles. The spectrum shows a peak at lower
binding energies, which is the S 2s peak. (Bottom) XPS S spectrum of commercial MoS2
particles. The S/Mo ratio is 2.1 for MoS2 particle.
Electronic Supplementary Material (ESI) for Energy & Environmental ScienceThis journal is © The Royal Society of Chemistry 2012