Embed Size (px)
Citation preview
(page S1)
Electronic Supplementary Information
Selective Nitrosation of Modified Dextran Polymers†
Jessica M. Joslin,a Vinod B. Damodaran
a and Melissa M. Reynolds
*ab
aDepartment of Chemistry, Colorado State University, Fort Collins, CO 80523, USA.
bSchool of Biomedical Engineering, Colorado State University, Fort Collins, CO 80523, USA.
*Corresponding Author:
E-mail: [email protected]
Tel: +1 970 491 3775
Electronic Supplementary Material (ESI) for RSC AdvancesThis journal is © The Royal Society of Chemistry 2013
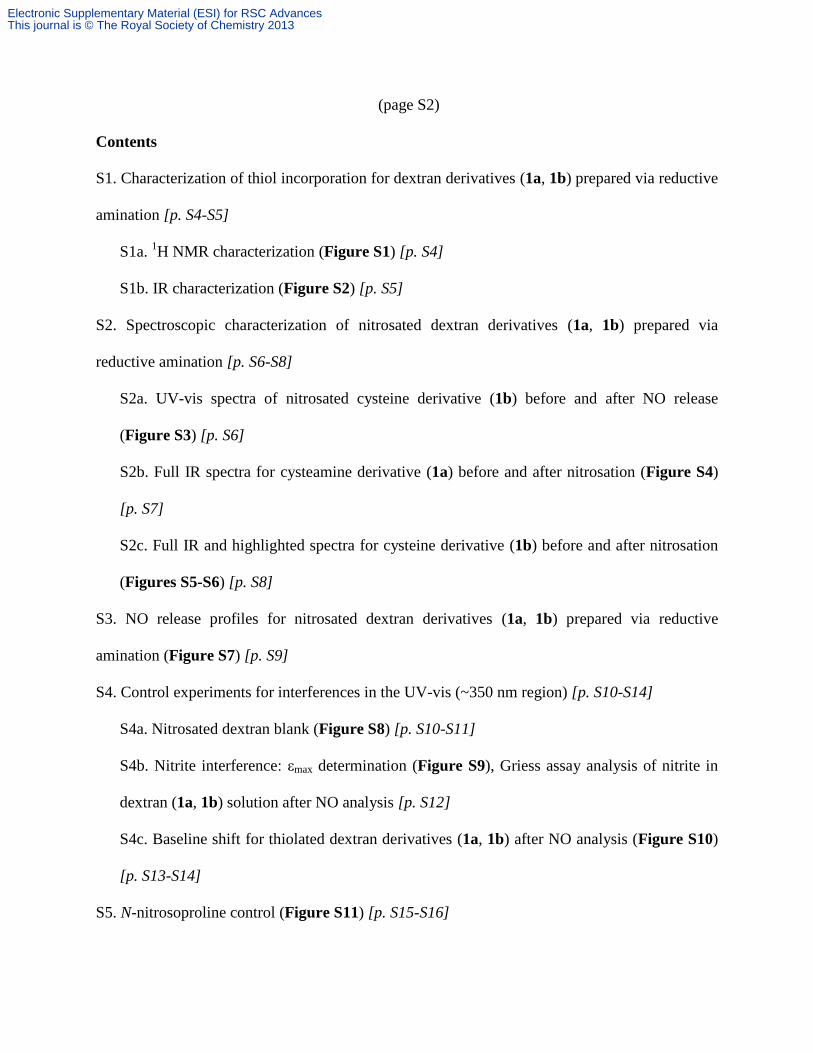
(page S2)
Contents
S1. Characterization of thiol incorporation for dextran derivatives (1a, 1b) prepared via reductive
amination [p. S4-S5]
S1a. 1H NMR characterization (Figure S1) [p. S4]
S1b. IR characterization (Figure S2) [p. S5]
S2. Spectroscopic characterization of nitrosated dextran derivatives (1a, 1b) prepared via
reductive amination [p. S6-S8]
S2a. UV-vis spectra of nitrosated cysteine derivative (1b) before and after NO release
(Figure S3) [p. S6]
S2b. Full IR spectra for cysteamine derivative (1a) before and after nitrosation (Figure S4)
[p. S7]
S2c. Full IR and highlighted spectra for cysteine derivative (1b) before and after nitrosation
(Figures S5-S6) [p. S8]
S3. NO release profiles for nitrosated dextran derivatives (1a, 1b) prepared via reductive
amination (Figure S7) [p. S9]
S4. Control experiments for interferences in the UV-vis (~350 nm region) [p. S10-S14]
S4a. Nitrosated dextran blank (Figure S8) [p. S10-S11]
S4b. Nitrite interference: εmax determination (Figure S9), Griess assay analysis of nitrite in
dextran (1a, 1b) solution after NO analysis [p. S12]
S4c. Baseline shift for thiolated dextran derivatives (1a, 1b) after NO analysis (Figure S10)
[p. S13-S14]
S5. N-nitrosoproline control (Figure S11) [p. S15-S16]
Electronic Supplementary Material (ESI) for RSC AdvancesThis journal is © The Royal Society of Chemistry 2013
(page S3)
S6. Remaining RSNO control [p. S17-S18]
S6a. UV exposure of dextran cysteamine (1a) derivative (Figure S12) [p. S17]
S6b. UV exposure of S-nitrosoglutathione (Figure S13) [p. S18]
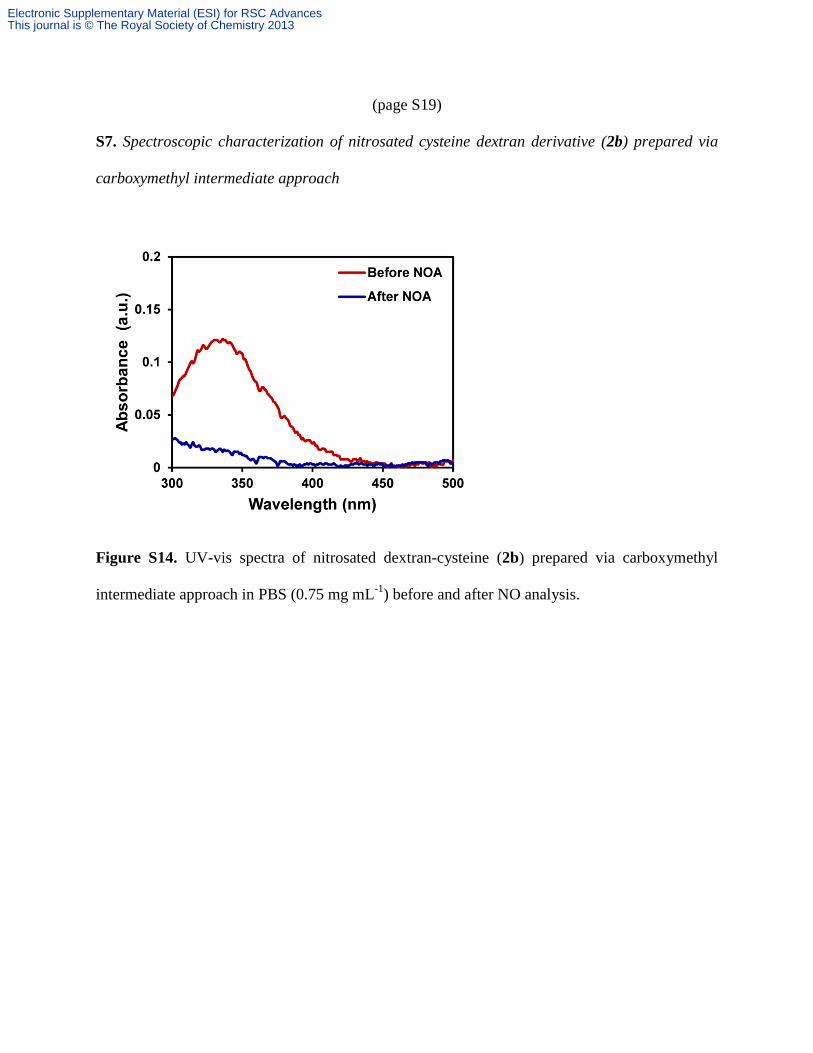
S7. Spectroscopic characterization of nitrosated cysteine dextran derivative (2b) prepared via
carboxymethyl intermediate approach (Figure S14) [p. S19]
S8. Molar extinction coefficient determination for nitrosated dextran derivatives (2a, 2b)
prepared via carboxymethyl intermediate approach (Figure S15) [p. S20-S21]
S9. References [p. S22]
Electronic Supplementary Material (ESI) for RSC AdvancesThis journal is © The Royal Society of Chemistry 2013
(page S4)
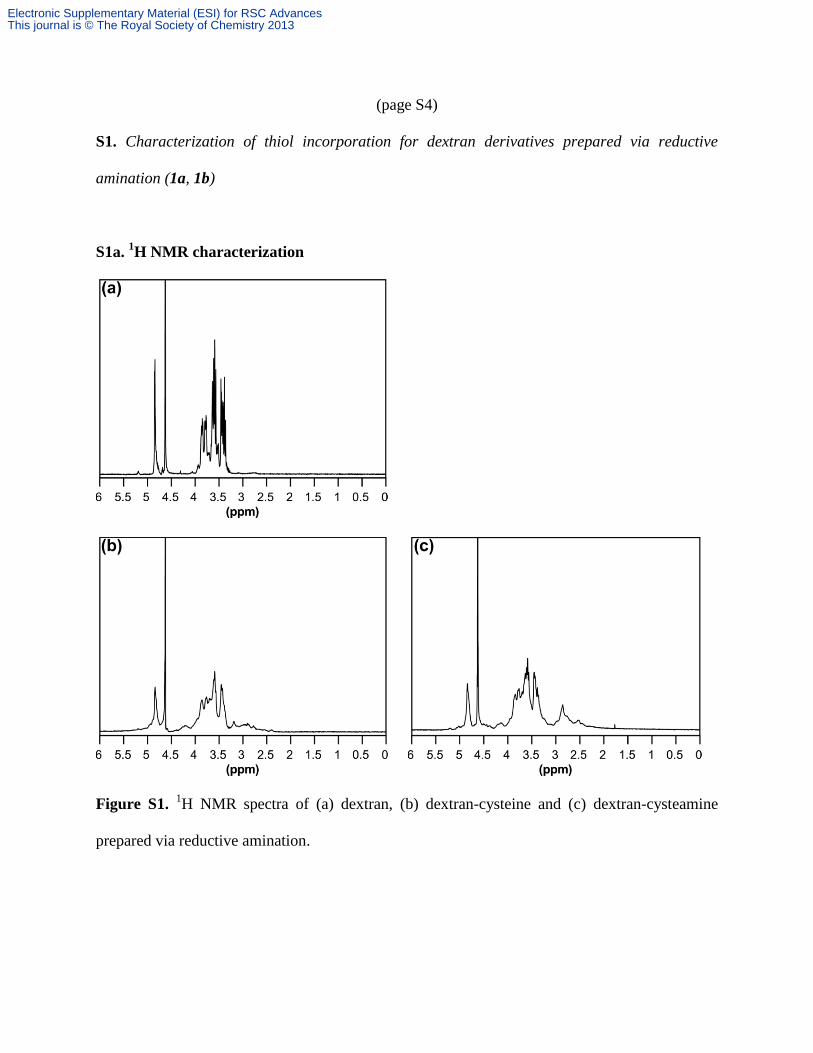
S1. Characterization of thiol incorporation for dextran derivatives prepared via reductive
amination (1a, 1b)
S1a. 1H NMR characterization
Figure S1. 1H NMR spectra of (a) dextran, (b) dextran-cysteine and (c) dextran-cysteamine
prepared via reductive amination.
Electronic Supplementary Material (ESI) for RSC AdvancesThis journal is © The Royal Society of Chemistry 2013
(page S5)
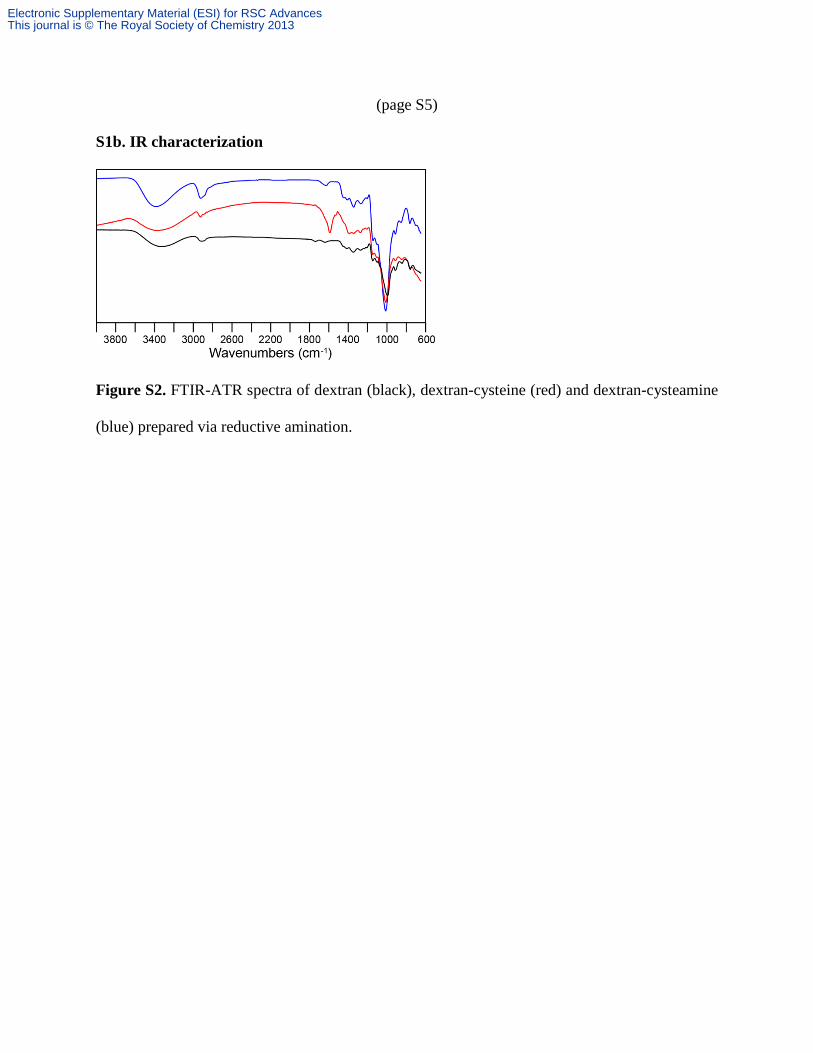
S1b. IR characterization
Figure S2. FTIR-ATR spectra of dextran (black), dextran-cysteine (red) and dextran-cysteamine
(blue) prepared via reductive amination.
Electronic Supplementary Material (ESI) for RSC AdvancesThis journal is © The Royal Society of Chemistry 2013
(page S6)
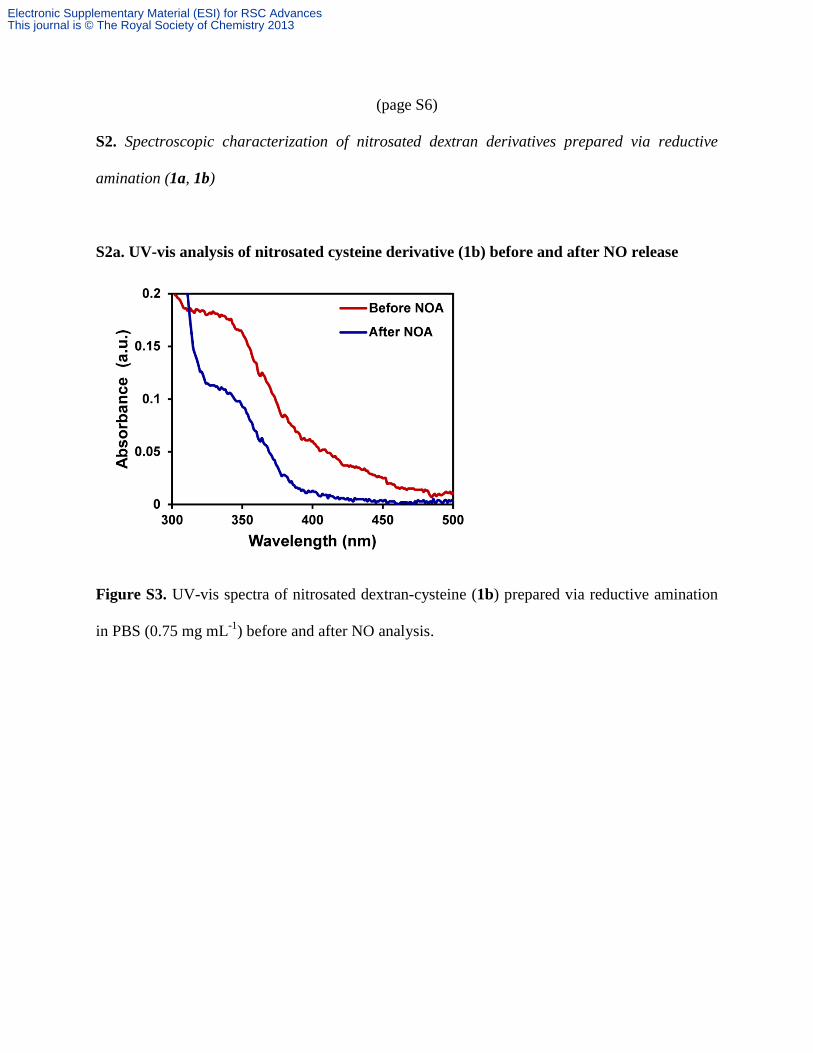
S2. Spectroscopic characterization of nitrosated dextran derivatives prepared via reductive
amination (1a, 1b)
S2a. UV-vis analysis of nitrosated cysteine derivative (1b) before and after NO release
Figure S3. UV-vis spectra of nitrosated dextran-cysteine (1b) prepared via reductive amination
in PBS (0.75 mg mL-1
) before and after NO analysis.
Electronic Supplementary Material (ESI) for RSC AdvancesThis journal is © The Royal Society of Chemistry 2013
(page S7)
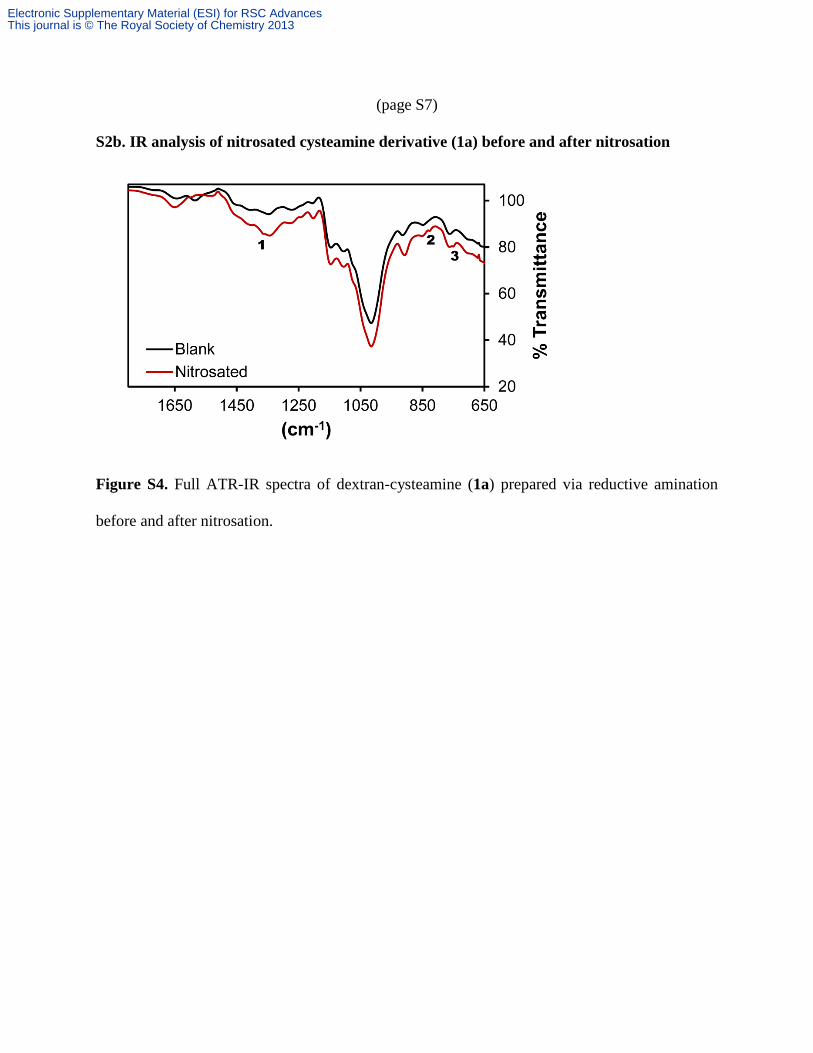
S2b. IR analysis of nitrosated cysteamine derivative (1a) before and after nitrosation
Figure S4. Full ATR-IR spectra of dextran-cysteamine (1a) prepared via reductive amination
before and after nitrosation.
Electronic Supplementary Material (ESI) for RSC AdvancesThis journal is © The Royal Society of Chemistry 2013
(page S8)
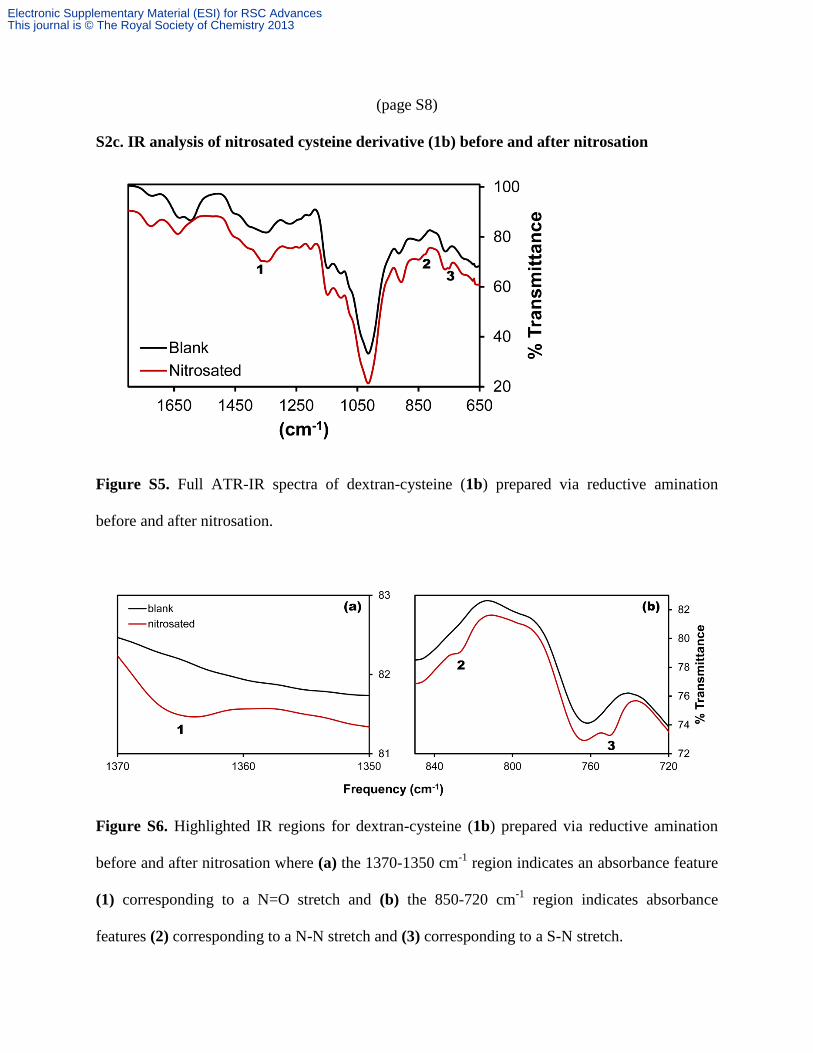
S2c. IR analysis of nitrosated cysteine derivative (1b) before and after nitrosation
Figure S5. Full ATR-IR spectra of dextran-cysteine (1b) prepared via reductive amination
before and after nitrosation.
Figure S6. Highlighted IR regions for dextran-cysteine (1b) prepared via reductive amination
before and after nitrosation where (a) the 1370-1350 cm-1
region indicates an absorbance feature
(1) corresponding to a N=O stretch and (b) the 850-720 cm-1
region indicates absorbance
features (2) corresponding to a N-N stretch and (3) corresponding to a S-N stretch.
Electronic Supplementary Material (ESI) for RSC AdvancesThis journal is © The Royal Society of Chemistry 2013
(page S9)
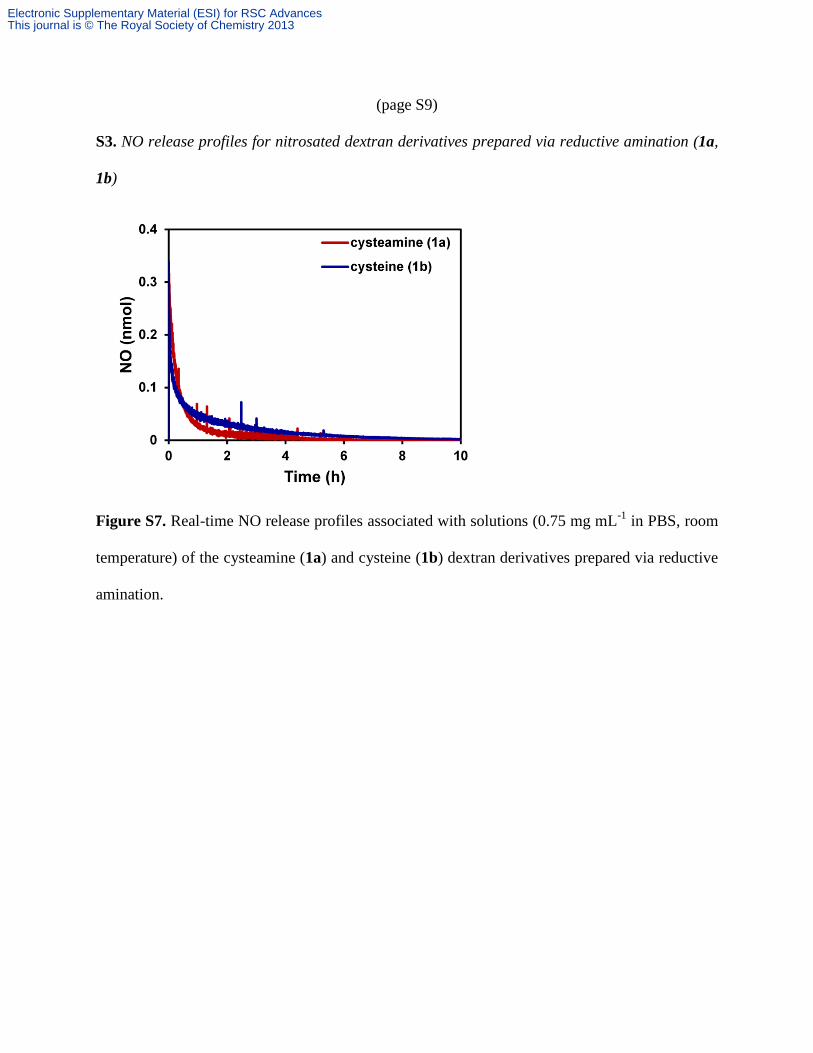
S3. NO release profiles for nitrosated dextran derivatives prepared via reductive amination (1a,
1b)
Figure S7. Real-time NO release profiles associated with solutions (0.75 mg mL-1
in PBS, room
temperature) of the cysteamine (1a) and cysteine (1b) dextran derivatives prepared via reductive
amination.
Electronic Supplementary Material (ESI) for RSC AdvancesThis journal is © The Royal Society of Chemistry 2013
(page S10)
S4. Control experiments for potential interferences in the UV-vis (~350 nm)
The 350 nm peak that remains (Figures 2, S3) after NO analysis of the nitrosated dextran
derivatives (1a, 1b) prepared via reductive amination when no more detectable NO release
occurs could be due to a few different species.
S4a. Nitrosated dextran blank
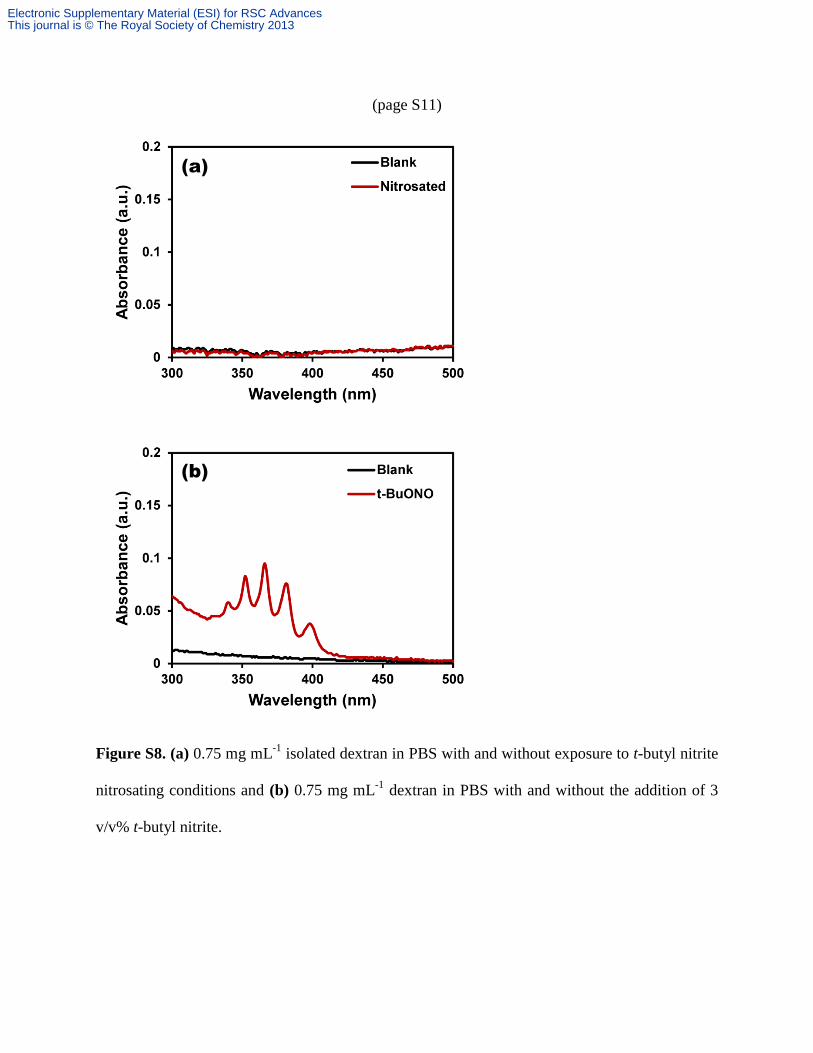
To account for any detectable residual t-butyl nitrite reagent in the system as well as any
potential C- or O- nitrosation of the dextran backbone, a non-thiolated dextran blank was
subjected to the same nitrosation procedure as all the other thiolated dextran derivatives. The
dextran product was isolated from the methanol/t-butyl nitrite under vacuum and analyzed via
solution-phase UV-visible spectroscopy (0.75 mg mL-1
in PBS). The dextran product recovered
after exposure to t-butyl nitrite exhibited no features in the 300-500 nm range (Figure S8a) and
did not release any detectable NO. Different O-nitroso groups, such as those due to nitrosation of
alcohols and carbohydrates, have been demonstrated to result in an absorbance in the region of
300-400 nm.1 The lack of an absorbance feature demonstrates that no detectable nitrosation
occurs due to reaction of t-butyl nitrite with the dextran backbone, which in turn does not
contribute to the recovered NO. Additionally, the lack of any absorbance features after dextran
exposure to t-butyl nitrite indicates that no detectable residual nitrosating agent is trapped in the
isolated dextran product. The presence of detectable levels of t-butyl nitrite would result in a
multiplet absorbance feature, as shown in Figure S8b.
Electronic Supplementary Material (ESI) for RSC AdvancesThis journal is © The Royal Society of Chemistry 2013
(page S11)
Figure S8. (a) 0.75 mg mL-1
isolated dextran in PBS with and without exposure to t-butyl nitrite
nitrosating conditions and (b) 0.75 mg mL-1
dextran in PBS with and without the addition of 3
v/v% t-butyl nitrite.
(a)
(b)
Electronic Supplementary Material (ESI) for RSC AdvancesThis journal is © The Royal Society of Chemistry 2013
(page S12)
S4b. Nitrite interference
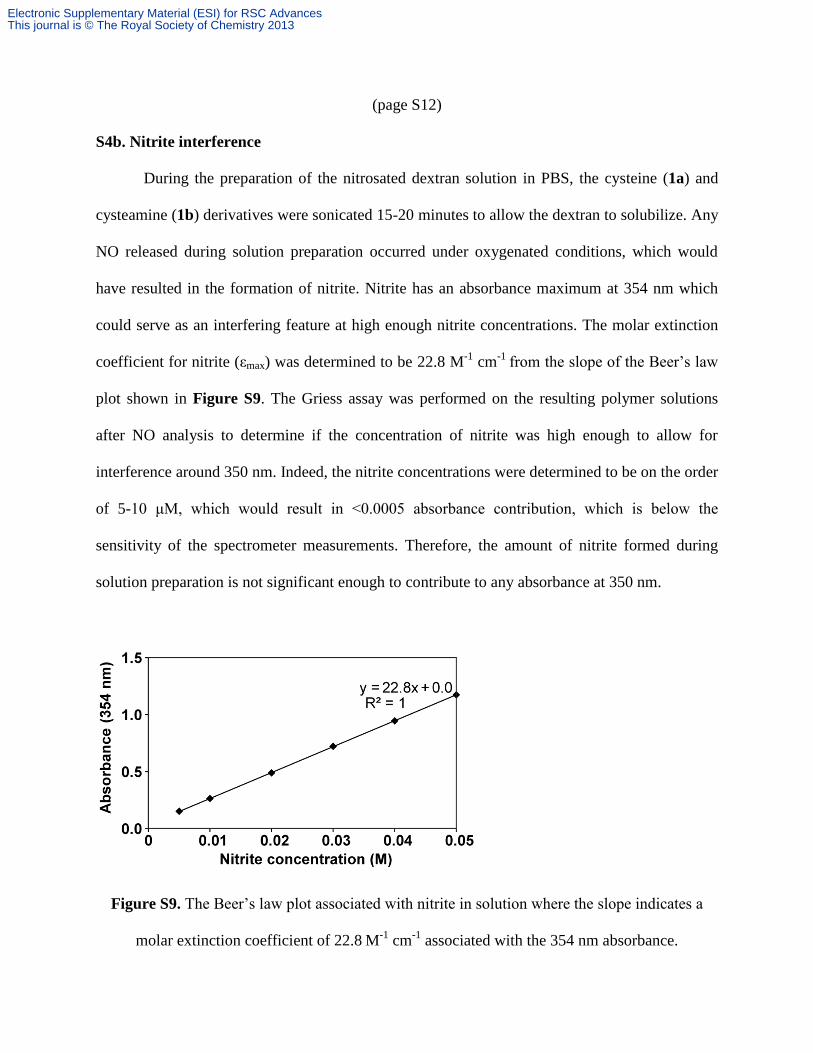
During the preparation of the nitrosated dextran solution in PBS, the cysteine (1a) and
cysteamine (1b) derivatives were sonicated 15-20 minutes to allow the dextran to solubilize. Any
NO released during solution preparation occurred under oxygenated conditions, which would
have resulted in the formation of nitrite. Nitrite has an absorbance maximum at 354 nm which
could serve as an interfering feature at high enough nitrite concentrations. The molar extinction
coefficient for nitrite (εmax) was determined to be 22.8 M-1
cm-1
from the slope of the Beer’s law
plot shown in Figure S9. The Griess assay was performed on the resulting polymer solutions
after NO analysis to determine if the concentration of nitrite was high enough to allow for
interference around 350 nm. Indeed, the nitrite concentrations were determined to be on the order
of 5-10 μM, which would result in <0.0005 absorbance contribution, which is below the
sensitivity of the spectrometer measurements. Therefore, the amount of nitrite formed during
solution preparation is not significant enough to contribute to any absorbance at 350 nm.
Figure S9. The Beer’s law plot associated with nitrite in solution where the slope indicates a
molar extinction coefficient of 22.8 M-1
cm-1
associated with the 354 nm absorbance.
Electronic Supplementary Material (ESI) for RSC AdvancesThis journal is © The Royal Society of Chemistry 2013
(page S13)
S4c. Baseline shift for thiolated dextran derivatives (1a, 1b) after NO analysis
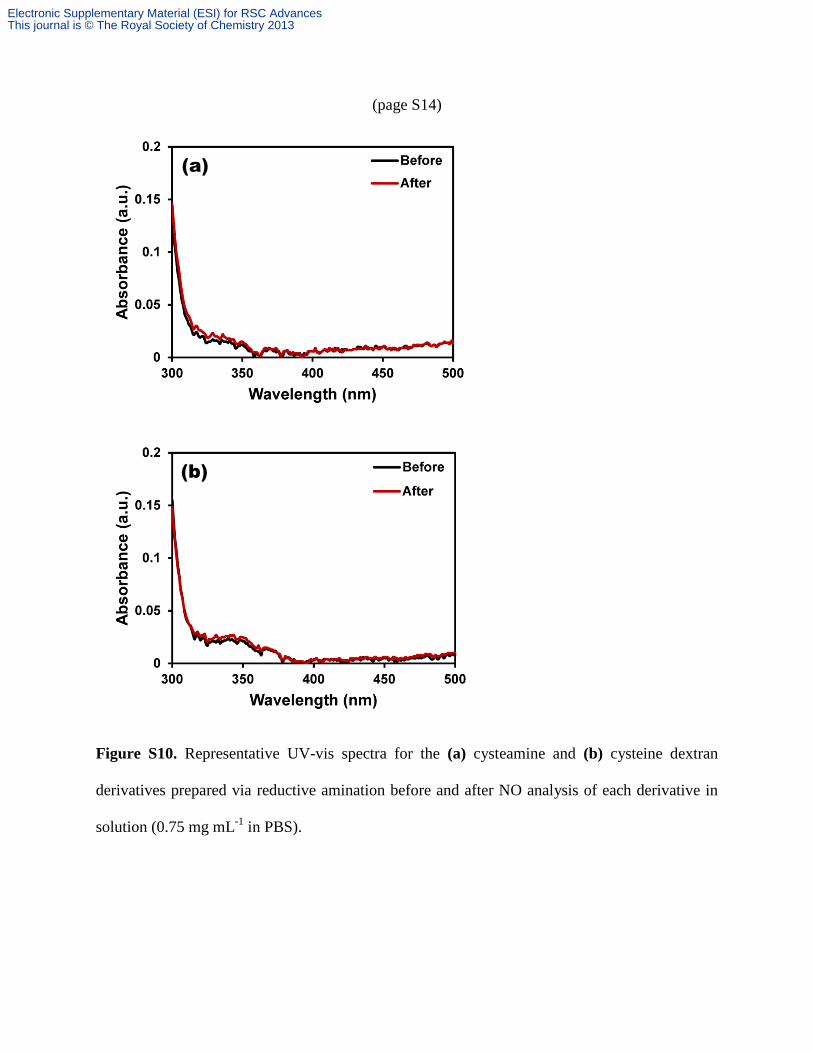
It is possible that the polymer behavior in soaking solution during the duration of the
analysis could lead to a shift in the UV-vis baseline. To account for this, the non-nitrosated
thiolated dextran derivatives (1a, 1b) were analyzed in solution (0.75 mg mL-1
in PBS) via UV-
vis and NOA on the same timescales as reported for the nitrosated derivatives, where no
significant shift was seen in the baselines (Figure S10). Since dextran degradation is not
expected under the analysis conditions employed, we would not expect a shift in the baseline.
Overall, the persistent absorbance feature at ~350 nm exhibited by the nitrosated
derivatives 1a and 1b after NO analysis is not due to nitrite formation, a shift in polymer
baseline, or any features that could occur due to nitrosation of the polymer backbone or residual
nitrosating agent.
Electronic Supplementary Material (ESI) for RSC AdvancesThis journal is © The Royal Society of Chemistry 2013
(page S14)
Figure S10. Representative UV-vis spectra for the (a) cysteamine and (b) cysteine dextran
derivatives prepared via reductive amination before and after NO analysis of each derivative in
solution (0.75 mg mL-1
in PBS).
(a)
(b)
Electronic Supplementary Material (ESI) for RSC AdvancesThis journal is © The Royal Society of Chemistry 2013
(page S15)
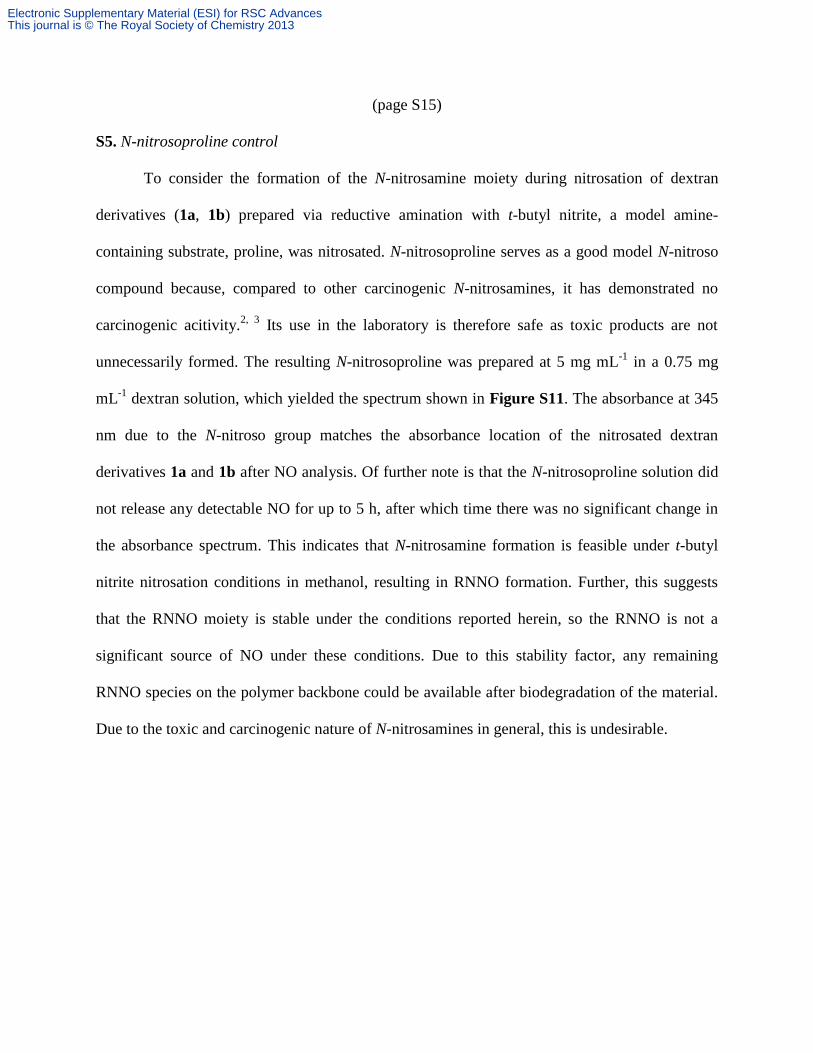
S5. N-nitrosoproline control
To consider the formation of the N-nitrosamine moiety during nitrosation of dextran
derivatives (1a, 1b) prepared via reductive amination with t-butyl nitrite, a model amine-
containing substrate, proline, was nitrosated. N-nitrosoproline serves as a good model N-nitroso
compound because, compared to other carcinogenic N-nitrosamines, it has demonstrated no
carcinogenic acitivity.2, 3
Its use in the laboratory is therefore safe as toxic products are not
unnecessarily formed. The resulting N-nitrosoproline was prepared at 5 mg mL-1
in a 0.75 mg
mL-1
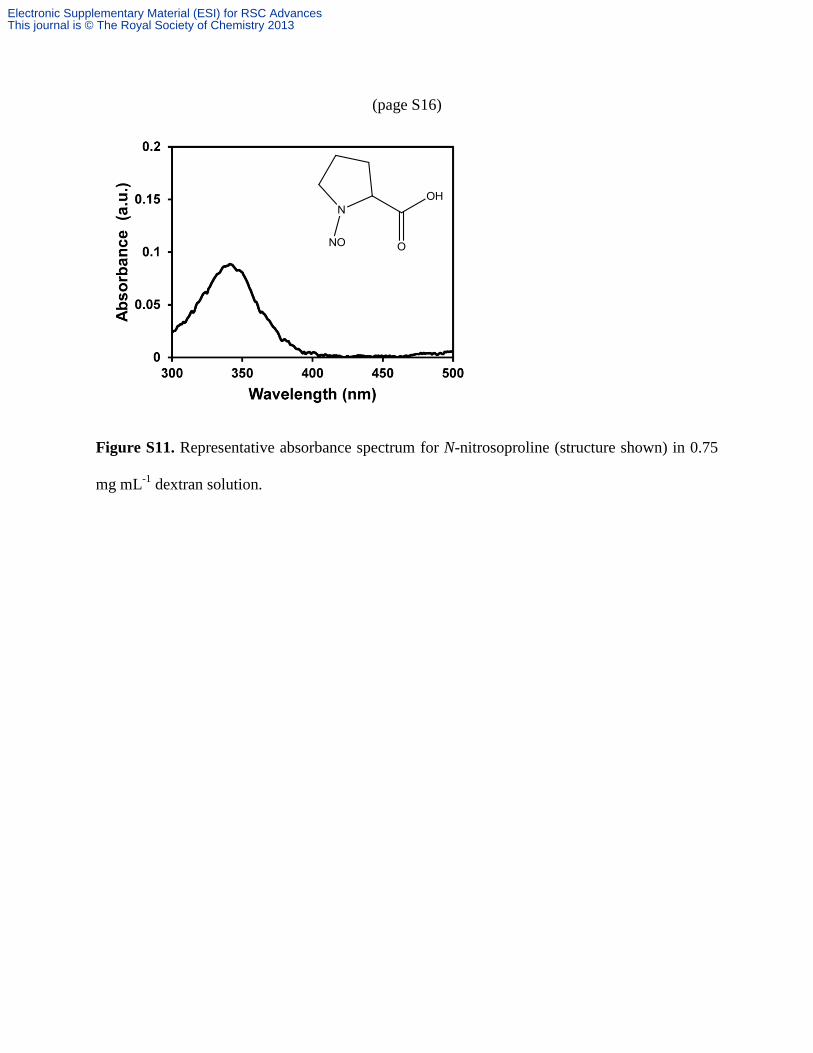
dextran solution, which yielded the spectrum shown in Figure S11. The absorbance at 345
nm due to the N-nitroso group matches the absorbance location of the nitrosated dextran
derivatives 1a and 1b after NO analysis. Of further note is that the N-nitrosoproline solution did
not release any detectable NO for up to 5 h, after which time there was no significant change in
the absorbance spectrum. This indicates that N-nitrosamine formation is feasible under t-butyl
nitrite nitrosation conditions in methanol, resulting in RNNO formation. Further, this suggests
that the RNNO moiety is stable under the conditions reported herein, so the RNNO is not a
significant source of NO under these conditions. Due to this stability factor, any remaining
RNNO species on the polymer backbone could be available after biodegradation of the material.
Due to the toxic and carcinogenic nature of N-nitrosamines in general, this is undesirable.
Electronic Supplementary Material (ESI) for RSC AdvancesThis journal is © The Royal Society of Chemistry 2013
(page S16)
Figure S11. Representative absorbance spectrum for N-nitrosoproline (structure shown) in 0.75
mg mL-1
dextran solution.
Electronic Supplementary Material (ESI) for RSC AdvancesThis journal is © The Royal Society of Chemistry 2013
(page S17)
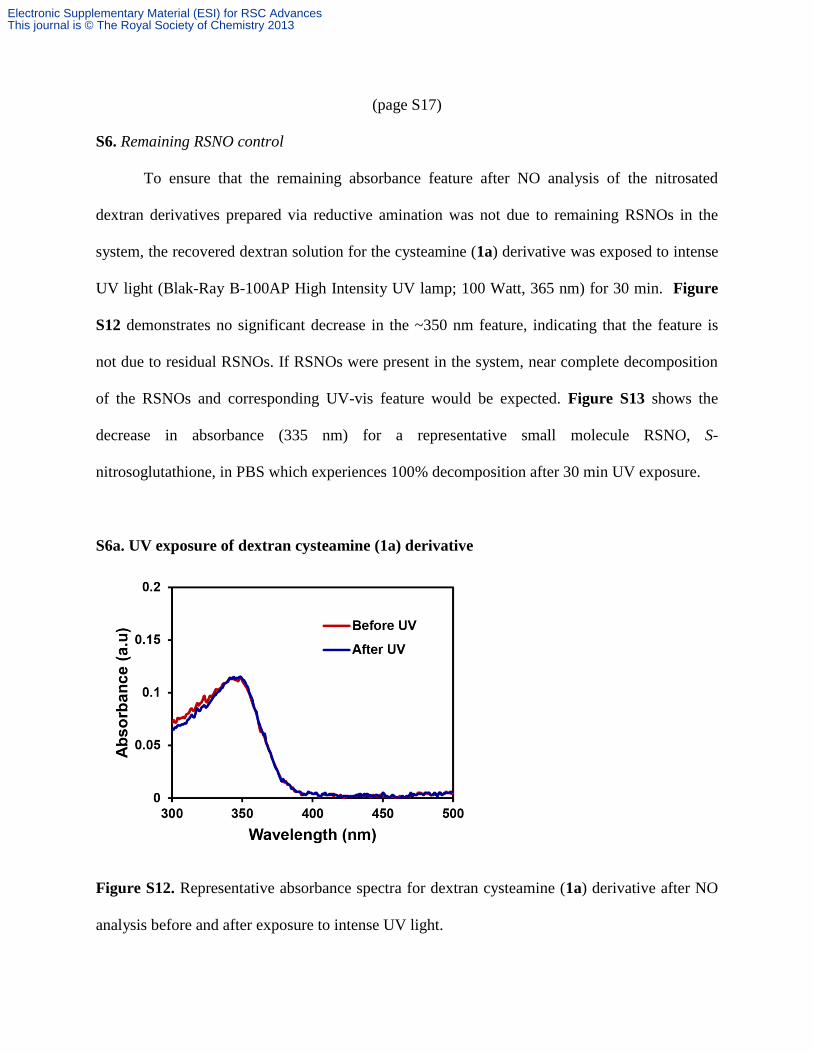
S6. Remaining RSNO control
To ensure that the remaining absorbance feature after NO analysis of the nitrosated
dextran derivatives prepared via reductive amination was not due to remaining RSNOs in the
system, the recovered dextran solution for the cysteamine (1a) derivative was exposed to intense
UV light (Blak-Ray B-100AP High Intensity UV lamp; 100 Watt, 365 nm) for 30 min. Figure
S12 demonstrates no significant decrease in the ~350 nm feature, indicating that the feature is
not due to residual RSNOs. If RSNOs were present in the system, near complete decomposition
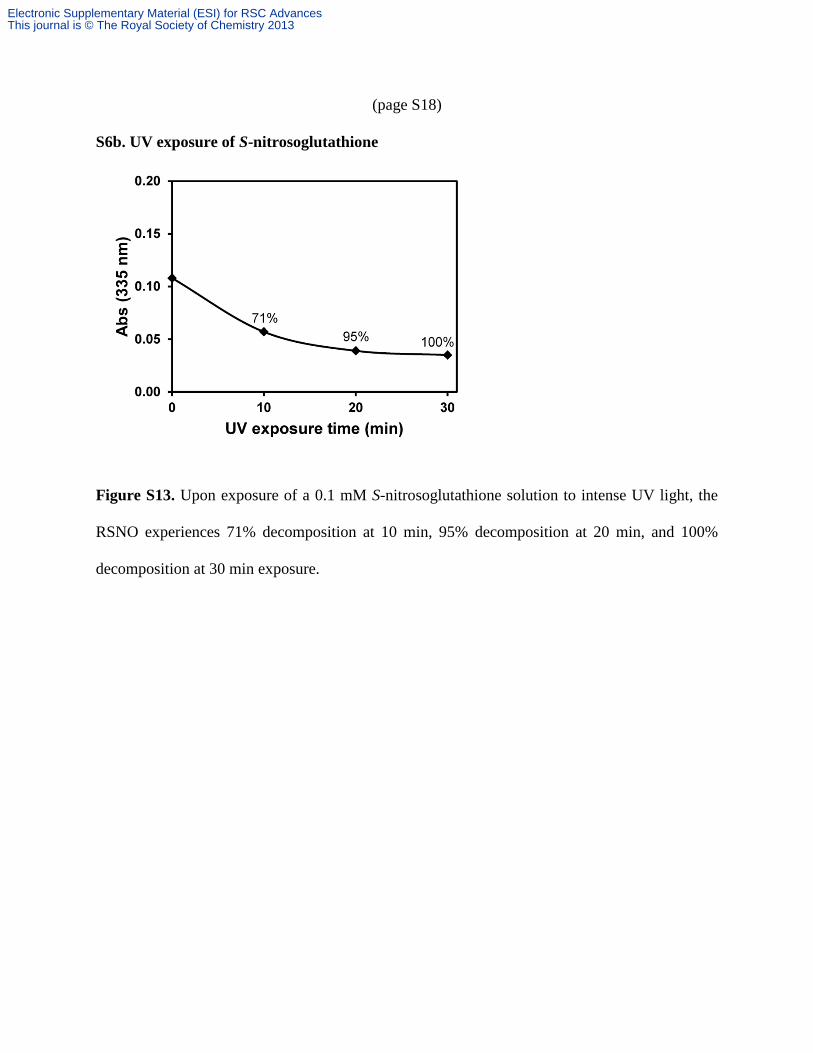
of the RSNOs and corresponding UV-vis feature would be expected. Figure S13 shows the
decrease in absorbance (335 nm) for a representative small molecule RSNO, S-
nitrosoglutathione, in PBS which experiences 100% decomposition after 30 min UV exposure.
S6a. UV exposure of dextran cysteamine (1a) derivative
Figure S12. Representative absorbance spectra for dextran cysteamine (1a) derivative after NO
analysis before and after exposure to intense UV light.
Electronic Supplementary Material (ESI) for RSC AdvancesThis journal is © The Royal Society of Chemistry 2013
(page S18)
S6b. UV exposure of S-nitrosoglutathione
Figure S13. Upon exposure of a 0.1 mM S-nitrosoglutathione solution to intense UV light, the
RSNO experiences 71% decomposition at 10 min, 95% decomposition at 20 min, and 100%
decomposition at 30 min exposure.
Electronic Supplementary Material (ESI) for RSC AdvancesThis journal is © The Royal Society of Chemistry 2013
(page S19)
S7. Spectroscopic characterization of nitrosated cysteine dextran derivative (2b) prepared via
carboxymethyl intermediate approach
Figure S14. UV-vis spectra of nitrosated dextran-cysteine (2b) prepared via carboxymethyl
intermediate approach in PBS (0.75 mg mL-1
) before and after NO analysis.
Electronic Supplementary Material (ESI) for RSC AdvancesThis journal is © The Royal Society of Chemistry 2013
(page S20)
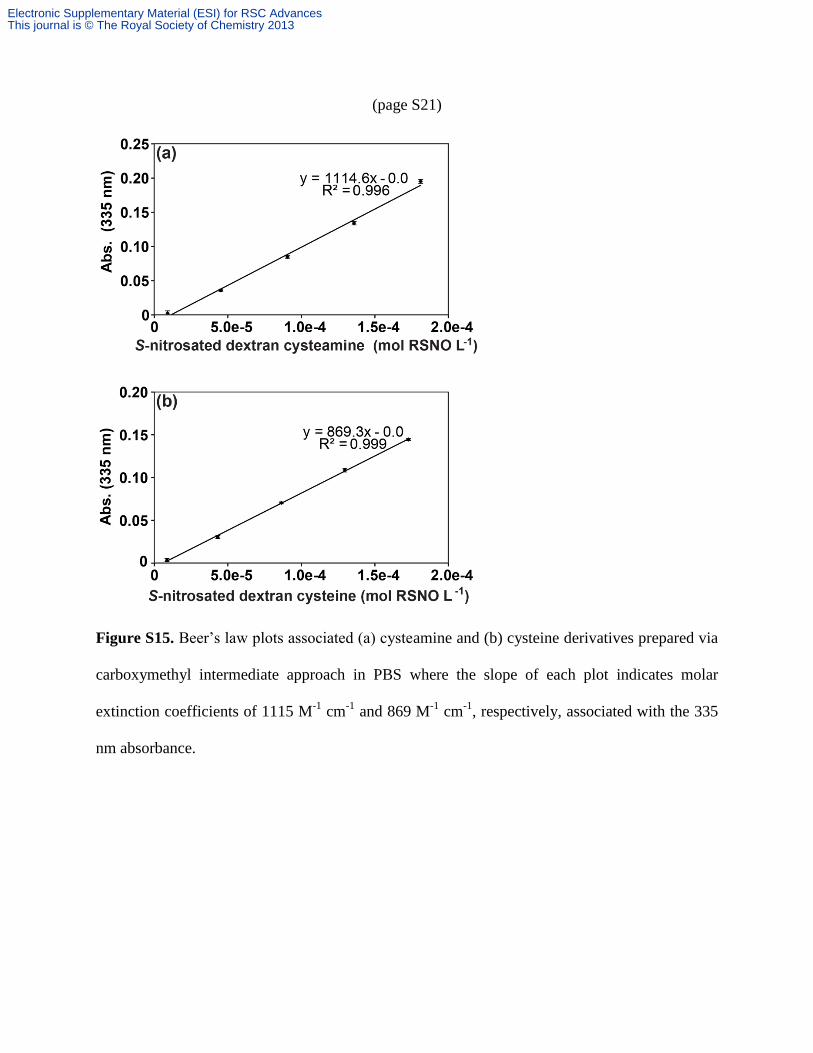
S8. Molar extinction coefficient determination for nitrosated dextran derivatives (2a, 2b)
prepared via carboxymethyl intermediate approach
Solutions of each nitrosated dextran derivative were prepared in PBS via serial dilution of
a 1.0 mg mL-1
stock solution to yield 0.05, 0.25, 0.50, 0.75 and 1.0 mg polymer mL-1
. The
amount of NO recovered during the NOA analysis period was normalized by the mass of
polymer present in the 0.75 mg mL-1
solution. This value was further corrected to account for the
fact that the RSNO moiety experienced around 90% decomposition (based upon UV-vis
analysis) to yield a value that allowed for the conversion of the mg mL-1
polymer concentrations
to mol RSNO L-1
(assuming a 1 NO: 1 RSNO molar ratio). Figure S15 shows the representative
Beer’s law plots associated with the cysteamine (2a) and cysteine (2b) dextran derivatives. The
slope of each plot corresponds to the molar extinction coefficient (M-1
cm-1
) of each nitrosated
material, where εmax corresponding to 335 nm was determined to be 1115±42 M-1
cm-1
for the
cysteamine derivative (2a) and 869±12 M-1
cm-1
for the cysteine derivative (2b).
Electronic Supplementary Material (ESI) for RSC AdvancesThis journal is © The Royal Society of Chemistry 2013
(page S21)
Figure S15. Beer’s law plots associated (a) cysteamine and (b) cysteine derivatives prepared via
carboxymethyl intermediate approach in PBS where the slope of each plot indicates molar
extinction coefficients of 1115 M-1
cm-1
and 869 M-1
cm-1
, respectively, associated with the 335
nm absorbance.
Electronic Supplementary Material (ESI) for RSC AdvancesThis journal is © The Royal Society of Chemistry 2013
(page S22)
S9. References
1. S. E. Aldred, D. L. H. Williams and M. Garley, J. Chem. Soc., Perkin Trans. 2, 1982,
777-782.
2. H. T. Nagasawa, P. S. Fraser and D. L. Yuzon, J. Med. Chem., 1973, 16, 583-585.
3. J. E. Nixon, J. H. Wales, R. A. Scanlan, D. D. Bills and R. O. Sinnhuber, Food Cosmet.
Toxicol., 1976, 14, 133-135.
Electronic Supplementary Material (ESI) for RSC AdvancesThis journal is © The Royal Society of Chemistry 2013