Embed Size (px)
Citation preview

S1
Electronic Supplementary Information (ESI)
Direct assay of butyrylcholinesterase activity using a
fluorescent substrate
Seungyoon Kang,‡ Suji Lee‡, Woojin Yang, Jiwon Seo and Min Su Han*
Department of Chemistry, Gwangju Institute of Science and Technology, 123 Cheomdangwagi-ro,
Buk-gu, Gwangju 61005, Republic of Korea
E-mail: [email protected]; Fax: +82-62-715-2866; Tel: +82-62-715-2848
Electronic Supplementary Material (ESI) for Organic & Biomolecular Chemistry.This journal is © The Royal Society of Chemistry 2016

S2
Stability test of 1 in buffer condition Fluorescence spectra of 1 (50 μΜ) was recorded under different pH conditions (pH = 7.0, 7.4,
8.0) using Tris buffer (20 mM) for 1 h to find the appropriate conditions for enzymatic assay.
In all experiments, the final sample volume was 1 mL and all measurements were performed
in 1 cm quartz cells at 25 °C with excitation at 355 nm.
Figure S1. Stability test of 1 (50 μΜ, Tris buffer 20 mM) in different pH condition (A) pH 7.0, (B) pH
7.4, (C) pH 8.0. λex = 355 nm.

S3
Mechanism studies of BChE assay based on 1
BChE (2 U/mL) was then added to the sample containing 1 (100 μΜ) and Tris buffer (20 mM,
pH 7.0) and the mixture was incubated for 90 min. By mass spectroscopy, the fragment formed
by the enzymatic hydrolysis of 1 was confirmed.
A sample containing 1 (50 μΜ) and Tris buffer (20 mM, pH 7.0) in distilled H2O and another
sample containing 3 (50 μΜ) and Tris buffer (20 mM, pH 7.0) in 1% DMSO were prepared.
Then, the fluorescence spectrum of each sample was recorded.
Figure S2. Mass spectrum of 1 (100 μΜ, Tris buffer pH 7.0 20 mM) containing BChE (2 U/mL) after
incubation for 2 hours.
Figure S3. Comparison of fluorescence property of 1 (50 μM, Tris buffer pH 7.0 20 mM) and 3 (50 μM, Tris buffer pH 7.0 20 mM). λex = 355 nm.

S4
Selectivity test of 1 for BChE
BChE and other esterase were used; carboxylesterase from porcine liver (CES, EC 3.1.1.1),
lipase from porcine pancreas (EC 3.1.1.3), and phospholipase C from Clostridium perfringens
(PLC, EC 3.1.4.3). Each of esterase (2 U/mL) was added to the sample containing 1 (50 μΜ)
and Tris buffer (20 mM, pH 7.0), and fluorescence spectra of each sample were recorded for 30
min.
Figure S4. Fluorescence spectra of 1 (50 μΜ, Tris buffer 20 mM) with different esterase (2 U/mL),
(A) without esterase, (B) BChE, (C) CES, (D) PLC, (E) lipase, (F) Normalized fluorescence intensities
at 520 nm of 1 versus different esterase (2 U/mL) after 30 min incubation. λex = 355 nm.

S5
Model study of 3,6-dihydroxy phthalimide derivatives
In order to confirm the substitution effect from dimethoxy phthalimide part to dihydroxy phthalimide
in compound 1, we synthesized 3,6-dihydroxy phthalimide derivative (S1, S2) for comparison study
(Scheme S1).
OH
OH
CN
CN
OH
OH
COOH
COOHN
O
O
OBnOOH
OH
N
O
O
OHOOH
OH
KOH
H2O
SOCl2
OH
OH
O
O
OEt3N, DMF
H2N OBn
O
HCl Pd/C, H2(g)
MeOH
S1S2S3S4
Scheme S1. Synthesis of 3,6-dihydroxy phthalimide derivatives (S1, S2) for model study.
1) Synthesis of 3,6-dihydroxyphthalic acid (S4) and 4,7-dihydroxyisobenzofuran-1,3-dione
(S3).
S4 and S3 was synthesized by following literature procedures. (Phys. Chem. Chem. Phys.,
2015, 17, 30659-30669.)
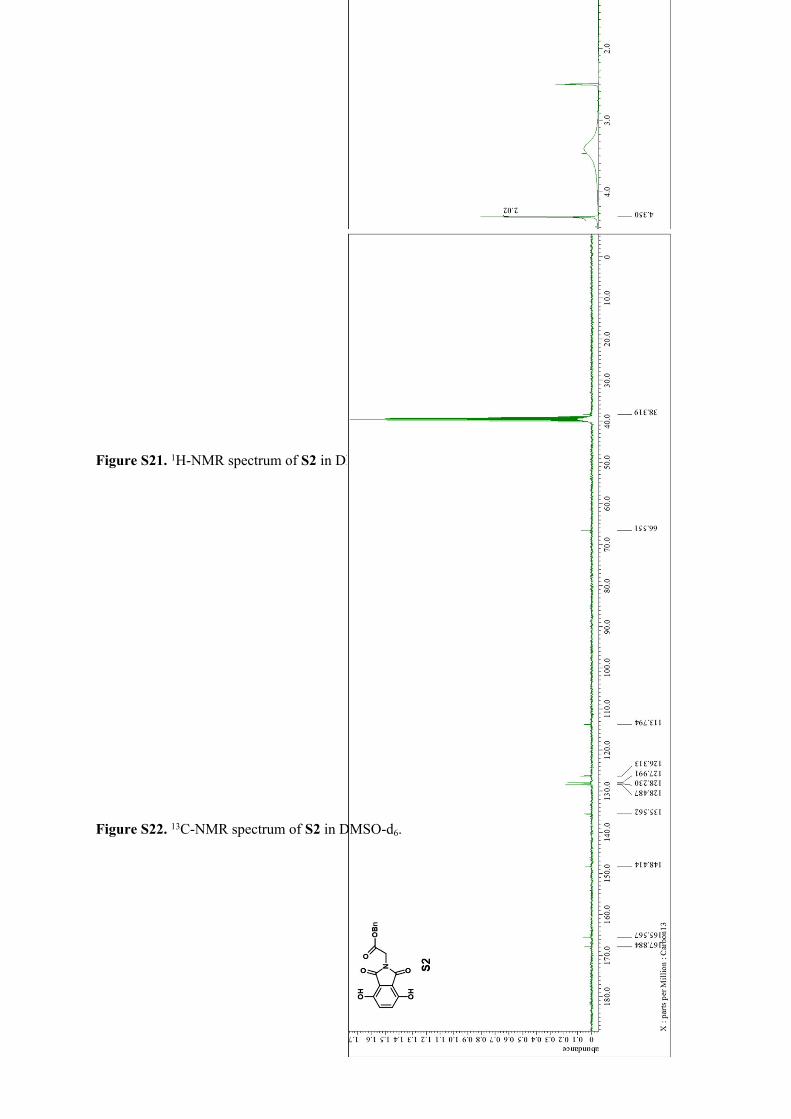
2) Synthesis of benzyl 2-(4,7-dihydroxy-1,3-dioxoisoindolin-2-yl)acetate (S2).
Et3N (0.74 mL, 5.25 mmol) and S3 (0.90 g, 5.00 mmol) were added to a solution of Glycine
benzylester hydrochloride (1.06 g, 5.25 mmol) in DMF (6 mL) at 0 °C. After stirring for 30
min, reaction mixture was heated at 70 °C for 14 h. The brown solution was cooled to r.t. and
diluted with TDW (50 mL), and extracted with EtOAc (50 mL × 3). The organic phase was
washed with TDW and brine and dried with anhydrous Na2SO4. The filtrate was then
concentrated and residue as purified by column chromatography (silica gel, CHCl3: MeOH =
10: 1, v/v) to obtain S2 (0.43 g, 26 %) as a pale red powder. 1H NMR (400 MHz, DMSO-d6):
δ 9.91 (br.s, 2H), 7.40-7.32 (m, 5H), 7.10 (s, 2H), 5.18 (s, 2H), 4.35 (s, 2H) ppm. 13C NMR

S6
(100 MHz, DMSO-d6): δ 167.90, 165.59, 148.43, 135.58, 128.51, 128.25, 128.00, 126.32,
113.82, 66.57, 38.34 ppm.
3) Synthesis of 2-(4,7-dihydroxy-1,3-dioxoisoindolin-2-yl)acetic acid (S1).
A solution of S2 (0.23 g, 0.7 mmol) in MeOH (15 mL) was hydrogenated at atmospheric
pressure for 30 min at room temperature using 10% palladium-carbon (0.14 g) as a catalyst.
The mixture was filtered through a pad of Celite, and the filtrate was concentrated under
reduced pressure to obtain S1 (0.14 g, 84 %) as a yellow powder. 1H NMR (400 MHz, DMSO-
d6): δ 10.31 (br.s, 2H), 7.10 (s, 2H), 4.16 (s, 2H) ppm. 13C NMR (100 MHz, DMSO-d6): δ
169.29, 165.78, 148.30, 126.18, 114.01, 38.38 ppm.
4) UV-Vis and Fluorescence spectra of S1 and S2 for various pH.
Figure S5. (a) UV-vis spectra of S2 (50 M) and (b) S1 (50 M) for various pH condition (20 mM,
DMSO 5%). pH 5~6: citrate buffer, pH 7~9: Tris buffer.

S7
Figure S6. Fluorescence spectra of S2 (50 M) for various pH condition (20 mM, DMSO 5%). pH 5~6:
citrate buffer, pH 7~9: Tris buffer. (a) ex = 378 nm, (b) ex = 436 nm
Figure S7. Fluorescence spectra of S1 (50 M) for various pH condition (20 mM, DMSO 5%). pH 5~6:
citrate buffer, pH 7~9: Tris buffer. (a) ex = 378 nm, (b) ex = 436 nm

S8
Figure S8. Plot of fluorescence intensity of S2 (50 M) and S1 (50 M) at 513 nm. pH 5~6: citrate
buffer, pH 7~9: Tris buffer. (a) ex = 378 nm, (b) ex = 436 nm
Based on the UV-Vis spectra of S1 and S2, we recorded fluorescence emission spectra of S1 and S2
for two difference excitation wavelength (378 nm, 436 nm). As shown Figure 4(a), in case of ex = 378
nm, fluorescence intensity of S1 and S2 at 513 nm are almost same in various pH condition. And in
case of ex = 436 nm, S2 (benzyl ester moiety) was showed more strong fluorescence intensity than S1
(acid moiety). This experimental result is similar with that of dimethoxy moiety that fluorescence on-
off phenomena.

S9
Characterization of compounds
Figure S9. 1H-NMR spectrum of 6 in CDCl3.

S10
Figure S10. 1H-NMR spectrum of 5 in DMSO-d6.

S11
Figure S11. 1H-NMR spectrum of 4 in CDCl3.

S12
Figure S12. 1H-NMR spectrum of 3 in DMSO-d6.

S13
Figure S13. 1H-NMR spectrum of 2 in CDCl3.
Figure S14. 13C-NMR spectrum of 2 in CDCl3.

S14
Figure S15. ESI-Mass spectrum of 2.
Figure S16. HPLC chromatogram of 2.

S15
Figure S17. 1H-NMR spectrum of 1 in DMSO-d6.
Figure S18. 13C-NMR spectrum of 1 in DMSO-d6.

S16
Figure S19. ESI-Mass spectrum of 1.
Figure S20. HPLC chromatogram of 1.
S17
Figure S21. 1H-NMR spectrum of S2 in DMSO-d6.
Figure S22. 13C-NMR spectrum of S2 in DMSO-d6.

S18
Figure S23. 1H-NMR spectrum of S1 in DMSO-d6.
Figure S24. 13C-NMR spectrum of S1 in DMSO-d6.