Embed Size (px)
Citation preview
Electrochemistry Cell Model
Dennis Dees and Kevin GallagherChemical Sciences and Engineering Division
May 9-13, 2011
Vehicle Technologies Program Annual Merit Review and Peer Evaluation MeetingWashington, D.C.
This presentation does not contain any proprietary, confidential, or otherwise restricted information.
Project ID:ES031
Vehicle Technologies Program
2
Overview
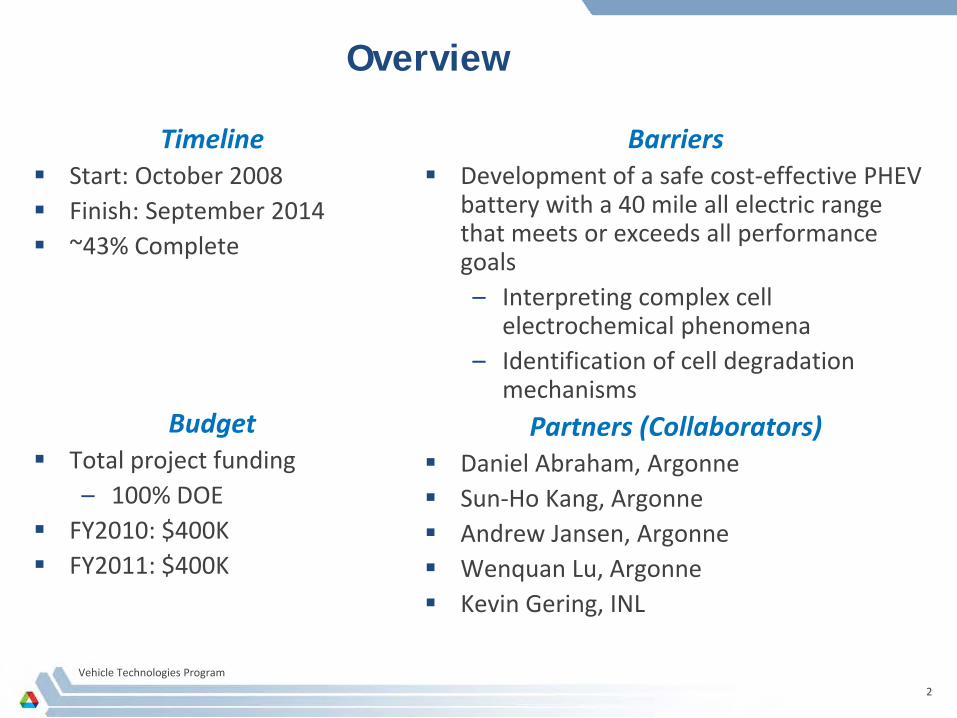
Timeline Start: October 2008 Finish: September 2014 ~43% Complete
Budget Total project funding
– 100% DOE FY2010: $400K FY2011: $400K
Barriers Development of a safe cost-effective PHEV
battery with a 40 mile all electric range that meets or exceeds all performance goals– Interpreting complex cell
electrochemical phenomena– Identification of cell degradation
mechanismsPartners (Collaborators)
Daniel Abraham, Argonne Sun-Ho Kang, Argonne Andrew Jansen, Argonne Wenquan Lu, Argonne Kevin Gering, INL

Vehicle Technologies Program
3
Objectives, Milestones, and Approach
The objective of this work is to correlate analytical diagnostic results with the electrochemical performance of advanced lithium-ion battery technologies for PHEV applications
– Link experimental efforts through electrochemical modeling studies
– Identify performance limitations and aging mechanisms
Milestones for this year:
– Initiate development of AC impedance two phase model (completed)
– Integrate SEI growth model into full cell model (completed)
Approach for electrochemical modeling activities is to build on earlier successful characterization and modeling studies in extending efforts to new PHEV technologies
– Expand and improve data base and modeling capabilities
Vehicle Technologies Program
4
Major Accomplishments and Technical Progress
Adopted new differential equation solver software (PSE gPROMS) to address several long term issues limiting model advancement
– Integrating complex dynamic interfaces into full cell Li-ion models to examine factors limiting performance and life
– Streamlining parameter estimation for new cell chemistries
– Implementing the AC impedance version of model with increasingly more intricate interfacial and bulk active particle phenomena
Implemented SEI growth model on the negative electrode to analyze capacity fade mechanisms including cross-interactions with positive electrode
Developed 3D electrochemical model to examine primary-secondary active particle microstructure and properties affecting impedance (e.g. porosity, surface area, electronic conductivity, electronic contacts, and electrolyte wetting)
Utilized electrochemical model to further examine electrode thickness limitations
Vehicle Technologies Program
5
Description of Electrochemical Model Phenomenological model developed for AC impedance and DC studies using same
constituent equations and parameters
Combines thermodynamic, kinetic, and interfacial effects with continuum based transport equations
Complex active material / electrolyte interfacial structure
– Film on active particles acts as an electrolyte layer with restricted diffusion and migration of lithium ions
– Surface layer of active particle inhibits the diffusion of lithium into the bulk active material
– Electrochemical reaction and double layer capacitance at film/layer interface
– Particle contact resistance and film capacitance
Volume averaged transport equations account for the composite electrode geometry
Lithium diffusion and possible phase change in active particles included, along with multiple particle fractions
The system of coupled differential equations are solved numerically
Model parameters determined independently (e.g. electrolyte parameters are supplied by Kevin Gering’s Advanced Electrolyte Model)
Vehicle Technologies Program
6
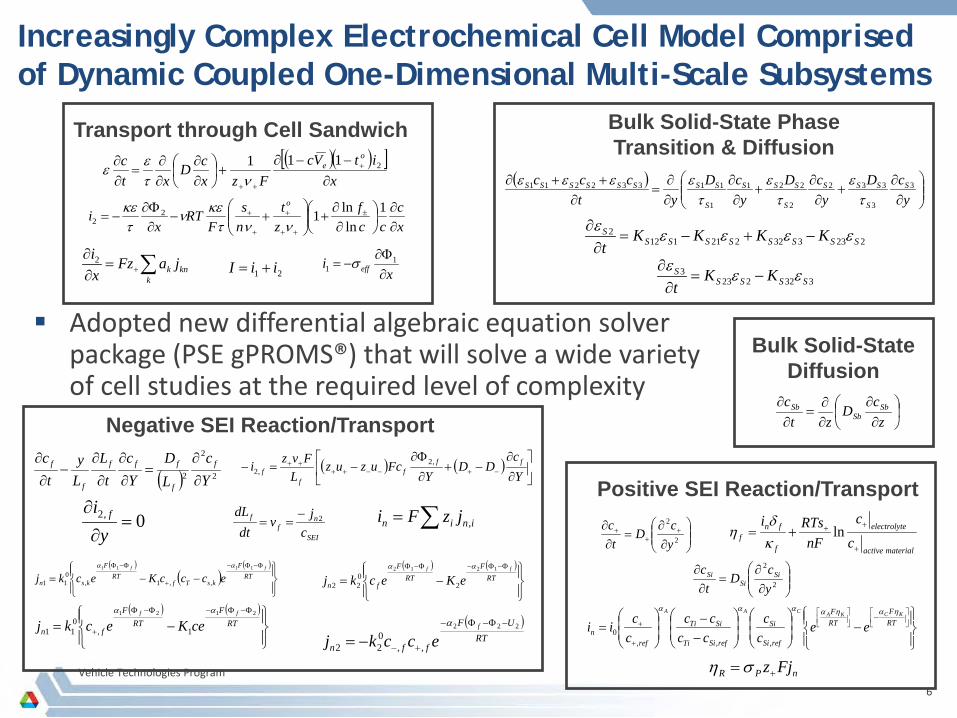
Increasingly Complex Electrochemical Cell Model Comprised of Dynamic Coupled One-Dimensional Multi-Scale Subsystems
( )( )[ ]x
itVcFzx
cDxt
c oe
∂−−∂
+
∂∂
∂∂
=∂∂ +
++
2111ντ
εε
xc
ccf
zt
ns
FRT
xi
o
∂∂
∂∂
+
+−
∂Φ∂
−= ±
++
+
+
+ 1ln
ln122 νντ
κεντκε
∑+=∂∂
kknk jaFz
xi2
21 iiI += xi eff ∂
Φ∂−= 1
1 σ
Transport through Cell Sandwich
materialactive
eelectrolyt
f
fnf c
c
nFRTsi
+
+++= lnκδ
η
∂∂
=∂∂ +
++
2
2
ycD
tc
∂∂
=∂∂
2
2
yc
Dt
c SiSi
Si
−
−−
=
−
+
+ RTF
RTF
refSi
Si
refSiTi
SiTi
refn
KCKACAA
eecc
cccc
ccii
ηαηαααα
,,,0
nPR Fjz+=ση
Positive SEI Reaction/Transport
∂∂
∂∂
=∂∂
zc
Dzt
c SbSb
Sb
Bulk Solid-StateDiffusion
( )
∂∂
+∂∂
+∂∂
∂∂
=∂
++∂y
cDy
cDy
cDyt
ccc S
S
SSS
S
SSS
S
SSSSSSSS 3
3
332
2
221
1
11332211
τε
τε
τεεεε
2233322211122
SSSSSSSSS KKKKt
εεεεε−+−=
∂∂
Bulk Solid-State PhaseTransition & Diffusion
3322233
SSSSS KKt
εεε−=
∂∂
Adopted new differential algebraic equation solver package (PSE gPROMS®) that will solve a wide variety of cell studies at the required level of complexity
Negative SEI Reaction/Transport
( ) ( )
−=Φ−Φ−Φ−Φ
+RT
FRT
F
fn
ff
ceKeckj2121
1,011
αα
SEI
nf
f
cjv
dtdL 2−
==
( ) 2
2
2 Yc
LD
Yc
tL
Ly
tc f
f
fff
f
f
∂
∂=
∂
∂
∂
∂−
∂
∂
( )RT
UF
ffn
f
ecckj222
,,022
−Φ−Φ−
+−−=α
∑= inin jzFi ,
( )( )
( )
−−=Φ−Φ−
+
Φ−Φ
RTF
ksTfRT
F
ksn
ff
ecccKeckj1111
,,1,011
αα ( ) ( )
−=Φ−Φ−Φ−Φ
RTF
RTF
fn
ff
eKeckj1212
2022
αα
( ) ( )
∂
∂−+
∂
Φ∂−=− −+−−++
++
Yc
DDY
FcuzuzL
Fvzi fff
ff
,2,2
0,2 =∂
∂
yi f
Vehicle Technologies Program
7
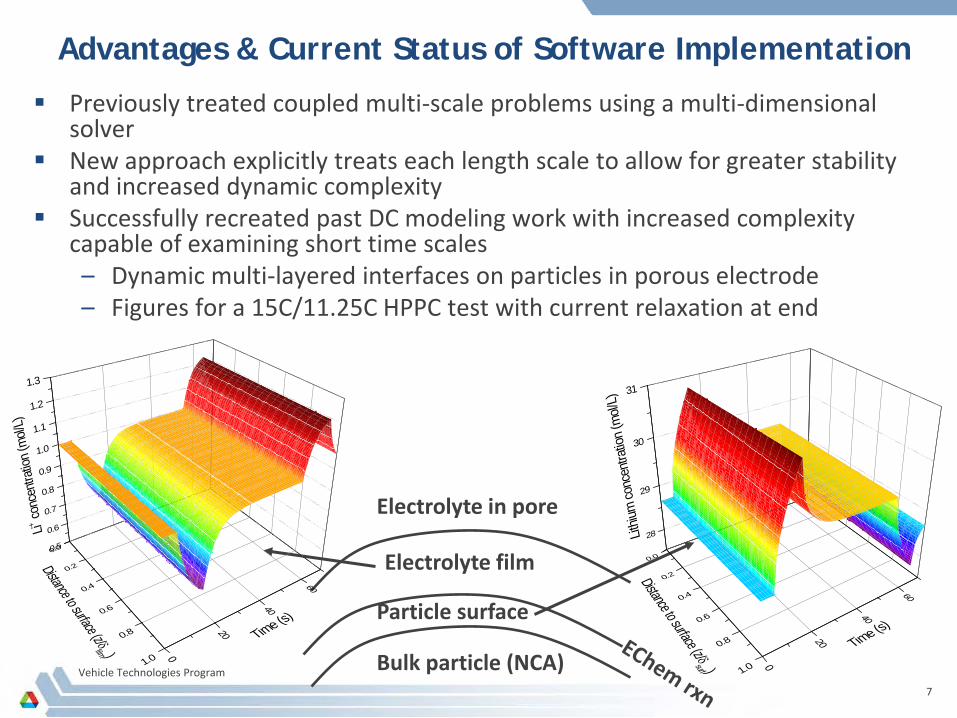
Advantages & Current Status of Software Implementation
Previously treated coupled multi-scale problems using a multi-dimensional solver
New approach explicitly treats each length scale to allow for greater stability and increased dynamic complexity
Successfully recreated past DC modeling work with increased complexity capable of examining short time scales– Dynamic multi-layered interfaces on particles in porous electrode– Figures for a 15C/11.25C HPPC test with current relaxation at end
Bulk particle (NCA)
Particle surface
Electrolyte film
Electrolyte in pore
0.0
0.2
0.4
0.6
0.8
1.0
0.5
0.6
0.7
0.8
0.9
1.0
1.1
1.2
1.3
0
20
40
60
Li+ co
ncen
tratio
n (mo
l/L)
Time (s)
Distance to surface (z/δfilm )
0.0
0.2
0.4
0.6
0.8
1.0
28
29
30
31
0
20
40
60
Lithiu
m co
ncen
tratio
n (mo
l/L)
Time (s)
Distance to surface (z/δsurf )
Vehicle Technologies Program
8
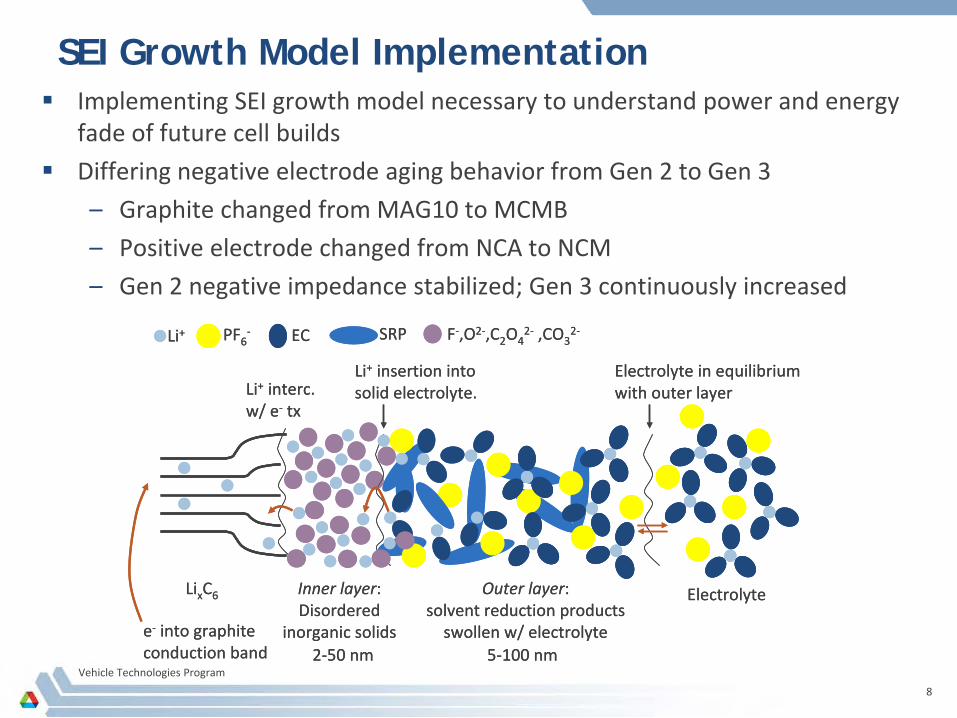
SEI Growth Model Implementation Implementing SEI growth model necessary to understand power and energy
fade of future cell builds
Differing negative electrode aging behavior from Gen 2 to Gen 3
– Graphite changed from MAG10 to MCMB
– Positive electrode changed from NCA to NCM
– Gen 2 negative impedance stabilized; Gen 3 continuously increased
e- into graphiteconduction band
LixC6 Inner layer:Disordered
inorganic solids
Outer layer: solvent reduction products
swollen w/ electrolyte
Li+ EC
Electrolyte
PF6-
Li+ interc.w/ e- tx
Li+ insertion into solid electrolyte.
Electrolyte in equilibrium with outer layer
SRP
2-50 nm 5-100 nm
F-,O2-,C2O42- ,CO3
2-
Vehicle Technologies Program
9
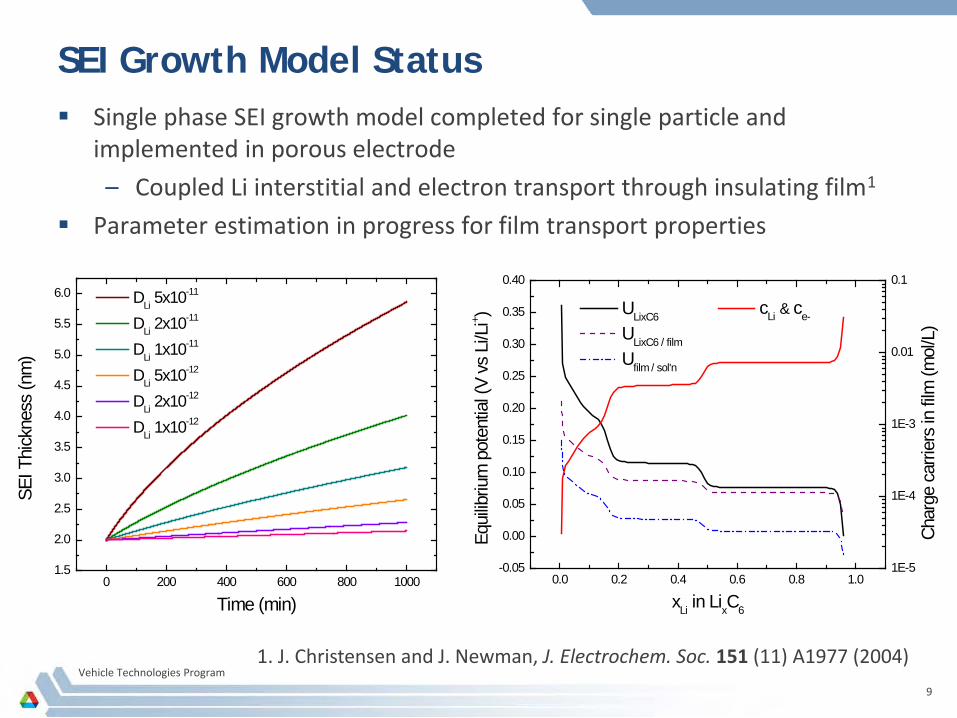
SEI Growth Model Status Single phase SEI growth model completed for single particle and
implemented in porous electrode
– Coupled Li interstitial and electron transport through insulating film1
Parameter estimation in progress for film transport properties
0.0 0.2 0.4 0.6 0.8 1.0-0.05
0.00
0.05
0.10
0.15
0.20
0.25
0.30
0.35
0.40
1E-5
1E-4
1E-3
0.01
0.1
Equi
libriu
m p
oten
tial (
V vs
Li/L
i+ )
xLi in LixC6
ULixC6 ULixC6 / film
Ufilm / sol'n
Cha
rge
carri
ers
in fi
lm (m
ol/L
)
cLi & ce-
0 200 400 600 800 10001.5
2.0
2.5
3.0
3.5
4.0
4.5
5.0
5.5
6.0
SEI T
hick
ness
(nm
)
Time (min)
DLi 5x10-11
DLi 2x10-11
DLi 1x10-11
DLi 5x10-12
DLi 2x10-12
DLi 1x10-12
1. J. Christensen and J. Newman, J. Electrochem. Soc. 151 (11) A1977 (2004)
Vehicle Technologies Program
10
50 nm
Surface Film
Oxide
200 nm
Oxide
DF
BF
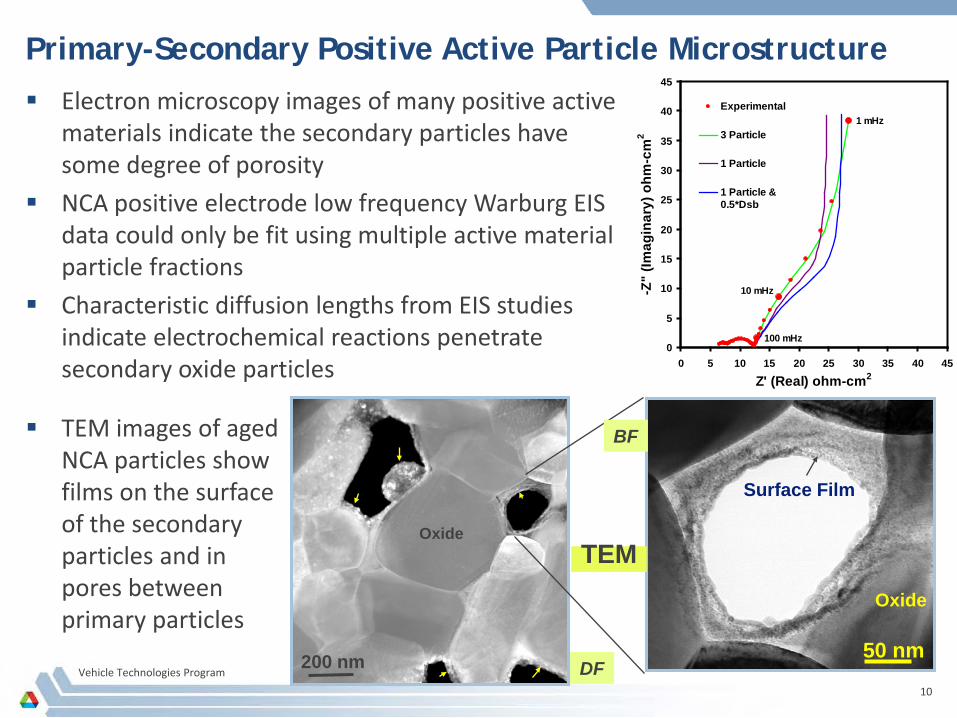
Primary-Secondary Positive Active Particle Microstructure
TEM
TEM images of aged NCA particles show films on the surface of the secondary particles and in pores between primary particles
Electron microscopy images of many positive active materials indicate the secondary particles have some degree of porosity
NCA positive electrode low frequency Warburg EIS data could only be fit using multiple active material particle fractions
Characteristic diffusion lengths from EIS studies indicate electrochemical reactions penetrate secondary oxide particles
100 mHz
10 mHz
1 mHz
0
5
10
15
20
25
30
35
40
45
0 5 10 15 20 25 30 35 40 45
Z' (Real) ohm-cm2
-Z"
(Imag
inar
y) o
hm-c
m2
Experimental
3 Particle
1 Particle
1 Particle &0.5*Dsb
Vehicle Technologies Program
11
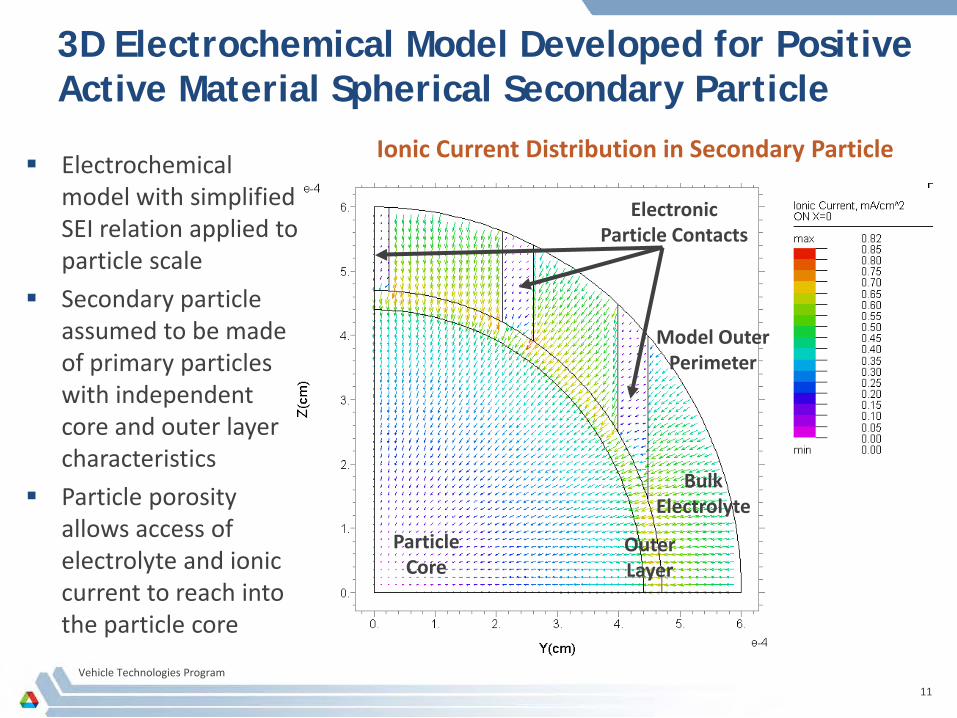
3D Electrochemical Model Developed for Positive Active Material Spherical Secondary Particle
Electrochemical model with simplified SEI relation applied to particle scale
Secondary particle assumed to be made of primary particles with independent core and outer layer characteristics
Particle porosity allows access of electrolyte and ionic current to reach into the particle core
ParticleCore
Ionic Current Distribution in Secondary Particle
OuterLayer
BulkElectrolyte
Model OuterPerimeter
ElectronicParticle Contacts

Vehicle Technologies Program
12
Particle Properties Established and Impedance Terms Defined to Assess Particle Performance
Estimated Change in Particle Characteristics
0
1
2
3
4
5
0.0 0.1 0.2 0.3 0.4 0.5 0.6
Particle Porosity
Surf
ace
Are
a, m
2 /g
0.5
1.0
1.5
2.0
2.5
3.0
Tap
Den
sity
, g/c
m3
Surface Area
Tap density
Two specific impedance terms are used to describe particle performance: area (ASI), based on particle active area (i.e. not the electrode area), and particle mass (MSI)
When the ratio of active area to mass is fixed then both impedance effects behave similarly, as is the case for the change in particle impedance with applied voltage
Wealth of diagnostic studies and associated model development for NCA active material with Gen 2 electrolyte utilized to create baseline parameter set and particle characteristics
Simple relations developed for active material surface area and tap density with changes in particle porosity
Particle Impedance, 10s Discharge Pulse
280
300
320
340
360
380
0 100 200 300 400
Applied Overvoltage, mV
ASI
, ohm
cm
2
0.075
0.080
0.085
0.090
0.095
0.100M
SI, o
hm g
Area Specific Impedance (ASI)
Mass Specific Impedance (MSI)
Vehicle Technologies Program
13
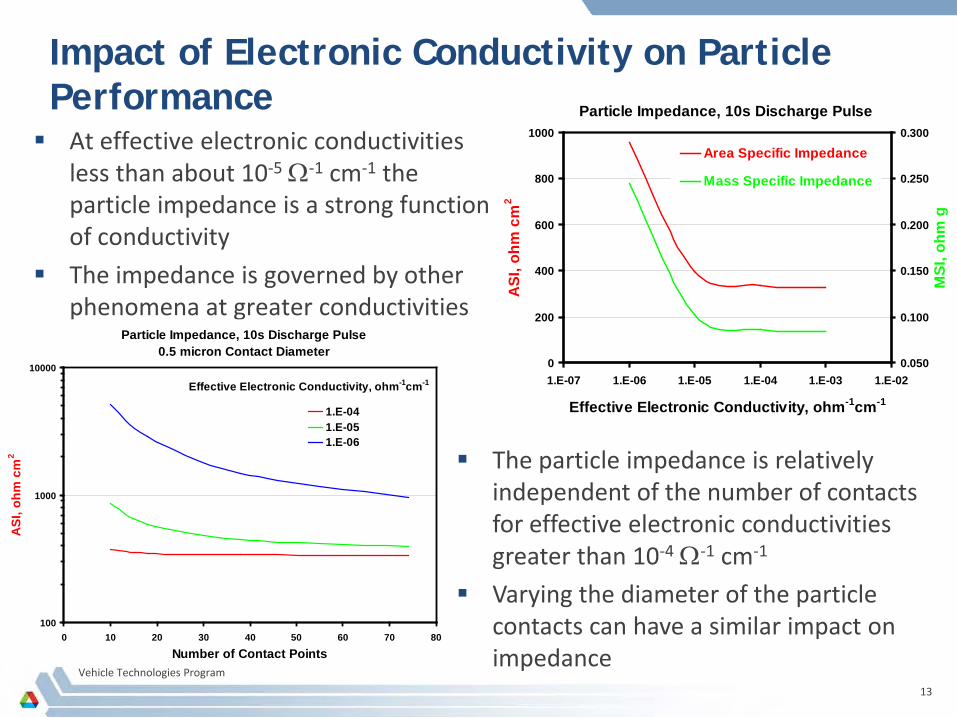
Impact of Electronic Conductivity on Particle Performance At effective electronic conductivities
less than about 10-5 Ω-1 cm-1 the particle impedance is a strong function of conductivity
The impedance is governed by other phenomena at greater conductivities
Particle Impedance, 10s Discharge Pulse
0
200
400
600
800
1000
1.E-07 1.E-06 1.E-05 1.E-04 1.E-03 1.E-02
Effective Electronic Conductivity, ohm-1cm-1
ASI
, ohm
cm
2
0.050
0.100
0.150
0.200
0.250
0.300
MSI
, ohm
g
Area Specific Impedance
Mass Specific Impedance
Particle Impedance, 10s Discharge Pulse0.5 micron Contact Diameter
100
1000
10000
0 10 20 30 40 50 60 70 80
Number of Contact Points
ASI
, ohm
cm
2
1.E-041.E-051.E-06
Effective Electronic Conductivity, ohm-1cm-1
The particle impedance is relatively independent of the number of contacts for effective electronic conductivities greater than 10-4 Ω-1 cm-1
Varying the diameter of the particle contacts can have a similar impact on impedance
Vehicle Technologies Program
14
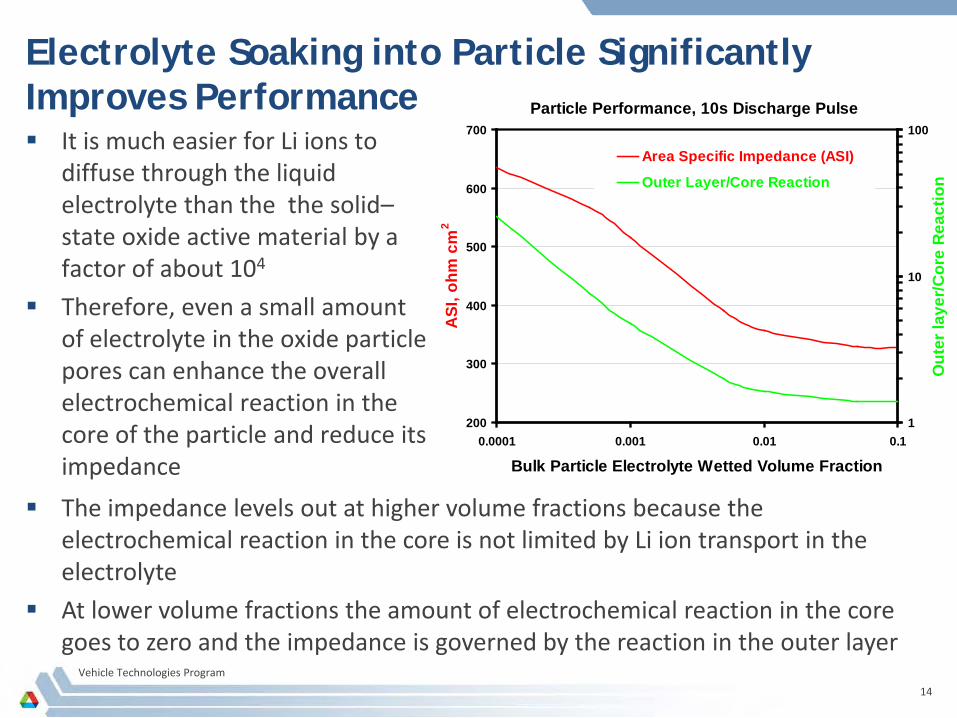
Electrolyte Soaking into Particle Significantly Improves Performance Particle Performance, 10s Discharge Pulse
200
300
400
500
600
700
0.0001 0.001 0.01 0.1
Bulk Particle Electrolyte Wetted Volume FractionA
SI, o
hm c
m2
1
10
100
Out
er la
yer/C
ore
Rea
ctio
n
Area Specific Impedance (ASI)
Outer Layer/Core Reaction
It is much easier for Li ions to diffuse through the liquid electrolyte than the the solid–state oxide active material by a factor of about 104
Therefore, even a small amount of electrolyte in the oxide particle pores can enhance the overall electrochemical reaction in the core of the particle and reduce its impedance
The impedance levels out at higher volume fractions because the electrochemical reaction in the core is not limited by Li ion transport in the electrolyte
At lower volume fractions the amount of electrochemical reaction in the core goes to zero and the impedance is governed by the reaction in the outer layer
Vehicle Technologies Program
15
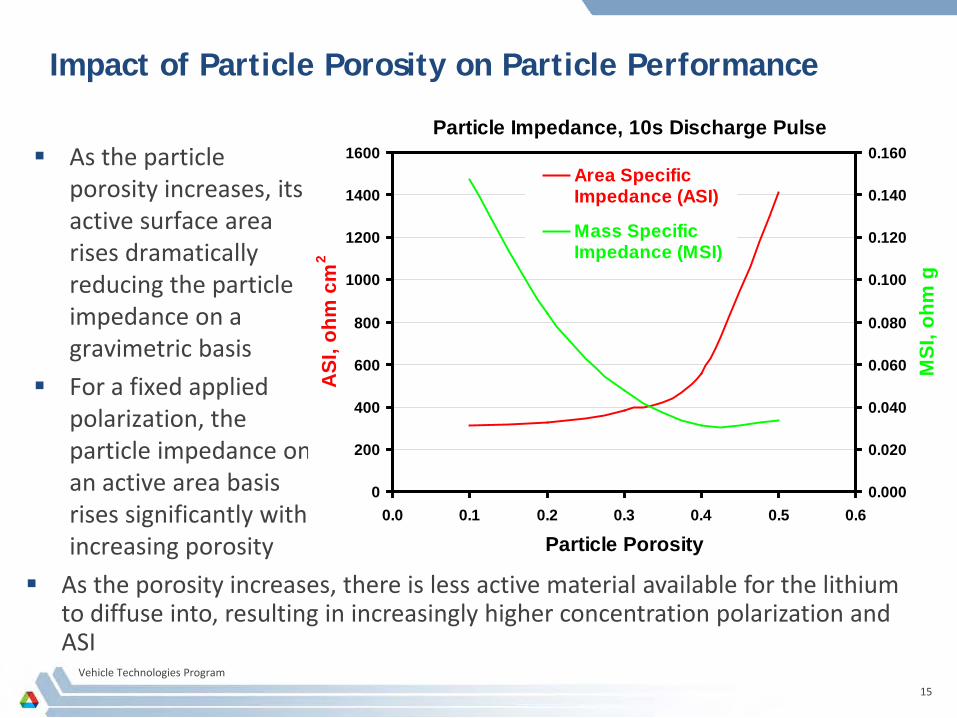
Impact of Particle Porosity on Particle Performance
As the particle porosity increases, its active surface area rises dramatically reducing the particle impedance on a gravimetric basis
For a fixed applied polarization, the particle impedance on an active area basis rises significantly with increasing porosity
Particle Impedance, 10s Discharge Pulse
0
200
400
600
800
1000
1200
1400
1600
0.0 0.1 0.2 0.3 0.4 0.5 0.6
Particle Porosity
ASI
, ohm
cm
2
0.000
0.020
0.040
0.060
0.080
0.100
0.120
0.140
0.160
MSI
, ohm
g
Area SpecificImpedance (ASI)
Mass SpecificImpedance (MSI)
As the porosity increases, there is less active material available for the lithium to diffuse into, resulting in increasingly higher concentration polarization and ASI
Vehicle Technologies Program
16
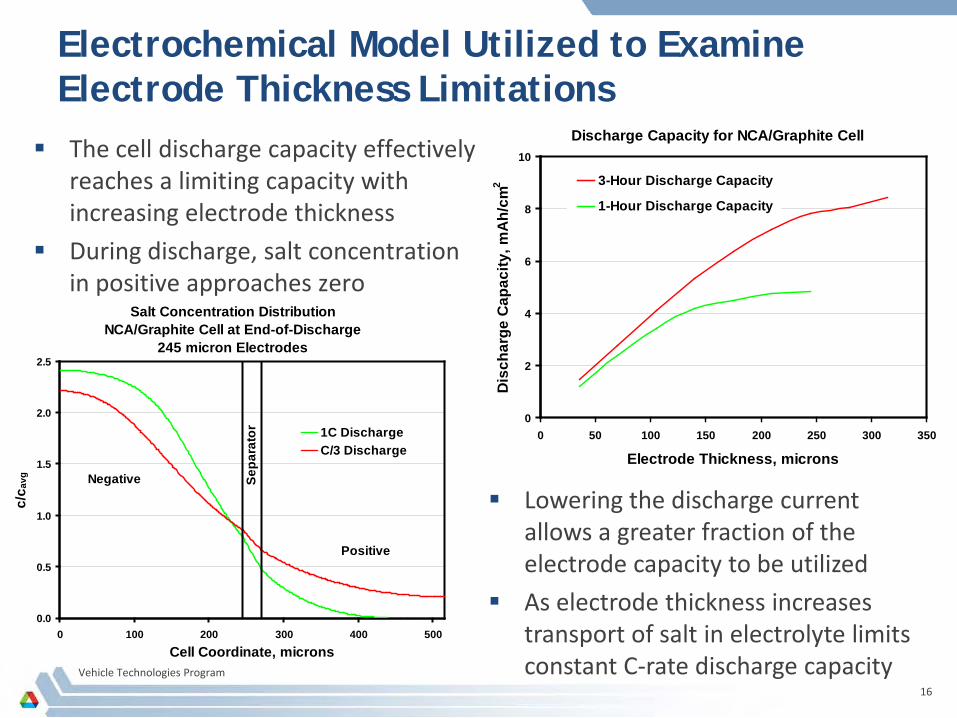
Electrochemical Model Utilized to Examine Electrode Thickness Limitations
The cell discharge capacity effectively reaches a limiting capacity with increasing electrode thickness
During discharge, salt concentration in positive approaches zero
Discharge Capacity for NCA/Graphite Cell
0
2
4
6
8
10
0 50 100 150 200 250 300 350
Electrode Thickness, microns
Dis
char
ge C
apac
ity, m
Ah/
cm2 3-Hour Discharge Capacity
1-Hour Discharge Capacity
Salt Concentration DistributionNCA/Graphite Cell at End-of-Discharge
245 micron Electrodes
0.0
0.5
1.0
1.5
2.0
2.5
0 100 200 300 400 500
Cell Coordinate, microns
c/c a
vg
1C DischargeC/3 Discharge
Negative
Positive
Sepa
rato
r
Lowering the discharge current allows a greater fraction of the electrode capacity to be utilized
As electrode thickness increases transport of salt in electrolyte limits constant C-rate discharge capacity
Vehicle Technologies Program
17
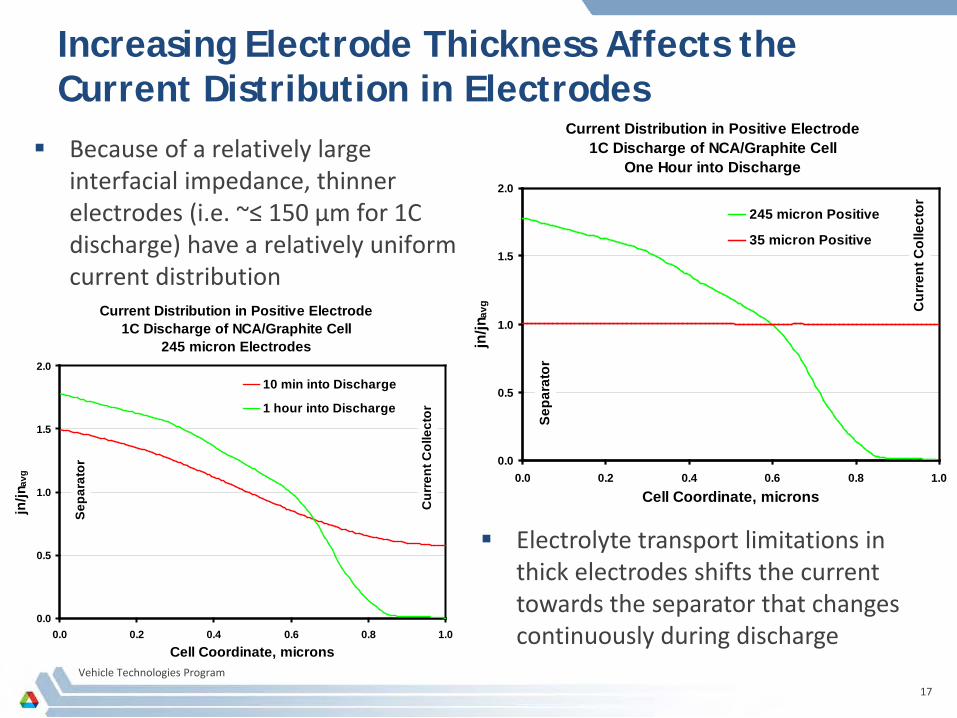
Increasing Electrode Thickness Affects the Current Distribution in Electrodes
Because of a relatively large interfacial impedance, thinner electrodes (i.e. ~≤ 150 µm for 1C discharge) have a relatively uniform current distribution
Current Distribution in Positive Electrode1C Discharge of NCA/Graphite Cell
245 micron Electrodes
0.0
0.5
1.0
1.5
2.0
0.0 0.2 0.4 0.6 0.8 1.0
Cell Coordinate, microns
jn/jn
avg
10 min into Discharge
1 hour into Discharge
Sepa
rato
r
Cur
rent
Col
lect
or
Current Distribution in Positive Electrode1C Discharge of NCA/Graphite Cell
One Hour into Discharge
0.0
0.5
1.0
1.5
2.0
0.0 0.2 0.4 0.6 0.8 1.0
Cell Coordinate, micronsjn
/jnav
g
245 micron Positive
35 micron Positive
Sepa
rato
r
Cur
rent
Col
lect
or
Electrolyte transport limitations in thick electrodes shifts the current towards the separator that changes continuously during discharge
Vehicle Technologies Program
18
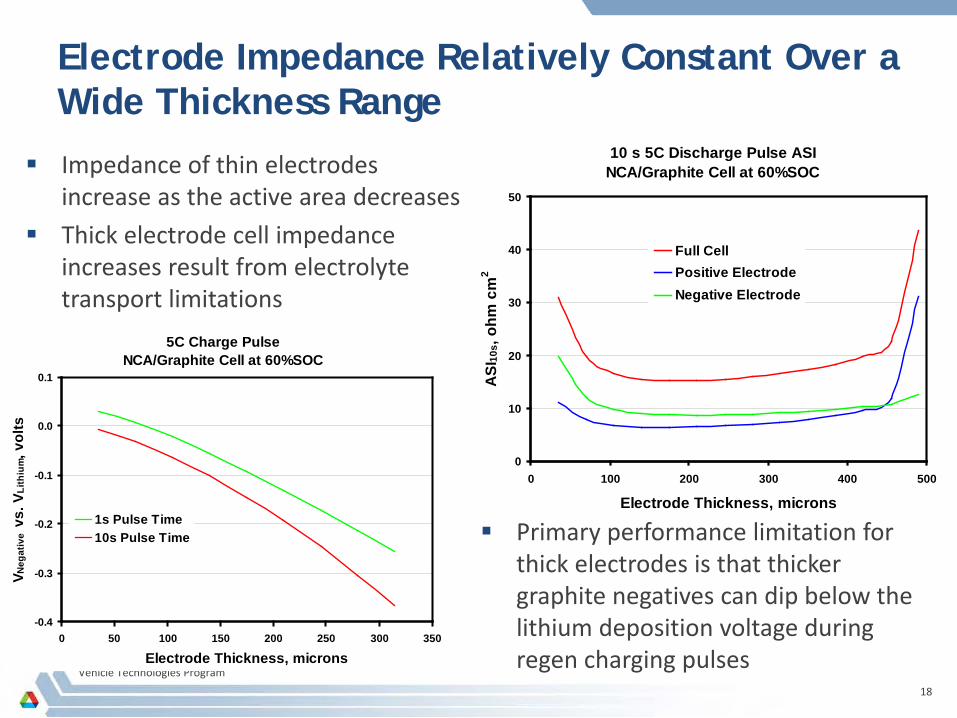
Electrode Impedance Relatively Constant Over a Wide Thickness Range
10 s 5C Discharge Pulse ASINCA/Graphite Cell at 60%SOC
0
10
20
30
40
50
0 100 200 300 400 500
Electrode Thickness, micronsA
SI10
s, oh
m c
m2
Full CellPositive ElectrodeNegative Electrode
5C Charge PulseNCA/Graphite Cell at 60%SOC
-0.4
-0.3
-0.2
-0.1
0.0
0.1
0 50 100 150 200 250 300 350
Electrode Thickness, microns
V Neg
ativ
e v
s. V
Lith
ium, v
olts
1s Pulse Time10s Pulse Time Primary performance limitation for
thick electrodes is that thicker graphite negatives can dip below the lithium deposition voltage during regen charging pulses
Impedance of thin electrodes increase as the active area decreases
Thick electrode cell impedance increases result from electrolyte transport limitations
Vehicle Technologies Program
19
Future Plans Advance development of PHEV focused electrochemical models using new
differential algebraic equation solver package (PSE gPROMS)
– Continue conversion of existing models
– Develop full numerical AC impedance version
– Utilize parameter fitting routines in new software to examine advanced PHEV couples
Continue development electrochemical models directed towards examining capacity fade phenomena
– Implement cation accelerated growth of SEI (e.g. Mn2+, Li+, etc)
– Implement dual layer SEI growth
– Address cycle and calendar aging tests (large time scales)
Continue support of other ABR projects
Milestones for next year
– Complete conversion of existing models
– Complete implementation and initial testing of full SEI growth model
– Initiate parameter estimation of high-energy NMC/graphite system
Vehicle Technologies Program
20
Summary The objective of this work is to correlate analytical diagnostic results
with the electrochemical performance of advanced lithium-ion battery technologies for PHEV applications
Approach for electrochemical modeling activities is to build on earlier successful characterization and modeling studies in extending efforts to new PHEV technologies
Technical Accomplishments– Adopted new differential equation solver software– Implemented SEI growth model on the negative electrode to
analyze capacity fade mechanisms– Developed 3D electrochemical model to examine primary-
secondary active particle microstructure– Utilized electrochemical model to further examine electrode
thickness limitations Future plans include the continued development of PHEV focused
electrochemical models, further development of models examining capacity fade phenomena, and support of other ABR projects
Vehicle Technologies Program
21
Support for this work from DOE-EERE, Office of Vehicle Technologies is gratefully acknowledged
- David Howell- Peter Faguy
Acknowledgment