Embed Size (px)
Citation preview
Electrochemistry Cell Model
Kevin G. Gallagher and Dennis Dees Chemical Sciences and Engineering Division May 14-18th, 2012 Vehicle Technologies Program Annual Merit Review and Peer Evaluation Meeting
Washington D.C. Project ID# ES031
This presentation does not contain any proprietary, confidential, or otherwise restricted information
Vehicle Technologies Program
2
Overview
Timeline Start: October 2008 Finish: September 2012 Future: Will continue to
support ABR programs – Voltage fade – Electrochemical couples – ABR facilities
Budget
Total project funding – 100% DOE
FY2011: $400K FY2012: $400K
Barriers Development of a safe cost-effective PHEV
battery with a 40 mile all electric range that meets or exceeds all performance goals – Interpreting complex cell
electrochemical phenomena – Identification of cell degradation
mechanisms Partners (Collaborators)
Daniel Abraham, Argonne Wenquan Lu, Argonne Andrew Jansen, Argonne Kevin Gering, INL
Vehicle Technologies Program
3
Objectives, Milestones, and Approach
The objective of this work is to correlate analytical diagnostic results with the electrochemical performance of advanced lithium-ion battery technologies for PHEV applications – Link experimental efforts through electrochemical modeling – Identify performance limitations and aging mechanisms
Milestones for this year: – Complete conversion of existing models into gPROMS (Complete) – Initiate parameter estimation of LMR-NMC cathodes (Complete) – Complete SEI growth model (Delayed due to focus on cathode)
Approach for electrochemical modeling activities is to build on earlier successful characterization and modeling studies in extending efforts to new PHEV technologies – Expand and improve database and modeling capabilities
Vehicle Technologies Program
4
Major Accomplishments and Technical Progress
Initiated model development and parameter refinement of LMR-NMC cathode materials, xLi2MnO3(1-x)LiMO2
Initial fits of Toda HE5050 Cathode AC Impedance Simulation of most likely sources of impedance growth Measurement and early model development of
– Hysteresis and path dependence in open-circuit voltage curve – Slow relaxation process observed in GITT studies
Completed conversion of models to more advanced differential equation solver software (PSE gPROMS)
Vehicle Technologies Program
5
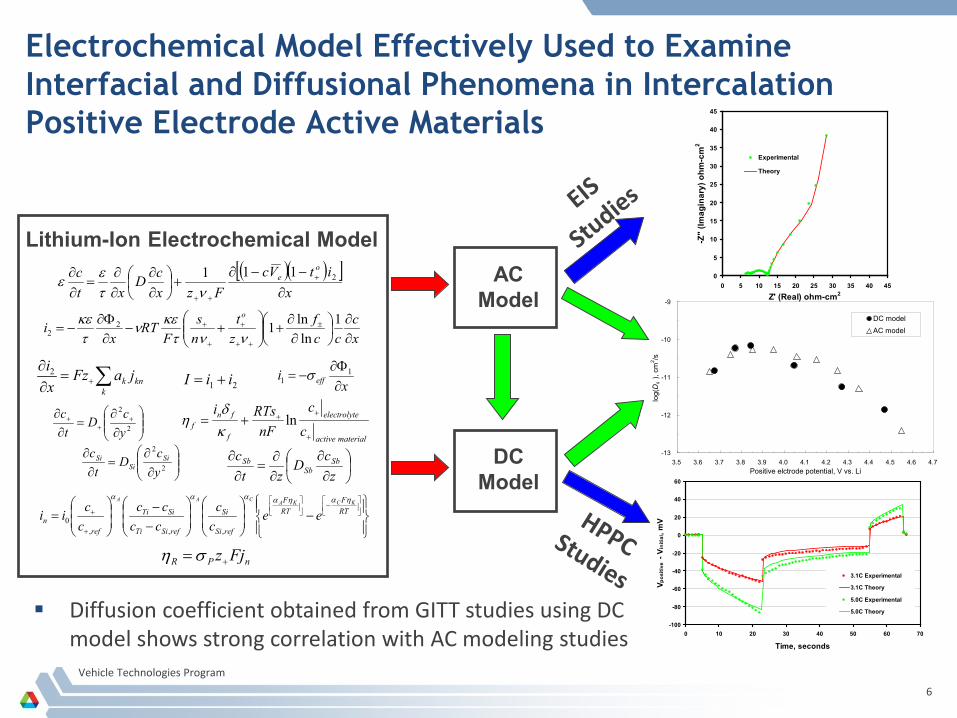
Description of Electrochemical Model Phenomenological model developed for AC impedance and DC studies using same
constituent equations and parameters Combines thermodynamic, kinetic, and interfacial effects with continuum based
transport equations Complex active material / electrolyte interfacial structure
– Film on active particles acts as an electrolyte layer with restricted diffusion and migration of lithium ions
– Surface layer of active particle inhibits the diffusion of lithium into the bulk active material
– Electrochemical reaction and double layer capacitance at film/layer interface – Particle contact resistance and film capacitance
Volume averaged transport equations account for the composite electrode geometry Lithium diffusion and possible phase change in active particles included, along with
multiple particle fractions The system of coupled differential equations are solved numerically Model parameters determined independently (e.g. electrolyte parameters are
supplied by Kevin Gering’s Advanced Electrolyte Model)
Vehicle Technologies Program
6
0
5
10
15
20
25
30
35
40
45
0 5 10 15 20 25 30 35 40 45
Z' (Real) ohm-cm2
-Z"
(Imag
inar
y) o
hm-c
m2
Experimental
Theory
Electrochemical Model Effectively Used to Examine Interfacial and Diffusional Phenomena in Intercalation Positive Electrode Active Materials
( )( )[ ]x
itVcFzx
cDxt
c oe
∂−−∂
+
∂∂
∂∂
=∂∂ +
++
2111ντ
εε
xc
ccf
zt
ns
FRT
xi
o
∂∂
∂∂
+
+−
∂Φ∂
−= ±
++
+
+
+ 1ln
ln122 νντ
κεντκε
∑+=∂∂
kknk jaFz
xi2
21 iiI += xi eff ∂
Φ∂−= 1
1 σ
materialactive
eelectrolyt
f
fnf c
c
nFRTsi
+
+++= lnκδ
η
∂∂
=∂∂ +
++
2
2
ycD
tc
∂∂
=∂∂
2
2
yc
Dt
c SiSi
Si
∂∂
∂∂
=∂∂
zc
Dzt
c SbSb
Sb
−
−−
=
−
+
+ RTF
RTF
refSi
Si
refSiTi
SiTi
refn
KCKACAA
eecc
cccc
ccii
ηαηαααα
,,,0
nPR Fjz+=ση
Lithium-Ion Electrochemical Model
-100
-80
-60
-40
-20
0
20
40
60
0 10 20 30 40 50 60 70
Time, seconds
V pos
itive
- V i
nitia
l, m
V
3.1C Experimental
3.1C Theory
5.0C Experimental
5.0C Theory
AC Model
DC Model
-13
-12
-11
-10
-9
3.5 3.6 3.7 3.8 3.9 4.0 4.1 4.2 4.3 4.4 4.5 4.6 4.7Positive elctrode potential, V vs. Li
log(
Ds
), cm
2 /s
DC modelAC model
Diffusion coefficient obtained from GITT studies using DC model shows strong correlation with AC modeling studies
Focus of current work: Positive Electrode
Electrochemical couples ABR-1 and ABR-2 use graphite and LMR-NMC, xLi2MnO3(1-x)LiMO2
LMR-NMC is currently the least understood of the couple Initial diagnostic effort has singled out LMR-NMC cathode
– Largest source of impedance rise leading to capacity loss at relevant current densities
– Voltage fade: change in open-circuit voltage (OCV) with aging – Instability of the electrolyte at the oxidizing potentials
Path forward – Understand OCV function after activation – Fit parameters with GITT and EIS (DC and AC models) – Inform aging studies by exercising model
Vehicle Technologies Program
7
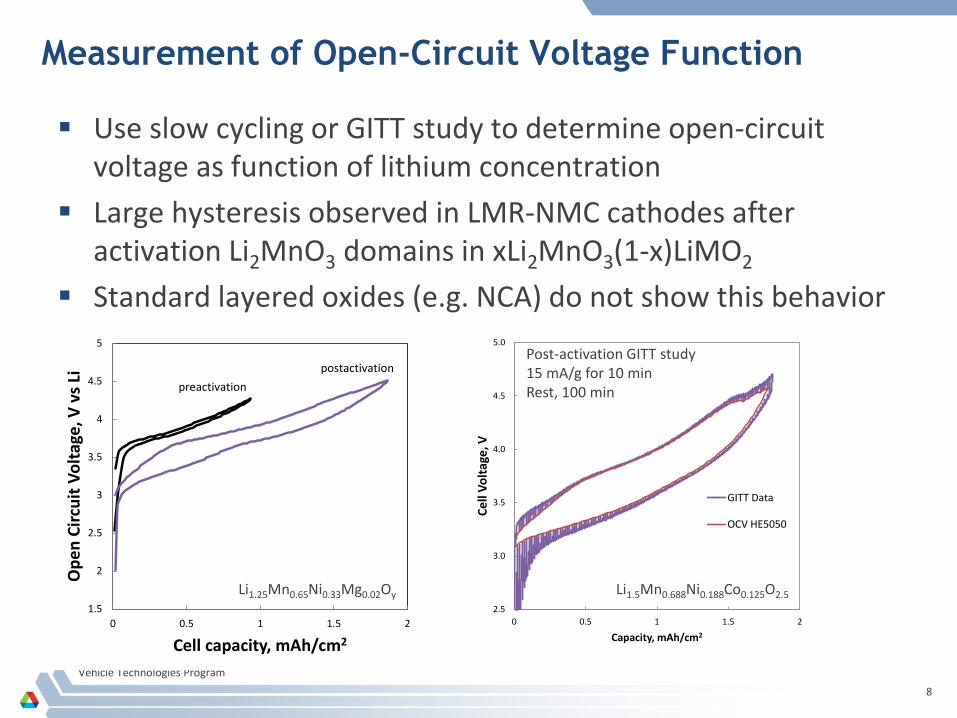
Use slow cycling or GITT study to determine open-circuit voltage as function of lithium concentration
Large hysteresis observed in LMR-NMC cathodes after activation Li2MnO3 domains in xLi2MnO3(1-x)LiMO2
Standard layered oxides (e.g. NCA) do not show this behavior
2.5
3.0
3.5
4.0
4.5
5.0
0 0.5 1 1.5 2
Cell
Volta
ge, V
Capacity, mAh/cm2
GITT Data
OCV HE5050
Post-activation GITT study 15 mA/g for 10 min Rest, 100 min
Measurement of Open-Circuit Voltage Function
Vehicle Technologies Program
8
1.5
2
2.5
3
3.5
4
4.5
5
0 0.5 1 1.5 2
Ope
n Ci
rcui
t Vol
tage
, V v
s Li
Cell capacity, mAh/cm2
preactivationpostactivation
Li1.25Mn0.65Ni0.33Mg0.02Oy Li1.5Mn0.688Ni0.188Co0.125O2.5
1.5
2
2.5
3
3.5
4
4.5
5
0 0.5 1 1.5 2
Ope
n Ci
rcui
t Vol
tage
, V v
s Li
Cell capacity, mAh/cm2
1.5
2
2.5
3
3.5
4
4.5
5
0 0.5 1 1.5 2
Ope
n Ci
rcui
t Vol
tage
, V v
s Li
Cell capacity, mAh/cm2
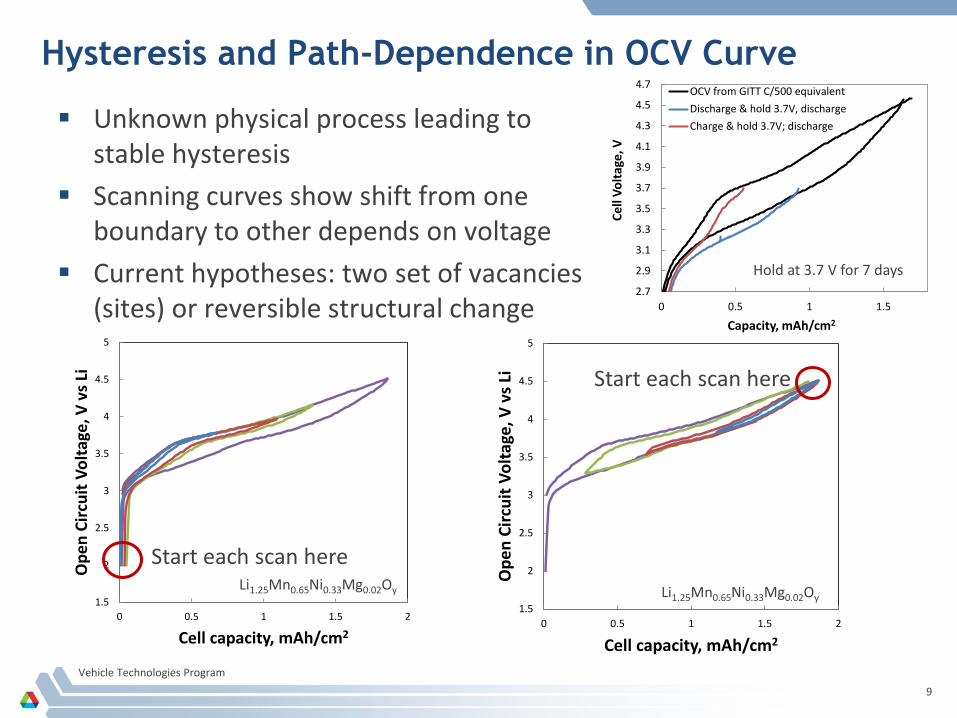
Hysteresis and Path-Dependence in OCV Curve
Unknown physical process leading to stable hysteresis
Scanning curves show shift from one boundary to other depends on voltage
Current hypotheses: two set of vacancies (sites) or reversible structural change
Vehicle Technologies Program
9
Start each scan here
Start each scan here
2.7
2.9
3.1
3.3
3.5
3.7
3.9
4.1
4.3
4.5
4.7
0 0.5 1 1.5
Cell
Volta
ge, V
Capacity, mAh/cm2
OCV from GITT C/500 equivalentDischarge & hold 3.7V, dischargeCharge & hold 3.7V; discharge
Li1.25Mn0.65Ni0.33Mg0.02Oy Li1.25Mn0.65Ni0.33Mg0.02Oy
Hold at 3.7 V for 7 days
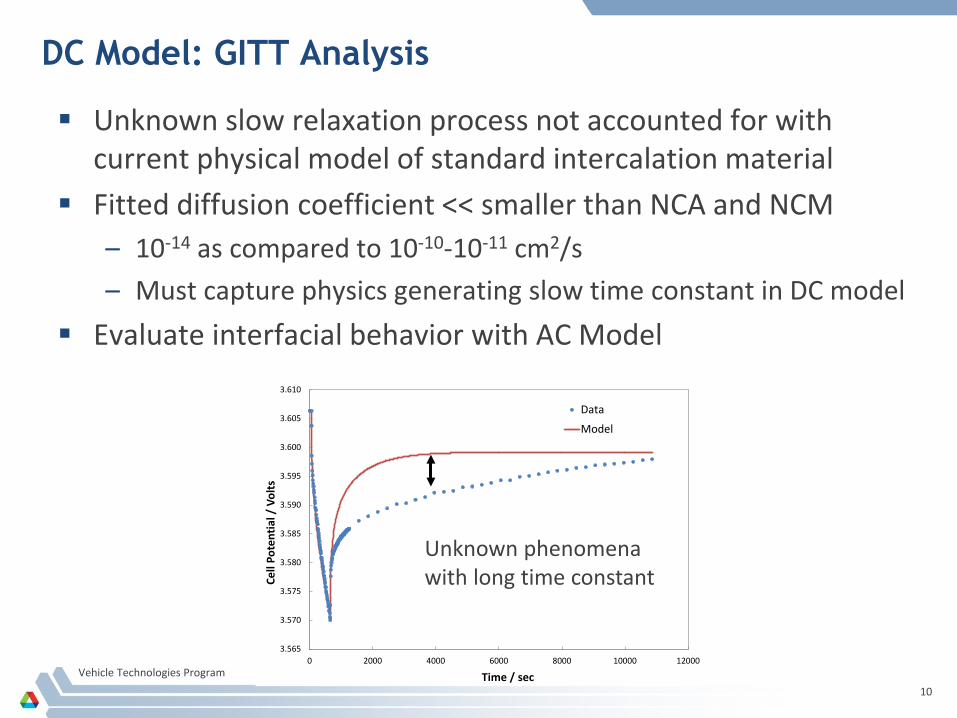
DC Model: GITT Analysis
Unknown slow relaxation process not accounted for with current physical model of standard intercalation material
Fitted diffusion coefficient << smaller than NCA and NCM – 10-14 as compared to 10-10-10-11 cm2/s – Must capture physics generating slow time constant in DC model
Evaluate interfacial behavior with AC Model
Vehicle Technologies Program
10
3.565
3.570
3.575
3.580
3.585
3.590
3.595
3.600
3.605
3.610
0 2000 4000 6000 8000 10000 12000
Cell
Pote
ntia
l / V
olts
Time / sec
Data
Model
Unknown phenomena with long time constant
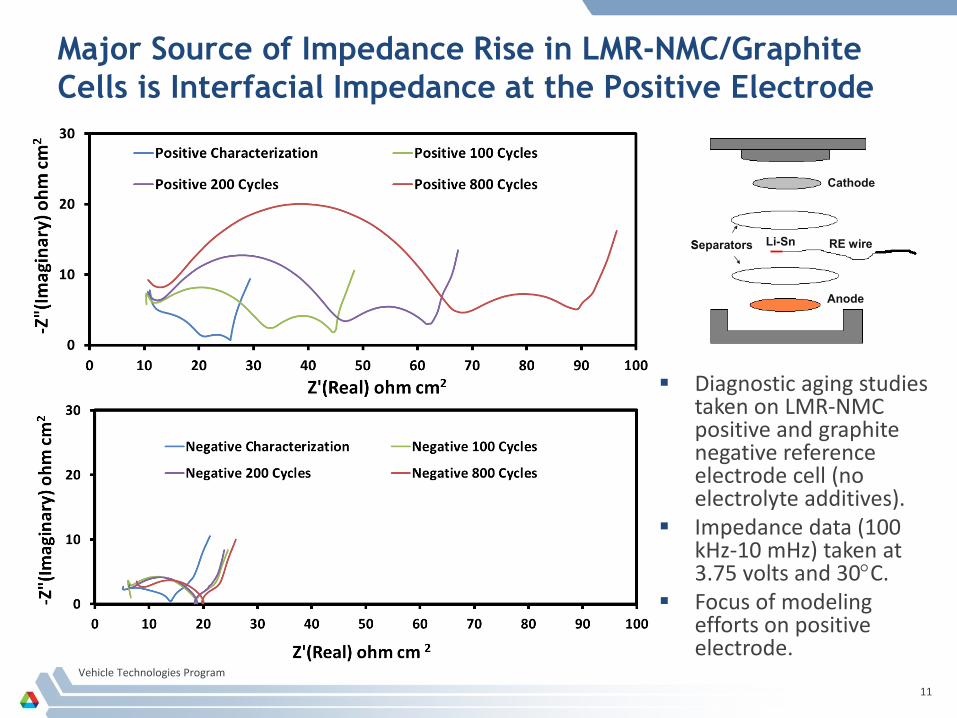
Major Source of Impedance Rise in LMR-NMC/Graphite Cells is Interfacial Impedance at the Positive Electrode
Vehicle Technologies Program
11
Anode
Cathode
RE wireLi-SnSeparators
Anode
Cathode
RE wireLi-SnSeparators
Diagnostic aging studies taken on LMR-NMC positive and graphite negative reference electrode cell (no electrolyte additives).
Impedance data (100 kHz-10 mHz) taken at 3.75 volts and 30°C.
Focus of modeling efforts on positive electrode.
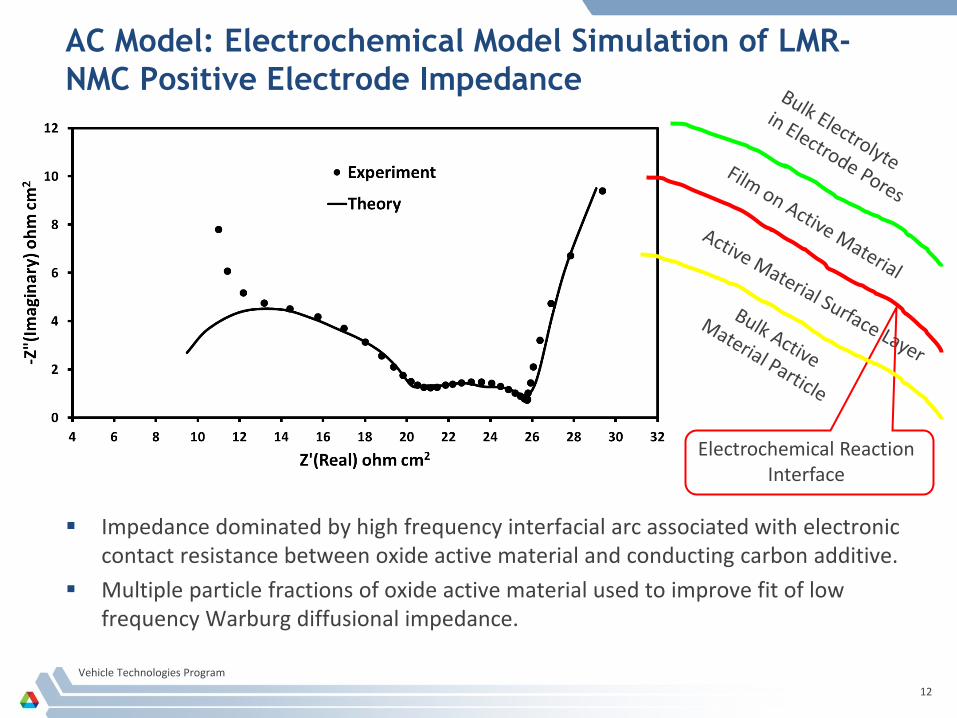
AC Model: Electrochemical Model Simulation of LMR-NMC Positive Electrode Impedance
Impedance dominated by high frequency interfacial arc associated with electronic contact resistance between oxide active material and conducting carbon additive.
Multiple particle fractions of oxide active material used to improve fit of low frequency Warburg diffusional impedance.
Vehicle Technologies Program
12
Electrochemical Reaction Interface
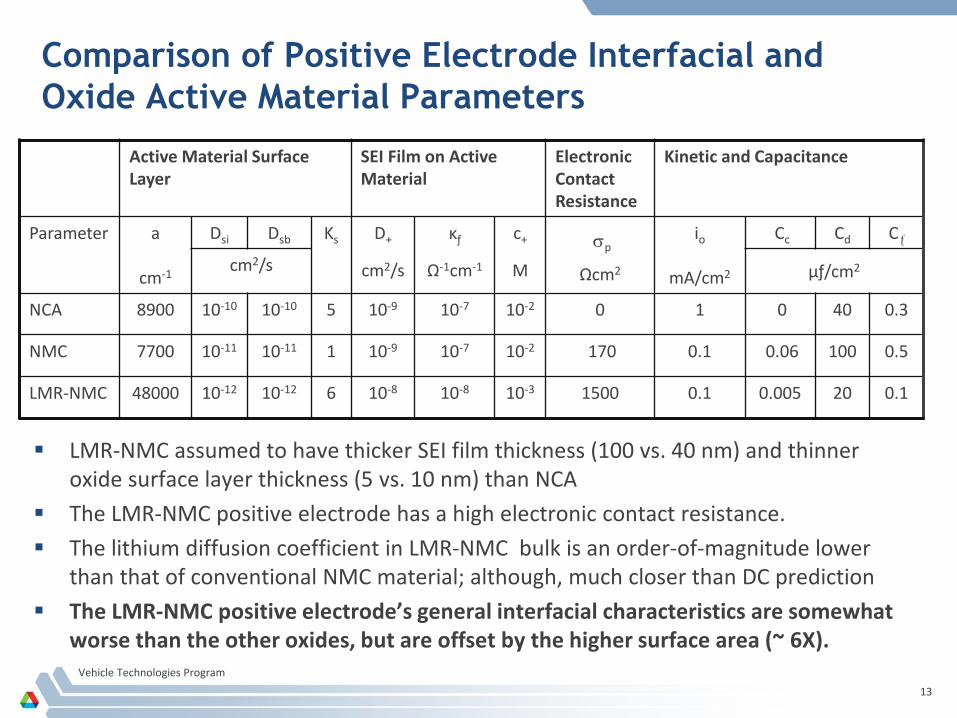
Comparison of Positive Electrode Interfacial and Oxide Active Material Parameters
LMR-NMC assumed to have thicker SEI film thickness (100 vs. 40 nm) and thinner oxide surface layer thickness (5 vs. 10 nm) than NCA
The LMR-NMC positive electrode has a high electronic contact resistance. The lithium diffusion coefficient in LMR-NMC bulk is an order-of-magnitude lower
than that of conventional NMC material; although, much closer than DC prediction The LMR-NMC positive electrode’s general interfacial characteristics are somewhat
worse than the other oxides, but are offset by the higher surface area (~ 6X). Vehicle Technologies Program
13
Active Material Surface Layer
SEI Film on Active Material
Electronic Contact Resistance
Kinetic and Capacitance
Parameter a
cm-1
Dsi Dsb Ks D+
cm2/s
κƒ
Ω-1cm-1
c+
M
σp
Ωcm2
io
mA/cm2
Cc Cd Cƒ
cm2/s μƒ/cm2
NCA 8900 10-10 10-10 5 10-9 10-7 10-2 0 1 0 40 0.3
NMC 7700 10-11 10-11 1 10-9 10-7 10-2 170 0.1 0.06 100 0.5
LMR-NMC 48000 10-12 10-12 6 10-8 10-8 10-3 1500 0.1 0.005 20 0.1
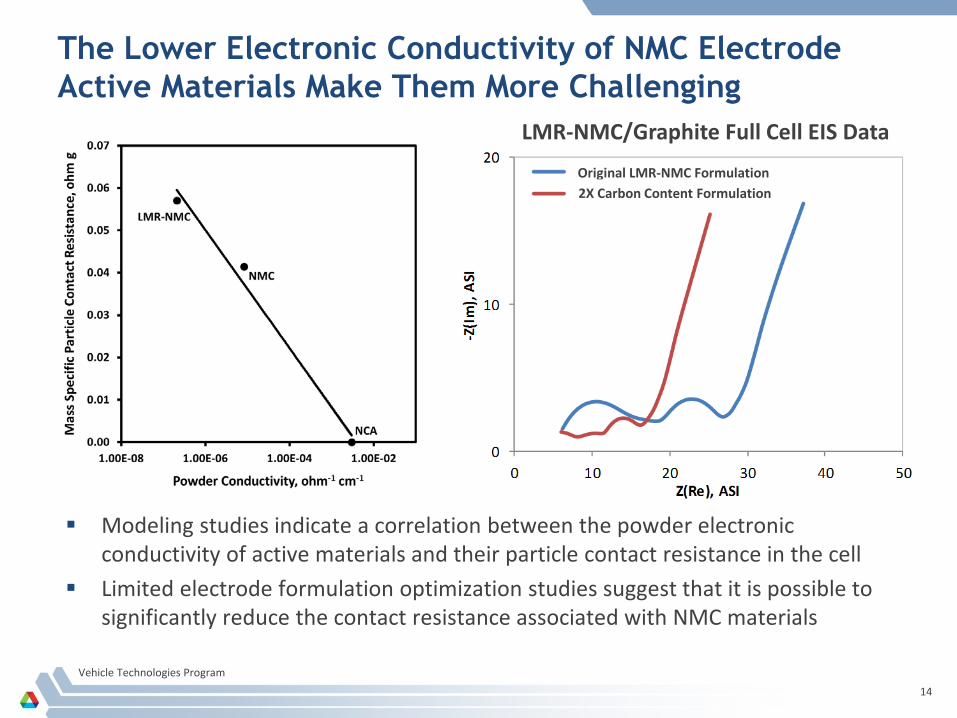
The Lower Electronic Conductivity of NMC Electrode Active Materials Make Them More Challenging
Modeling studies indicate a correlation between the powder electronic conductivity of active materials and their particle contact resistance in the cell
Limited electrode formulation optimization studies suggest that it is possible to significantly reduce the contact resistance associated with NMC materials
Vehicle Technologies Program
14
Original LMR-NMC Formulation 2X Carbon Content Formulation
LMR-NMC/Graphite Full Cell EIS Data
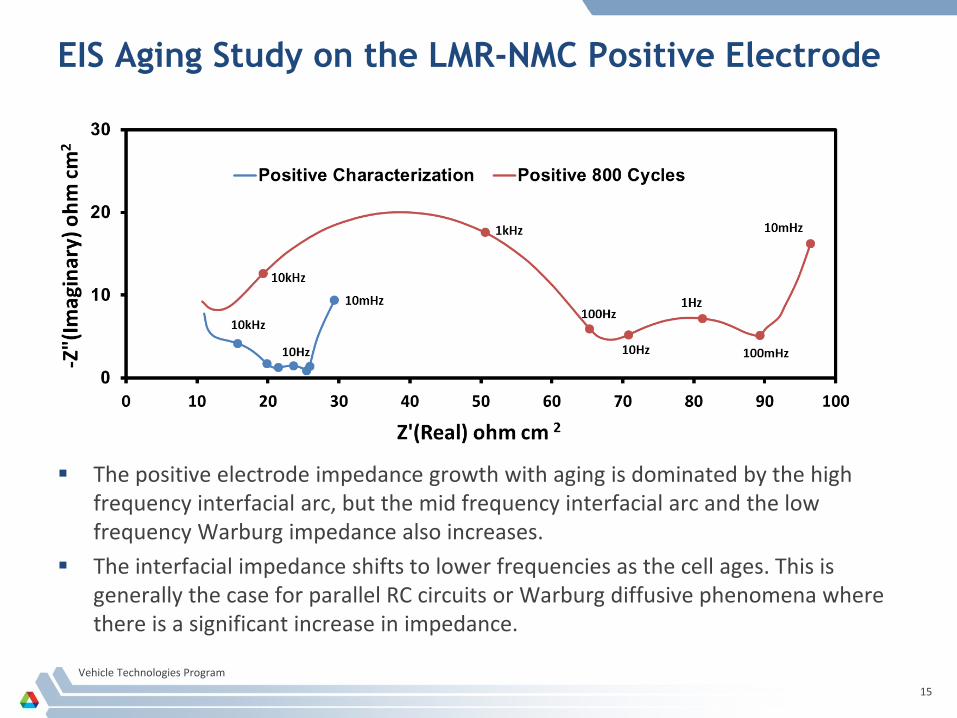
EIS Aging Study on the LMR-NMC Positive Electrode
The positive electrode impedance growth with aging is dominated by the high frequency interfacial arc, but the mid frequency interfacial arc and the low frequency Warburg impedance also increases.
The interfacial impedance shifts to lower frequencies as the cell ages. This is generally the case for parallel RC circuits or Warburg diffusive phenomena where there is a significant increase in impedance.
Vehicle Technologies Program
15
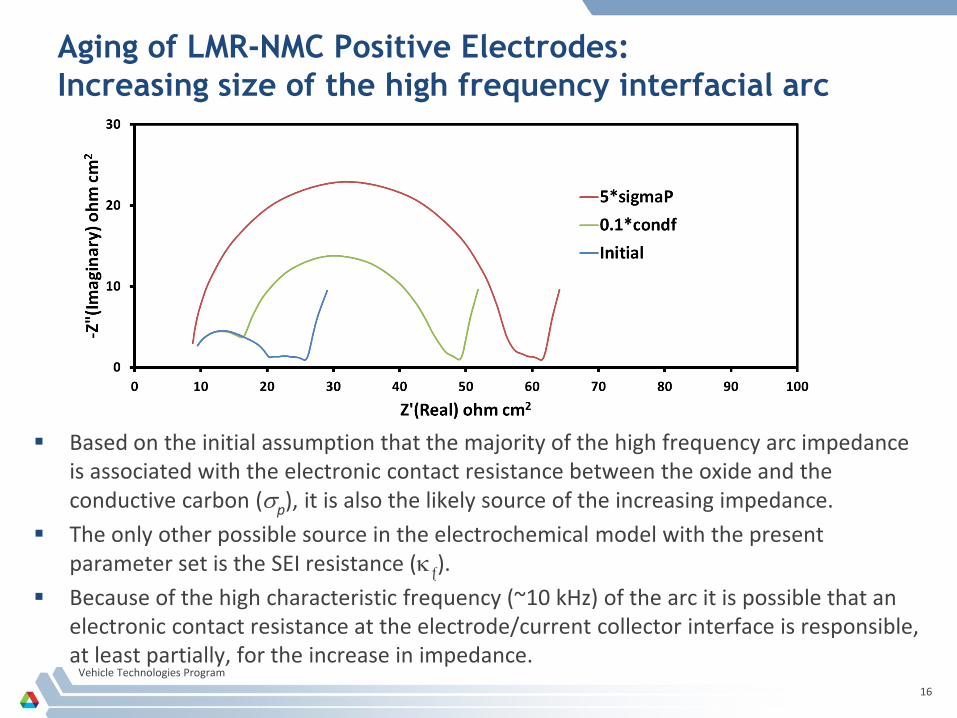
Aging of LMR-NMC Positive Electrodes: Increasing size of the high frequency interfacial arc
Based on the initial assumption that the majority of the high frequency arc impedance is associated with the electronic contact resistance between the oxide and the conductive carbon (σp), it is also the likely source of the increasing impedance.
The only other possible source in the electrochemical model with the present parameter set is the SEI resistance (κƒ).
Because of the high characteristic frequency (~10 kHz) of the arc it is possible that an electronic contact resistance at the electrode/current collector interface is responsible, at least partially, for the increase in impedance.
Vehicle Technologies Program
16
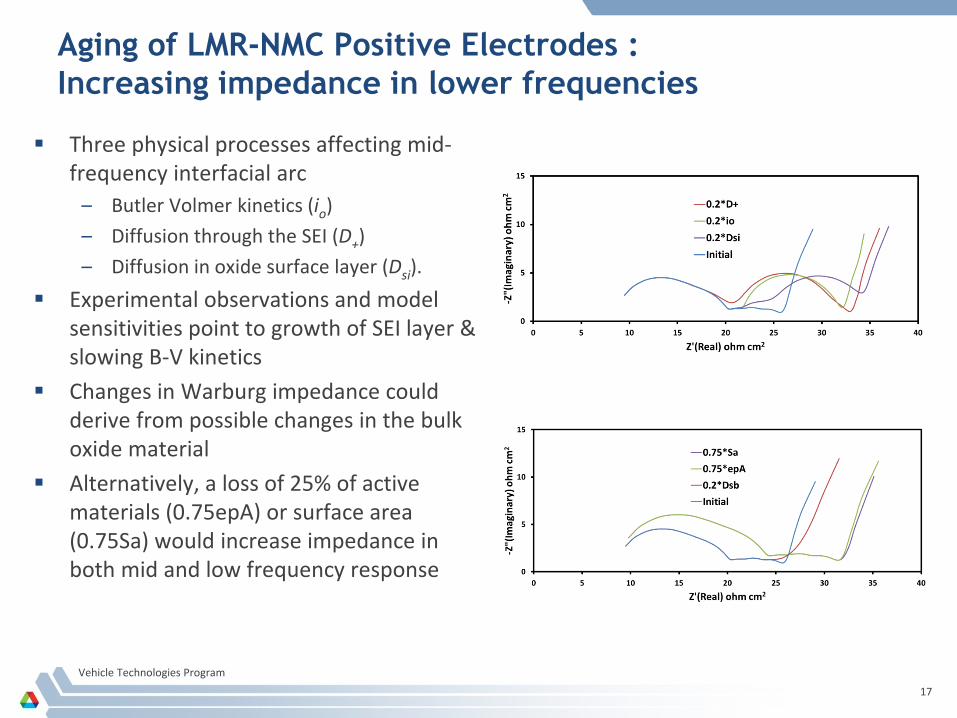
Aging of LMR-NMC Positive Electrodes : Increasing impedance in lower frequencies
Three physical processes affecting mid-frequency interfacial arc
– Butler Volmer kinetics (io) – Diffusion through the SEI (D+) – Diffusion in oxide surface layer (Dsi).
Experimental observations and model sensitivities point to growth of SEI layer & slowing B-V kinetics
Changes in Warburg impedance could derive from possible changes in the bulk oxide material
Alternatively, a loss of 25% of active materials (0.75epA) or surface area (0.75Sa) would increase impedance in both mid and low frequency response
Vehicle Technologies Program
17
Vehicle Technologies Program
18
Future Work
Transitioning project to new ABR format – Supporting Voltage Fade project – Supporting development of Electrochemical Couples – Supporting ABR facilities (CFF, MERF, Post-Test)
Develop understanding of slower time constant phenomena in LMR-NMC cathode materials – Faster time constant behavior fits in current modeling approach
Refine negative electrode SEI growth model Milestones for next year
– Understand slow relaxation in GITT study – Understand hysteresis and path dependence in OCV curve – Initiate voltage fade model
Vehicle Technologies Program
19
Summary The objective of this work is to correlate analytical diagnostic results
with the electrochemical performance of advanced lithium-ion battery technologies for PHEV applications
Approach for electrochemical modeling activities is to build on earlier successful characterization and modeling studies in extending efforts to new PHEV technologies
Technical Accomplishments – Simulated AC impedance of LMR-NMC cathodes – Propose most likely sources of impedance rise for ABR-1 cathode – Analyzed hysteresis and path-dependence in OCV curve – Identified presence of slow relaxation process of currently
unknown physical origin. Future plans include the continued development of PHEV focused
electrochemical models, further development of models examining impedance growth and capacity fade phenomena, and support of other ABR projects
Vehicle Technologies Program
20
Acknowledgements & Collaborators
Support for this work from DOE-EERE, Office of Vehicle Technologies is gratefully acknowledged – David Howell & Peter Faguy
Collaborators: Argonne National Laboratory
– Daniel Abraham, Y. Li, M. Bettge – Wenquan Lu, Q. Wu, M. Miguel, K. Yassin Lakhsassi – Sun-Ho Kang, D. Kim, J. Croy, M.M. Thackeray – Andrew Jansen, Chris Johnson, Javier Bareno, Jack Vaughey – Huiming Wu, K. Amine
Idaho National Laboratory – Kevin Gering

Vehicle Technologies Program
21
Technical Back-Up Slides
-3
-2
-1
0
1
2
3
2.75 3.25 3.75 4.25 4.75
dQ/d
V, m
Ah/c
m2
V
Open circuit voltage, V
2 - 4.62 - 4.22 - 4.02 - 3.8
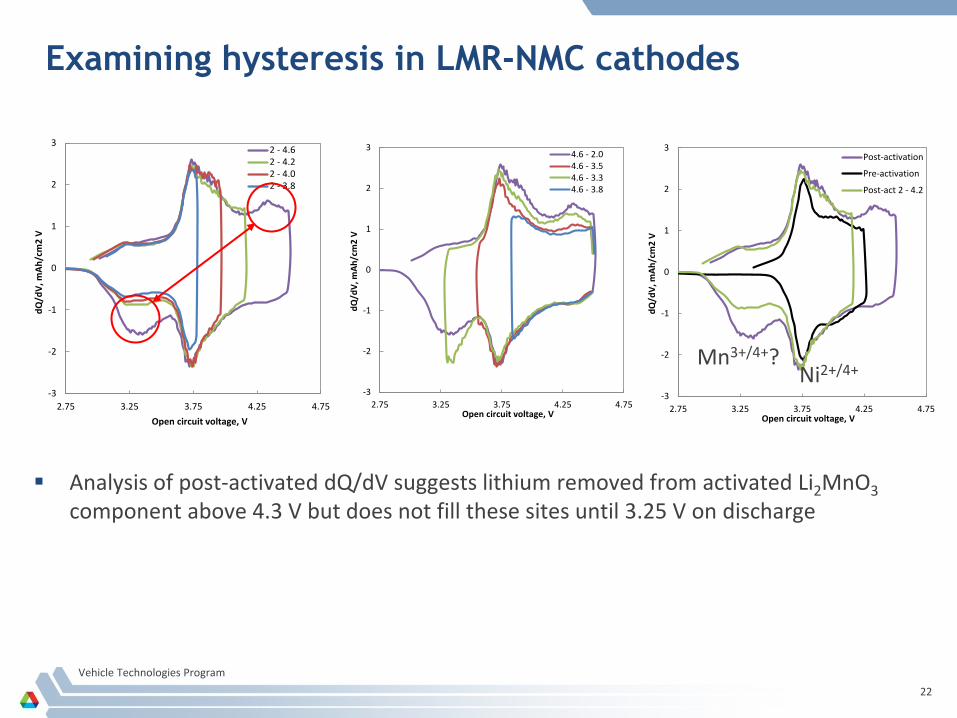
Examining hysteresis in LMR-NMC cathodes
Analysis of post-activated dQ/dV suggests lithium removed from activated Li2MnO3 component above 4.3 V but does not fill these sites until 3.25 V on discharge
Vehicle Technologies Program
22
-3
-2
-1
0
1
2
3
2.75 3.25 3.75 4.25 4.75
dQ/d
V, m
Ah/c
m2
V
Open circuit voltage, V
Post-activation
Pre-activation
Post-act 2 - 4.2
Ni2+/4+ Mn3+/4+?
-3
-2
-1
0
1
2
3
2.75 3.25 3.75 4.25 4.75
dQ/d
V, m
Ah/c
m2
V
Open circuit voltage, V
4.6 - 2.04.6 - 3.54.6 - 3.34.6 - 3.8
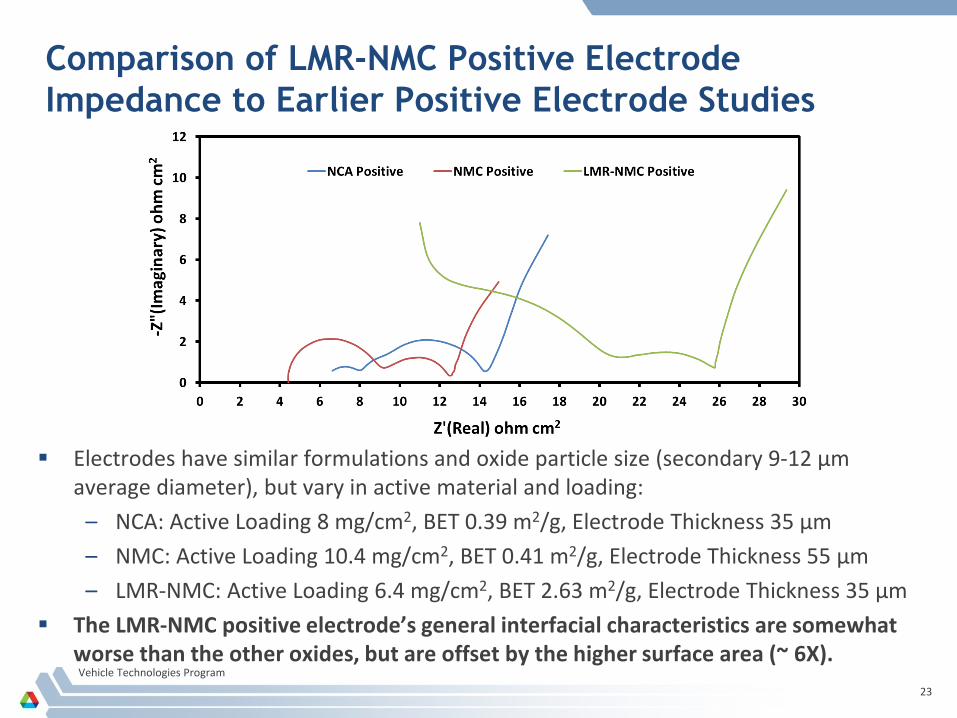
Comparison of LMR-NMC Positive Electrode Impedance to Earlier Positive Electrode Studies
Electrodes have similar formulations and oxide particle size (secondary 9-12 µm average diameter), but vary in active material and loading:
– NCA: Active Loading 8 mg/cm2, BET 0.39 m2/g, Electrode Thickness 35 µm – NMC: Active Loading 10.4 mg/cm2, BET 0.41 m2/g, Electrode Thickness 55 µm – LMR-NMC: Active Loading 6.4 mg/cm2, BET 2.63 m2/g, Electrode Thickness 35 µm
The LMR-NMC positive electrode’s general interfacial characteristics are somewhat worse than the other oxides, but are offset by the higher surface area (~ 6X). Vehicle Technologies Program
23