Embed Size (px)
Citation preview

LUND UNIVERSITY
PO Box 117221 00 Lund+46 46-222 00 00
Expression of apolipoprotein M in human hepatocellular carcinoma tissues
Jiang, Jingting; Wu, Changping; Luo, Guanghua; Zheng, Lu; Chen, Lujun; Zhang, Xiaoying;Xu, NingPublished in:Acta Histochemica
DOI:10.1016/j.acthis.2009.08.005
2011
Link to publication
Citation for published version (APA):Jiang, J., Wu, C., Luo, G., Zheng, L., Chen, L., Zhang, X., & Xu, N. (2011). Expression of apolipoprotein M inhuman hepatocellular carcinoma tissues. Acta Histochemica, 113(1), 53-57.https://doi.org/10.1016/j.acthis.2009.08.005
General rightsCopyright and moral rights for the publications made accessible in the public portal are retained by the authorsand/or other copyright owners and it is a condition of accessing publications that users recognise and abide by thelegal requirements associated with these rights.
• Users may download and print one copy of any publication from the public portal for the purpose of private studyor research. • You may not further distribute the material or use it for any profit-making activity or commercial gain • You may freely distribute the URL identifying the publication in the public portalTake down policyIf you believe that this document breaches copyright please contact us providing details, and we will removeaccess to the work immediately and investigate your claim.
1
Expression of apolipoprotein M in human hepatocellular
carcinoma tissues
Jingting Jianga, Changping Wua, Guanghua Luob, Lu Zhengb, Lujun Chenb, Xiaoying
Zhangbc,* and Ning Xud,*
aDepartment of Tumor Biological Treatment, bLaboratory of Molecular Medicine and
cDepartment of Thoracic Surgery, The Third Affiliated Hospital, Soochow University,
Jiangsu Changzhou 213003, China
dSection of Clinical Chemistry and Pharmacology, Lund University, S-221 85 Lund,
Sweden
Running title: ApoM expression in the HCC tissues
*Corresponding authors:
Xiaoying Zhang
Comprehensive Laboratory, The Third Affiliated Hospital of Soochow University,
Jiangsu Changzhou 213003, China.
Tel: +86 519 86180048, Fax: +86 519 86621235, e-mail:
and
Ning Xu, MD, Ph.D.
Division of Clinical Chemistry and Pharmacology,
Department of Laboratory Medicine, Lunds University, S-221 85 Lund, Sweden.
Tel: +46 46 173462, Fax: +46 46 130064, e-mail: [email protected].

2
Summary
The present study examined mRNA levels and protein mass of apolipoprotein M (apoM)
in human hepatocellular carcinoma (HCC) tissues and in its adjacent tissues. Plasma
apoM levels in these HCC patients were also determined and compared to the normal
subjects. The mean level of plasma apoM in the HCC patients was 0.61±0.30 OD*mm-2,
which was significantly higher than that in the normal subjects 0.37±0.07 OD*mm-2
(P<0.01). However, both apoM mRNA levels and apoM protein mass in the HCC tissues
were significantly lower than in its adjacent tissues (P<0.05). It is concluded that human
hepatocellular carcinoma tissues had less capacity to produce apoM than the adjacent
non-tumor tissues. However, the plasma apoM levels were higher in the HCC patients
than in normal subjects, which suggested that tumor-adjacent tissues or extra-hepatic
apoM production in the HCC patients may contribute to the higher plasma apoM levels in
these patients. The clinical significance of apoM in relation to HCC needs further
investigation.
KEYWORDS: Apolipoprotein M; Hepatocellular carcinoma; Immunohistochemistry.

3
Introduction
Hepatocellular carcinoma (HCC) is one of the most common malignant tumors in China
(Llovet et al., 2003; Zhou, 2002), and it accounts for 75%-85% of primary malignant
tumors of the liver (Nissen and Martin, 2002). HCC grows rapidly and may have distant
metastases at a quite early stage because HCC tissue has a rich blood supply, and the
prognosis of HCC is still poor. The liver is the key organ for the metabolism of lipids,
lipoproteins and apolipoproteins, and in humans most apolipoproteins are produced by
the liver (Jiang et al., 2007). The degree of liver cell injury can be reflected by analyzing
the serum levels of lipids, lipoproteins and/or apolipoproteins in patients suffering from
chronic liver diseases and HCC (Jiang et al., 2006; Jiang et al., 2009). ApoM is a
high-density lipoprotein (HDL) apolipoprotein and exclusively expressed in the liver
parenchyma cells and in the tubular cells of the kidney (Xu and Dahlback, 1999). It may
be hypothesized that the capacity of hepatocytes for apoM production could be changed
when HCC occurs. In the present study we examined if apoM mRNA levels and apoM
protein mass differ in HCC tissues compared to its adjacent non-tumor tissues. The
plasma apoM levels were also determined in the HCC patients and compared to the
normal subjects.
Materials and methods
Materials
Both plasma samples and liver tissues were collected during surgery from 36 HCC
patients (29 men and 7 women, aged from 29 to 83 years old, all patients were from third
affiliated hospital of Soochow University). Plasma samples and tissue samples were

4
collected at the same time. Plasma samples from 64 normal subjects (44 men and 20
women, 28-71 years old) were included as the controls. All normal subjects were
confirmed by blood biochemical tests, virus tests and B-type ultrasonic inspection to
exclude hepatitis or other chronic liver diseases. 5 ml samples of fasting intravenous
EDTA anticoagulant blood were collected and the plasma samples were preserved at
–70C before further examination. The present study was approved by the local Ethics
Committee. Rabbit anti-human apoM polyclonal antibodies (primary antibody was
obtained from the Lunds University, Sweden), alkaline phosphatase labeled goat
anti-rabbit antibody was purchased from the Dako company (Glostrup, Denmark),
NBT/BCIP color matrix was from the Shanghai Jingmei Biological Engineering Co. Ltd,
Shanghai, China and the Hybond-C membranes were from Amersham Life Science
(Cleveland, USA).
Measurements of plasma apoM levels
Plasma apoM levels were semi-quantitatively examined by both dot blotting and western
blotting analyses with a specific rabbit anti-human apoM antibody. For dot-blotting
analysis, 3l plasma samples were applied to the Hybond-C membrane in triplicate. All
samples were applied to one membrane. The membrane was quenched in Tris-HCl buffer
in the presence of 4% Tween and 3% BSA for 3 hrs, and sequentially incubated with
primary antibody (1:2000 dilutions in Tris–HCl buffer) overnight at 4˚C. After washing
with Tris–HCl buffer three times, the membrane was then incubated with alkaline
phosphatase conjugated secondary antibody for 2 hrs at room temperature. The
development of staining for alkaline phosphatase activity was performed with a
commercial visualization system according to the manufacturer’s instructions (AlkPhos,

5
Amersham LIFE SCIENCE). For western blotting analysis, human plasma was diluted
1:100 in TBS buffer, and then 15µl of diluted plasma in combination with 5µl loading
buffer was analyzed on the 12% precasting SDS-polyacrylamide gels. After SDS-PAGE,
proteins were transferred onto a PVDF membrane. The membranes were incubated with
rabbit anti-human apoM antibody at a dilution of 1:2000 1 hr at room temperature, after
washing twice, the membranes were incubated with horseradish peroxidase conjugated
goat anti rabbit IgG at a dilution of 1:5000 at 37 C for 2 hrs. Immune complexes were
visualized by using ECL Plus Western blotting kit according to the manufacturer’s
instruction. The relative amounts of apoM were analyzed with the Quantity One® 1-D
Analysis Software (Version 4.6.2, Bio-Rad Laboratories, USA), and presented as the
volume (OD*mm-2).
Isolation of total RNA and real-time RT-PCR
Total RNA of liver tissues was isolated by the guanidinium thiocyanate method
(Chomczynski and Sacchi, 1987). Primer Express software (Applied Biosystems,
CA,USA)) was used to design apoM primers and probes (Table 1) based on the TaqMan
assay (Applied Biosystems, USA). Relative standard curves of apoM and beta-actin were
performed to compensate for the efficiency of PCR. Serial dilutions of human apoM
cDNA and beta-actin cDNA were used to generate standard curves by plotting the cycle
threshold versus the log of input cDNA. The apoM and beta-actin standards were linear
with the input of cDNA. Quantification of apoM mRNA levels is relative to beta-actin
mRNA levels, and was performed on a LightCycler instrument (Roche Company,
Switzerland). In brief, the real-time RT-PCR was performed in two steps in a 25µl
reaction mixture containing 1l TaqMan Universal PCR Master Mix, 22.5 pmol of both

6
forward and reverse primers, 5 pmol probe and 50ng of the total RNA templates. Thermal
cycling conditions were as follows: 25˚C 10 min, 48˚C 30 min and 95˚C 5 min to
perform reverse transcription, and then the reaction mixture was preheated for 2 min at
50˚C and for 10 min at 95˚C to activate Taq polymerase. Then, a 40-cycle two-step PCR
was performed consisting of 15 sec at 95˚C and 1 min at 60˚C. All experiments were
performed in triplicate.
Immunohistochemical staining
Immunohistochemical staining was performed by using the Dako EnVisionTM technique
(Dako, Glostrup, Denmark) according to the manufacturer’s instructions. In brief,
formalin-fixed, paraffin-embedded tissues were cut into 3m-thick consecutive sections,
and were then dewaxed in xylene, rehydrated and graded ethanol solutions. Antigen was
retrieved by heating the tissue sections at 100°C for 30 min under citrate solution (10
mmol/L, pH 6.0). Sections were cooled down and immersed in 0.3% hydrogen peroxide
solution for 15 min to block endogenous peroxidase activity, and then rinsed in PBS for 5
min, blocked with 5% BSA at room temperature for 15 min, and incubated with primary
polyclonal antibodies against apoM (1:100 dilutions in PBS) at 4°C overnight. A negative
control was performed by omitting the primary antibody. The sections were then
incubated with HRP-labeled goat anti mouse/rabbit secondary antibody (Ready to use,
Dako, Glostrup, Denmark). Diaminobenzidene (DAB) was used as the chromogen and
hematoxylin as the nuclear counterstain. The sections were dehydrated, cleared and
mounted.
Evaluation of apoM immunohistochemical staining
Two pathologists were invited to examine the slides. In brief, all sections were observed

7
under light microscope (Leica DM2500) and five high-power fields (x200) were
randomly selected. Staining intensity was categorized into five semi-quantitative classes
based on the percentage of positive cells and staining intensities. The extent of the
staining was categorized into five semi-quantitative classes based on the percentages of
positive cells: 0 (<5% positive cells), 1 (6-25% positive cells), 2 (26-50% positive cells),
3 (51-75% positive cells), and 4 (>75% positive cells). The intensity of cytoplasmic and
membrane staining was also determined semi-quantitatively on a scale of 0-3 as follows:
0 (negative), 1 (weakly positive), 2 (moderately positive), and 3 (strongly positive).
Multiplication of the intensity and the percentage scores gave rise to the final staining
score: 0 (negative), weak positive (1-4), moderate positive (5-8), and strong positive
(9-12) (Soslow et al., 2000).
Statistical analysis
Statistical analysis was performed with SPSS for Windows 13.0 (SPSS, Chicago, USA)
programs. Data are expressed as means SE. Differences of apoM expressions between
tumor tissues and its adjacent tissues were compared with paired t-test, and plasma apoM
levels in the HCC patients and in healthy subjects were analyzed by the non-paired t-test.
A p value less than 0.05 (P<0.05) was considered as significant.
Results
Plasma apoM levels in the HCC patients and in normal subjects
The plasma apoM concentrations in the HCC and in healthy subjects were
semi-quantified by both dot-blotting and Western blotting analyses. Similar results were
obtained with both methods. As shown in figure 1, the plasma relative apoM levels in the

8
HCC patients were 0.61±0.30 OD*mm-2, which was significantly higher than those in the
normal subjects (0.37±0.07 OD*mm-2) (t=3.399, P<0.05).
Expression of apoM in the HCC tissues and in their adjacent non-tumor tissues
The apoM mRNA levels and apoM protein mass were determined by real-time RT-PCR
and immunohistochemistry, respectively. It was demonstrated that apoM mRNA levels in
the HCC tissues were significantly lower than those in the adjacent tissues (P<0.05) (Fig.
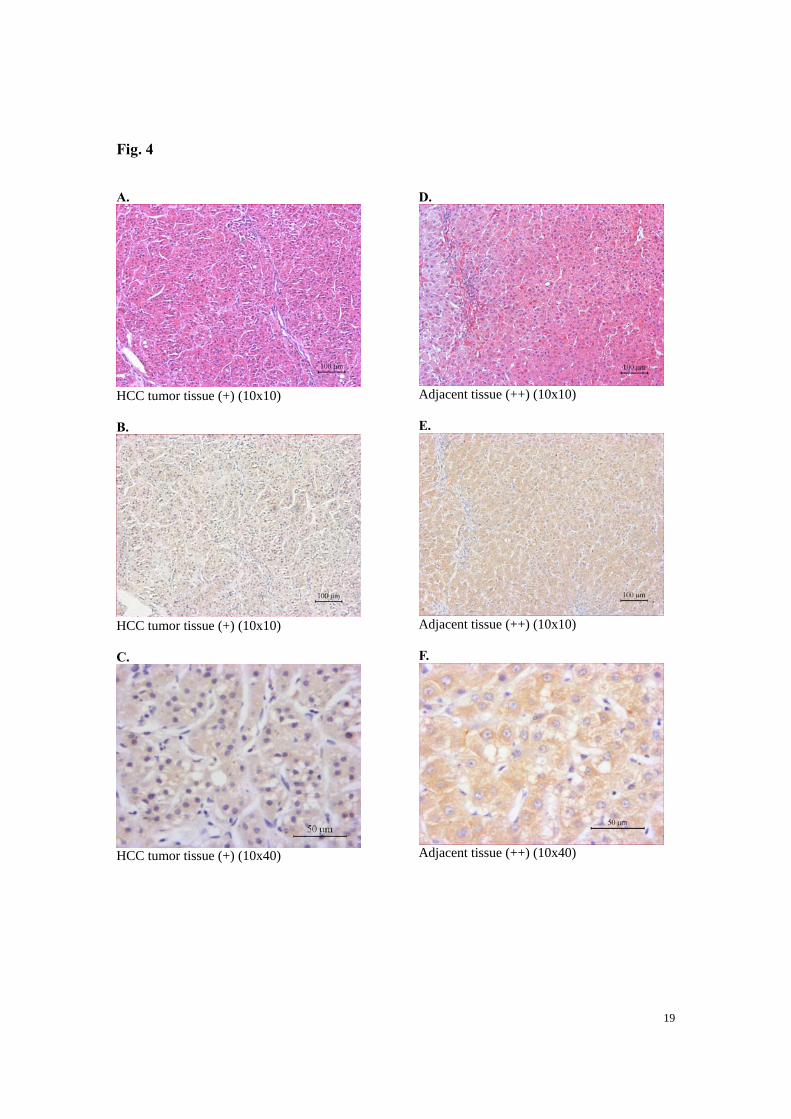
2). Moreover, the immunohistochemical staining demonstrated that the positive
coloration rates of apoM in the HCC tissues were also significantly lower than those in
their adjacent tissues (Fig. 3 and Fig. 4).
Discussion
Hepatocellular carcinoma (HCC) has a relative low incidence in Europe and North
America (ElSaadany and Giulivi, 2006; Jepsen et al., 2007), but it has a quite high
incidence in China and eastern Asia countries (Edwards and Macdonald, 2000). HCC is
one of the most common malignant tumors in China, however, the etiological factors of
HCC in China differ from those in the developed countries (Moore et al., 2004). HCC in
China is commonly associated with hepatitis B (Zhiqiang et al., 2004), and a large
proportion of the HCC patients in China are commonly accompanied by other chronic
liver diseases (Cao et al., 2009; Jiang et al., 2009; Lam and Poon, 2008). It is well known
that chronic liver diseases can interfere with hepatic metabolism of lipids, lipoproteins
and/or apolipoproteins, as most plasma endogenous lipids and lipoproteins are
synthesized by the liver, which depends on the integrity of liver cell function.
9
ApoM is a recently discovered HDL apolipoprotein that is exclusively expressed in the
liver parenchyma cells and in the kidney tubular epithelial cells in humans (Xu and
Dahlback, 1999; Zhang et al., 2003). ApoM is also expressed to a limited degree in the
fetal liver and kidney (Zhang et al., 2004). Accordingly, apoM in vivo may have special
functions related to the metabolism of hepatic lipids and lipoproteins. It could be
hypothesized that the normal hepatic physiological processes are necessary for hepatic
apoM production, and in cases of liver cancer or chronic liver diseases there may be
interference in the apoM synthesis.
In the present study, plasma apoM levels were detected in 36 HCC patients and 64
normal subjects who served as controls. Unexpectedly, the results showed that plasma
apoM levels in HCC patients were significantly higher than those in normal subjects,
although HCC patients commonly were accompanied by chronic liver damage. It is
difficult to interpret this phenomenon with impaired liver tissues and with lower hepatic
apoM mRNA expression in the HCC tissues. This may indicate that extrahepatic apoM
synthesis is enhanced in the chronic liver diseases and in liver cancer, although the
detailed mechanism is still not known. Matsuura et al. (1988) demonstrated that
pro-apoAI could also be increased in patients suffering from chronic liver diseases,
although most reports demonstrated that apoAI levels were decreased in these patients
(Cooper et al., 1996; Fujii et al., 1981; Hachem et al., 1986; Jiang et al., 2008;
Katsuramaki et al., 2002). Another possible explanation may be considered as apoM can
participate in the inflammatory response and causes liver dysfunction, leading to
increased apoM levels in the peripheral blood of the HCC patients. Mathonnet et al.

10
(2006) demonstrated that platelet-activating factor (PAF) and PAF-receptor may be
involved in the inflammatory processes in the chronic liver diseases and liver cancer. Xu
et al. (2002) demonstrated that PAF significantly increased the apoM mRNA levels in
cultures of HepG2 cells, which suggested that increased apoM levels in the HCC patients
might be mediated by the inflammatory response of PAF. In addition, a small amount of
apoM expression can be detectable in the bone marrow cells and peripheral blood
granular cells (unpublished data). Enhanced extra-hepatic apoM expression may also
contribute to the higher apoM plasma levels in these HCC patients.

11
Acknowledgments
Haifeng Deng, Mingyang Lu, Bin Xu, Yan Tan, Min Li, Xiao Zheng and Jian Liu
provided excellent technical assistance. This research project was supported by the
National Natural Science Foundation of China (NSFC) (30570752), the Natural Science
Foundation of Jiangsu province (BK2008140) and the research grant of the Third
Affiliated Hospital of Soochow University.
Competing interests
The authors declare that they have no competing or financial interests regarding this
paper.

12
References
Chomczynski P, Sacchi N. Single-step method of RNA isolation by acid guanidinium
thiocyanate-phenol-chloroform extraction. Anal Biochem 1987;162:156-9.
Cooper ME, Akdeniz A, Hardy KJ. Effects of liver transplantation and resection on lipid
parameters: a longitudinal study. Aust N Z J Surg 1996;66:743-6.
Edwards JT, Macdonald GA. Hepatocellular carcinoma. Curr Opin Gastroenterol
2000;16:275-81.
ElSaadany S, Giulivi A. Epidemiology of hepatocellular carcinoma in Canada, 1995:
analysis of death certificates. Chronic Dis Can 2006;27:125-9.
Fujii S, Koga S, Shono T, et al. Serum apoprotein A-I and A-II levels in liver diseases and
cholestasis. Clin Chim Acta 1981;115:321-31.
Hachem H, Favre G, Raynal G, et al. Serum apolipoproteins A-I, A-II and B in hepatic
metastases. Comparison with other liver diseases: hepatomas and cirrhosis. J Clin
Chem Clin Biochem 1986;24:161-6.
Hao L, Zhang C, Qiu Y, et al. Recombination of CXCR4, VEGF, and MMP-9 predicting
lymph node metastasis in human breast cancer. Cancer Lett 2007;253:34-42.
Jepsen P, Vilstrup H, Tarone RE, et al. Incidence rates of hepatocellular carcinoma in the
U.S. and Denmark: recent trends. Int J Cancer 2007;121:1624-6.
Jiang J, Nilsson-Ehle P, Xu N. Influence of liver cancer on lipid and lipoprotein
metabolism. Lipids Health Dis 2006;5:4.
Jiang J, Zhang X, Wu C, et al. Increased plasma apoM levels in the patients suffered from
hepatocellular carcinoma and other chronic liver diseases. Lipids Health Dis
2008;7:25.
Jiang JT, Xu N, Wu CP. Metabolism of high density lipoproteins in liver cancer. World J
Gastroenterol 2007;13:3159-63.
Jiang JT, Xu N, Zhang XY, et al. Lipids changes in liver cancer. J Zhejiang Univ Sci B
2007;8:398-409.
Jiang JT, Wu CP, Xu N, et al. Mechanisms and significance of lipoprotein(a) in
hepatocellular carcinoma. Hepatobiliary Pancreat Dis Int 2009;8:25-8.
Katsuramaki T, Hirata K, Kimura Y, et al. Changes in serum levels of apolipoprotein A-1

13
as an indicator of protein metabolism after hepatectomy. Wound Repair Regen
2002;10:77-82.
Lam VW, Poon RT. Role of branched-chain amino acids in management of cirrhosis and
hepatocellular carcinoma. Hepatol Res 2008;38:S107-15.
Llovet JM, Burroughs A, Bruix J. Hepatocellular carcinoma. Lancet 2003;362:1907-17.
Moore SW, Millar AJ, Hadley GP, et al. Hepatocellular carcinoma and liver tumors in
South African children: a case for increased prevalence. Cancer 2004;101:642-9.
Nissen NN, Martin P. Hepatocellular carcinoma: the high-risk patient. J Clin
Gastroenterol 2002;35:S79-85.
Soslow RA, Dannenberg AJ, Rush D, et al. COX-2 is expressed in human pulmonary,
colonic, and mammary tumors. Cancer 2000;89:2637-45.
Xu N, Dahlback B. A novel human apolipoprotein (apoM). J Biol Chem
1999;274:31286-90.
Xu N, Zhang XY, Dong X, et al. Effects of platelet-activating factor, tumor necrosis
factor, and interleukin-1alpha on the expression of apolipoprotein M in HepG2
cells. Biochem Biophys Res Commun 2002;292:944-50.
Zhang XY, Dong X, Zheng L, et al. Specific tissue expression and cellular localization of
human apolipoprotein M as determined by in situ hybridization. Acta Histochem
2003;105:67-72.
Zhang XY, Jiao GQ, Hurtig M, et al. Expression pattern of apolipoprotein M during
mouse and human embryogenesis. Acta Histochem 2004;106:123-8.
Zhiqiang G, Zhaohui D, Qinhuan W, et al. Cost of chronic hepatitis B infection in China.
J Clin Gastroenterol 2004;38:S175-8.
Zhou XD. Recurrence and metastasis of hepatocellular carcinoma: progress and prospects.
Hepatobiliary Pancreat Dis Int 2002;1:35-41.

14
Legends to figures
Figure 1. Plasma apoM levels in HCC patients and in healthy subjects. Plasma
apoM levels were semi-quantitatively determined as described in Materials and Methods.
* p<0.05 vs. normal subjects.
Figure 2. ApoM mRNA levels in HCC tumor tissue and in its adjacent tissue.
ApoM mRNA levels were determined by real-time RT-PCR as described in Materials and
Methods. ApoM mRNA levels in the adjacent tissues were considered as 100%. * p<0.05
vs. tumor adjacent tissues.
Figure 3. ApoM protein mass in HCC tumor tissue and in its adjacent tissue.
The figure shows apoM protein concentration in the tumor tissues and in its adjacent
tissues that were evaluated according to the immunohistochemical score as described in
Materials and Methods. * p<0.05 vs. tumor adjacent tissues.
Figure 4. ApoM immunohistochemical staining. The figure shows the intensity of
apoM immunohistochemical staining in the tumor tissues and in its adjacent tissues.
Left column (Panels A, B and C) shows tumor tissues and right column (Panels D, E and
F), adjacent tissues. Panels A and E show HE staining.

15
Table 1 Primers and probes of Real time RT-PCR
ApoM β-actin
Pre-primers 5’-acaaagagaccccagagccc 5’-acggccaggtcatcactattg
Post-primers 5’-tccatggtgggagccg 5’-caagaaggaaggctggaaaaga
Probes 5’-FAM-acctgggcctgtggtactttattgctgg-TAMRA 5’-FAM-caacgagcggttccgatgccct-TAMRA
Length (bp) 66 66

16
Fig. 1
HCC pat
ients
Normal
subje
cts
0.0
0.2
0.4
0.6
0.8
*
Pla
sma
apoM
lev
els
(OD
*mm
-2)

17
Fig. 2
Adjacent tissue Tumor tissue0
50
100
150
*
Apo
M m
RN
A l
evel
s (%
)

18
Fig. 3
Adjacent tissue Tumor tissue0
2
4
6
8
10
12
*
Imm
unoh
isto
chem
ical
sco
re
19
Fig. 4 A.
HCC tumor tissue (+) (10x10) B.
HCC tumor tissue (+) (10x10) C.
HCC tumor tissue (+) (10x40)
D.
Adjacent tissue (++) (10x10) E.
Adjacent tissue (++) (10x10) F.
Adjacent tissue (++) (10x40)