Embed Size (px)
Citation preview
348 J. Mex. Chem. Soc. 2014, 58(3) Juan M. Peralta-Hernández, and Luis A. Godínez
Electrochemical Hydrogen Peroxide Production in Acidic Medium Using a Tubular Photo-reactor: Application in Advanced Oxidation ProcessesJuan M. Peralta-Hernández,1,* and Luis A. Godínez2
1 Centro de Innovación Aplicada en Tecnologías Competitivas (CIATEC), Departamento de Investigación y Posgrado, Omega-201, Fraccionamiento Industrial Delta. León, 37545, Guanajuato, México, [email protected]
2 Centro de Investigación y Desarrollo Tecnológico en Electroquímica, Parque Tecnológico Querétaro-Sanfandila, Pedro Escobedo, 76703, Querétaro, México.
Received January 23rd, 2014; Accepted April 23rd, 2014.
J. Mex. Chem. Soc. 2014, 58(3), 348-355© 2014, Sociedad Química de México
ISSN 1870-249XArticle
Abstract. This paper describes the results obtained in the design and characterization of a tubular electrochemical reactor. The set-up was employed for on-site hydrogen peroxide (H2O2) production in an acidic medium (pH 3) to promote three electrochemical advanced oxi-dation processes (EAOP): electro-Fenton (EF), photoelectro-Fenton (PEF) and photocatalysis treatment (PT). These processes were evalu-ated by their abilities to degrade a commercial dye, Orange-II (OG-II), in solution using total organic carbon (TOC) removal and high performance liquid chromatography (HPLC). To have free solutions of iron in the EF and PEF systems, a Nafion membrane with dispersed iron was prepared. For use in photocatalysis, electrodes with a large superficial area were prepared by coating carbon cloth fiber supports with titanium dioxide (TiO2) using the electrophoretic (EP) method. In this work, wastewater samples with a large number of microorganisms (coliform bacteria) were treated with this new reactor design.Key Words: Electro-Fenton, Photoelecto-Fenton, Hydrogen peroxide, Photoelectrochemistry, Electrochemical reactor, Disinfection.
Resumen. En este trabajo se describen los resultados obtenidos en el diseño y la caracterización de un reactor electroquímico tubular. Dicho reactor se usó para llevar a cabo la producción in situ de peróxido de hidrógeno (H2O2) en medio ácido (pH 3) para promover tres procesos electroquímicos de oxidación avanzada (PEOA): electro-Fenton (EF), fotoelectro-Fenton (FEF) y fotocatálisis (FC). Estos procesos fueron evaluados por su capacidad para degradar un colorante comercial, Naranja-II (N-II), en solución. Para ello, se realizaron determinaciones de carbono orgánico total (COT) así como de cromatografía líquida de alta resolución (CLAR). Para tener soluciones libres de hierro en los procesos EF y FEF, se preparó una membrana NafionR con hierro dis-perso. Para las pruebas fotocatalíticas se desarrollaron electrodos con una gran área superficial que se prepararon mediante el recubrimiento con dióxido de titanio (TiO2) de una tela de fibra de carbono usando el método electroforético (ME). Además se trabajó con muestras de agua residual con un gran número de microorganismos (bacterias co-liformes) la cual fue tratada con este nuevo diseño de reactor.Palabras clave: Electro-Fenton, fotoelecto-Fenton, peróxido de hidró-geno, fotoelectroquímica, reactor electroquímico, Desinfección.
Introduction
Hydrogen peroxide (H2O2) is currently one the most common chemicals used for water treatment and chemical production, and it is a promising oxidant for green chemistry processes in the near future [1,2,3]. The use of H2O2 may offer an efficient alternative for controlling pollution in aqueous media. Hydro-gen peroxide is one the most popular non-selective oxidizing agents that are used to convert organic compounds to carbon dioxide and water [4]. Recently, several works have demon-strated that on-site electrochemical generation of H2O2 can be used successfully to decontaminate water treatment effluents with different organic compounds [5-8]. In this process, H2O2 is continuously supplied to the contaminated solution through oxygen (O2) reduction by two electrons in an acidic medium, according to the following equation [9-12]:
O2 + 2H+ + 2e− → H2O2 (1)
The most common use of H2O2 in environmental applica-tions involves the addition of iron (Fe2+) to the acidic solu-tion to increase the oxidizing power of the H2O2 by forming hydroxyl radicals (•OH) via the Fenton reaction, according to the equation [13,14].
Fe2+ + H2O2 → Fe3+ + •OH + −OH (2)
This method is commonly referred to as electro-Fenton (EF) treatment and is considered an advanced oxidation pro-cess (AOP) [15]. The principal reason for combining on-site hydrogen peroxide generation and the Fenton reaction is to im-prove the oxidation capacities of the two individual processes, creating a synergetic system [16]. The hydroxyl radical species that are produced through these processes are characterized by a large oxidation power (2.8 V vs ENH) [17] that is able to transform organic compounds into CO2 and H2O [18].
Similarly, another type of AOP is the photoelectro-Fenton (PEF) system, in which the peroxide-ferrous system is illu-minated with UV light, and Reactions 3 and 4 take place in addition to Equation 2, increasing the production of hydroxyl radicals and improving the oxidation of organic compounds [19].
Fe2+ + •OH → (FeOH)2+ (3)
(FeOH)2+ + hν → Fe2+ + •OH (4)
This catalytic process is achieved by Fe2+ regeneration, which takes place primarily by the reduction of Fe2+ species
Electrochemical Hydrogen Peroxide Production in Acidic Medium Using a Tubular Photo-reactor 349
by H2O2. When UV light is used, the mineralization process can be accelerated by the photolysis of complexes of Fe3+ with some oxidation products and improvement in Fe2+ regeneration from the additional photoreduction of Fe3+ species through Equation 4 [19].
In the case of the EF and PEF systems, the iron species represent a serious problem during organic compound oxida-tion in a homogeneous medium. The removal of iron ions is an easy process that can be carried out by precipitation or re-dis-solution of the iron ions after the treatment, but these operations generate additional costs in the treatment [20].
However, in the recent years, the use of Nafion mem-branes covered with highly dispersed iron ions has been the focus of several studies because the iron-coated Nafion mem-brane has a similar effect on H2O2 decomposition as the iron ions in a homogeneous solution [20, 21,22]. The iron ions that are supported on the membrane allow the oxidation of the organic compounds through UV irradiation while avoiding the need for an expensive separation step [20].
In addition to the Fenton-related technologies, the pho-tocatalytic process has become a commonly used technology because it can completely remove organic compounds [23]. Titanium dioxide (TiO2) is the most common semiconductor material for photocatalytic processes, and it has been applied in several photocatalytic water treatment studies [24,25]. The inherent advantages of this material are its low cost, its low toxicity, its good photocatalytic properties, and its particularly wide band gap (3.2 eV), which results in good stability and prevents photo-corrosion [26]. When TiO2 nanoparticles are subjected to radiation with sufficient energy, an electron is promoted from the valence band to the conduction band of the semiconductor, as indicated in Equation 5:
TiO2 + hν → e−cb + h+
vb (5)
The positively charged vacancy or hole (h+) thus gener-ated can react with either adsorbed water or hydroxyl ions to produce the powerful •OH radical, as shown in Equations 6 and 7.
h+vb + H2O → •OH + H+ (6)
h+vb + OH− → •OH (7)
Furthermore, if an organic pollutant, R, is adsorbed on the semiconductor surface, the hole can directly oxidize that spe-cies, as outlined in Equation 8 [27].
h+vb + R → R+
ox (8)
At the same time, the electrons that are photo-injected into the conduction band can react with dissolved O2 to pro-duce H2O2, according to Equation 1, or they may be lost by recombination reactions with either unreached holes or with adsorbed •OH radicals, as indicated in Equations 9 and 10, respectively [28].
e−cb + h+
vb → TiO2 + heat (9)
TiO2(e−cb) + •OHads → TiO2 + −OHad (10)
If the semiconductor is used as an anode, those electrons can be extracted to the external circuit, retarding Equations 9 and 10.
Because TiO2 is a suspended powder, the reactor design should be efficient to avoid problems related to illumination limitations, mass transfer and nanoparticle recovery at the end of the treatment process [29,30]. One promising way to over-come such problems is to immobilize the catalyst [11,29]. In this method, mass transfer limitations are reduced by using microfibers as a direct support for the TiO2, and the illumina-tion source is placed directly over the TiO2-covered face of the support.
The aim of this work is to compare the effectiveness of several of these water-treatment processes by studying the degradation of the azo dye Orange-II (OG-II) using high per-formance liquid chromatography (HPLC) and total organic carbon (TOC) analysis on water containing microorganisms. Tests were carried out using a continuous flow reactor that was operated to produce on-site H2O2 using the EF and the PEF processes. In addition, a Nafion membrane with iron fixed in the lattice and a TiO2-covered carbon cloth were in-corporated to promote photocatalytic events and improve the oxidation of the organic compounds and microorganisms in the medium.
Experimental details
The chemicals used in this work, such as sulfuric acid (H2SO4), sodium sulfate (Na2SO4), and ferrous sulfate (FeSO4·7H2O), were purchased from J.T. Baker as ACS reagent grade and were used as received, without further purification. Titanium (IV) oxysulfate (TiOSO4, 99.99%, ca. 15 wt. diluted sulfuric acid solution) and the azo dye OG II (C16H11N2NaO4S, λmax = 487 nm, reagent grade) were purchased from Sigma-Aldrich. The carbon cloth and Nafion membrane were provided by ElectroChem Inc.
Electrochemical photo-reactor
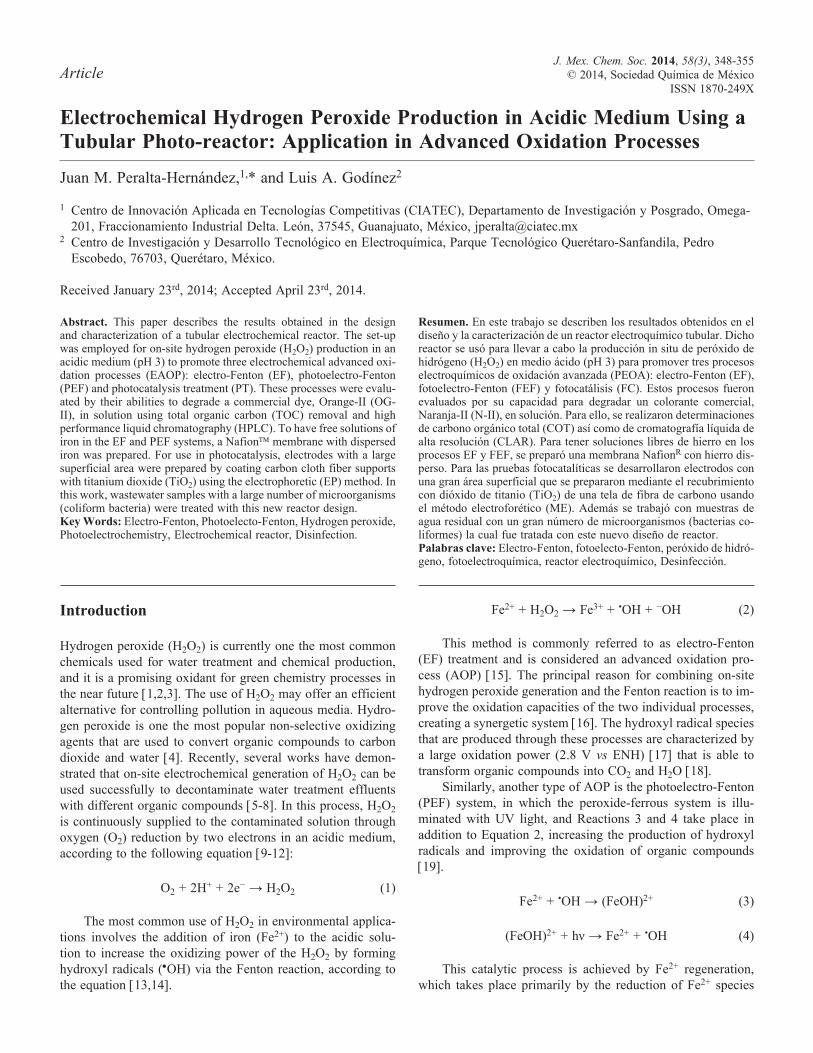
The experiments were performed in an annular flow reactor containing a graphite cloth cathode (geometrical area of 90 cm2) and a TiO2-covered graphite cloth anode (geometrical area of 100 cm2), as shown in Figure 1. Additional studies are being carried out using the same reactor design with minor modifica-tions in the capacity and anode materials [15].
The reactor volume was 0.5 L, and the total solution vol-ume, including that held in a reservoir stirred and sparged with pure O2, was 27 L. In this set-up, a diaphragm pump (Shurflo) was used to create three flow rates, 56 L/h, 76 L/h and 96 L/h. Prior to the Fenton-reagent oxidation tests, a ferrous sulfate solution was added to make an Fe2+ concentration of either 0.02
350 J. Mex. Chem. Soc. 2014, 58(3) Juan M. Peralta-Hernández, and Luis A. Godínez
or 0.05 mM. In the photo-assisted experiments, the illumina-tion was provided by a low-pressure UV mercury lamp (UVP Inc., P = 75 mW/cm2, λ = 365 nm). The assays were carried out under galvanostatic conditions with a GW Model:GPR-1820HD power supply.
Evaluation of on-site H2O2 production
Electrolysis experiments were carried out to test the capacity of the reactor to produce H2O2 through the cathodic reduction of dissolved O2 in a 0.05 M solution of Na2SO4, adjusted to a pH of 3 with H2SO4 and saturated with O2. The pH of the solu-tion was determined with a glass-electrode pH meter (Corning 320). The concentration of H2O2 created during electrolysis was determined by titrating with titanium (IV) oxysulfate and measuring the intensity of the color of the H2O2– reagent com-plex at a wavelength of 406 nm [31].
OG-II solution preparation
An accurately weighed quantity of the OG-II dye was dissolved in distilled water to prepare a stock solution (100 mg/L), and experimental solutions of the desired concentration (50 mg/L) were obtained by successive dilution. The synthetic textile dye wastewater solution was prepared in accordance with previous reports [28] in which dye concentrations ranging between 10 and 200 mg/L.
Analytical procedure
The degradation of OG-II was monitored by HPLC analy-sis, using a Hewlett Packard Series 1050 machine, equipped with a UV/Vis Detector and a reverse phase C-18 Phenomenex (LUNA 5 micron-C-18, 3 x 150 mm) column. The injection volume was 20 µL. The column was eluted with an ammonium acetate (20 mM)/acetonitrile 68:32 (v/v) mixture with a flow
rate of 0.5 mL/min [24]. The TOC of the initial electrolyzed samples was determined with a TOC-VSCN (Shimadzu Co) analyzer.
NafionTM membrane preparation
The Nafion membrane (EC-NM-117) was exchanged with FeCl3•6H2O (Fluka) at room temperature for a few minutes, after which the Nafion was immersed in HCl. After the ion exchange, the membrane was washed with water and then im-mersed in 1 M NaOH to hydrate the Fe3+ ions, in accordance with Fernandez et al. [21]. For the TiO2-covered carbon cloth electrodes, nano-particulated P25 TiO2 (80% anatase, 20% ru-tile, average particle diameter 20 nm), purchased from Degussa was used. The nanoparticles were deposited according to the methodology proposed by Manríquez and Godínez [32]. Scan-ning electron microscopy (SEM) of the TiO2 electrode surfaces was carried out using a JEOL-5400LV microscope.
Results and discussion
Electrochemical generation of H2O2 in the photo-reactor at different flow rates
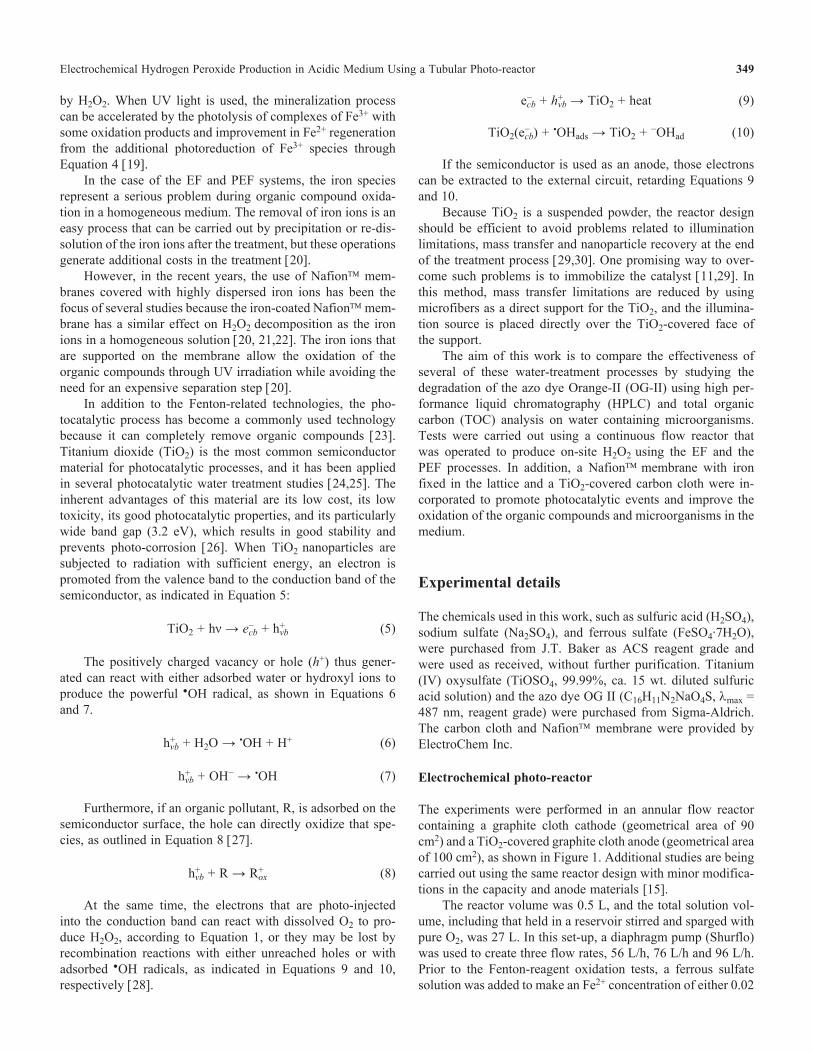
Several tests were performed to evaluate the electrochemically generated H2O2 concentration in the reactor at different current densities (j) and flow rates (Q). The capacity of the system to electrochemically generate H2O2 at the carbon cloth cathode through O2 reduction (Eq. 1) was studied spectrophotometri-cally. Figure 2 shows the variation of the H2O2 concentration as a function of the electrolysis time and current densities with a flow rate of 56 L/h. Curve 2(A) corresponds to a sample in which the current density was 100 mA/cm2; in this case, the H2O2 concentration was approximately 39 mg/L after a reaction time of 180 min. Curve 2(B) corresponds to a current density of 200 mA/cm2, and the resulting H2O2 accumulation was ap-proximately 89 mg/L after 180 min of electrolysis. Finally,
Figure 1. Diagram of the experimental photo-electrochemical reactor. 1) Deposit, 2) Inlet chamber, 3) Carbon cloth cathode, 4) Photo-cham-ber, 5) UV lamp, 6) Power supply, 7) UV lamp power supply, 8) TiO2-carbon cloth anode, 9) Outlet chamber, 10) Nafion membrane with dispersed Fe2+, 11) Deposit exit, 12) Oxygen supply, 13) Pump.
Figure 2. H2O2 production in the photo-electrochemical reactor in a solution of 0.05 M Na2SO4 , with a flow rate of 56 L/h and a current density of (A) 100 mA/cm2, (B) 200 mA/cm2, (C) 300 mA/cm2.
Electrochemical Hydrogen Peroxide Production in Acidic Medium Using a Tubular Photo-reactor 351
curve 2(C) shows a current density of 300 mA/cm2, which resulted in 133 mg/L H2O2.
In all cases, it can be seen that the H2O2 concentration is directly proportional to the current density supplied to the system. On the other hand, the H2O2 concentration did not increase linearly with reaction time; after about 80 min, the H2O2 concentration reached its plateau value and remained almost constant for the remainder of the reaction time. These results are in accordance whit previously reported [33]. From these results, it is apparent that H2O2 undergoes chemical de-composition O2 either on the anode (heterogeneous process) or in the medium (homogeneous process) [34,35]:
H2O2 → HO•2 + H+ + e− (11)
HO•2 → O2(g) + H+ + e− (12)
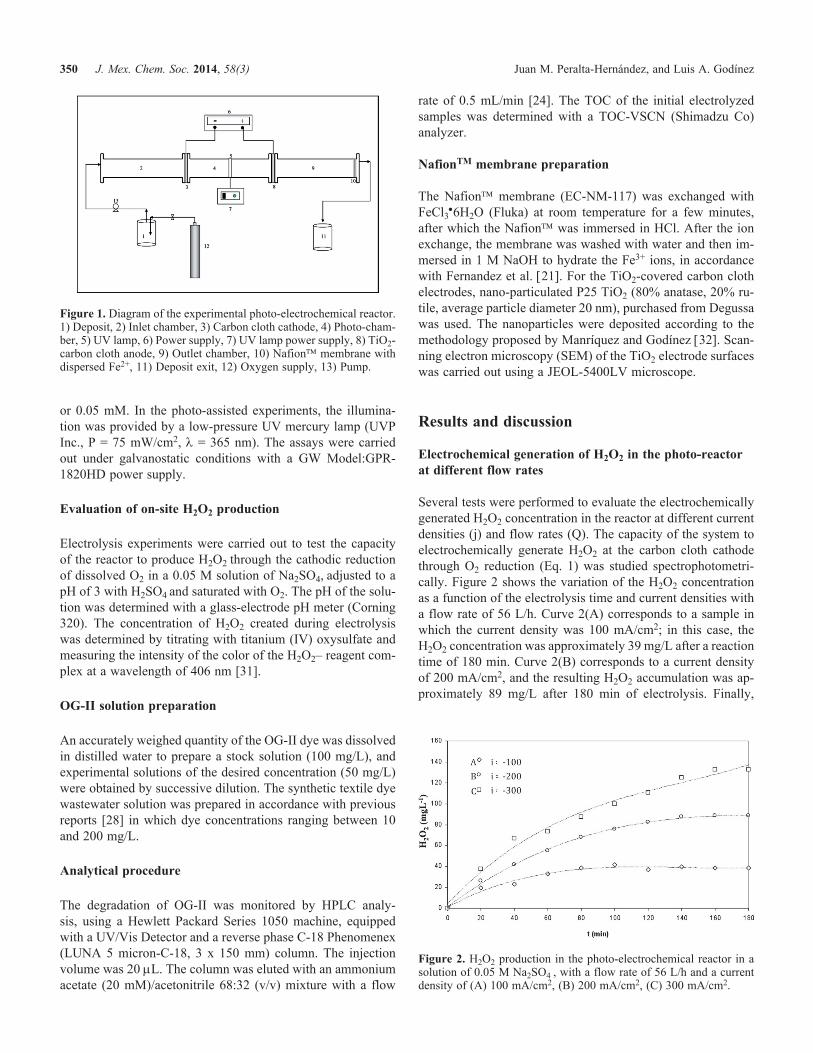
An additional set of assays was carried out in which the flow rate was increased to 76 L/h, and the three current densi-ties used in the previous assay were maintained. The results of this study are presented in Figure 3. In these experiments, H2O2 generation is favored by the increased the flow rate. The H2O2 concentration was 75 mg/L after 180 min of reaction when a current density of 100 mA/cm2 was applied, 166 mg/L when a current density of 200 mA/cm2 was applied, 268 mg/L when a current density of 300 mA/cm2 was applied. In this last case, the maximal H2O2 concentration is larger than what was obtained with the same current density at the lower flow rate (Figure 2(C)).
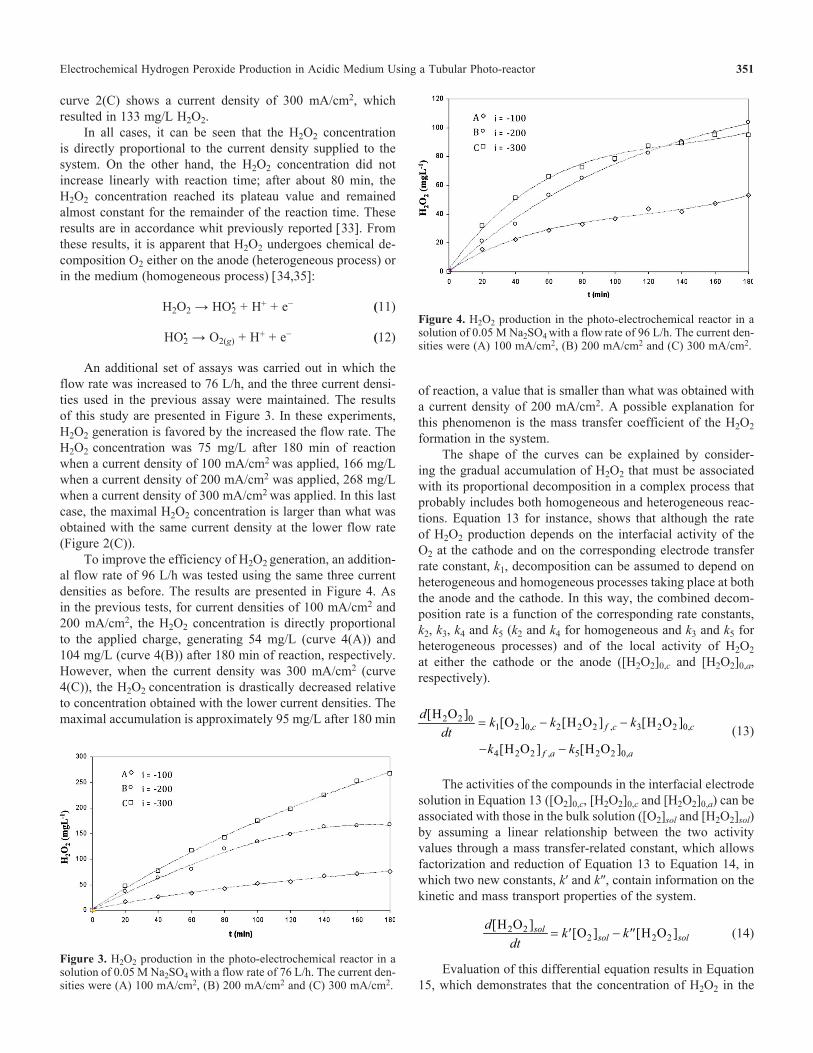
To improve the efficiency of H2O2 generation, an addition-al flow rate of 96 L/h was tested using the same three current densities as before. The results are presented in Figure 4. As in the previous tests, for current densities of 100 mA/cm2 and 200 mA/cm2, the H2O2 concentration is directly proportional to the applied charge, generating 54 mg/L (curve 4(A)) and 104 mg/L (curve 4(B)) after 180 min of reaction, respectively. However, when the current density was 300 mA/cm2 (curve 4(C)), the H2O2 concentration is drastically decreased relative to concentration obtained with the lower current densities. The maximal accumulation is approximately 95 mg/L after 180 min
of reaction, a value that is smaller than what was obtained with a current density of 200 mA/cm2. A possible explanation for this phenomenon is the mass transfer coefficient of the H2O2 formation in the system.
The shape of the curves can be explained by consider-ing the gradual accumulation of H2O2 that must be associated with its proportional decomposition in a complex process that probably includes both homogeneous and heterogeneous reac-tions. Equation 13 for instance, shows that although the rate of H2O2 production depends on the interfacial activity of the O2 at the cathode and on the corresponding electrode transfer rate constant, k1, decomposition can be assumed to depend on heterogeneous and homogeneous processes taking place at both the anode and the cathode. In this way, the combined decom-position rate is a function of the corresponding rate constants, k2, k3, k4 and k5 (k2 and k4 for homogeneous and k3 and k5 for heterogeneous processes) and of the local activity of H2O2 at either the cathode or the anode ([H2O2]0,c and [H2O2]0,a, respectively).
ddt
k k k
k k
c f c c
f a a
[ ] [ ] [ ] [ ]
[ ] [ ]
, , ,
, ,
H O O H O H O
H O H O
2 2 01 2 0 2 2 2 3 2 2 0
4 2 2 5 2 2 0
= − −
− − (13)
The activities of the compounds in the interfacial electrode solution in Equation 13 ([O2]0,c, [H2O2]0,c and [H2O2]0,a) can be associated with those in the bulk solution ([O2]sol and [H2O2]sol) by assuming a linear relationship between the two activity values through a mass transfer-related constant, which allows factorization and reduction of Equation 13 to Equation 14, in which two new constants, k′ and k″, contain information on the kinetic and mass transport properties of the system.
ddt
k ksolsol sol
[ ] [ ] [ ]H O O H O2 22 2 2= ′ − ′′ (14)
Evaluation of this differential equation results in Equation 15, which demonstrates that the concentration of H2O2 in the
Figure 3. H2O2 production in the photo-electrochemical reactor in a solution of 0.05 M Na2SO4 with a flow rate of 76 L/h. The current den-sities were (A) 100 mA/cm2, (B) 200 mA/cm2 and (C) 300 mA/cm2.
Figure 4. H2O2 production in the photo-electrochemical reactor in a solution of 0.05 M Na2SO4 with a flow rate of 96 L/h. The current den-sities were (A) 100 mA/cm2, (B) 200 mA/cm2 and (C) 300 mA/cm2.
352 J. Mex. Chem. Soc. 2014, 58(3) Juan M. Peralta-Hernández, and Luis A. Godínez
bulk solution follows an exponential relationship with time, which describes the behavior of each of the curves.
[ ] [ ] ( )H O O e2 22 1sol
sol k tkk
=′
′′FHG
IKJ − − ′′ (15)
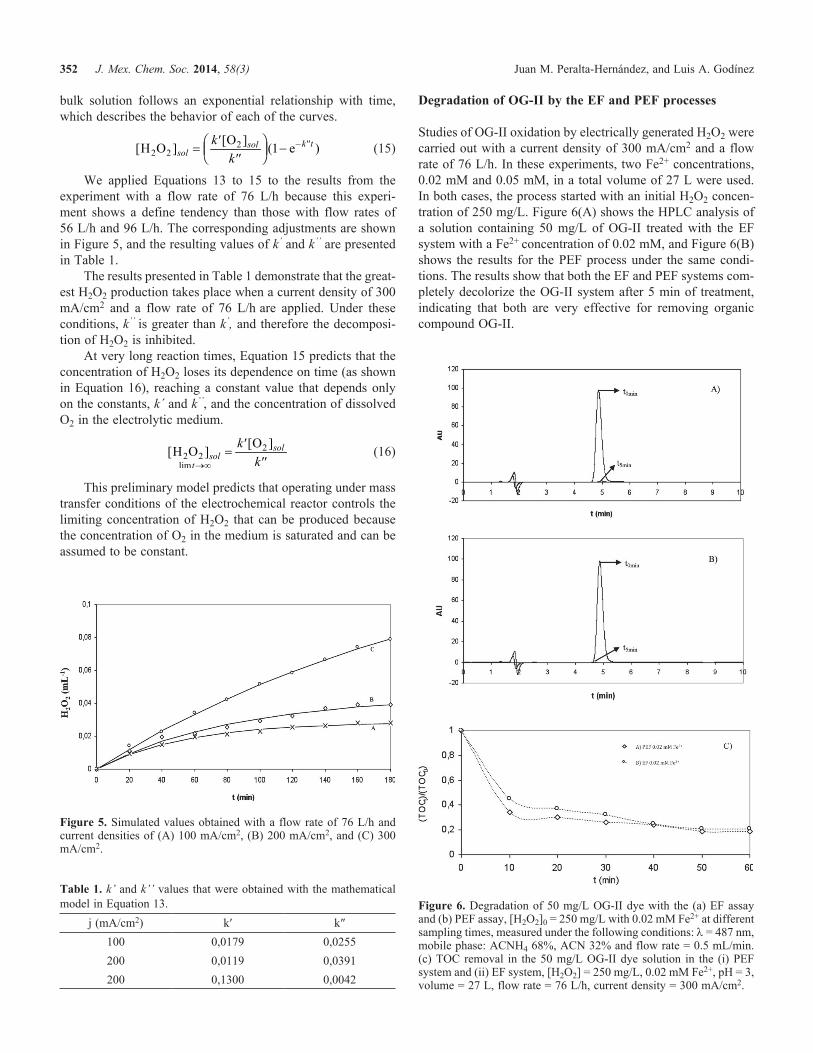
We applied Equations 13 to 15 to the results from the experiment with a flow rate of 76 L/h because this experi-ment shows a define tendency than those with flow rates of 56 L/h and 96 L/h. The corresponding adjustments are shown in Figure 5, and the resulting values of k’ and k’’ are presented in Table 1.
The results presented in Table 1 demonstrate that the great-est H2O2 production takes place when a current density of 300 mA/cm2 and a flow rate of 76 L/h are applied. Under these conditions, k’’ is greater than k’, and therefore the decomposi-tion of H2O2 is inhibited.
At very long reaction times, Equation 15 predicts that the concentration of H2O2 loses its dependence on time (as shown in Equation 16), reaching a constant value that depends only on the constants, k´ and k’’, and the concentration of dissolved O2 in the electrolytic medium.
[ ] [ ]lim
H O O2 2
2sol
t
solkk→∞
=′
′′ (16)
This preliminary model predicts that operating under mass transfer conditions of the electrochemical reactor controls the limiting concentration of H2O2 that can be produced because the concentration of O2 in the medium is saturated and can be assumed to be constant.
Degradation of OG-II by the EF and PEF processes
Studies of OG-II oxidation by electrically generated H2O2 were carried out with a current density of 300 mA/cm2 and a flow rate of 76 L/h. In these experiments, two Fe2+ concentrations, 0.02 mM and 0.05 mM, in a total volume of 27 L were used. In both cases, the process started with an initial H2O2 concen-tration of 250 mg/L. Figure 6(A) shows the HPLC analysis of a solution containing 50 mg/L of OG-II treated with the EF system with a Fe2+ concentration of 0.02 mM, and Figure 6(B) shows the results for the PEF process under the same condi-tions. The results show that both the EF and PEF systems com-pletely decolorize the OG-II system after 5 min of treatment, indicating that both are very effective for removing organic compound OG-II.
Figure 5. Simulated values obtained with a flow rate of 76 L/h and current densities of (A) 100 mA/cm2, (B) 200 mA/cm2, and (C) 300 mA/cm2.
Table 1. k’ and k’’ values that were obtained with the mathematical model in Equation 13.
j (mA/cm2) k′ k″100 0,0179 0,0255200 0,0119 0,0391200 0,1300 0,0042
Figure 6. Degradation of 50 mg/L OG-II dye with the (a) EF assay and (b) PEF assay, [H2O2]0 = 250 mg/L with 0.02 mM Fe2+ at different sampling times, measured under the following conditions: λ = 487 nm, mobile phase: ACNH4 68%, ACN 32% and flow rate = 0.5 mL/min. (c) TOC removal in the 50 mg/L OG-II dye solution in the (i) PEF system and (ii) EF system, [H2O2] = 250 mg/L, 0.02 mM Fe2+, pH = 3, volume = 27 L, flow rate = 76 L/h, current density = 300 mA/cm2.
Electrochemical Hydrogen Peroxide Production in Acidic Medium Using a Tubular Photo-reactor 353
Figure 6(C) shows TOC removal as a function of time for both the EF and PEF systems. With an Fe2+ concentration of 0.02 mM, the mineralization level of the OG-II dye was approximately 80% after 60 min of treatment with either the EF or PEF system. This phenomenon is caused by the photo-reduction of Fe(OH)2+ complexes to Fe2+, which increases the production of •OH oxidant species in the medium, in accor-dance with Equation 4.
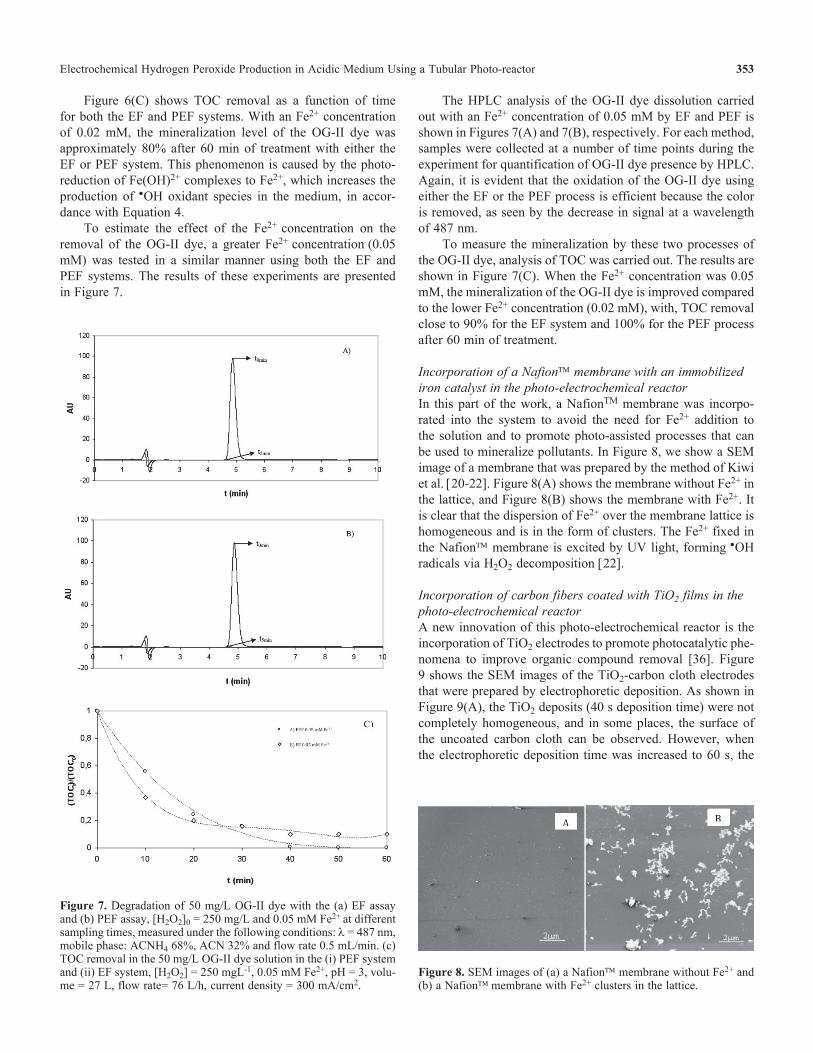
To estimate the effect of the Fe2+ concentration on the removal of the OG-II dye, a greater Fe2+ concentration (0.05 mM) was tested in a similar manner using both the EF and PEF systems. The results of these experiments are presented in Figure 7.
The HPLC analysis of the OG-II dye dissolution carried out with an Fe2+ concentration of 0.05 mM by EF and PEF is shown in Figures 7(A) and 7(B), respectively. For each method, samples were collected at a number of time points during the experiment for quantification of OG-II dye presence by HPLC. Again, it is evident that the oxidation of the OG-II dye using either the EF or the PEF process is efficient because the color is removed, as seen by the decrease in signal at a wavelength of 487 nm.
To measure the mineralization by these two processes of the OG-II dye, analysis of TOC was carried out. The results are shown in Figure 7(C). When the Fe2+ concentration was 0.05 mM, the mineralization of the OG-II dye is improved compared to the lower Fe2+ concentration (0.02 mM), with, TOC removal close to 90% for the EF system and 100% for the PEF process after 60 min of treatment.
Incorporation of a Nafion membrane with an immobilized iron catalyst in the photo-electrochemical reactorIn this part of the work, a NafionTM membrane was incorpo-rated into the system to avoid the need for Fe2+ addition to the solution and to promote photo-assisted processes that can be used to mineralize pollutants. In Figure 8, we show a SEM image of a membrane that was prepared by the method of Kiwi et al. [20-22]. Figure 8(A) shows the membrane without Fe2+ in the lattice, and Figure 8(B) shows the membrane with Fe2+. It is clear that the dispersion of Fe2+ over the membrane lattice is homogeneous and is in the form of clusters. The Fe2+ fixed in the Nafion membrane is excited by UV light, forming •OH radicals via H2O2 decomposition [22].
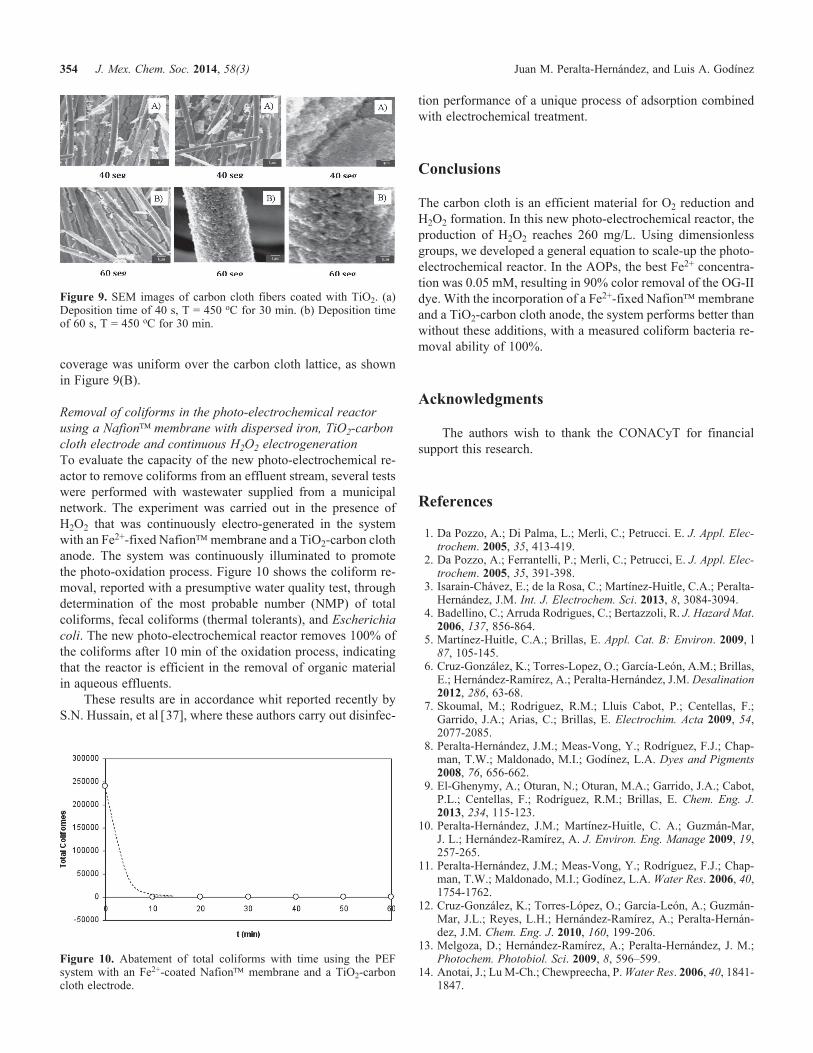
Incorporation of carbon fibers coated with TiO2 films in the photo-electrochemical reactorA new innovation of this photo-electrochemical reactor is the incorporation of TiO2 electrodes to promote photocatalytic phe-nomena to improve organic compound removal [36]. Figure 9 shows the SEM images of the TiO2-carbon cloth electrodes that were prepared by electrophoretic deposition. As shown in Figure 9(A), the TiO2 deposits (40 s deposition time) were not completely homogeneous, and in some places, the surface of the uncoated carbon cloth can be observed. However, when the electrophoretic deposition time was increased to 60 s, the
Figure 7. Degradation of 50 mg/L OG-II dye with the (a) EF assay and (b) PEF assay, [H2O2]0 = 250 mg/L and 0.05 mM Fe2+ at different sampling times, measured under the following conditions: λ = 487 nm, mobile phase: ACNH4 68%, ACN 32% and flow rate 0.5 mL/min. (c) TOC removal in the 50 mg/L OG-II dye solution in the (i) PEF system and (ii) EF system, [H2O2] = 250 mgL-1, 0.05 mM Fe2+, pH = 3, volu-me = 27 L, flow rate= 76 L/h, current density = 300 mA/cm2.
Figure 8. SEM images of (a) a Nafion membrane without Fe2+ and (b) a Nafion membrane with Fe2+ clusters in the lattice.
354 J. Mex. Chem. Soc. 2014, 58(3) Juan M. Peralta-Hernández, and Luis A. Godínez
coverage was uniform over the carbon cloth lattice, as shown in Figure 9(B).
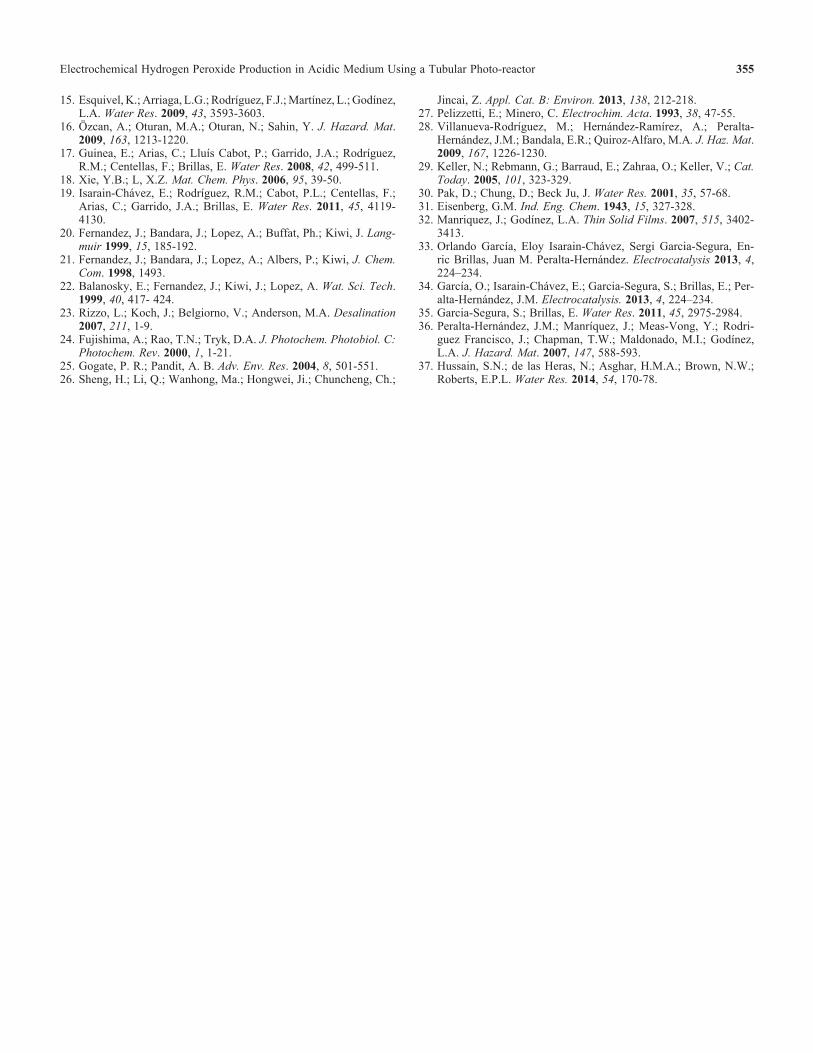
Removal of coliforms in the photo-electrochemical reactor using a Nafion membrane with dispersed iron, TiO2-carbon cloth electrode and continuous H2O2 electrogenerationTo evaluate the capacity of the new photo-electrochemical re-actor to remove coliforms from an effluent stream, several tests were performed with wastewater supplied from a municipal network. The experiment was carried out in the presence of H2O2 that was continuously electro-generated in the system with an Fe2+-fixed Nafion membrane and a TiO2-carbon cloth anode. The system was continuously illuminated to promote the photo-oxidation process. Figure 10 shows the coliform re-moval, reported with a presumptive water quality test, through determination of the most probable number (NMP) of total coliforms, fecal coliforms (thermal tolerants), and Escherichia coli. The new photo-electrochemical reactor removes 100% of the coliforms after 10 min of the oxidation process, indicating that the reactor is efficient in the removal of organic material in aqueous effluents.
These results are in accordance whit reported recently by S.N. Hussain, et al [37], where these authors carry out disinfec-
tion performance of a unique process of adsorption combined with electrochemical treatment.
Conclusions
The carbon cloth is an efficient material for O2 reduction and H2O2 formation. In this new photo-electrochemical reactor, the production of H2O2 reaches 260 mg/L. Using dimensionless groups, we developed a general equation to scale-up the photo-electrochemical reactor. In the AOPs, the best Fe2+ concentra-tion was 0.05 mM, resulting in 90% color removal of the OG-II dye. With the incorporation of a Fe2+-fixed Nafion membrane and a TiO2-carbon cloth anode, the system performs better than without these additions, with a measured coliform bacteria re-moval ability of 100%.
Acknowledgments
The authors wish to thank the CONACyT for financial support this research.
References
1. Da Pozzo, A.; Di Palma, L.; Merli, C.; Petrucci. E. J. Appl. Elec-trochem. 2005, 35, 413-419.
2. Da Pozzo, A.; Ferrantelli, P.; Merli, C.; Petrucci, E. J. Appl. Elec-trochem. 2005, 35, 391-398.
3. Isarain-Chávez, E.; de la Rosa, C.; Martínez-Huitle, C.A.; Peralta-Hernández, J.M. Int. J. Electrochem. Sci. 2013, 8, 3084-3094.
4. Badellino, C.; Arruda Rodrigues, C.; Bertazzoli, R. J. Hazard Mat. 2006, 137, 856-864.
5. Martínez-Huitle, C.A.; Brillas, E. Appl. Cat. B: Environ. 2009, l 87, 105-145.
6. Cruz-González, K.; Torres-Lopez, O.; García-León, A.M.; Brillas, E.; Hernández-Ramírez, A.; Peralta-Hernández, J.M. Desalination 2012, 286, 63-68.
7. Skoumal, M.; Rodriguez, R.M.; Lluis Cabot, P.; Centellas, F.; Garrido, J.A.; Arias, C.; Brillas, E. Electrochim. Acta 2009, 54, 2077-2085.
8. Peralta-Hernández, J.M.; Meas-Vong, Y.; Rodríguez, F.J.; Chap-man, T.W.; Maldonado, M.I.; Godínez, L.A. Dyes and Pigments 2008, 76, 656-662.
9. El-Ghenymy, A.; Oturan, N.; Oturan, M.A.; Garrido, J.A.; Cabot, P.L.; Centellas, F.; Rodríguez, R.M.; Brillas, E. Chem. Eng. J. 2013, 234, 115-123.
10. Peralta-Hernández, J.M.; Martínez-Huitle, C. A.; Guzmán-Mar, J. L.; Hernández-Ramírez, A. J. Environ. Eng. Manage 2009, 19, 257-265.
11. Peralta-Hernández, J.M.; Meas-Vong, Y.; Rodríguez, F.J.; Chap-man, T.W.; Maldonado, M.I.; Godínez, L.A. Water Res. 2006, 40, 1754-1762.
12. Cruz-González, K.; Torres-López, O.; García-León, A.; Guzmán-Mar, J.L.; Reyes, L.H.; Hernández-Ramírez, A.; Peralta-Hernán-dez, J.M. Chem. Eng. J. 2010, 160, 199-206.
13. Melgoza, D.; Hernández-Ramírez, A.; Peralta-Hernández, J. M.; Photochem. Photobiol. Sci. 2009, 8, 596–599.
14. Anotai, J.; Lu M-Ch.; Chewpreecha, P. Water Res. 2006, 40, 1841-1847.
Figure 10. Abatement of total coliforms with time using the PEF system with an Fe2+-coated Nafion membrane and a TiO2-carbon cloth electrode.
Figure 9. SEM images of carbon cloth fibers coated with TiO2. (a) Deposition time of 40 s, T = 450 oC for 30 min. (b) Deposition time of 60 s, T = 450 oC for 30 min.
Electrochemical Hydrogen Peroxide Production in Acidic Medium Using a Tubular Photo-reactor 355
15. Esquivel, K.; Arriaga, L.G.; Rodríguez, F.J.; Martínez, L.; Godínez, L.A. Water Res. 2009, 43, 3593-3603.
16. Özcan, A.; Oturan, M.A.; Oturan, N.; Sahin, Y. J. Hazard. Mat. 2009, 163, 1213-1220.
17. Guinea, E.; Arias, C.; Lluís Cabot, P.; Garrido, J.A.; Rodríguez, R.M.; Centellas, F.; Brillas, E. Water Res. 2008, 42, 499-511.
18. Xie, Y.B.; L, X.Z. Mat. Chem. Phys. 2006, 95, 39-50. 19. Isarain-Chávez, E.; Rodríguez, R.M.; Cabot, P.L.; Centellas, F.;
Arias, C.; Garrido, J.A.; Brillas, E. Water Res. 2011, 45, 4119-4130.
20. Fernandez, J.; Bandara, J.; Lopez, A.; Buffat, Ph.; Kiwi, J. Lang-muir 1999, 15, 185-192.
21. Fernandez, J.; Bandara, J.; Lopez, A.; Albers, P.; Kiwi, J. Chem. Com. 1998, 1493.
22. Balanosky, E.; Fernandez, J.; Kiwi, J.; Lopez, A. Wat. Sci. Tech. 1999, 40, 417- 424.
23. Rizzo, L.; Koch, J.; Belgiorno, V.; Anderson, M.A. Desalination 2007, 211, 1-9.
24. Fujishima, A.; Rao, T.N.; Tryk, D.A. J. Photochem. Photobiol. C: Photochem. Rev. 2000, 1, 1-21.
25. Gogate, P. R.; Pandit, A. B. Adv. Env. Res. 2004, 8, 501-551. 26. Sheng, H.; Li, Q.; Wanhong, Ma.; Hongwei, Ji.; Chuncheng, Ch.;
Jincai, Z. Appl. Cat. B: Environ. 2013, 138, 212-218. 27. Pelizzetti, E.; Minero, C. Electrochim. Acta. 1993, 38, 47-55. 28. Villanueva-Rodríguez, M.; Hernández-Ramírez, A.; Peralta-
Hernández, J.M.; Bandala, E.R.; Quiroz-Alfaro, M.A. J. Haz. Mat. 2009, 167, 1226-1230.
29. Keller, N.; Rebmann, G.; Barraud, E.; Zahraa, O.; Keller, V.; Cat. Today. 2005, 101, 323-329.
30. Pak, D.; Chung, D.; Beck Ju, J. Water Res. 2001, 35, 57-68. 31. Eisenberg, G.M. Ind. Eng. Chem. 1943, 15, 327-328. 32. Manriquez, J.; Godínez, L.A. Thin Solid Films. 2007, 515, 3402-
3413. 33. Orlando García, Eloy Isarain-Chávez, Sergi Garcia-Segura, En-
ric Brillas, Juan M. Peralta-Hernández. Electrocatalysis 2013, 4, 224–234.
34. García, O.; Isarain-Chávez, E.; Garcia-Segura, S.; Brillas, E.; Per-alta-Hernández, J.M. Electrocatalysis. 2013, 4, 224–234.
35. Garcia-Segura, S.; Brillas, E. Water Res. 2011, 45, 2975-2984. 36. Peralta-Hernández, J.M.; Manríquez, J.; Meas-Vong, Y.; Rodri-
guez Francisco, J.; Chapman, T.W.; Maldonado, M.I.; Godínez, L.A. J. Hazard. Mat. 2007, 147, 588-593.
37. Hussain, S.N.; de las Heras, N.; Asghar, H.M.A.; Brown, N.W.; Roberts, E.P.L. Water Res. 2014, 54, 170-78.


![Electrochemical reduction of hydrogen peroxide on SIMFUEL ......amorphization and decomposition [32]. Although neutral to slightly alkaline conditions (pH 6–9.5) are expected to](https://img.pdfslide.us/doc/110x75/60f691a589db74567b7b1496/electrochemical-reduction-of-hydrogen-peroxide-on-simfuel-amorphization.jpg)


![Electrochemical investigation and Quantum …...protection against corrosion in acidic media [6-7].Organic inhibitors whose mode of action usually results in their adsorption on the](https://img.pdfslide.us/doc/110x75/5f266b396d0cc24ed13eba0a/electrochemical-investigation-and-quantum-protection-against-corrosion-in-acidic.jpg)
![Int. J. Electrochem. Sci., (2017) · 2017. 10. 13. · electrode from acidic solution. The electrochemical behaviour of polyaniline/glassy carbon modified electrode in [Bu 4 N][BF](https://img.pdfslide.us/doc/110x75/60a9d5e8a3df0611d50c59d4/int-j-electrochem-sci-2017-2017-10-13-electrode-from-acidic-solution.jpg)