Embed Size (px)
Citation preview

NATURE CHEMISTRY | www.nature.com/naturechemistry 1
SUPPLEMENTARY INFORMATIONDOI: 10.1038/NCHEM.1960
1
Supplementary Information for
Bulk Protonic Conductivity in a Cephalopod Structural Protein
David D. Ordinario1, Long Phan1, Ward G. Walkup IV1
, Jonah-Micah Jocson1, Emil Karshalev1,
Nina Hüsken1, Alon A. Gorodetsky1,2*
1Department of Chemical Engineering and Materials Science, University of California, Irvine,
Irvine, California 92697, USA
2Department of Chemistry, University of California, Irvine, Irvine, California 92697, USA
*Correspondence and requests for materials should be addressed to: [email protected]
Supplementary Methods:
(I) Design and Cloning of Wild Type and Mutant Reflectin A1 Genes:
A. Wild Type Reflectin A1: An E. coli codon optimized gene coding for 6x histidine tagged
wild type reflectin A1 protein from Doryteuthis (formerly Loligo) pealeii (Genbank:
ACZ57764.1) was synthesized and cloned into pJExpress414 vector (DNA2.0). The wild type
sequence is shown in Supplementary Figs 1 and 3.
B. DE->A Mutant: The DE->A mutant reflectin A1 protein was designed using Gene Designer
2.0 software (DNA2.0). To generate the DE->A mutant reflectin A1, all aspartic acid
(GAT/GAC) and glutamic acid (GAA/GAG) codons in wild type reflectin A1 were replaced
with alanine codons (GCA/GCC/GCG/GCT), resulting in a total of 34 DE->A mutations. The
DE->A reflectin A1 mutant gene was then synthesized (GeneArt) and restriction cloned into a
pJExpress414 plasmid in frame with an N-terminal 6x histidine tag. The DE->A sequence is
shown in Supplementary Fig. 9.
C. Random Mutant: A scrambled mutant reflectin A1 protein was designed using the Emboss
shuffleseq and Needle algorithms. The wild type reflectin A1 amino acid sequence was input
© 2014 Macmillan Publishers Limited. All rights reserved.
NATURE CHEMISTRY | www.nature.com/naturechemistry 2
SUPPLEMENTARY INFORMATIONDOI: 10.1038/NCHEM.1960
2
into Emboss shuffleseq and run for 20 shufflings. The resulting sequences were then force
aligned in pairwise alignments with wild type reflectin A1 using the Emboss Needle algorithm
(BLOSUM62 matrix, 100 Gap Open, 10 Gap Extend, End Gap Penalty True, 10 End Gap Open,
10 End Gap Extend). The alignments were examined to select a Random reflectin A1 protein
sequence that lacked any (M/F-D-X5)(M-DX5)n(M-D-X3-4) repeats and exhibited minimal global
pairwise sequence identity (7.4%) to wild type reflectin A1. The scrambled sequence is shown in
Supplementary Fig. 11.
(II) Expression and Purification of Wild Type and Mutant Reflectin A1: A general protocol
was used for the expression and purification of wild type and mutant reflectin A1 (47). In brief,
the pJExpress414 expression vectors containing wild type or mutant reflectin were transformed
into BL21(DE3) cells (Novagen). Reflectins were expressed at 37 °C using Overnight Express
Instant Terrific Broth (TB) media (Novagen) supplemented with 100 µg mL-1 Carbenicillin.
Reflectin was completely insoluble when expressed at 37 °C and was sequestered in inclusion
bodies prepared using Novagen BugBuster® according to the manufacturer’s suggested protocol.
Reflectin inclusion bodies were then solubilized in denaturing buffer (pH 7.4, 50 mM Sodium
Phosphate, 300 mM NaCl, 6M guanidine hydrochloride) and purified under denaturing
conditions on HisPur Cobalt Resin (Thermo Scientific) immobilized metal affinity
chromatography (IMAC) gravity columns according to the manufacturer’s protocols. The protein
was eluted by using denaturing buffer supplemented with 250 mM imidazole. The fractions
containing reflectin were pooled and concentrated on Millipore Amicon Concentrators before
further purification with high-performance liquid chromatography (HPLC) on an Agilent 1260
Infinity system using an Agilent reverse phase C18 column with a gradient evolved from 95%
Buffer A:5% Buffer B to 5% Buffer A:95% Buffer B at a flow rate of 1 mL min-1 over 30
© 2014 Macmillan Publishers Limited. All rights reserved.

NATURE CHEMISTRY | www.nature.com/naturechemistry 3
SUPPLEMENTARY INFORMATIONDOI: 10.1038/NCHEM.1960
3
minutes (Buffer A: 99.9% H2O, 0.1% TFA; Buffer B: 95% acetonitrile, 4.9% H2O, 0.1% TFA).
The pure reflectin fractions were pooled, flash frozen in liquid nitrogen, and lyophilized. Protein
concentrations and yields were quantified via a Bradford protein assay with bovine serum
albumin (BSA) as a standard (BioRad).
(III) Characterization of Wild Type and Mutant Reflectin A1: A general protocol was used
for assaying the purity and confirming the sequence of both wild type and mutant reflectin A1. In
brief, purified and unpurified reflectin samples were analyzed by SDS-PAGE and GelCode Blue
Staining (Thermo) using an Invitrogen XCell SureLock Mini using NuPAGE Novex 4-12% Bis-
Tris gels, with NuPAGE MOPS as the running buffer under reducing conditions. Stained protein
bands were subjected to in-gel tryptic digestion, performed according to literature procedures
(66). After digestion, the peptides were separated on a C18 chromatography column and
analyzed by mass spectrometry on a Thermo Orbitrap instrument outfitted with an electrospray
ionization source. The resulting sequence coverage was 94% for the wild type reflectin A1
(Supplementary Fig. 3), 94% for the DE->A mutant reflectin A1 (Supplementary Fig. 9), and
34% for the Random mutant reflectin A1 (Supplementary Fig. 11).
(IV) Fabrication of Reflectin Devices:
A. Preparation of Substrates: For two- and three-terminal direct current measurements, the
devices were fabricated on SiO2/Si substrates. The substrates were cut from 4 inch, 405 to 455
µm thick, p-type Boron doped wafers, with a <100> crystallographic orientation and a 3000 Å
oxide layer on both sides (International Wafer Service). The wafers were sectioned into
individual 1.5 cm2 chips using standard lithographic techniques. For three-terminal transistor
measurements, the chips were etched to reduce the thickness of the oxide layer to ~900 Å, as
confirmed by ellipsometry. Prior to deposition of the electrodes, the substrates were cleaned in
© 2014 Macmillan Publishers Limited. All rights reserved.
NATURE CHEMISTRY | www.nature.com/naturechemistry 4
SUPPLEMENTARY INFORMATIONDOI: 10.1038/NCHEM.1960
4
Piranha solution (1:3 hydrogen peroxide to sulfuric acid). For electrochemical impedance
spectroscopy measurements, the devices were fabricated on glass slides (Fisher Scientific). The
glass substrates were cleaned by sequential sonication in acetone and isopropanol prior to
deposition of the electrodes.
B. Deposition of Electrical Contacts: The electrodes consisted of a 4 nm chromium layer
overlaid with either a 40 nm gold layer or a 40 nm palladium layer. The metals were deposited
onto the clean SiO2/Si or glass substrates via shadow mask lithography with a CV-8 Electron
Beam Deposition System (Temescal). To fabricate completed devices, reflectin solutions were
drop cast onto the electrodes, with the solvent allowed to evaporate in ambient overnight. The
resulting films were mechanically scribed with a probe station needle to leave a rectangular
reflectin square spanning each electrode pair (Supplementary Figs 4 and 7). Reflectin films
fabricated in this fashion were smooth and featureless, as determined by AFM (Supplementary
Fig. 4).
(V) Microscopy of Reflectin Films
A. Optical Microscopy: Each completed reflectin device was imaged with an Axio Imager A1
Microscope (Carl Zeiss) outfitted with an Epiplan 20X, NA = 0.4 lens (Carl Zeiss). The image
data was processed with AxioVision AC Release 4.5 (Carl Zeiss), and the device dimensions
(length and width) were extracted from analysis of these images. A typical optical image of a
reflectin device is shown in Supplementary Fig. 4.
B. Atomic Force Microscopy: The thickness of all reflectin films was measured with atomic
force microscopy (AFM) by examining trenches scribed directly into the films. Iridium coated
silicon probes (Asylum Research ASYELEC-01) were used to record the images. The films were
examined in situ at different relative humidities with a MFP-3D AFM (Asylum Research)
© 2014 Macmillan Publishers Limited. All rights reserved.

NATURE CHEMISTRY | www.nature.com/naturechemistry 5
SUPPLEMENTARY INFORMATIONDOI: 10.1038/NCHEM.1960
5
outfitted with a Humidity Sensing Cell (Asylum Research). The images were collected by using
iridium coated silicon probes (Asylum Research ASYELEC-01) with a spring constant of 2 N m-
1, resonance frequency of 70 kHz, and tip radius of 28 nm. The scans were rastered either at 0.17
Hz or at 1.0 Hz and normalized using polynomial subtraction for improved image quality; a
typical AFM topography scan of a reflectin film is shown in Supplementary Fig. 4. The thickness
of the films was found to increase by ~40% upon going from dry conditions (< 50% relative
humidity) to 90% relative humidity. The swollen thicknesses of the reflectin films under
appropriate humidified conditions were reported for the device dimensions in all instances and
were used for the relevant calculations. All AFM data and parameters were processed/extracted
with the Gwyddion software package.
(VI) Electrical Characterization of Reflectin Devices:
A. Two-Terminal Measurements with Gold or Palladium Electrodes: Current as a function
of voltage was recorded at various relative humidities on a PM-5 Probe Station (Cascade
Microtech) outfitted with a 4156C Semiconductor Parameter Analyzer (Agilent). The electrical
measurements were performed in ambient atmosphere under controlled-humidity conditions,
with the humidity constantly monitored via a hygrometer (Fisher Scientific). The sweep rate was
0.2 V µs-1 and the hold time was 0.5 s. The dimensions of the paired electrodes were 100 µm
wide by 400 µm long, with an inter-electrode separation of 50 µm.
B. Three-Terminal Measurements with Palladium Hydride Electrodes: Current was
recorded as a function of source-drain voltage (at different gate voltages) in a humidified
environment on a PM-5 Probe Station (Cascade Microtech) outfitted with a 4156C
Semiconductor Parameter Analyzer (Agilent). The electrical measurements were performed
under a 5% hydrogen/95% argon atmosphere, with the humidity carefully controlled and
© 2014 Macmillan Publishers Limited. All rights reserved.

NATURE CHEMISTRY | www.nature.com/naturechemistry 6
SUPPLEMENTARY INFORMATIONDOI: 10.1038/NCHEM.1960
6
constantly monitored via a hygrometer (Fisher Scientific). The sweep rate was 0.2 V µs-1 and the
hold time was 0.5 s. The dimensions of the paired electrodes were 100 µm wide by 400 µm long
with a channel length of 50 µm.
C. Electrochemical Impedance Spectroscopy Measurements with Gold Electrodes:
Impedance data was recorded with a 4192A LF Impedance Analyzer (Hewlett Packard) or a
4294A Impedance Analyzer (Agilent). The electrical measurements were performed in a
humidified environment at various frequencies with a constant applied voltage of 500 mV. The
data was collected at temperatures between 25 °C to 65 °C, with the humidity constantly
monitored via a hygrometer. Before each measurement, a 30 minute dwell at each temperature
was used to ensure thermal stability. The dimensions of the paired electrodes were 2.5 cm wide
by 3 cm long with an inter-electrode separation of 100 µm.
(VII) Electrochemistry of Reflectin Thin Films
A. Preparation of Reflectin-modified Electrodes:
Electrochemical experiments were performed with gold working electrodes with a diameter of 2
mm (CH Instruments). The electrodes were sequentially polished with 0.3 µm and 0.05 µm wet
alumina slurries on microcloth (Buehler) and then thoroughly rinsed and sonicated in Milli-Q
water to remove remaining adsorbed alumina traces. The electrodes were subsequently
electrochemically etched in 1 M H2SO4 to expose a clean gold surface and rinsed again with
Milli-Q water. Reflectin films were formed by directly depositing reflectin solutions onto clean
electrodes and allowing the solvent to evaporate overnight.
B. Cyclic Voltammetry of Reflectin Thin Films:
Cyclic voltammetry (CV) experiments were performed in a three-electrode electrochemical cell
on a CHI832C Electrochemical Analyzer (CH Instruments). The reflectin-coated gold electrode
© 2014 Macmillan Publishers Limited. All rights reserved.

NATURE CHEMISTRY | www.nature.com/naturechemistry 7
SUPPLEMENTARY INFORMATIONDOI: 10.1038/NCHEM.1960
7
served as the working electrode, a platinum wire served as the auxiliary electrode, and a
silver/silver chloride electrode served as the reference electrode. The measurements were
performed in 10X BupH Phosphate Buffered Saline (pH 7.2, 1 M phosphate, 1.5 M sodium
chloride), which was purged with argon (Thermo Scientific). The high salt content of this buffer
ensured that the reflectin remained insoluble and bound to the electrode during the
electrochemical measurements.
(VIII) Water Uptake of Reflectin and Reflectin Mutants
A. Preparation of Reflectin Samples: A small amount (~1–5 mg) of either wild type or mutant
reflectin was weighed out onto a clean platinum pan. The sample was then hydrated in either
water or deuterium oxide vapor at a relative humidity of 90% immediately prior to analysis.
B. Analysis of Reflectin Samples: Thermogravimetric analysis of solvent mass loss was
performed on a TGA Q500 instrument (TA Instruments). Sample pans containing either wild
type or mutant reflectin were loaded into the instrument and heated under a nitrogen atmosphere
at a ramp rate of 20 °C per minute, from room temperature to 350 °C.
(IX) Details of Calculations
A. Calculation of Conductivity from Three-Terminal Measurements with Palladium
Hydride Electrodes: The conductivity of reflectin films was obtained from the current versus
voltage characteristics of the reflectin transistors. The slope of the source-drain current (IDS)
versus source-drain voltage (VDS) curves at a gate voltage VGS = 0 V yielded the device
conductance, i.e. slope = 1/Ro = G (40, 67, 68). The conductivity was calculated according to the
equation:
© 2014 Macmillan Publishers Limited. All rights reserved.
NATURE CHEMISTRY | www.nature.com/naturechemistry 8
SUPPLEMENTARY INFORMATIONDOI: 10.1038/NCHEM.1960
8
where σ is the conductivity, G is the conductance, d is the channel length, and A is the cross-
sectional area of the film (67, 68). As an example, for 1/Ro = G = 6.76 x 10⁻⁸ Ω
-1, d = 50 µm, and
A = 315 µm2, the equation above yielded σ = 1.07 x 10⁻⁴ S cm-1.
B. Calculation of Conductivity from Electrochemical Impedance Spectroscopy
Measurements with Gold Electrodes: The impedance spectra were analyzed with ZView
version 3.2c (Scribner Associates). The software was used to generate Nyquist plots and to fit the
data to a simple equivalent circuit consisting of a capacitor (Ci) in series with a resistor (Rb) and
a capacitor (Cb) (Fig. 1). In the equivalent circuit, Ci corresponds to the capacitance of the
film/electrode interface, Rb corresponds to the bulk resistance of the film, and Cb corresponds to
the bulk capacitance of the film (58–62). The film resistance was extracted from this model and
used in equation 1 to calculate the conductivity. The calculations were performed for
measurements taken in 5 °C increments at temperatures between 30 °C and 65 °C. As an
example, at a temperature of 30 °C, R = 6.54 x 10⁴ Ω, G = 1.53 x 10⁻⁵ S, d = 100 µm, and A =
47,250 µm2, the equation above yielded σ = 3.24 x 10⁻⁴ S cm-1.
C. Calculation of the Activation Energy: The activation energy of proton hopping/transport
was determined from impedance measurements obtained at different temperatures. For proton
hopping, the conductivity follows a simplified temperature dependence of the form (53):
where σ is the conductivity, σo is a constant, Ea is the activation energy, R is the gas constant, and
T is the temperature (53). The resistance was extracted from the impedance measurements and
converted to the conductivity at temperatures between 30 °C and 65 °C. The log of the
conductivity was then plotted as a function of the temperature, as illustrated in Fig. 4 of the main
© 2014 Macmillan Publishers Limited. All rights reserved.

NATURE CHEMISTRY | www.nature.com/naturechemistry 9
SUPPLEMENTARY INFORMATIONDOI: 10.1038/NCHEM.1960
9
text. The slope of a linear fit of this plot was equal to –Ea/R, enabling calculation of the
activation energy.
D. Calculation of Gate Capacitance Per Unit Area: The gate capacitance per unit area was
calculated according to the equation:
where is the permittivity of free space and is the thickness of the gate oxide (67, 68). As
an example, for a gate oxide thickness of approximately to = 9.1 x 10⁻⁶ cm, the equation above
yielded a gate capacitance per unit area of CGS = 3.79 x 10⁻⁸ F cm-2.
E. Calculation of the Proton Mobility: The proton mobility was extracted from the transistor
transfer characteristics by using the gradual channel approximation (41). The slope of the IDS
versus VDS curves obtained at different VGS yielded the conductivity of reflectin at different gate
voltages. A plot of the conductivity as a function of the gate voltage was then fit with the
following equation:
where is the slope of the linear fit, t is the thickness of the reflectin film, and CGS is the
gate capacitance per unit area (41). As an example, for a slope with a value of –1.75 x 10⁻⁴ Ω-1, a
film thickness of t = 1.26 µm, and a gate capacitance per unit area of CGS = 3.79 x 10⁻⁸ F cm-2,
the equation above yielded a mobility of H+ = 5.82 x 10⁻³ cm2 V-1 s-1.
F. Calculation of the Experimental Proton Concentration at Different Gate Voltages: The
charge-carrier density (proton concentration) in reflectin-based devices was calculated by using
Oε
Ot
GSV∂
∂σ
© 2014 Macmillan Publishers Limited. All rights reserved.

NATURE CHEMISTRY | www.nature.com/naturechemistry 10
SUPPLEMENTARY INFORMATIONDOI: 10.1038/NCHEM.1960
10
the mobility derived from the device transfer characteristics. The charge-carrier density was
calculated according to the following equation:
where σH+ is the conductivity evaluated at an arbitrary VGS, e is the elementary charge, and µH+ is
the mobility. As an example, for a conductivity of σ = 7.52 x 10⁻⁵ S cm-1 at VGS = 0 V and a
mobility of µH+ = 5.82 x 10⁻³ cm2 V-1s-1, the equation yielded a value of nH+ = 8.07 x 1016 cm-3
for the charge-carrier density.
G. Calculation of the Theoretical Proton Concentration at Different Gate Voltages: The
theoretically predicted charge-carrier density (proton concentration) under different applied gate
voltages was calculated according to the following equation (40, 41):
where nH+ is the theoretically predicted proton concentration at an arbitrary gate bias, nH+0 is the
experimentally observed proton concentration at VGS = 0 V, CGS is the gate capacitance per unit
area, e is the elementary charge, and t is the film thickness. As an example, for an experimentally
observed proton concentration of nH+0 = 8.07 x 1016 cm-3, a gate capacitance per unit area of CGS
= 3.79 x 10⁻⁸ F cm-2, and a film thickness of t = 1.26 µm, the equation yielded nH+ values of 9.96
x 1016 cm-3 at –10 V, 8.07 x 1016 cm-3 at 0 V, and 6.19 x 1016 cm-3 at 10 V.
© 2014 Macmillan Publishers Limited. All rights reserved.

NATURE CHEMISTRY | www.nature.com/naturechemistry 11
SUPPLEMENTARY INFORMATIONDOI: 10.1038/NCHEM.1960
11
Supplementary Figures:
Supplementary Figure 1. Primary Sequence and Subdomains of Reflectin. The primary
sequence of reflectin A1 from Doryteuthis (formerly Loligo) pealeii contains six repeating
subdomains with the (M/F-D-X5)(M-D-X5)n(M-D-X3-4) sequence motif (43–46). The
subdomains are outlined by orange ovals. Aspartic and glutamic amino acid residues present in
both the subdomains and linker regions are highlighted in red. Methionine and phenylalanine
residues confined only to subdomains are highlighted in blue. Reflectin is comprised of ~30%
hydrophilic charged residues and ~20% hydrophobic aromatic residues (43–46).
© 2014 Macmillan Publishers Limited. All rights reserved.

NATURE CHEMISTRY | www.nature.com/naturechemistry 12
SUPPLEMENTARY INFORMATIONDOI: 10.1038/NCHEM.1960
12
Supplementary Figure 2. Purification of Wild Type Reflectin. a, GelCode Blue stained SDS-
PAGE gel of purified wild type reflectin A1. The left lane contains the Novex Sharp Unstained
Protein Standard covering molecular weights from 3.5 kDa to 260 kDa. The right lane contains
eluate from a HisPur Cobalt IMAC gravity column used to purify reflectin A1. The prominent
band at 40 kDa corresponds to the wild type reflectin A1 monomer. b, Typical reverse phase
HPLC chromatogram (C18 column) of wild type reflectin A1 following elution from the HisPur
Cobalt IMAC gravity column and concentration on a Millipore Amicon Concentrator. The
single, large peak at ~11 minutes indicates excellent purity.
© 2014 Macmillan Publishers Limited. All rights reserved.

NATURE CHEMISTRY | www.nature.com/naturechemistry 13
SUPPLEMENTARY INFORMATIONDOI: 10.1038/NCHEM.1960
13
Supplementary Figure 3. Sequence Confirmation of Purified Wild Type Reflectin by Mass
Spectrometry. A tryptic peptide sequence coverage map of the wild type reflectin A1 protein
obtained after mass spectrometry analysis of the porcine trypsin-digested protein. Bolded amino
acids with a yellow background correspond to amino acids comprising tryptic peptides. Bolded
amino acids with a green background correspond to oxidized amino acids comprising tryptic
peptides. The total sequence coverage of 94% definitively confirmed the purified protein’s
identity as wild type reflectin A1 (the ExPASy Peptide Mass program predicted a theoretical
coverage of 98.3%).
© 2014 Macmillan Publishers Limited. All rights reserved.

NATURE CHEMISTRY | www.nature.com/naturechemistry 14
SUPPLEMENTARY INFORMATIONDOI: 10.1038/NCHEM.1960
14
Supplementary Figure 4. Optical and AFM Images of Reflectin Devices. a, A typical optical
image of a reflectin device with a wild type reflectin film bridging two gold electrodes. The
dimensions of the electrodes were 100 µm wide by 400 µm long, with a separation of 50 µm. b,
Representative atomic force microscopy (AFM) image of a wild type reflectin film. The films
are smooth and featureless over large areas.
© 2014 Macmillan Publishers Limited. All rights reserved.

NATURE CHEMISTRY | www.nature.com/naturechemistry 15
SUPPLEMENTARY INFORMATIONDOI: 10.1038/NCHEM.1960
15
Supplementary Figure 5. Effect of Humidity on the Electrical Properties of Reflectin Films.
a, Current versus voltage measurements of a wild type reflectin film taken under dry conditions
(black) and with a film at a relative humidity of 90% (blue). Note the hysteresis between the
forward and reverse scans (the arrows indicate the scan direction). The identical measurement for
a device without any bridging material at a relative humidity of 90% is also plotted (green). b,
Close-up of the black and green curves from a, which demonstrate that dry films (measured at a
relative humidity of <50%) show no conductivity. For dry films, the current levels were on the
order of picoamps (black), similar to those found in devices lacking bridging material (green).
The device had a length of 50 µm, a width of 250 µm, and a thickness of 1.3 µm.
© 2014 Macmillan Publishers Limited. All rights reserved.

NATURE CHEMISTRY | www.nature.com/naturechemistry 16
SUPPLEMENTARY INFORMATIONDOI: 10.1038/NCHEM.1960
16
Supplementary Figure 6. Electrochemistry of Reflectin. A typical cyclic voltammogram for a
reflectin thin film on a gold electrode at a scan rate of 100 mV s-1 in phosphate buffer. Note that
no redox activity was observed for reflectin over a potential window of 0.7 V to –0.8 V (versus a
silver/silver chloride reference and a platinum auxiliary electrode).
© 2014 Macmillan Publishers Limited. All rights reserved.

NATURE CHEMISTRY | www.nature.com/naturechemistry 17
SUPPLEMENTARY INFORMATIONDOI: 10.1038/NCHEM.1960
17
Supplementary Figure 7. Optical Images of a Reflectin Device with PdHx Electrodes. a,
Typical optical image of a reflectin device, where a wild type reflectin film bridges the two PdHx
electrodes, prior to any electrical experiments. b, Typical optical image of a reflectin device,
where a wild type reflectin film bridges the two PdHx electrodes, after repeated electrical biasing
(more than ten scans). Note that there is no change in the coloration of the film after electrical
biasing. The reflectin film is continuing to perform its function (the reflection of light) and no
obvious degradation has occurred due to the electrical measurements. The dark triangles at the
bottom are the probe station needles used to electrically contact the electrodes.
© 2014 Macmillan Publishers Limited. All rights reserved.

NATURE CHEMISTRY | www.nature.com/naturechemistry 18
SUPPLEMENTARY INFORMATIONDOI: 10.1038/NCHEM.1960
18
Supplementary Figure 8. Purification of the DE->A Reflectin Mutant. a, GelCode Blue
stained SDS-PAGE gel of the purified DE->A reflectin A1 mutant. The left lane contains the
Novex Sharp Unstained Protein Standard covering molecular weights from 3.5 kDa to 260 kDa.
The right lane contains eluate from a HisPur Cobalt IMAC gravity column used to purify the
DE->A reflectin A1 mutant. The prominent band at 40 kDa corresponds to the DE->A reflectin
A1 mutant monomer. b, Typical reverse phase HPLC chromatogram (C18 column) of the DE-
>A reflectin A1 mutant following elution from the HisPur Cobalt IMAC gravity column and
concentration on a Millipore Amicon Concentrator. The single, large peak at ~12.5 minutes
indicates excellent purity.
© 2014 Macmillan Publishers Limited. All rights reserved.

NATURE CHEMISTRY | www.nature.com/naturechemistry 19
SUPPLEMENTARY INFORMATIONDOI: 10.1038/NCHEM.1960
19
Supplementary Figure 9. Sequence Confirmation of the Purified DE->A Reflectin Mutant
by Mass Spectrometry. A tryptic peptide sequence coverage map of the DE->A mutant reflectin
A1 protein obtained after mass spectrometry analysis of the porcine trypsin-digested protein.
Bolded amino acids with a yellow background correspond to amino acids comprising tryptic
peptides. Bolded amino acids with a green background correspond to oxidized amino acids
comprising tryptic peptides. The total sequence coverage of 94% definitively confirmed the
purified protein’s identity as the DE->A mutant reflectin A1 (the ExPASy Peptide Mass program
predicted a theoretical coverage of 98.3%).
© 2014 Macmillan Publishers Limited. All rights reserved.
NATURE CHEMISTRY | www.nature.com/naturechemistry 20
SUPPLEMENTARY INFORMATIONDOI: 10.1038/NCHEM.1960
20
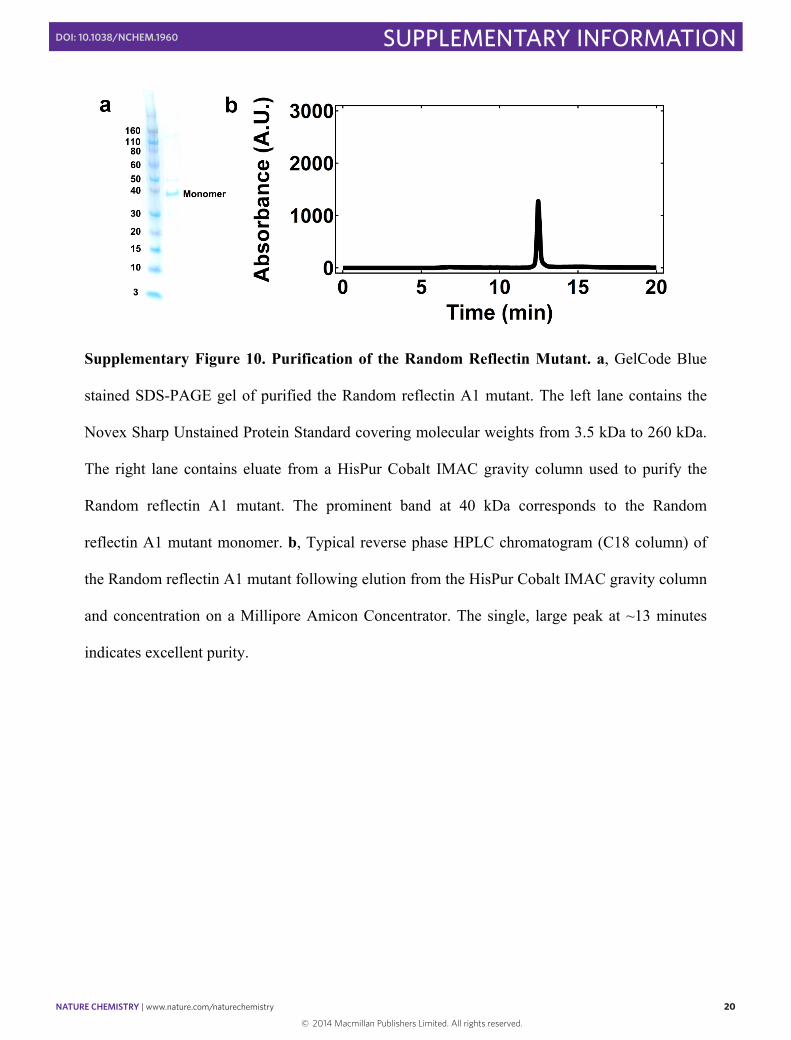
Supplementary Figure 10. Purification of the Random Reflectin Mutant. a, GelCode Blue
stained SDS-PAGE gel of purified the Random reflectin A1 mutant. The left lane contains the
Novex Sharp Unstained Protein Standard covering molecular weights from 3.5 kDa to 260 kDa.
The right lane contains eluate from a HisPur Cobalt IMAC gravity column used to purify the
Random reflectin A1 mutant. The prominent band at 40 kDa corresponds to the Random
reflectin A1 mutant monomer. b, Typical reverse phase HPLC chromatogram (C18 column) of
the Random reflectin A1 mutant following elution from the HisPur Cobalt IMAC gravity column
and concentration on a Millipore Amicon Concentrator. The single, large peak at ~13 minutes
indicates excellent purity.
© 2014 Macmillan Publishers Limited. All rights reserved.

NATURE CHEMISTRY | www.nature.com/naturechemistry 21
SUPPLEMENTARY INFORMATIONDOI: 10.1038/NCHEM.1960
21
Supplementary Figure 11. Sequence Confirmation of the Purified Random Reflectin
Mutant by Mass Spectrometry. A tryptic peptide sequence coverage map of the Random
mutant reflectin A1 protein obtained after mass spectrometry analysis of the porcine trypsin-
digested protein. Bolded amino acids with a yellow background correspond to amino acids
comprising tryptic peptides. Bolded amino acids with a green background correspond to oxidized
amino acids comprising tryptic peptides. The total sequence coverage of 34% definitively
confirmed the purified protein’s identity as the Random mutant reflectin A1 (the ExPASy
Peptide Mass program predicted a theoretical coverage of 50.7%).
© 2014 Macmillan Publishers Limited. All rights reserved.

NATURE CHEMISTRY | www.nature.com/naturechemistry 22
SUPPLEMENTARY INFORMATIONDOI: 10.1038/NCHEM.1960
22
Supplementary Figure 12. Transfer Characteristics for Three Typical Reflectin-Based
Protonic Transistors. a, Source-drain current (IDS) versus source-drain voltage (VDS)
characteristics recorded at gate biases (VGS) of –10 V (red curve), 0 V (black curve), and 10 V
(blue curve), and b, the experimentally determined proton concentrations at various gate voltages
(blue dots) for a transistor with a length of 50 µm, a width of 273 µm, and a thickness of 1.0 µm.
c, Source-drain current (IDS) versus source-drain voltage (VDS) characteristics recorded at gate
biases (VGS) of –10 V (red curve), 0 V (black curve), and 10 V (blue curve), and d, the
experimentally determined proton concentrations at various gate voltages (blue dots) for a
transistor with a length of 50 µm, a width of 250 µm, and a thickness of 1.3 µm. e, Source-drain
© 2014 Macmillan Publishers Limited. All rights reserved.

NATURE CHEMISTRY | www.nature.com/naturechemistry 23
SUPPLEMENTARY INFORMATIONDOI: 10.1038/NCHEM.1960
23
current (IDS) versus source-drain voltage (VDS) characteristics recorded at gate biases (VGS) of –
10 V (red curve), 0 V (black curve), and 10 V (blue curve), and f, the experimentally determined
proton concentrations at various gate voltages (blue dots) for a transistor with a length of 50 µm,
a width of 242 µm, and a thickness of 1.5 µm. The red lines in b, d, and f correspond to the
theoretically expected proton concentrations at different gate voltages. Note the excellent
reproducibility of the electrostatic gating of the protonic current and the agreement between the
expected and observed trends for the proton concentrations. The devices were fabricated on a
SiO2/Si substrate with PdHx electrodes as the electrical contacts.
© 2014 Macmillan Publishers Limited. All rights reserved.
NATURE CHEMISTRY | www.nature.com/naturechemistry 24
SUPPLEMENTARY INFORMATIONDOI: 10.1038/NCHEM.1960
24
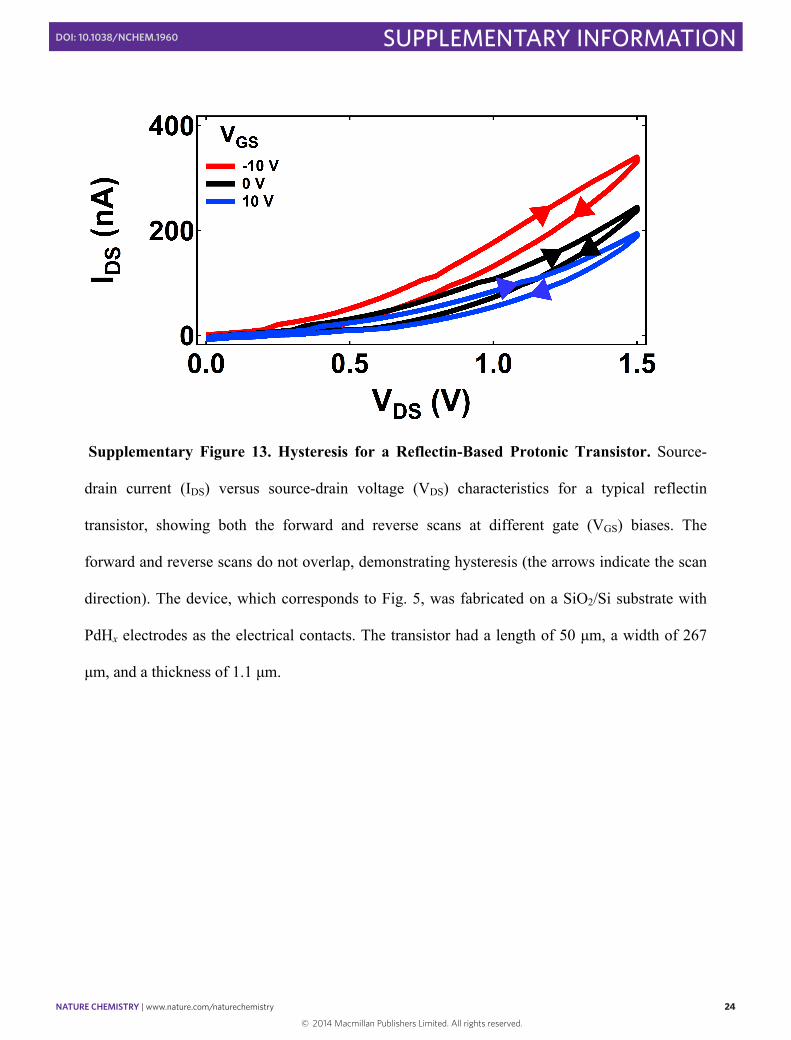
Supplementary Figure 13. Hysteresis for a Reflectin-Based Protonic Transistor. Source-
drain current (IDS) versus source-drain voltage (VDS) characteristics for a typical reflectin
transistor, showing both the forward and reverse scans at different gate (VGS) biases. The
forward and reverse scans do not overlap, demonstrating hysteresis (the arrows indicate the scan
direction). The device, which corresponds to Fig. 5, was fabricated on a SiO2/Si substrate with
PdHx electrodes as the electrical contacts. The transistor had a length of 50 µm, a width of 267
µm, and a thickness of 1.1 µm.
© 2014 Macmillan Publishers Limited. All rights reserved.

NATURE CHEMISTRY | www.nature.com/naturechemistry 25
SUPPLEMENTARY INFORMATIONDOI: 10.1038/NCHEM.1960
25
Supplementary Figure 14. Leakage Current for a Reflectin-Based Protonic Transistor.
Typical gate current (IGS) versus source gate bias (VGS) characteristics where the source-drain
bias (VDS) is held at zero. The device, which corresponds to Supplementary Fig. 12c, was
fabricated on a SiO2/Si substrate with PdHx electrodes as the electrical contacts. The transistor
had a length of 50 µm, a width of 250 µm, and a thickness of 1.3 µm.
© 2014 Macmillan Publishers Limited. All rights reserved.
NATURE CHEMISTRY | www.nature.com/naturechemistry 26
SUPPLEMENTARY INFORMATIONDOI: 10.1038/NCHEM.1960
26
Supplementary Tables:
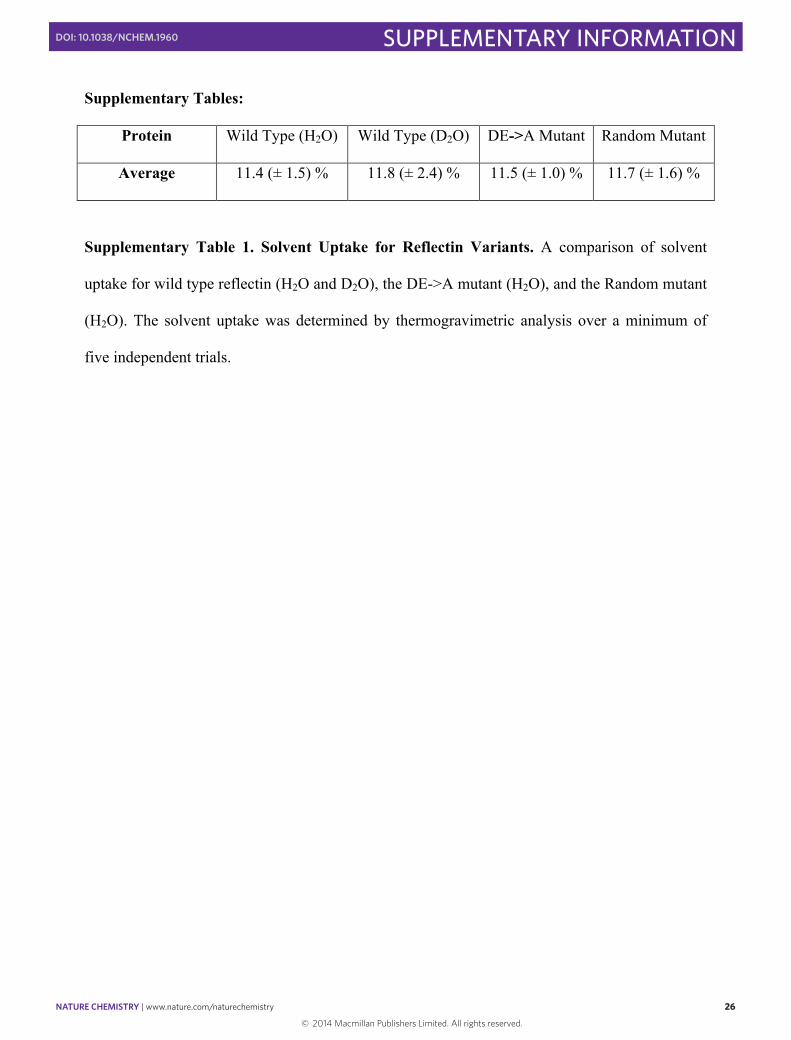
Protein Wild Type (H2O) Wild Type (D2O) DE->A Mutant Random Mutant
Average 11.4 (± 1.5) % 11.8 (± 2.4) % 11.5 (± 1.0) % 11.7 (± 1.6) %
Supplementary Table 1. Solvent Uptake for Reflectin Variants. A comparison of solvent
uptake for wild type reflectin (H2O and D2O), the DE->A mutant (H2O), and the Random mutant
(H2O). The solvent uptake was determined by thermogravimetric analysis over a minimum of
five independent trials.
© 2014 Macmillan Publishers Limited. All rights reserved.

NATURE CHEMISTRY | www.nature.com/naturechemistry 27
SUPPLEMENTARY INFORMATIONDOI: 10.1038/NCHEM.1960
27
Reflectin Device Width (µm) Thickness (µm) Appears in:
Wild Type #1 25,000 4.6 Figure 1
Wild Type #2 220 1.3 Figure 2
Wild Type #3 265 0.8 Figure 3
Wild Type #4 25,000 2.6 Figure 4
Wild Type #5 267 1.1 Figure 5
Supplementary Figure 13
Wild Type #6 250 1.3 Supplementary Figure 5
Wild Type #7 273 1.0 Supplementary Figure 12a
Supplementary Figure 12b
Wild Type #8 250 1.3 Supplementary Figure 12c
Supplementary Figure 12d
Supplementary Figure 14
Wild Type #9 242 1.5 Supplementary Figure 12e
Supplementary Figure 12f
DE-A Mutant 210 1.0 Figure 3
Random Mutant 220 1.1 Figure 3
Supplementary Table 2. Collated Dimensions of the Reflectin Devices from the Figures.
Dimensions for the wild type, DE->A mutant, and Random mutant reflectin films, as determined
from atomic force microscopy (AFM) and optical microscopy.
© 2014 Macmillan Publishers Limited. All rights reserved.

NATURE CHEMISTRY | www.nature.com/naturechemistry 28
SUPPLEMENTARY INFORMATIONDOI: 10.1038/NCHEM.1960
28
Supplementary References:
66. Shevchenko, A., Tomas, H., Havlis, J., Olsen, J. V. & Mann, M. In-gel digestion for mass
spectrometric characterization of proteins and proteomes. Nat. Protoc. 1, 2856–2860 (2006).
67. Sze, S. M. & Ng, K. K. Physics of Semiconductor Devices, 3rd edn (Wiley, 2006).
68. Kymissis, I. Organic Field Effect Transistors: Theory, Fabrication and Characterization
(Integrated Circuits and Systems) (Springer, 2009).
© 2014 Macmillan Publishers Limited. All rights reserved.