Embed Size (px)
Citation preview
Em
Fa
Cb
a
ARRAA
KOEMU
1
rc(1eilMeemeamcts
C
0d
Biosensors and Bioelectronics 25 (2010) 1408–1413
Contents lists available at ScienceDirect
Biosensors and Bioelectronics
journa l homepage: www.e lsev ier .com/ locate /b ios
lectrochemical determination of morphine at ordered mesoporous carbonodified glassy carbon electrode
ei Lia, Jixia Songa, Changsheng Shana, Dongmei Gaoa, Xiaoyu Xua,b,∗,1, Li Niua,∗∗,1
State Key Laboratory of Electroanalytical Chemistry, Changchun Institute of Applied, Chemistry and Graduate University of the Chinese Academy of Sciences,hinese, Academy of Sciences, Renmin St. 5625, Changchun 130022, PR ChinaDepartment of Public Security of Jilin Province, Changchun 130051, PR China
r t i c l e i n f o
rticle history:eceived 1 August 2009eceived in revised form 2 October 2009ccepted 23 October 2009vailable online 4 November 2009
a b s t r a c t
A sensitive electrochemical detection scheme for morphine has been proposed by utilizing the orderedmesoporous carbon modified glassy carbon electrode (OMC/GCE). The electrochemical behaviour ofmorphine at the OMC/GCE was investigated by cyclic voltammetry. The modified electrode displayeda decrease in the overpotential (ca. 82 mV) and an obvious increase in the peak current (80 times) com-
eywords:rdered mesoporous carbonlectrochemical determinationorphine
pared to the bare glassy carbon electrode (GCE). The results indicated that OMC/GCE remarkably enhancedelectrocatalytic activity towards the oxidation of morphine. Linear response was found over the rangefrom 0.1 �M to 20 �M with a high sensitivity of 1.74 �A/�M and low detection limit of 10 nM (S/N = 3).And the relative standard deviation was 0.86% (n = 5). Moreover, combining with a medium-exchangeprocedure, the OMC/GCE has also been successfully applied to the selective determination of morphinein urine samples with a low detection limit of 50 nM and satisfied recovery of 96.4%. The good results
E hol
rine sampleindicate that the OMC/GC
. Introduction
As a major component in opium, morphine is often used toelieve severe pain in patients, especially those undergoing a surgi-al procedure. It is recommended by the World Health OrganizationWHO) for the relief of moderate cancer-related pain (Stjernsward,988). However, it is toxic in excess and when abused. Differ-nt methods have been used for the determination of morphinen plasma, urine, and opium samples, such as high-performanceiquid chromatography (Berga et al., 2009; Mabuchi et al., 2004;
eng et al., 2000; Zhang et al., 2008), gas chromatography (Fryirst al., 1997; Hofmann et al., 1999), capillary electrophoresis (Mit al., 2004; Tsai et al., 2000; Zhang et al., 2007), surface plas-on resonance (Sakai et al., 1998), radioimmunoassay (Chapman
t al., 1994), sequential injection analysis (Idris and Alnajjar, 2008),nd chemiluminescence (Francisa et al., 2008). Among all these
ethods, chromatographic methods (Bosch et al., 2007) are mostommonly used to exploit various sensors for trace determina-ion of morphine. However, these methods are expensive, and notuitable for the in situ measurement. In contrast, the electroana-
∗ Corresponding author at: Department of Public Security of Jilin Province,hangchun 130051, PR China. Fax: +86 431 8526 2800.∗∗ Corresponding author. Tel.: +86 431 8526 2425; fax: +86 431 8526 2800.
E-mail addresses: [email protected] (X. Xu), [email protected] (L. Niu).1 These authors contributed equally.
956-5663/$ – see front matter © 2009 Elsevier B.V. All rights reserved.oi:10.1016/j.bios.2009.10.037
ds great promise in practical application.© 2009 Elsevier B.V. All rights reserved.
lytical techniques have many attractive features, such as favorableportability, easy operation procedures and high sensitivity. There-fore, they are popular in the determination of morphine (Niaziet al., 2007; Norouzi et al., 2007; Pournaghi-Azar and Saadatirad,2008; Salimi et al., 2005; Yeh and Ho, 2005; Zhao et al., 2009).Furthermore, the development of nanotechnology provides thegreat potential to increase the sensitivity of morphine detection.For example, addition of carbon nanotubes (Salimi et al., 2005),Prussian blue (Pournaghi-Azar and Saadatirad, 2008) and goldnanoparticles (Zhao et al., 2009) has greatly improved the mor-phine detection capability due to their unique advantages, such asenhancement of the mass transport and high effective surface area.
Ordered mesoporous carbon (OMC) has been receiving muchattention owing to the uniform and tailored pore structure, highspecific surface area, large pore volume and chemical inertness.Thus, it makes them suitable for applications in hydrogen storage,catalysts, adsorbents for relatively large molecules and capacitors(Hartmann et al., 2005; Joo et al., 2001; Jun et al., 2000; Zhou etal., 2003). Besides such potential capability of OMC, some worksin electrocatalysis by OMC have also been investigated (Hu et al.,2009; Jia et al., 2007; Zhou et al., 2007, 2008a,b; Zhu et al., 2009).However, up to now, the report on detection of morphine at the
OMC/GCE is quite few. Here we firstly proposed a sensitive detec-tion scheme for morphine at the OMC/GCE. It was found that thesensitivity for morphine detection was improved greatly whencompared with other methods. And the detection limit is downto 10 nM. Combining with the medium-exchange procedure, the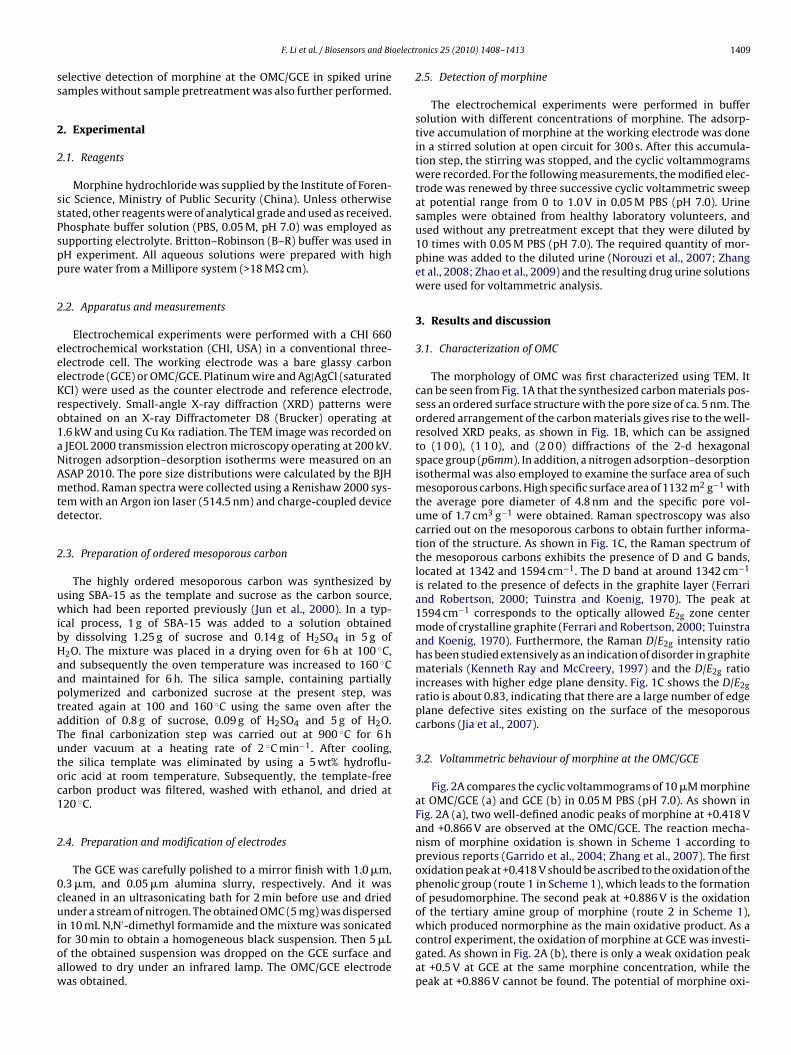
oelectr
ss
2
2
ssPspp
2
eeeKro1aNAmtd
2
uwibHaaptaTutoc1
2
0cuifoaw
F. Li et al. / Biosensors and Bi
elective detection of morphine at the OMC/GCE in spiked urineamples without sample pretreatment was also further performed.
. Experimental
.1. Reagents
Morphine hydrochloride was supplied by the Institute of Foren-ic Science, Ministry of Public Security (China). Unless otherwisetated, other reagents were of analytical grade and used as received.hosphate buffer solution (PBS, 0.05 M, pH 7.0) was employed asupporting electrolyte. Britton–Robinson (B–R) buffer was used inH experiment. All aqueous solutions were prepared with highure water from a Millipore system (>18 M� cm).
.2. Apparatus and measurements
Electrochemical experiments were performed with a CHI 660lectrochemical workstation (CHI, USA) in a conventional three-lectrode cell. The working electrode was a bare glassy carbonlectrode (GCE) or OMC/GCE. Platinum wire and Ag|AgCl (saturatedCl) were used as the counter electrode and reference electrode,espectively. Small-angle X-ray diffraction (XRD) patterns werebtained on an X-ray Diffractometer D8 (Brucker) operating at.6 kW and using Cu K� radiation. The TEM image was recorded onJEOL 2000 transmission electron microscopy operating at 200 kV.itrogen adsorption–desorption isotherms were measured on anSAP 2010. The pore size distributions were calculated by the BJHethod. Raman spectra were collected using a Renishaw 2000 sys-
em with an Argon ion laser (514.5 nm) and charge-coupled deviceetector.
.3. Preparation of ordered mesoporous carbon
The highly ordered mesoporous carbon was synthesized bysing SBA-15 as the template and sucrose as the carbon source,hich had been reported previously (Jun et al., 2000). In a typ-
cal process, 1 g of SBA-15 was added to a solution obtainedy dissolving 1.25 g of sucrose and 0.14 g of H2SO4 in 5 g of2O. The mixture was placed in a drying oven for 6 h at 100 ◦C,nd subsequently the oven temperature was increased to 160 ◦Cnd maintained for 6 h. The silica sample, containing partiallyolymerized and carbonized sucrose at the present step, wasreated again at 100 and 160 ◦C using the same oven after theddition of 0.8 g of sucrose, 0.09 g of H2SO4 and 5 g of H2O.he final carbonization step was carried out at 900 ◦C for 6 hnder vacuum at a heating rate of 2 ◦C min−1. After cooling,he silica template was eliminated by using a 5 wt% hydroflu-ric acid at room temperature. Subsequently, the template-freearbon product was filtered, washed with ethanol, and dried at20 ◦C.
.4. Preparation and modification of electrodes
The GCE was carefully polished to a mirror finish with 1.0 �m,.3 �m, and 0.05 �m alumina slurry, respectively. And it wasleaned in an ultrasonicating bath for 2 min before use and driednder a stream of nitrogen. The obtained OMC (5 mg) was dispersed
n 10 mL N,N′-dimethyl formamide and the mixture was sonicatedor 30 min to obtain a homogeneous black suspension. Then 5 �Lf the obtained suspension was dropped on the GCE surface andllowed to dry under an infrared lamp. The OMC/GCE electrodeas obtained.
onics 25 (2010) 1408–1413 1409
2.5. Detection of morphine
The electrochemical experiments were performed in buffersolution with different concentrations of morphine. The adsorp-tive accumulation of morphine at the working electrode was donein a stirred solution at open circuit for 300 s. After this accumula-tion step, the stirring was stopped, and the cyclic voltammogramswere recorded. For the following measurements, the modified elec-trode was renewed by three successive cyclic voltammetric sweepat potential range from 0 to 1.0 V in 0.05 M PBS (pH 7.0). Urinesamples were obtained from healthy laboratory volunteers, andused without any pretreatment except that they were diluted by10 times with 0.05 M PBS (pH 7.0). The required quantity of mor-phine was added to the diluted urine (Norouzi et al., 2007; Zhanget al., 2008; Zhao et al., 2009) and the resulting drug urine solutionswere used for voltammetric analysis.
3. Results and discussion
3.1. Characterization of OMC
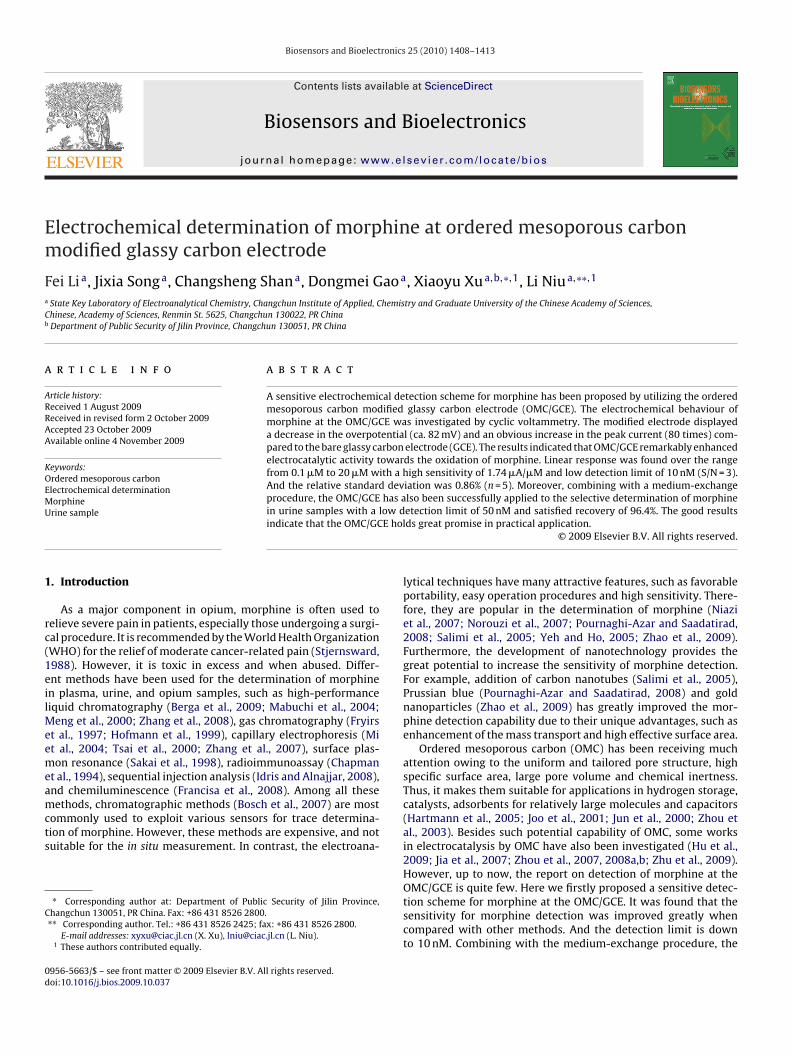
The morphology of OMC was first characterized using TEM. Itcan be seen from Fig. 1A that the synthesized carbon materials pos-sess an ordered surface structure with the pore size of ca. 5 nm. Theordered arrangement of the carbon materials gives rise to the well-resolved XRD peaks, as shown in Fig. 1B, which can be assignedto (1 0 0), (1 1 0), and (2 0 0) diffractions of the 2-d hexagonalspace group (p6mm). In addition, a nitrogen adsorption–desorptionisothermal was also employed to examine the surface area of suchmesoporous carbons. High specific surface area of 1132 m2 g−1 withthe average pore diameter of 4.8 nm and the specific pore vol-ume of 1.7 cm3 g−1 were obtained. Raman spectroscopy was alsocarried out on the mesoporous carbons to obtain further informa-tion of the structure. As shown in Fig. 1C, the Raman spectrum ofthe mesoporous carbons exhibits the presence of D and G bands,located at 1342 and 1594 cm−1. The D band at around 1342 cm−1
is related to the presence of defects in the graphite layer (Ferrariand Robertson, 2000; Tuinstra and Koenig, 1970). The peak at1594 cm−1 corresponds to the optically allowed E2g zone centermode of crystalline graphite (Ferrari and Robertson, 2000; Tuinstraand Koenig, 1970). Furthermore, the Raman D/E2g intensity ratiohas been studied extensively as an indication of disorder in graphitematerials (Kenneth Ray and McCreery, 1997) and the D/E2g ratioincreases with higher edge plane density. Fig. 1C shows the D/E2gratio is about 0.83, indicating that there are a large number of edgeplane defective sites existing on the surface of the mesoporouscarbons (Jia et al., 2007).
3.2. Voltammetric behaviour of morphine at the OMC/GCE
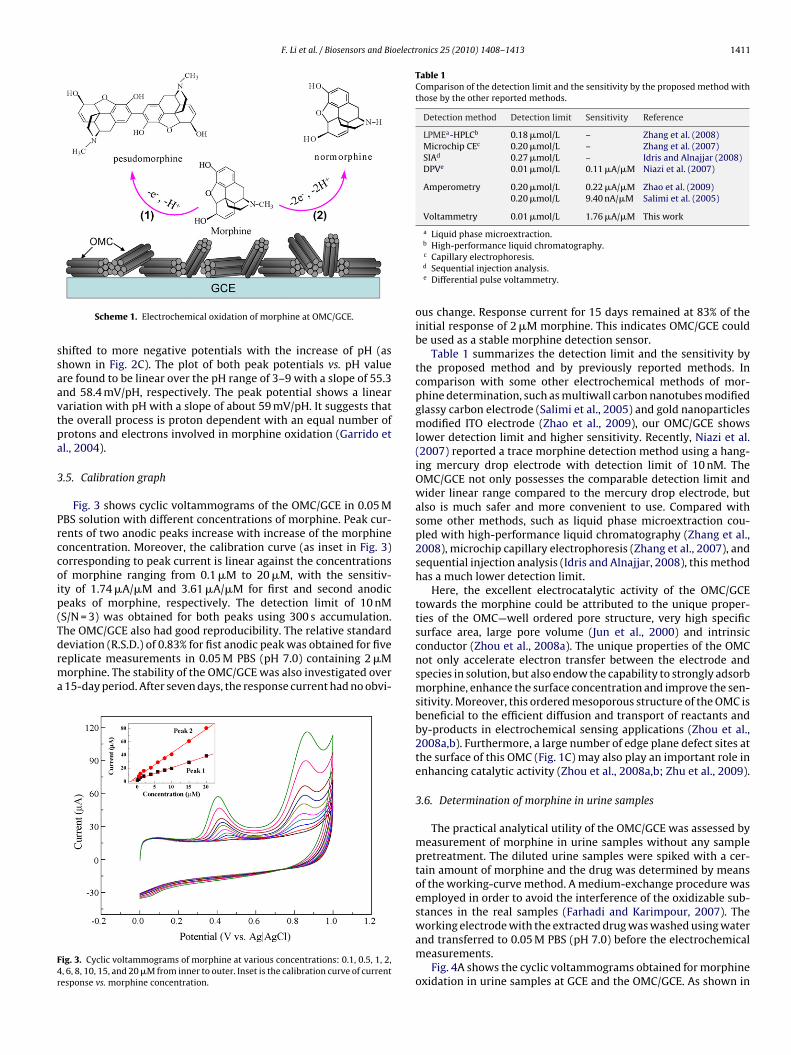
Fig. 2A compares the cyclic voltammograms of 10 �M morphineat OMC/GCE (a) and GCE (b) in 0.05 M PBS (pH 7.0). As shown inFig. 2A (a), two well-defined anodic peaks of morphine at +0.418 Vand +0.866 V are observed at the OMC/GCE. The reaction mecha-nism of morphine oxidation is shown in Scheme 1 according toprevious reports (Garrido et al., 2004; Zhang et al., 2007). The firstoxidation peak at +0.418 V should be ascribed to the oxidation of thephenolic group (route 1 in Scheme 1), which leads to the formationof pesudomorphine. The second peak at +0.886 V is the oxidationof the tertiary amine group of morphine (route 2 in Scheme 1),
which produced normorphine as the main oxidative product. As acontrol experiment, the oxidation of morphine at GCE was investi-gated. As shown in Fig. 2A (b), there is only a weak oxidation peakat +0.5 V at GCE at the same morphine concentration, while thepeak at +0.886 V cannot be found. The potential of morphine oxi-
1410 F. Li et al. / Biosensors and Bioelectronics 25 (2010) 1408–1413
Ft
dbOpeaeJ
tts0iiO
3
s
Fig. 2. (A) Cyclic voltammograms for 10 �M morphine in 0.05 M PBS (pH 7.0) atOMC/GCE (a) and GCE (b). Accumulation was performed in open circuit for 300 s.
ig. 1. TEM image (A), small-angle X-ray diffraction patterns (B) and Raman spec-rum (C) of the OMC.
ation at the OMC/GCE is slightly more negative than that at theare GCE with a shifting of 82 mV. Moreover, the peak current atMC/GCE is 80-fold higher than that of GCE. The lower oxidationotential and higher current response clearly indicate that OMC hasxcellent electrocatalytic activity towards morphine, which may bettributed to the large surface area of OMC and a large number ofdge plane defect sites at the surface of the OMC (Hu et al., 2009;ia et al., 2007; Zhou et al., 2008a,c).
Fig. 2B shows cyclic voltammograms of 2 �M morphine athe OMC/GCE at various scan rates. The peak currents of thosewo anodic peaks increase linearly with the square root ofcan rate (up to 300 mV/s) with a correlation coefficient of.995 (shown as inset in Fig. 2B; linear regression equations:
p1 = −2.59274 + 0.99415�1/2; ip2 = −2.64765 + 1.86987�1/2), whichndicates a diffusion controlled oxidation process occurring at theMC/GCE.
.3. The effect of accumulation time on the peak current
It was also found that the peak current of morphine was affectedtrikingly by accumulation time due to the strong adsorption prop-
Scan rate: 100 mV/s. Dashed lines represent the background response. (B) Cyclicvoltammograms of 2 �M morphine in 0.05 M PBS (pH 7.0) at OMC/GCE at variousscan rates: 50, 100, 150, 200, 250 and 300 mV/s from inner to outer, respectively.Inset is the calibrated plot of ip vs. �1/2. (C) Calibration plot of pH vs. potential from2 �M morphine in B–R buffer.
erties of OMC. So the influence of accumulation time of morphineat different concentrations (2 and 10 �M) to the peak current wasinvestigated. As shown in the supporting information (Fig. S1).When the accumulation time is less than 300 s, the peak currentincreases with the time, and then it reaches a platform. It indi-cated that the equilibrium between the concentration of morphinein solution and that on the surface of the electrode occurred at ca.300 s. So 300 s was selected as the optimum accumulation time inthis study.
3.4. The effect of pH on the oxidation of morphine at the OMC/GCE
The peak potential is closely dependent on the pH of the solu-tion. It was found that the values of peak potential for both peaks
F. Li et al. / Biosensors and Bioelectronics 25 (2010) 1408–1413 1411
ssaavtpa
3
Prccoip(Tdrma
F4r
Table 1Comparison of the detection limit and the sensitivity by the proposed method withthose by the other reported methods.
Detection method Detection limit Sensitivity Reference
LPMEa-HPLCb 0.18 �mol/L – Zhang et al. (2008)Microchip CEc 0.20 �mol/L – Zhang et al. (2007)SIAd 0.27 �mol/L – Idris and Alnajjar (2008)DPVe 0.01 �mol/L 0.11 �A/�M Niazi et al. (2007)
Amperometry 0.20 �mol/L 0.22 �A/�M Zhao et al. (2009)0.20 �mol/L 9.40 nA/�M Salimi et al. (2005)
Voltammetry 0.01 �mol/L 1.76 �A/�M This work
a Liquid phase microextraction.
Scheme 1. Electrochemical oxidation of morphine at OMC/GCE.
hifted to more negative potentials with the increase of pH (ashown in Fig. 2C). The plot of both peak potentials vs. pH valuere found to be linear over the pH range of 3–9 with a slope of 55.3nd 58.4 mV/pH, respectively. The peak potential shows a linearariation with pH with a slope of about 59 mV/pH. It suggests thathe overall process is proton dependent with an equal number ofrotons and electrons involved in morphine oxidation (Garrido etl., 2004).
.5. Calibration graph
Fig. 3 shows cyclic voltammograms of the OMC/GCE in 0.05 MBS solution with different concentrations of morphine. Peak cur-ents of two anodic peaks increase with increase of the morphineoncentration. Moreover, the calibration curve (as inset in Fig. 3)orresponding to peak current is linear against the concentrationsf morphine ranging from 0.1 �M to 20 �M, with the sensitiv-ty of 1.74 �A/�M and 3.61 �A/�M for first and second anodiceaks of morphine, respectively. The detection limit of 10 nMS/N = 3) was obtained for both peaks using 300 s accumulation.he OMC/GCE also had good reproducibility. The relative standard
eviation (R.S.D.) of 0.83% for fist anodic peak was obtained for fiveeplicate measurements in 0.05 M PBS (pH 7.0) containing 2 �Morphine. The stability of the OMC/GCE was also investigated over15-day period. After seven days, the response current had no obvi-ig. 3. Cyclic voltammograms of morphine at various concentrations: 0.1, 0.5, 1, 2,, 6, 8, 10, 15, and 20 �M from inner to outer. Inset is the calibration curve of currentesponse vs. morphine concentration.
b High-performance liquid chromatography.c Capillary electrophoresis.d Sequential injection analysis.e Differential pulse voltammetry.
ous change. Response current for 15 days remained at 83% of theinitial response of 2 �M morphine. This indicates OMC/GCE couldbe used as a stable morphine detection sensor.
Table 1 summarizes the detection limit and the sensitivity bythe proposed method and by previously reported methods. Incomparison with some other electrochemical methods of mor-phine determination, such as multiwall carbon nanotubes modifiedglassy carbon electrode (Salimi et al., 2005) and gold nanoparticlesmodified ITO electrode (Zhao et al., 2009), our OMC/GCE showslower detection limit and higher sensitivity. Recently, Niazi et al.(2007) reported a trace morphine detection method using a hang-ing mercury drop electrode with detection limit of 10 nM. TheOMC/GCE not only possesses the comparable detection limit andwider linear range compared to the mercury drop electrode, butalso is much safer and more convenient to use. Compared withsome other methods, such as liquid phase microextraction cou-pled with high-performance liquid chromatography (Zhang et al.,2008), microchip capillary electrophoresis (Zhang et al., 2007), andsequential injection analysis (Idris and Alnajjar, 2008), this methodhas a much lower detection limit.
Here, the excellent electrocatalytic activity of the OMC/GCEtowards the morphine could be attributed to the unique proper-ties of the OMC—well ordered pore structure, very high specificsurface area, large pore volume (Jun et al., 2000) and intrinsicconductor (Zhou et al., 2008a). The unique properties of the OMCnot only accelerate electron transfer between the electrode andspecies in solution, but also endow the capability to strongly adsorbmorphine, enhance the surface concentration and improve the sen-sitivity. Moreover, this ordered mesoporous structure of the OMC isbeneficial to the efficient diffusion and transport of reactants andby-products in electrochemical sensing applications (Zhou et al.,2008a,b). Furthermore, a large number of edge plane defect sites atthe surface of this OMC (Fig. 1C) may also play an important role inenhancing catalytic activity (Zhou et al., 2008a,b; Zhu et al., 2009).
3.6. Determination of morphine in urine samples
The practical analytical utility of the OMC/GCE was assessed bymeasurement of morphine in urine samples without any samplepretreatment. The diluted urine samples were spiked with a cer-tain amount of morphine and the drug was determined by meansof the working-curve method. A medium-exchange procedure wasemployed in order to avoid the interference of the oxidizable sub-stances in the real samples (Farhadi and Karimpour, 2007). The
working electrode with the extracted drug was washed using waterand transferred to 0.05 M PBS (pH 7.0) before the electrochemicalmeasurements.Fig. 4A shows the cyclic voltammograms obtained for morphineoxidation in urine samples at GCE and the OMC/GCE. As shown in
1412 F. Li et al. / Biosensors and Bioelect
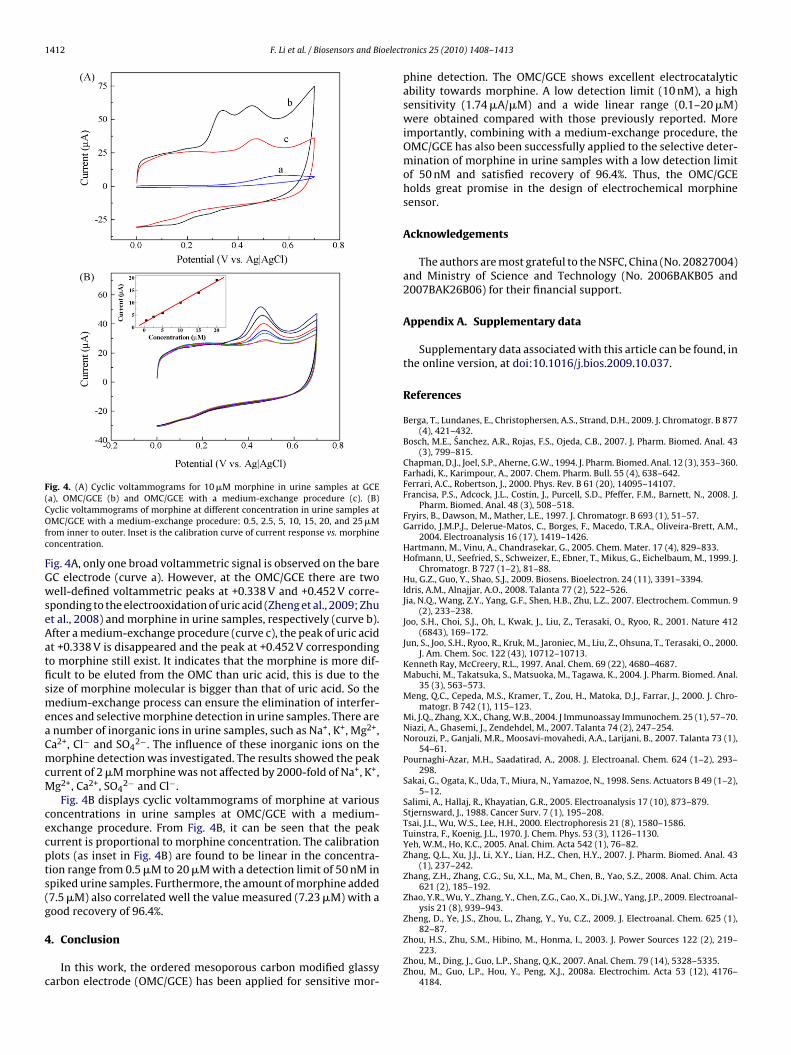
Fig. 4. (A) Cyclic voltammograms for 10 �M morphine in urine samples at GCE(COfc
FGwseAatfismeaCmcM
cecpts(g
4
c
a), OMC/GCE (b) and OMC/GCE with a medium-exchange procedure (c). (B)yclic voltammograms of morphine at different concentration in urine samples atMC/GCE with a medium-exchange procedure: 0.5, 2.5, 5, 10, 15, 20, and 25 �M
rom inner to outer. Inset is the calibration curve of current response vs. morphineoncentration.
ig. 4A, only one broad voltammetric signal is observed on the bareC electrode (curve a). However, at the OMC/GCE there are twoell-defined voltammetric peaks at +0.338 V and +0.452 V corre-
ponding to the electrooxidation of uric acid (Zheng et al., 2009; Zhut al., 2008) and morphine in urine samples, respectively (curve b).fter a medium-exchange procedure (curve c), the peak of uric acidt +0.338 V is disappeared and the peak at +0.452 V correspondingo morphine still exist. It indicates that the morphine is more dif-cult to be eluted from the OMC than uric acid, this is due to theize of morphine molecular is bigger than that of uric acid. So theedium-exchange process can ensure the elimination of interfer-
nces and selective morphine detection in urine samples. There arenumber of inorganic ions in urine samples, such as Na+, K+, Mg2+,a2+, Cl− and SO4
2−. The influence of these inorganic ions on theorphine detection was investigated. The results showed the peak
urrent of 2 �M morphine was not affected by 2000-fold of Na+, K+,g2+, Ca2+, SO4
2− and Cl−.Fig. 4B displays cyclic voltammograms of morphine at various
oncentrations in urine samples at OMC/GCE with a medium-xchange procedure. From Fig. 4B, it can be seen that the peakurrent is proportional to morphine concentration. The calibrationlots (as inset in Fig. 4B) are found to be linear in the concentra-ion range from 0.5 �M to 20 �M with a detection limit of 50 nM inpiked urine samples. Furthermore, the amount of morphine added7.5 �M) also correlated well the value measured (7.23 �M) with aood recovery of 96.4%.
. Conclusion
In this work, the ordered mesoporous carbon modified glassyarbon electrode (OMC/GCE) has been applied for sensitive mor-
ronics 25 (2010) 1408–1413
phine detection. The OMC/GCE shows excellent electrocatalyticability towards morphine. A low detection limit (10 nM), a highsensitivity (1.74 �A/�M) and a wide linear range (0.1–20 �M)were obtained compared with those previously reported. Moreimportantly, combining with a medium-exchange procedure, theOMC/GCE has also been successfully applied to the selective deter-mination of morphine in urine samples with a low detection limitof 50 nM and satisfied recovery of 96.4%. Thus, the OMC/GCEholds great promise in the design of electrochemical morphinesensor.
Acknowledgements
The authors are most grateful to the NSFC, China (No. 20827004)and Ministry of Science and Technology (No. 2006BAKB05 and2007BAK26B06) for their financial support.
Appendix A. Supplementary data
Supplementary data associated with this article can be found, inthe online version, at doi:10.1016/j.bios.2009.10.037.
References
Berga, T., Lundanes, E., Christophersen, A.S., Strand, D.H., 2009. J. Chromatogr. B 877(4), 421–432.
Bosch, M.E., Sanchez, A.R., Rojas, F.S., Ojeda, C.B., 2007. J. Pharm. Biomed. Anal. 43(3), 799–815.
Chapman, D.J., Joel, S.P., Aherne, G.W., 1994. J. Pharm. Biomed. Anal. 12 (3), 353–360.Farhadi, K., Karimpour, A., 2007. Chem. Pharm. Bull. 55 (4), 638–642.Ferrari, A.C., Robertson, J., 2000. Phys. Rev. B 61 (20), 14095–14107.Francisa, P.S., Adcock, J.L., Costin, J., Purcell, S.D., Pfeffer, F.M., Barnett, N., 2008. J.
Pharm. Biomed. Anal. 48 (3), 508–518.Fryirs, B., Dawson, M., Mather, L.E., 1997. J. Chromatogr. B 693 (1), 51–57.Garrido, J.M.P.J., Delerue-Matos, C., Borges, F., Macedo, T.R.A., Oliveira-Brett, A.M.,
2004. Electroanalysis 16 (17), 1419–1426.Hartmann, M., Vinu, A., Chandrasekar, G., 2005. Chem. Mater. 17 (4), 829–833.Hofmann, U., Seefried, S., Schweizer, E., Ebner, T., Mikus, G., Eichelbaum, M., 1999. J.
Chromatogr. B 727 (1–2), 81–88.Hu, G.Z., Guo, Y., Shao, S.J., 2009. Biosens. Bioelectron. 24 (11), 3391–3394.Idris, A.M., Alnajjar, A.O., 2008. Talanta 77 (2), 522–526.Jia, N.Q., Wang, Z.Y., Yang, G.F., Shen, H.B., Zhu, L.Z., 2007. Electrochem. Commun. 9
(2), 233–238.Joo, S.H., Choi, S.J., Oh, I., Kwak, J., Liu, Z., Terasaki, O., Ryoo, R., 2001. Nature 412
(6843), 169–172.Jun, S., Joo, S.H., Ryoo, R., Kruk, M., Jaroniec, M., Liu, Z., Ohsuna, T., Terasaki, O., 2000.
J. Am. Chem. Soc. 122 (43), 10712–10713.Kenneth Ray, McCreery, R.L., 1997. Anal. Chem. 69 (22), 4680–4687.Mabuchi, M., Takatsuka, S., Matsuoka, M., Tagawa, K., 2004. J. Pharm. Biomed. Anal.
35 (3), 563–573.Meng, Q.C., Cepeda, M.S., Kramer, T., Zou, H., Matoka, D.J., Farrar, J., 2000. J. Chro-
matogr. B 742 (1), 115–123.Mi, J.Q., Zhang, X.X., Chang, W.B., 2004. J Immunoassay Immunochem. 25 (1), 57–70.Niazi, A., Ghasemi, J., Zendehdel, M., 2007. Talanta 74 (2), 247–254.Norouzi, P., Ganjali, M.R., Moosavi-movahedi, A.A., Larijani, B., 2007. Talanta 73 (1),
54–61.Pournaghi-Azar, M.H., Saadatirad, A., 2008. J. Electroanal. Chem. 624 (1–2), 293–
298.Sakai, G., Ogata, K., Uda, T., Miura, N., Yamazoe, N., 1998. Sens. Actuators B 49 (1–2),
5–12.Salimi, A., Hallaj, R., Khayatian, G.R., 2005. Electroanalysis 17 (10), 873–879.Stjernsward, J., 1988. Cancer Surv. 7 (1), 195–208.Tsai, J.L., Wu, W.S., Lee, H.H., 2000. Electrophoresis 21 (8), 1580–1586.Tuinstra, F., Koenig, J.L., 1970. J. Chem. Phys. 53 (3), 1126–1130.Yeh, W.M., Ho, K.C., 2005. Anal. Chim. Acta 542 (1), 76–82.Zhang, Q.L., Xu, J.J., Li, X.Y., Lian, H.Z., Chen, H.Y., 2007. J. Pharm. Biomed. Anal. 43
(1), 237–242.Zhang, Z.H., Zhang, C.G., Su, X.L., Ma, M., Chen, B., Yao, S.Z., 2008. Anal. Chim. Acta
621 (2), 185–192.Zhao, Y.R., Wu, Y., Zhang, Y., Chen, Z.G., Cao, X., Di, J.W., Yang, J.P., 2009. Electroanal-
ysis 21 (8), 939–943.Zheng, D., Ye, J.S., Zhou, L., Zhang, Y., Yu, C.Z., 2009. J. Electroanal. Chem. 625 (1),
82–87.Zhou, H.S., Zhu, S.M., Hibino, M., Honma, I., 2003. J. Power Sources 122 (2), 219–
223.Zhou, M., Ding, J., Guo, L.P., Shang, Q.K., 2007. Anal. Chem. 79 (14), 5328–5335.Zhou, M., Guo, L.P., Hou, Y., Peng, X.J., 2008a. Electrochim. Acta 53 (12), 4176–
4184.

Z
Z
F. Li et al. / Biosensors and Bioelectr
hou, M., Shang, L., Li, B.L., Huang, L.J., Dong, S.J., 2008b. Electrochem. Commun. 10(6), 859–863.
hou, M., Shang, L., Li, B.L., Huang, L.J., Dong, S.J., 2008c. Biosens. Bioelectron. 24 (3),442–447.
onics 25 (2010) 1408–1413 1413
Zhu, L.D., Yang, R.L., Jiang, X.Y., Yang, D.X., 2009. Electrochem. Commun. 11 (3),530–533.
Zhu, L.D., Tian, C.Y., Yang, D.X., Jiang, X.Y., Yang, R.L., 2008. Electroanalysis 20 (23),2518–2525.

![REVIEW Development in Voltammetric Analysis with Chemically … cyclodextrin/Nafion modified glassy carbon electrode was investigated [67]. The tetrachlorophthalate(III) was bound](https://img.pdfslide.us/doc/110x75/606b582dd7f4be62e9012efa/review-development-in-voltammetric-analysis-with-chemically-cyclodextrinnafion.jpg)