Embed Size (px)
Citation preview

Place your chosen
image here. The four
corners must just
cover the arrow tips.
For covers, the three
pictures should be the
same size and in a
straight line.
Electricity demand forecasting and the problem of embedded generation
John Young
6th March 2013

2
Operating the system
Electricity National Control Centre

3
52.8
52.7
52.6
52.5
52.4
52.3
52.2
52.1
52.0
51.9
51.8
51.7
51.6
51.5
51.4
51.3
51.2
51.1
51.0
50.9
50.8
50.7
50.6
50.5
50.4
50.3
50.2
50.1
50.0
49.9
49.8
49.7
49.6
49.5
49.4
49.3
49.2
49.1
49.0
48.9
48.8
48.7
48.6
48.5
48.4
48.3
48.2
48.1
48.0
47.9
47.8
47.7
47.6
47.5
47.4
47.3
47.2
47.1
47.0
50.0 Normal operating frequency
50.5 Upper statutory limit
52.0 Generators tripping
49.5 Lower statutory limit
48.8 Demand disconnection starts
47.0 Demand disconnection
complete
Hz
Generation Demand
Operating the system
50.0
49.5
50.5
Frequency

4
Demand profile shapes
Shape of demand curves – in terms of turning points
and points of inflections - remains fairly constant from
day to day
Exact position of turning points, both in vertical
(Demand) and horizontal (Time) directions varies, at
least partially because of weather and non-weather
variables
Shape evolves slowly over time, with some abrupt
discontinuities

5
GB National Demand
A Typical Daily Profile: January
Winter Peak ~ 56,000 MW
Winter Minimum ~ 32,000 MW

6
GB National Demand
A Typical Daily Profile: January
Winter Peak ~ 56,000 MW
Winter Minimum ~ 32,000 MW

7
GB National Demand
A Typical Daily Profile: February
Winter Peak ~ 56,000 MW
8
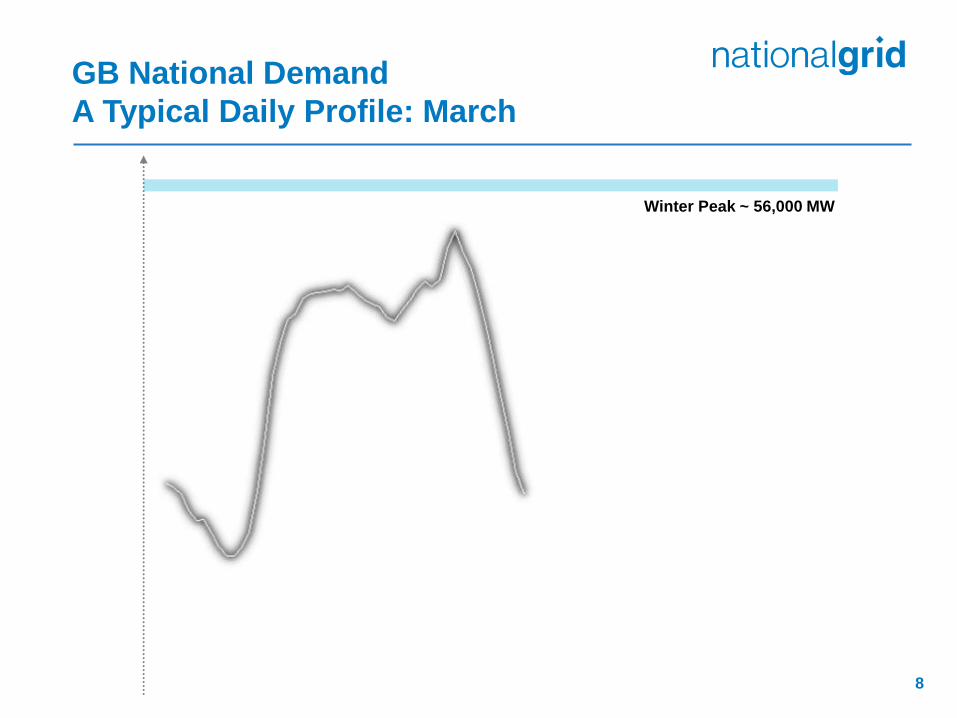
GB National Demand
A Typical Daily Profile: March
Winter Peak ~ 56,000 MW

9
GB National Demand
A Typical Daily Profile: April
Winter Peak ~ 56,000 MW

10
GB National Demand
A Typical Daily Profile: May
Winter Peak ~ 56,000 MW

11
GB National Demand
A Typical Daily Profile: June
Winter Peak ~ 56,000 MW

12
GB National Demand
A Typical Daily Profile: June
Winter Peak ~ 56,000 MW
Summer Minimum ~ 20,000 MW
Summer Maximum ~ 40,000 MW

13
Forecasting electricity demand
Typical demand profile shape
2 distinct shapes: GMT and BST

14
What Else Affects Demand?
Time of Day
Bank Holidays
School Holidays
Day of Week

15
Day of week impact
Friday
Demand curve for weekday in
GMT
Monday
Demand curve for Saturday in
GMT
Demand curve for Sunday in
GMT
16
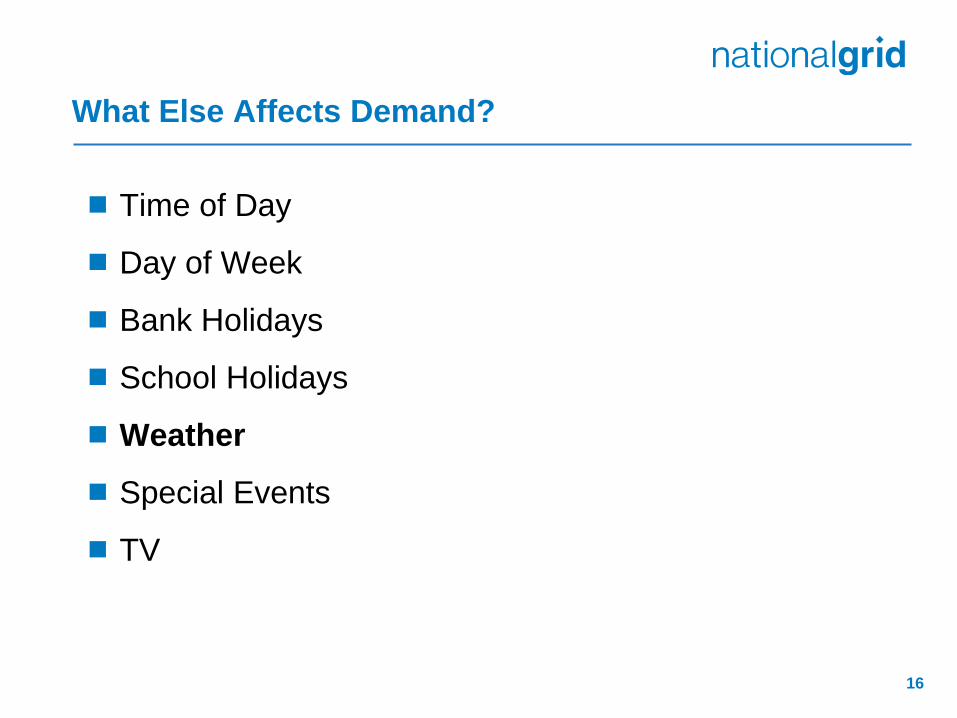
What Else Affects Demand?
Time of Day
Day of Week
Bank Holidays
School Holidays
Weather
Special Events
TV

17
Temperature
Dem
an
d E
ffect
(MW
)
COLD
High Demand
MILD
Low Demand
HOT
Quite High Demand
Temperature

18
Radiation
Dem
an
d E
ffe
ct
(MW
)
DULL
High Demand
BRIGHT
Low Demand
Illumination

19
Strong Wind: High Demand Low Wind: Low Demand
Wind Speed
De
ma
nd
(M
W)
The Impact of Weather
Cooling Power of the Wind

20
The Impact of Weather
Rain
21
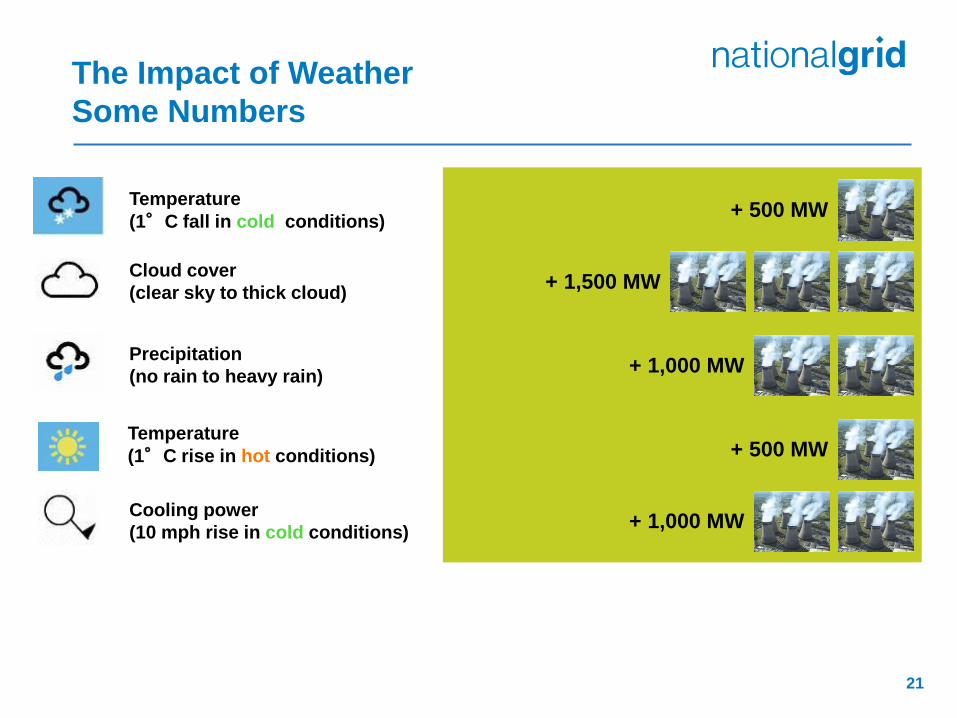
Temperature
(1°C fall in cold conditions)
Cloud cover
(clear sky to thick cloud)
Precipitation
(no rain to heavy rain)
Temperature
(1°C rise in hot conditions)
+ 500 MW
+ 500 MW
+ 1,000 MW
+ 1,500 MW
Cooling power
(10 mph rise in cold conditions) + 1,000 MW
The Impact of Weather
Some Numbers

22
Weather Variables
4-Hourly Average Temperature [TO]
Effective temperature [TE]
Wind Speed [WS]
Cooling Power of the Wind [CP] – a function of Wind
Speed and Temperature (TO)
Effective illumination of the Sky [EI] - A derived
quantity calculated from radiation levels and
measurements of cloud type and cover

23
Non-weather variables
Day of week
Year Effect – indicator variable for different years: mostly owing to different economic conditions
Time of year – seasonality
Time of Sunrise and Sunset
School Holidays - % of schools on holiday
Annual Holidays – indicator variable from common August holiday weeks
Bank Holidays – excluded from data set for purposes of modelling, then deal with on an ad hoc basis

24
GB National Demand
Cardinal Points
1B
2B
DP

25
Model Inputs:
Historic Demands
Historic Weather –
Heathrow, Glasgow,
Manchester, Bristol, Leeds,
Bimingham
Additional Effects – School
Holidays, Day of Week,
Time of Year
Basic Demand
Day of Week Component
Weather Component
Standard Linear Regression
Conventional Models

26
Modelling
Construct different models for each of the Cardinal Points (CPs)
Construct different models for GMT and BST
Construct models of two different types for each CP:
Standard linear regression models (Conventional Models)
Time series models with linear regression (Trend models)
Depending on the CP we construct 7 day models, 5 day models, Saturday models and Sunday models
On any day of the week there are at least two (and up to four) models that we forecast with

27
2B Demand (12:30)

28
2B Model On Day Of Week Effect Actual Demand Vs Fitted Values

29
Including A Seasonal Effect Actual Demand Vs Fitted Values

30
Including A Weather Effect Actual Demand Vs Fitted Values
31
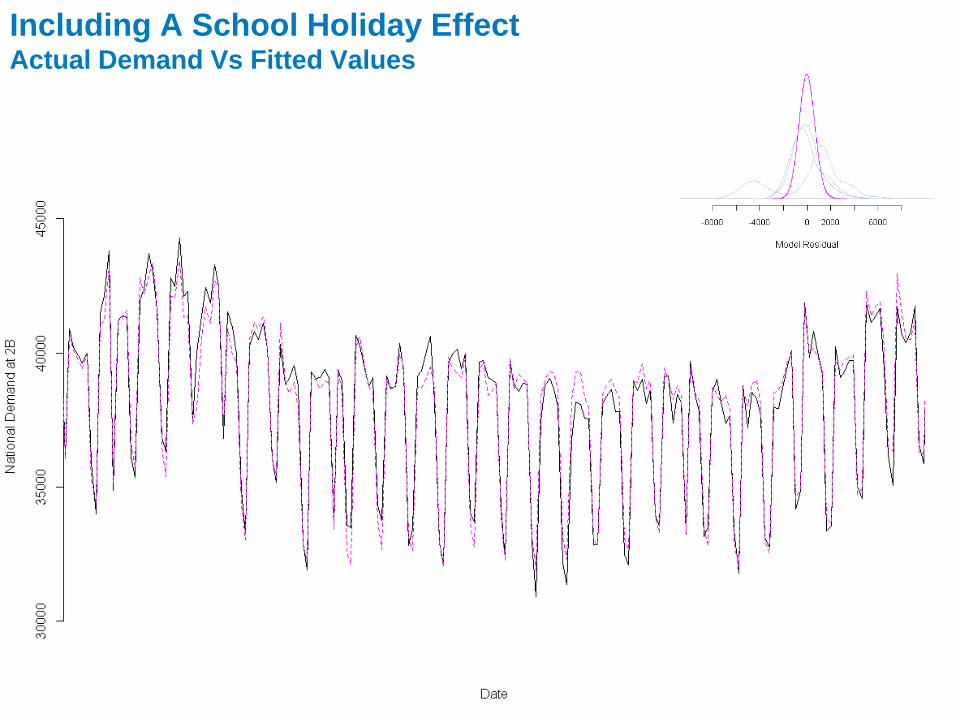
Including A School Holiday Effect Actual Demand Vs Fitted Values

32
2A 2B 3B 3C/DP 4B
Time Series with Linear Regression Trend Models
1F
Yesterday Today
1A 04 1B 1F 1A 04 1B

33
Including A School Holiday Effect Actual Demand Vs Fitted Values

34
Including A Trend Component Actual Demand Vs Fitted Values

35
The Model Symbolically
CPEISCHDWKLBL 04~2
Day of Week
Effect Weather Effect
Error term Trend term

36
Modelling CP Demand
Construct forecast models using
variables that make sense
Use best model possible with variables
that reduce the residual error
significantly
Basic Demand
Day of Week Component
Weather Component
Track ‘Basic Demand’, non-model
component of demand

37
Basic Demand
Manually track and forecast basic element of demand

38
Profile Matching
Check how well
CP forecasts
match historic
days
Daily Demand Profile
28
33
38
43
48
06-1
06-5
06-9
06-1
3
06-1
7
06-2
1
06-2
5
06-2
9
06-3
3
06-3
7
06-4
1
06-4
5
20110301 20110309 2011031620100309 Actual_20130306 Forecast_20130306Eview s

39
Choosing Basics
Forecast
basic demand
Aim is to
reduce risk of
error
2B model: Jan-Feb 2013

40
Embedded PV Generation
0
200
400
600
800
1,000
1,200
1,400
1,600
1,800
20100331
20100629
20100927
20101226
20110326
20110624
20110922
20111221
20120320
20120618
20120916
20121215

41
Embedded PV Generation
Daily Demand Profile
28.5
33.5
38.5
43.5
48.5
05-1
05-5
05-9
05-1
3
05-1
7
05-2
1
05-2
5
05-2
9
05-3
3
05-3
7
05-4
1
05-4
5
20120306 20110308 2010030220130304 Actual_20130305 Forecast_20130305Eview s
42
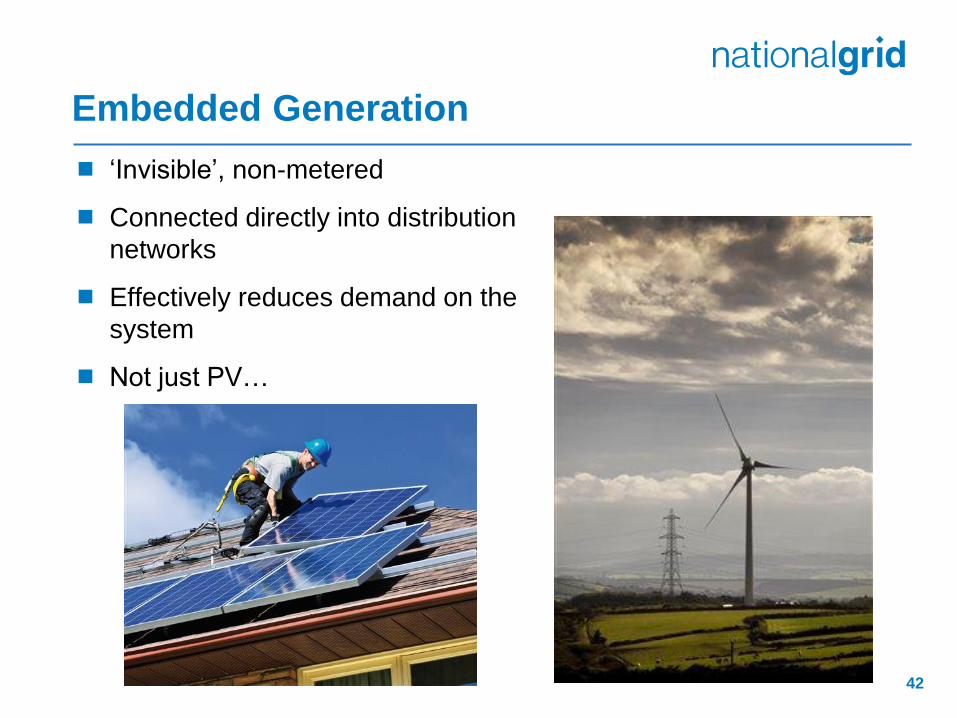
Embedded Generation
‘Invisible’, non-metered
Connected directly into distribution
networks
Effectively reduces demand on the
system
Not just PV…

43
National Demand
Embedded Generation True GB Demand is higher than
National Grid observe
Not a new phenomenon, but an
increase in more variable
technologies means it is a more
significant effect
Wind Power ~ 2,000 MW
Solar Power ~ 1,500 MW
The Impact of Embedded Generation

44
Virtual Demand National Demand
Embedded Generation
Virtual Demand: A True National Demand

45
Basic Demand
Week Day Component
Weather Component
Model Using Virtual Demand
Virtual Demand

46
Basic Demand
National Demand
Embedded Generation
Week Day Component
Weather Component
Forecast Virtual Demand;
Adjust for Embedded Generation

47
The Forecasting Process
National Demand
Embedded Generation
Basic Demand
Week Day Component
Weather Component
National Demand
Embedded Generation
Basic Demand
Week Day Component
Weather Component
Model using Virtual Demand Forecast Virtual Demand;
Adjust for Embedded Generation

48
Wind Power Forecasting System
- Metered Wind ~ 5,800 MW
- Embedded ~ 2,000 MW
National Demand Forecast Metered Wind Power Forecast
Embedded Wind Farms Metered Wind Farms
Forecasting Embedded Wind Generation
Existing Forecasting Methods

49
Standard Wind Power Curve Wind Farm
0 10 20 30 40 50
0.0
0.2
0.4
0.6
0.8
1.0
Forecast Wind Speed / mph
Lo
ad
Fa
cto
r Decile wind speed forecast applied to a load curve
Load curves for each wind generator, optimised using
actual metering

50
Wind Power forecast probabilistic view for next 5 days from Mon
3rd Dec 2012
Wind Power Forecast - Probabilistic View for Next 5 Days
0
1,000
2,000
3,000
4,000
5,000
03-D
EC
-2012
5:0
0
8:0
0
12:0
0
17:0
0
21:0
0
04-D
EC
-2012
5:0
0
8:0
0
12:0
0
17:0
0
21:0
0
05-D
EC
-2012
5:0
0
8:0
0
12:0
0
17:0
0
21:0
0
06-D
EC
-2012
5:0
0
8:0
0
12:0
0
17:0
0
21:0
0
07-D
EC
-2012
5:0
0
8:0
0
12:0
0
17:0
0
21:0
0
20% confidence 40% confidence 60% confidence 80% confidence Mean Forecast Excluding Cut-out Mean Forecast
Wind Cut-out Forecast
0
500
1,000
1,500
2,000
2,500
3,000
3,500
4,000
4,500
5,000 20% confidence 40% confidence 60% confidence 80% confidence Mean Cut-out
Wind cut out forecast

51
Metered wind generation forecast
Use same process
to forecast
embedded wind
Have information
on location and
capacity for all
embedded wind
generators above
2MW
52
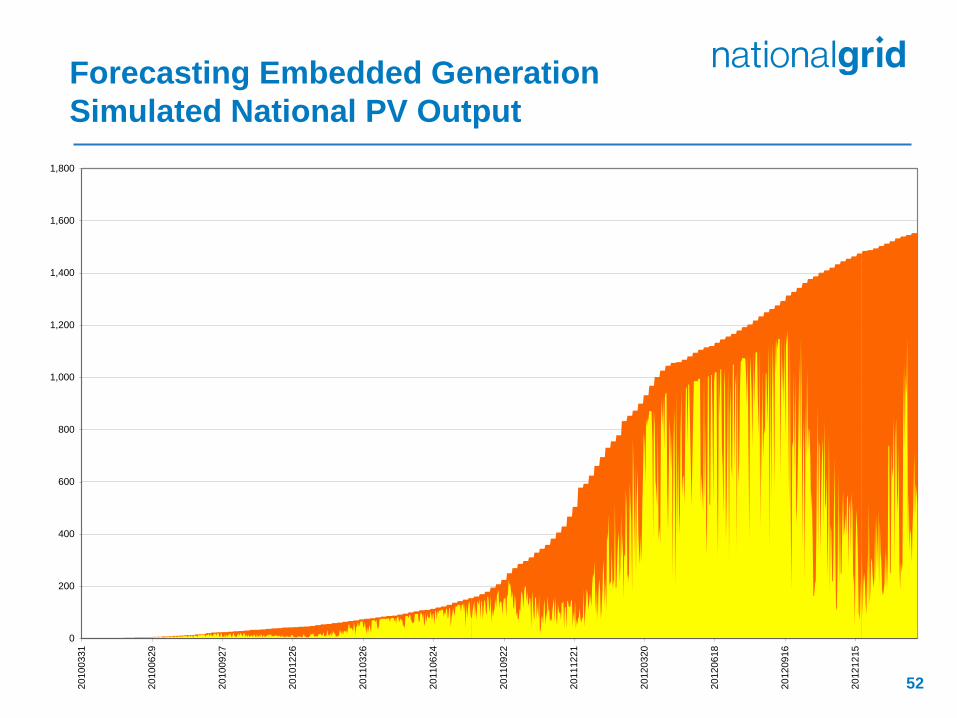
Forecasting Embedded Generation
Simulated National PV Output
0
200
400
600
800
1,000
1,200
1,400
1,600
1,800
20100331
20100629
20100927
20101226
20110326
20110624
20110922
20111221
20120320
20120618
20120916
20121215
53
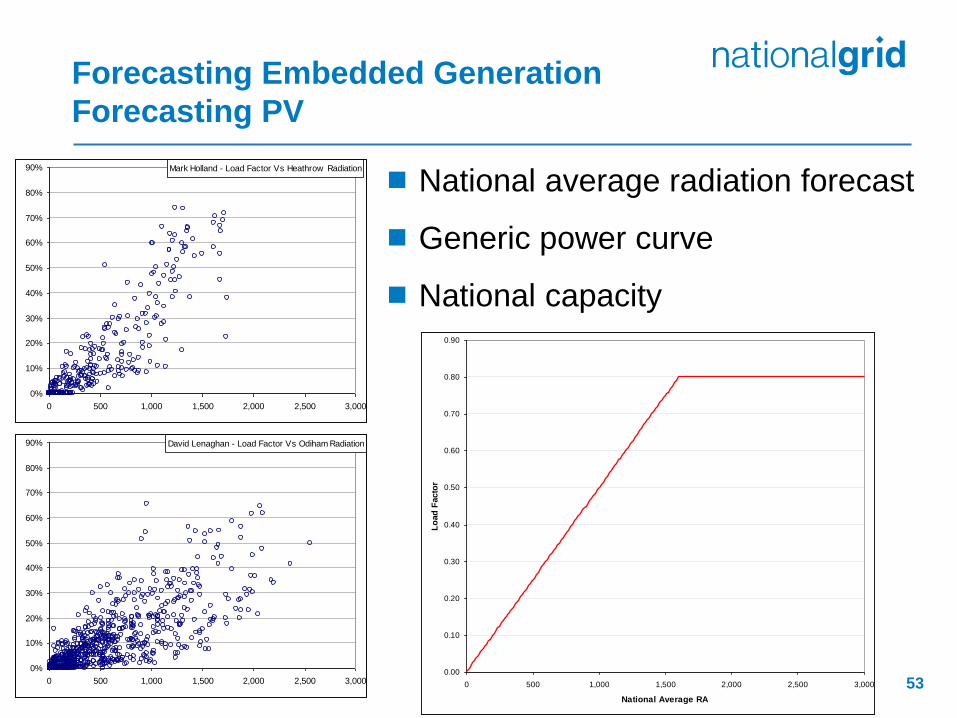
Forecasting Embedded Generation
Forecasting PV
David Lenaghan - Load Factor Vs Odiham Radiation
0%
10%
20%
30%
40%
50%
60%
70%
80%
90%
0 500 1,000 1,500 2,000 2,500 3,000
Mark Holland - Load Factor Vs Heathrow Radiation
0%
10%
20%
30%
40%
50%
60%
70%
80%
90%
0 500 1,000 1,500 2,000 2,500 3,000
0.00
0.10
0.20
0.30
0.40
0.50
0.60
0.70
0.80
0.90
0 500 1,000 1,500 2,000 2,500 3,000
National Average RA
Lo
ad
Facto
r
National average radiation forecast
Generic power curve
National capacity

54
The challenges of PV
Embedded Wind
Individual locations and
capacities
Wind speed forecasts
for various locations
Experience forecasting
metered wind
Embedded PV
Overall capacity for
whole country
National Average
radiation
No operational
experience yet

55
Forecasting Embedded Generation
Forecasting PV
0 10 20 30 40 50
53000
54000
55000
56000
57000
Index
X3B
_B
asic
0 10 20 30 40 50
55000
56000
57000
58000
59000
Index
X3C
_B
asic
53000 54000 55000 56000 57000 58000
0e+
00
2e-0
44e-0
46e-0
4
density.default(x = X3B_Basic + Output_1500, bw = 300)
N = 57 Bandwidth = 300
Density
54000 55000 56000 57000 58000 59000 60000
0e+
00
2e-0
44e-0
46e-0
4
density.default(x = X3C_Basic + Output_1700, bw = 300)
N = 57 Bandwidth = 300
Density

56
The Problem with Embedded Generation
~ 3,500 MW installed capacity
Variable output dependant on weather effects
Changing capacity levels
Reliant on estimates of output
No means of directly testing forecast models
Increases the volatility of National Demand

57
Including A Trend Component Actual Demand Vs Fitted Values
58
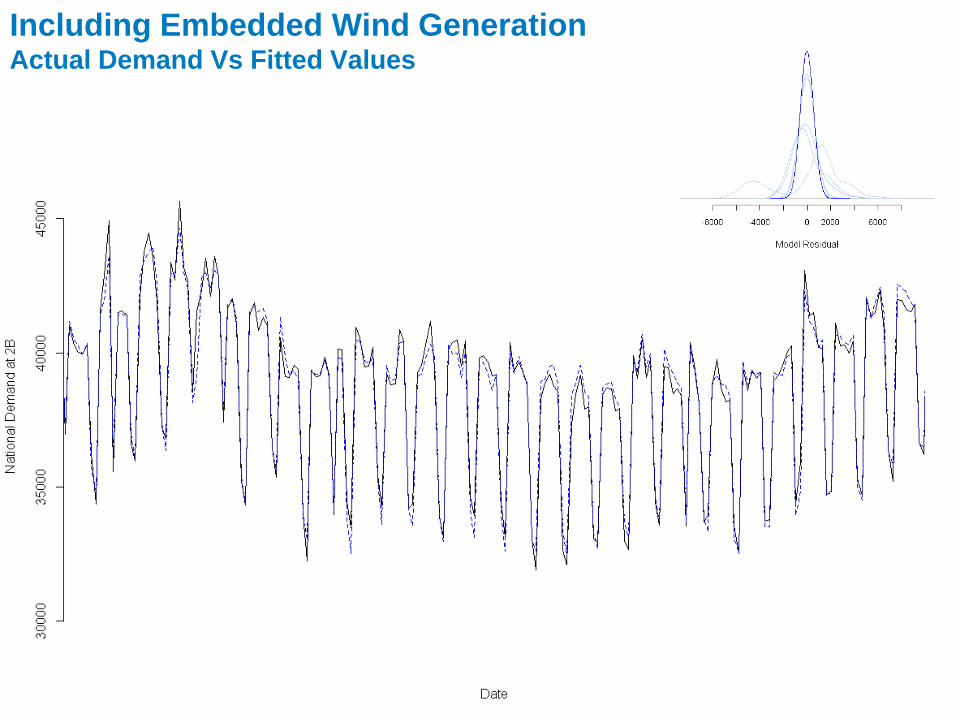
Including Embedded Wind Generation Actual Demand Vs Fitted Values

59
Including Embedded Solar Generation Actual Demand Vs Fitted Values

60

61
Thanks for listening

62
Demand and Wind Forecasting