Embed Size (px)
Citation preview

Eine Fachthemenreihe der DZ HYP | Oktober 2018A research publication by DZ HYP | Oktober 2018
dzhyp.de
REAL ESTATE MARKET GERMANY 2018 | 2019Strong demand drives up residential and office rents in metropolitan areas


1Real Estate Market Germany2018 | 2019
02 Preface
03 Summary
06 Current economic climate in Germany
07 Coworking – A fad or a model for success?
10 Will rental yields also pick up again when interest rates rise?
12 Retail properties
26 Office space
41 Housing market
46 Forecasts at a glance
47 Imprint
51 DZ HYP offices
TABLE OF CONTENTS

2 Real Estate Market Germany2018 | 2019
PREFACEDear readers,
As one of the leading commercial real estate banks in Germany, DZ HYP regularly analyses the markets it actively covers, in order to better assess opportunities and risks. This year, the eleventh edition of the German real estate market study focuses on real estate market developments concerning retail, office and residential buildings at Germany’s top locations – namely Hamburg, Berlin, Dusseldorf, Cologne, Frankfurt, Stuttgart and Munich.
As a whole, these real estate markets continue to benefit from the positive eco-nomic environment in Germany. The trend of high demand on office markets is continuing, supported by favourable labour market data – at the same time, there is an increasing shortage of floor space. Therefore we expect an increase, albeit on a moderate level, of the most expensive rents for all top locations during the current and the next year. The same applies to residential investment markets [at the top locations mentioned], where population growth is outstripping building comple-tion figures. Despite accelerating housing construction, no relief to this pressure is in sight. Hence, the boost in rent levels is likely to continue throughout the forecast period. City-centre retailers, in contrast, are increasingly feeling the pressure of online competition, leading to reluctant demand for floor space. We reckon top rents within this segment, which have been stagnating since 2015, will remain on the same level until year-end 2019.
The study presents a detailed discussion of the increasingly sought-after co-working model – a market that especially capitalises upon the shortage of office floor space. The range of flexible labour market solutions is vast, providing numerous possibili-ties for several sectors – not just the start-ups and freelancers.
The German real estate market study is of course also available in German. All current reports can be downloaded from our website; feel free to contact us if you prefer a hard copy.
Yours sincerely,
DZ HYP
October 2018

3Real Estate Market Germany2018 | 2019
3
SUMMARY
» Economic conditions for the commercial real estate markets in the seven top German locations of Berlin, Cologne, Dusseldorf, Frankfurt, Hamburg, Munich and Stuttgart could scarcely be any better. However, trends vary, as was the case last year. We discuss this in the current, eleventh edition of our annual market report which analyses the retail, office and residential segments.
» Conditions remain buoyant in the two sub-markets of office and residential. High demand, combined with a shortage of supply, are driving up rents here again. However, the picture is different for prime high street locations in the retail sector, which have long been the driver for the commercial real estate market. Increasing tough competition from the emergent online shopping segment has visibly dampened demand for sales space from retailers. Prime rents, which have risen to peak levels in the retail sector since 2013, are therefore stagnating.
» The fact that e-commerce has not yet hit the retail sector even harder is partly due to the economic trend, which has cooled slightly as a result of international problems, but which essentially remains healthy. The ninth year of the upturn is leading to record employment, lower levels of unemployment than for decades, and growth in wages and pensions. The seven major cities we have reviewed are also expanding, and are benefiting from demographic growth, higher levels of employment, and large numbers of tourists. Customer potential in the retail sector is increasing here, as are the number of office jobs needed and housing demand.
» Thanks to the favourable economic climate and continuing very low interest rates, investor demand for commercial real estate remains high. There is a good chance that investment volume will be as high in 2018 as in the three previous years. However, further growth is unlikely given the continuing shortage of core proper-ties. Investors are therefore increasingly compromising in terms of location and property quality. The decline in yields for new rentals has nevertheless slowed at the level reached, which in some cases is less than 3 per cent annually.
TOP LOCATIONS: HOME AND OFFICE RENTS CONTINUE TO RISE, BUT RETAIL STILL STAGNATING RENTS COMPARED TO PREVIOUS YEAR IN % (TOP LOCATIONS)
Source: BulwienGesa, DZ BANK Research forecast
-15-12
-9-6-30369
1215
199
3
199
4
199
5
199
6
199
7
199
8
199
9
200
0
200
1
200
2
200
3
200
4
200
5
200
6
200
7
200
8
200
9
201
0
201
1
201
2
201
3
201
4
201
5
201
6
201
7
201
8e
201
9e
reta il prim e rent off i ce pr im e rent residential average rent f i rst l etting average
This eleventh edition of our market report shows growth for office and residential properties, but subdued sentiment for retail

4 Real Estate Market Germany2018 | 2019
Retail – rents stagnate after prolonged boom
» There are increasing signs that sentiment for city centre retail is deteriorating. As of the end of August, the merger of Karstadt and Kaufhof, which has been under discussion for many years, is clearly close to completion. Despite buoyant economic conditions, the number of insolvencies in the retail sector is growing. And planned retail developments, such as the expansion of the HessenCenter in Frankfurt, are now being cancelled. Instead, considerable sums are being spent on the refurbishment of many shopping centres in order to continue to attract customers.
» Retail activity close to city centres remains very buoyant in the seven top locations thanks to the growing number of potential customers. Contributory factors here are rapid demographic growth in cities and their catchment areas, and high visitor volumes. High street shopping areas are correspondingly full. Customers come to walk around, and eat in the many restaurants, but are no longer buying as much. The proportion of e-commerce relative to total retail sales is not in fact overly high at 10 per cent. However, clothing, footwear and electronics are to a large extent purchased online, with a particular impact on city centre retail.
» Retailers are reacting to the shift to online shopping by focusing on certain locations and reducing the size of shop floors. However, demand for space from restaurants, city-centre supermarkets and fitness centres has stabilised. Levels of prime rents are therefore being maintained, having climbed by around 40 per cent to an average of nearly EUR 300 per sqm in the last ten years. We expect rents to remain stable in the forecasting period up to 2019. However, landlords will have to make concessions. These will include shorter contract periods with options to extend, and sales-related rental clauses.
FORECASTS FOR RETAIL PROPERTIES
Prime rents in EUR per sqm
Change in prime rents in % vs. prev. yr.
2017 2018e 2019e 2017 2018e 2019e
Berlin 310 310 310 0.0 0.0 0.0
Dusseldorf 280 280 280 1.8 0.0 0.0
Frankfurt 300 300 300 0.0 0.0 0.0
Hamburg 285 285 285 0.0 0.0 0.0
Cologne 255 255 255 2.0 0.0 0.0
Munich 345 345 345 0.0 0.0 0.0
Stuttgart 250 250 250 0.0 0.0 0.0
Top locations average 298.4 298.4 298.4 0.3 0.0 0.0
Source: BulwienGesa, Feri, DZ BANK Research forecast The prime rent represents the average of the top 3 to 5 per cent of market rentals, and the figure stated does not therefore correspond to the absolute prime rent.
Office – lower vacancy rate dramatically reduces supply of space
» Despite continuing strong employment growth in top locations, office space there has only expanded to a manageable extent in recent years. The supply of available office space has thus fallen dramatically. In Berlin, Munich and Stuttgart, the vacancy rate has shrunk to around 2 per cent, and to around 4 per cent in Hamburg and Cologne. It is therefore becoming increasingly difficult for potential tenants to rent large interconnecting space in their desired locations. Reserves of vacant property are more extensive only in Dusseldorf and Frankfurt, where more than 7 and more than 8 per cent of office space respectively remains unoccupied.
» In this climate, it is not surprising that prime rents are rising in all top locations. However, apart from Berlin, rent growth is fairly moderate. Clearly, even the space shortage is not prompting cost-conscious companies to enter into expensive
Retail: online shopping is also capping rent growth in emergent top locations
Office: high demand for space drives up prime rents in all top locations

5Real Estate Market Germany2018 | 2019
rental contracts. In order to contain fixed costs, they are also taking up the growing supply of coworking space, particularly if they only need space temporarily. The success of this on-trend flexible renting of fully equipped office space is also attributable to the shortage of space. We expect the moderate increase in prime office rents to essentially continue in the forecasting period up to 2019 as the number of vacant properties continues to fall.
FORECASTS FOR OFFICE PROPERTIES
Prime rents in EUR per sqm
Change in prime rents in % vs. prev. yr.
2017 2018e 2019e 2017 2018e 2019e
Berlin 30.0 32.7 34.0 7.1 9.0 4.0
Dusseldorf 24.5 25.0 25.5 0.0 2.0 2.0
Frankfurt 38.5 39.5 40.5 8.5 2.6 2.5
Hamburg 26.5 27.0 27.5 1.9 1.9 1.9
Cologne 21.0 21.5 21.9 0.0 2.4 2.0
Munich 36.0 37.0 38.0 3.7 2.8 2.7
Stuttgart 21.4 22.0 22.5 8.6 2.8 2.3
Top locations average 29.3 30.5 31.3 4.7 4.1 2.8
Source: BulwienGesa, Feri, DZ BANK Research forecast The prime rent represents the average of the top 3 to 5 per cent of market rentals, and the figure stated does not therefore correspond to the absolute prime rent.
Residential – housebuilding picks up, but insufficient to meet housing needs
» Reserves of vacant properties have long since been used up in housing markets in the top locations. As a result of strong demographic growth, new building lags behind housing demand despite an increase in the number of completions. This is making construction more difficult. On the one hand, the pressure is mounting in the seven cities whose populations have increased by 1 million people since 2007. While building land is becoming more scarce, protests by residents are increasing. On the other hand, capacity in the construction sector has been largely exhausted, which is also driving building costs up sharply. This is widening the gap between the number of homes approved and actually completed.
» There is no sign of conditions easing in the housing markets, and the upward momentum for residential rents is therefore likely to persist in the forecasting period up to 2019. However, we expect the pace of growth in the initial rents we have reviewed to weaken, because the larger number of completions is improving the supply of fairly expensive new apartments.
FORECASTS FOR RESIDENTIAL PROPERTIES
Average initial rents in EUR per sqm
Average initial rents in % vs. prev. yr.
2017 2018e 2019e 2017 2018e 2019e
Berlin 12.5 12.9 13.2 4.2 2.8 2.7
Dusseldorf 12.8 13.2 13.5 1.6 3.1 2.3
Frankfurt 15.1 15.5 16.0 2.0 2.6 3.2
Hamburg 13.9 14.3 14.7 3.7 2.9 2.8
Cologne 12.5 13.0 13.5 4.2 4.0 3.8
Munich 18.5 19.2 20.0 8.8 3.8 4.2
Stuttgart 14.5 15.4 16.0 11.5 6.2 3.9
Top locations average 14.0 14.4 14.9 5.1 3.4 3.2
Source: BulwienGesa, Feri, DZ BANK Research forecasts
Residential: housing markets in top locations remain strained and continue to drive up rents

6 Real Estate Market Germany2018 | 2019
CURRENT ECONOMIC CLIMATE IN GERMANY
German companies remain very calm in the face of the international risks. The ifo business climate index, which fell again slightly in July, picked up again surprisingly strongly in August. Despite all the current risks and uncertainties, German companies remain convinced of the stability of the domestic economy. One reason for this is the easing of the USA/Europe trade dispute following the meeting between Trump and Juncker. However, an escalation of the conflict between the USA and China could still take its toll. The continuing relatively wide gap between positive assessments of current conditions and more sceptical expectations has often served as a warning sign in the past and may be indicative of a forthcoming economic slowdown. Current survey results nevertheless show that sentiment in German boardrooms remains positive. This is also due to the fact that sectors which are very strongly geared to the domestic market remain extremely buoyant, first and foremost the construction industry, where companies are currently struggling to keep up with orders. True, macroeconomic growth will probably come in below 2% in 2018, however we still expect a positive result. Given the uncertain global conditions and the shortage of skilled workers, the German economy will be unable to exceed these levels for the time being.
Based on preliminary calculations, the inflation rate in Germany – measured by the EU Harmonised Index of Consumer Prices – reached 2.1 per cent in July, unchanged from the previous month. Food and energy prices have shown above- average growth of 6.6 per cent and 2.6 per cent respectively within a year. We still forecast that the average inflation rate will reach 1.9 per cent in 2018, and will remain virtually unchanged in 2019.
ECONOMIC FORECAST GERMANY
in % y-o-y 2016 2017 2018e 2019e
GDP 2.2 2.2 1.7 1.4
Private consumption 2.1 1.8 1.3 1.7
Public consumption 3.9 1.3 0.8 1.6
Investment 3.1 3.2 3.5 2.9
Exports 2.6 4.7 3.2 3.5
Imports 3.9 5.2 3.1 4.9
Unemployment rate (in %) 6.1 5.7 5.2 5.0
Inflation rate (HICP) 0.4 1.7 1.9 1.9
Budget balance (in % of GDP) 0.8 1.1 0.7 0.6
MACROECONOMIC GROWTH AND UNEMPLOYMENT TREND IN CONSUMER PRICES (HICP)
Source: DZ BANK Research HICP = Harmonised Index of Consumer Prices
0, 0 -0, 7
1, 2 0, 7
3, 7 3, 3
1, 1
-5, 6
4, 1 3, 6
0, 5 0, 52, 2 1, 7 2, 2 2, 2 1, 7 1, 4
-6
-4
-2
0
2
4
6
8
10
12
2002
2003
2004
2005
2006
2007
2008
2009
2010
2011
2012
2013
2014
2015
2016
2017
2018
2019
GDP yoy in % une mployment rate in %
forecast
1, 31, 1
1, 8 1, 9 1, 8
2, 3
2, 8
0, 2
1, 2
2, 5
2, 1
1, 6
0, 8
0, 1
0, 4
1, 71, 9 1, 9
0, 0
0, 5
1, 0
1, 5
2, 0
2, 5
3, 0
2002
2003
2004
2005
2006
2007
2008
2009
2010
2011
2012
2013
2014
2015
2016
2017
2018
2019
i nf l ation rate (HICP)
forecast
German economy still on a growth course despite headwind
Inflation rate nudges above 2%

7Real Estate Market Germany2018 | 2019
COWORKING – A FAD OR A MODEL FOR SUCCESS?
Coworking is currently a hot topic in the office market. A few years ago this was a virtually unknown concept, but today no report on the office market can ignore it. However, what exactly is coworking, which is often depicted as young people sitting on comfortable leather sofas with laptops? And is it a sustainable concept for the office market in a working world increasingly influenced by digitalisation, or is it merely a passing fad? It is certainly growing fast. Since coworking space was first made available in San Francisco in the middle of the last decade, the number of international coworking locations has literally exploded. Today there are around 20,000 locations worldwide providing working space for a total of 1.9 million users.
According to a survey by Savills (February 2018), around 550 “flexible workspaces” are available in the market in Germany. The largest proportion consists of 350 coworking spaces based on the narrower definition of the term. Coworking typically consists of rented office workspace equipped with furniture and printers which is ready for immediate use on a flexible - in other words short-term and temporary - basis. Instead of a traditionally partitioned office structure, working areas consist of shared space. The environment is trendy and provides a high quality environment with seating areas and leisure facilities. Offer is geared mainly to entrepreneurs, self-employed people, and freelancers. Communications and networking are a high priority. Operators are mainly local, semi-professional suppliers who also occasionally organise collaborative events for users.
NUMBER OF COWORKING LOCATIONS GROWS RAPIDLY WORLDWIDE COWORKING LOCATIONS BECOMING LARGER: AVERAGE NUMBER OF USERS IN LOCATIONS INCREASING
Source: Statistica / deskmag Source: Statistica / deskmag
However, the main interest in coworking is not focused so much on the pure form of the concept. Office markets are geared more to national or international suppliers such as Design Offices, Mindspace, rent24 or the WeWork hybrid concept. Around 70 locations in Germany are in the market in this segment, particularly in the Top 7 cities, and they are proliferating. They combine a relaxed coworking environment with sepa-rate workplaces, in other words offices for individuals and teams which were previously supplied mainly by professionally run business centres. Hybrid coworking providers are extending their user group in this way to include established companies seeking a large degree of privacy, which rules out shared working space. Similar to traditional business centres, the providers of the hybrid concept are mainly situated in attractive office locations.
0
10
20
30
40
50
60
70
80
90
100
0
2. 000
4. 000
6. 000
8. 000
10. 000
12. 000
14. 000
16. 000
18. 000
20. 000
2010 2011 2012 2013 2014 2015 2016 2017 2018coworking locations worldwide ( lhs) yoy in % ( rhs)
10
20
30
40
50
60
70
80
90
100
0
200 .000
400 .000
600 .000
800 .000
1. 000. 000
1. 200. 000
1. 400. 000
1. 600. 000
1. 800. 000
2010 2011 2012 2013 2014 2015 2016 2017 2018coworking user worldwide (lhs)coworking user per coworking location (rhs)
Strong growth in coworking widespread in office market
Working in a living room atmosphere
Coworking in an office market usually refers to hybrid space
8 Real Estate Market Germany2018 | 2019
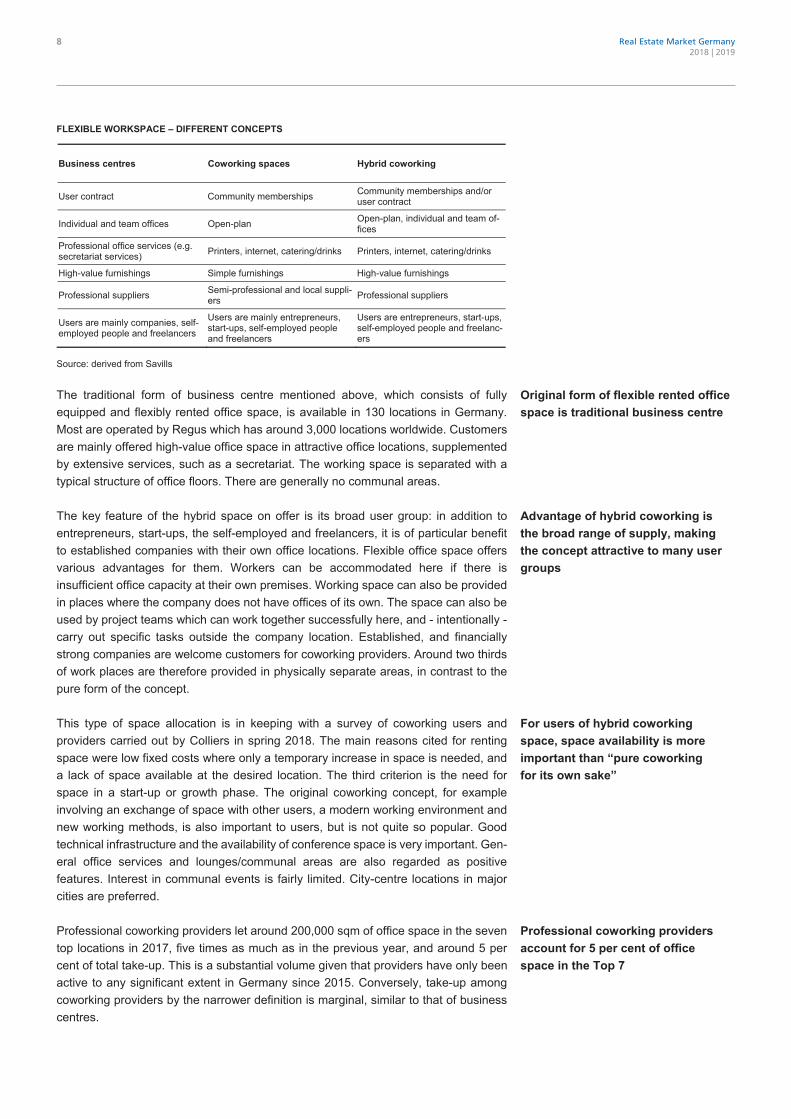
FLEXIBLE WORKSPACE – DIFFERENT CONCEPTS
Business centres Coworking spaces Hybrid coworking
User contract Community memberships Community memberships and/or user contract
Individual and team offices Open-plan Open-plan, individual and team of-fices
Professional office services (e.g. secretariat services) Printers, internet, catering/drinks Printers, internet, catering/drinks
High-value furnishings Simple furnishings High-value furnishings
Professional suppliers Semi-professional and local suppli-ers Professional suppliers
Users are mainly companies, self-employed people and freelancers
Users are mainly entrepreneurs, start-ups, self-employed people and freelancers
Users are entrepreneurs, start-ups, self-employed people and freelanc-ers
Source: derived from Savills
The traditional form of business centre mentioned above, which consists of fully equipped and flexibly rented office space, is available in 130 locations in Germany. Most are operated by Regus which has around 3,000 locations worldwide. Customers are mainly offered high-value office space in attractive office locations, supplemented by extensive services, such as a secretariat. The working space is separated with a typical structure of office floors. There are generally no communal areas.
The key feature of the hybrid space on offer is its broad user group: in addition to entrepreneurs, start-ups, the self-employed and freelancers, it is of particular benefit to established companies with their own office locations. Flexible office space offers various advantages for them. Workers can be accommodated here if there is insufficient office capacity at their own premises. Working space can also be provided in places where the company does not have offices of its own. The space can also be used by project teams which can work together successfully here, and - intentionally - carry out specific tasks outside the company location. Established, and financially strong companies are welcome customers for coworking providers. Around two thirds of work places are therefore provided in physically separate areas, in contrast to the pure form of the concept.
This type of space allocation is in keeping with a survey of coworking users and providers carried out by Colliers in spring 2018. The main reasons cited for renting space were low fixed costs where only a temporary increase in space is needed, and a lack of space available at the desired location. The third criterion is the need for space in a start-up or growth phase. The original coworking concept, for example involving an exchange of space with other users, a modern working environment and new working methods, is also important to users, but is not quite so popular. Good technical infrastructure and the availability of conference space is very important. Gen-eral office services and lounges/communal areas are also regarded as positive features. Interest in communal events is fairly limited. City-centre locations in major cities are preferred.
Professional coworking providers let around 200,000 sqm of office space in the seven top locations in 2017, five times as much as in the previous year, and around 5 per cent of total take-up. This is a substantial volume given that providers have only been active to any significant extent in Germany since 2015. Conversely, take-up among coworking providers by the narrower definition is marginal, similar to that of business centres.
Original form of flexible rented office space is traditional business centre
Advantage of hybrid coworking is the broad range of supply, making the concept attractive to many user groups
For users of hybrid coworking space, space availability is more important than “pure coworking for its own sake”
Professional coworking providers account for 5 per cent of office space in the Top 7

9Real Estate Market Germany2018 | 2019
HYBRID COWORKING OFFER BASED ON THE EXAMPLE OF WEWORK
Offer Costs Services provided Particularly suitable for
Hot desk (coworking)
From EUR 280/ month
Guaranteed working space in lounge area. User brings laptop and looks for a free place.
- Teleworkers and part-time workers - Customer meetings - more than one week per month
Own desk (coworking)
From EUR 340 / month
User has access to a specific desk in communal working area.
- Start-ups and small agencies - Team work and growth - daily use
Private office (business centre)
From EUR 470 / month
Separate, lockable offices which provide space for teams of various sizes. Ready for occupancy and equipped with desks, chairs and cupboards.
- Companies - Core teams, satellite teams - Independence within a community
For all the above users, some of the following are subject to a charge: conference rooms, printers, internet, postal/package service, refreshments, cleaning, access to other WeWork locations
Individually structured of-fice environ-ment
individual Depending on individual requirements, a floor/building is fitted out and made available to the user.
- large companies
Source: WeWork
Future demand for professional hybrid coworking space is difficult to gauge. So long as office demand remains high and space is in short supply, providers are likely to benefit. However, how will the situation look if the supply of office space generally improves or demand for office space falters as a result of an economic slowdown? Established companies could opt out of coworking locations previously used because of a shortage of space. However, it is also possible that, despite higher rents, they have learned to appreciate the flexibility of this type of space, and will use coworking arrangements permanently in addition to their own premises in order to reduce dependency on long-term rental contracts. However, an economic crisis would be likely to hit providers of coworking harder.
Providers of coworking are also facing competition as business centre operators such as Regus also jump on the bandwagon. The office property investor alstria has established Beehive - its own coworking concept. As the success of coworking concepts grows, office landlords could themselves become providers by adapting some office space and offering fully equipped working premises as well as vacant office space. This would enable them to service various demand segments themselves and potentially generate higher rental revenue.
The particular type of space in demand from hybrid providers differs from usual rental demand and poses a challenge for investors and owners of office properties. For it is virtually impossible for coworking providers to realise their space concepts in office floors which are generally fully completed. In fact, the optimal scenario for coworking concepts is to acquire space at the “shell” stage of construction. It is therefore of relevance to landlords whether the professional coworking business model proves sustainable. We expect professional coworking to have substance and not to remain merely a short-lived trend in the office market. However, the supplier structure could continue to evolve.
However, future demand is difficult to gauge
Competition for coworking providers likely to increase
Space concepts require special expansion of office floors
10 Real Estate Market Germany2018 | 2019
WILL RENTAL YIELDS ALSO PICK UP AGAIN WHEN INTEREST RATES RISE?
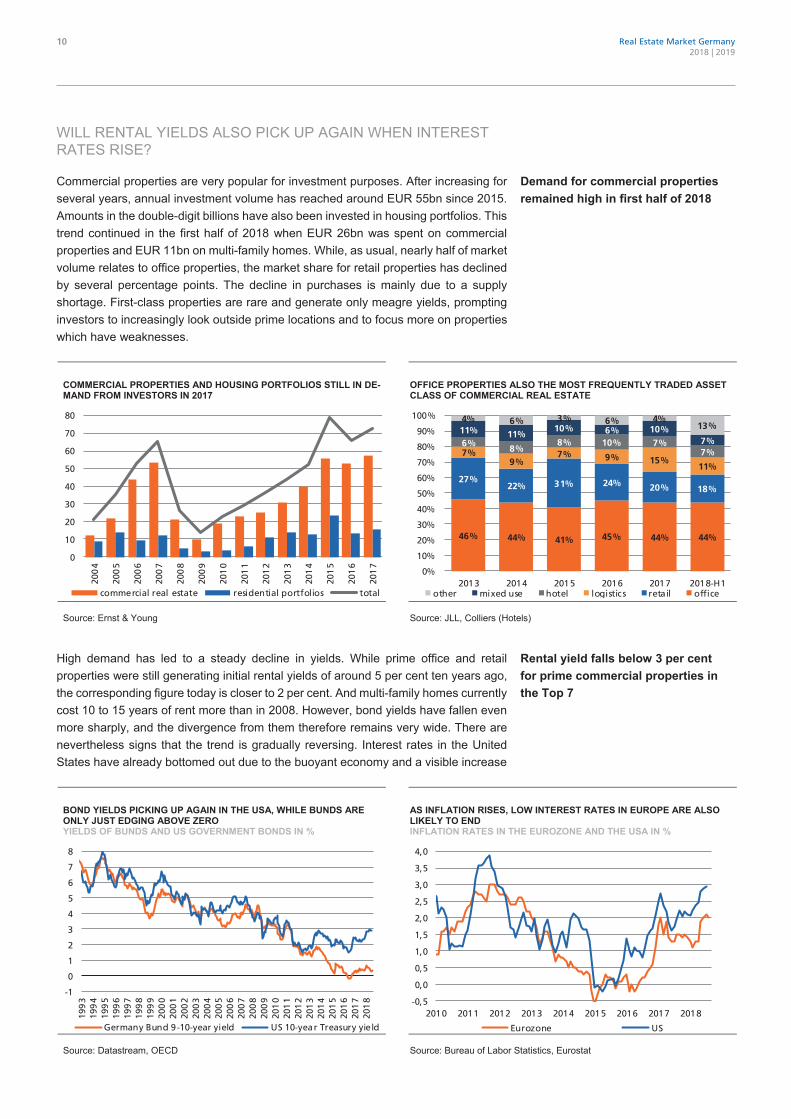
Commercial properties are very popular for investment purposes. After increasing for several years, annual investment volume has reached around EUR 55bn since 2015. Amounts in the double-digit billions have also been invested in housing portfolios. This trend continued in the first half of 2018 when EUR 26bn was spent on commercial properties and EUR 11bn on multi-family homes. While, as usual, nearly half of market volume relates to office properties, the market share for retail properties has declined by several percentage points. The decline in purchases is mainly due to a supply shortage. First-class properties are rare and generate only meagre yields, prompting investors to increasingly look outside prime locations and to focus more on properties which have weaknesses.
COMMERCIAL PROPERTIES AND HOUSING PORTFOLIOS STILL IN DE-MAND FROM INVESTORS IN 2017
OFFICE PROPERTIES ALSO THE MOST FREQUENTLY TRADED ASSET CLASS OF COMMERCIAL REAL ESTATE
Source: Ernst & Young Source: JLL, Colliers (Hotels)
High demand has led to a steady decline in yields. While prime office and retail properties were still generating initial rental yields of around 5 per cent ten years ago, the corresponding figure today is closer to 2 per cent. And multi-family homes currently cost 10 to 15 years of rent more than in 2008. However, bond yields have fallen even more sharply, and the divergence from them therefore remains very wide. There are nevertheless signs that the trend is gradually reversing. Interest rates in the United States have already bottomed out due to the buoyant economy and a visible increase
BOND YIELDS PICKING UP AGAIN IN THE USA, WHILE BUNDS ARE ONLY JUST EDGING ABOVE ZERO YIELDS OF BUNDS AND US GOVERNMENT BONDS IN %
AS INFLATION RISES, LOW INTEREST RATES IN EUROPE ARE ALSO LIKELY TO END INFLATION RATES IN THE EUROZONE AND THE USA IN %
Source: Datastream, OECD Source: Bureau of Labor Statistics, Eurostat
0
10
20
30
40
50
60
70
80
200
4
200
5
200
6
200
7
200
8
200
9
201
0
201
1
201
2
201
3
201
4
201
5
201
6
201
7
comme rcial real estate residential portfol ios total
46% 44% 41% 45% 44% 44%
27%22% 31% 24% 20% 18%
7%9%
7% 9% 15%11%
6%8%
8% 10% 7%7%
11% 11%10% 6% 10%
7%
4% 6% 3% 6% 4%13%
0%
10%
20%
30%
40%
50%
60%
70%
80%
90%
100%
2013 2014 2015 2016 2017 2018-H1other mixed use hotel l ogi stic s reta il off i ce
-1
0
1
2
3
4
5
6
7
8
199
319
94
199
519
96
199
719
98
199
920
00
200
120
02
200
320
04
200
520
06
200
720
08
200
920
10
201
120
12
201
320
14
201
520
16
201
720
18
Germany Bund 9 -10-year yield US 10-yea r Treasury yie ld
-0, 5
0, 0
0, 5
1, 0
1, 5
2, 0
2, 5
3, 0
3, 5
4, 0
2010 2011 2012 2013 2014 2015 2016 2017 2018
Eurozone US
Demand for commercial properties remained high in first half of 2018
Rental yield falls below 3 per cent for prime commercial properties in the Top 7

11Real Estate Market Germany2018 | 2019
in inflation. The Eurozone still lags behind, but economic output is growing here too, unemployment is falling, and consumer prices are rising. Yields also therefore look set to rise in the Eurozone. Although the ECB will maintain its expansionary monetary policy for some time yet, the likely phasing out of its bond purchase programme in the autumn will signal a gradual shift. The favourable economic climate in Germany and the shortage of properties in most places still speak for buoyant rental business. Rental yields are nonetheless expected to increase as interest rates pick up. However, it is virtually impossible to gauge how strong this trend will be.
RETAIL: TREND IN INITIAL RENTAL YIELD NET INITIAL YIELD IN CENTRAL RETAIL LOCATIONS IN %
RENTAL YIELD IN INDIVIDUAL TOP LOCATIONS NET INITIAL YIELD IN CENTRAL RETAIL LOCATIONS IN %
OFFICE: TREND IN INITIAL RENTAL YIELD NET INITIAL RENTALS IN CENTRAL OFFICE LOCATIONS IN %
YIELD TREND IN INDIVIDUAL TOP LOCATIONS NET INITIAL YIELD IN CENTRAL OFFICE LOCATIONS IN %
RESIDENTIAL: RENT MULTIPLE FOR MULTI-FAMILY HOMES AVERAGE RENT MULTIPLE
RENT MULTIPLE IN INDIVIDUAL TOP LOCATIONS AVERAGE RENT MULTIPLE
Source: BulwienGesa Source: BulwienGesa Explanation: net initial yields for office/retail properties are calculated from the net annual rent and total purchase price including additional costs. For the multi-family home multiple, the purchase price is divided by the “cold” rent in the first year and thus corresponds to the reciprocal value of the gross initial yield. Top 7: Index of top locations Berlin, Dusseldorf, Frankfurt, Hamburg, Cologne, Munich and Stuttgart Regional 12: Index of regional centres Augsburg, Bremen, Darmstadt, Dresden, Essen, Hannover, Karlsruhe, Leipzig, Mainz, Mannheim, Munster und Nuremberg
2,5
3,0
3,5
4,0
4,5
5,0
5,5
6,0
6,5
7,0
199
719
98
199
920
00
200
120
02
200
320
04
200
520
06
200
720
08
200
920
10
201
120
12
201
320
14
201
520
16
201
7
Top-7 Regional-12
2, 5
3, 0
3, 5
4, 0
4, 5
5, 0
5, 5
200
8
200
9
201
0
201
1
201
2
201
3
201
4
201
5
201
6
201
7
201
8
Ber li n
Dusseldorf
Frankfurt
Hamburg
Cologne
Munich
Stuttgart
2,5
3,0
3,5
4,0
4,5
5,0
5,5
6,0
6,5
7,0
199
719
98
199
920
00
200
120
02
200
320
04
200
520
06
200
720
08
200
920
10
201
120
12
201
320
14
201
520
16
201
7
Top-7 Regional-12
2, 5
3, 0
3, 5
4, 0
4, 5
5, 0
5, 5
6, 0
200
8
200
9
201
0
201
1
201
2
201
3
201
4
201
5
201
6
201
7
201
8
Ber li n
Dusseldorf
Frankfurt
Hamburg
Cologne
Munich
Stuttgart
10
12
14
16
18
20
22
24
26
28
199
719
98
199
920
00
200
120
02
200
320
04
200
520
06
200
720
08
200
920
10
201
120
12
201
320
14
201
520
16
201
7
Top-7 Regional-12
12
14
16
18
20
22
24
26
28
30
32
34
200
8
200
9
201
0
201
1
201
2
201
3
201
4
201
5
201
6
201
7
201
8
Ber li n
Dusseldorf
Frankfurt
Hamburg
Cologne
Munich
Stuttgart
As expansionary monetary policy is phased out, rental yields could show movement

12 Real Estate Market Germany2018 | 2019
RETAIL PROPERTIES
Germany is doing well. There are good reasons why the Federal Republic is one of the most popular countries of destination for immigrants. In recent years prosperity has increased further thanks to the economic upturn under way since 2010, which provides an attractive climate for retail activity. The main contributory factors here are record levels of employment, leading to a visible increase in wages and pensions. Not even international crises such as the forthcoming Brexit or the trade conflict initiated by US President Trump have seriously dampened positive consumer sentiment so far.
LABOUR MARKET SHOWS NO WEAKNESS: UNEMPLOYMENT FALL-ING, JOB VACANCIES INCREASE TO RECORD LEVEL
NEITHER BREXIT NOR TRADE WAR CAN DAMPEN GERMAN CONSUMER SENTIMENT
Source: Bundesbank Source: GfK
In the ninth successive year of the upturn, the labour market is contributing to full em-ployment in an increasing number of regions. The unemployment rate calculated by the Federal Employment Agency fell to 5.2 per cent in August 2018. The harmonised figure reported by Eurostat is significantly lower again at just over 3 per cent, currently the lowest level in the Eurozone. In an increasing number of sectors it is impossible for companies to find enough suitable candidates to fill job vacancies and take up training places.
INFLATION DILUTES REAL WAGE GROWTH SLIGHTLY YEAR-ON-YEAR IN PER CENT (6-MONTH AVERAGE)
TOURISM FLOURISHING: SHOPPING TRIPS INCREASINGLY IM-PORTANT FOR RETAIL SECTOR
Source: Federal Statistical Office, Thomson Reuters Source: Federal Statistical Office
On closer inspection, only real wage growth has weakened slightly compared to the three previous years. Between 2014 and 2016, consumer prices increased only marginally, thus reducing nominal wages only slightly. However, inflation has now
0
100
200
300
400
500
600
700
800
900
4
5
6
7
8
9
10
11
12
13
199
2
199
4
199
6
199
8
200
0
200
2
200
4
200
6
200
8
201
0
201
2
201
4
201
6
201
8
une mployment rate i n % (l hs) vacanci es i n thousands (rhs)
-4-202468
1012141618
200
1
200
2
200
3
200
4
200
5
200
6
200
7
200
8
200
9
201
0
201
1
201
2
201
3
201
4
201
5
201
6
201
7
201
8
GfK consume r cl ima te
-2
-1
0
1
2
3
4
199
8
199
9
200
0
200
1
200
2
200
3
200
4
200
5
200
6
200
7
200
8
200
9
201
0
201
1
201
2
201
3
201
4
201
5
201
6
201
7
201
8
consumer pri ces nom inal wages real wages
250275300325350375400425450475500
8090
100110120130140150160170180190
199
319
94
199
519
96
199
719
98
199
920
00
200
120
02
200
320
04
200
520
06
200
720
08
200
920
10
201
120
12
201
320
14
201
520
16
201
720
18
v isitor arr ival s in mi ll ion , annual i sed (lhs)ove rn ight sta ys i n m il li on, annual ised (rhs)
Things are good for the Germans, retail conditions could scarcely be any better
Labour market drives growing prosperity
Higher inflation brakes real wage growth

13Real Estate Market Germany2018 | 2019
reached the European Central Bank’s target of 2 per cent again, clearly offsetting the additional financial scope provided by solid wage growth. It is all the more positive that, after many years of growth, tourism in Germany also shows no sign of weakening. City breaks remain popular, and growth in visitor numbers is leading to longer queues outside popular museums, and increasing footfall in city centres.
Online shopping also impacting on top locations
However, the full impact of positive consumer sentiment is not being felt by city centre retailers and retail landlords. Changes in shopping habits as a result of digitalisation are now also a cause of concern in attractive high street locations and shopping centres. For many of the products on offer here such as clothing, shoes and electron-ics, are no longer being purchased by customers in shops, but ordered online, using a PC at home or a smart phone while travelling. Conversely, local suppliers, such as supermarkets, are less affected by the online boom. The proportion of e-commerce to total retail sales therefore remains manageable at around 10 per cent; however, the impact is greater for city centre retail activity which is trend-driven.
ON AN INFLATION-ADJUSTED BASIS THE GERMAN RETAIL SECTOR HAS ONLY GROWN IN A FEW YEARS *
IMPORTANCE OF E-COMMERCE TO RETAIL SECTOR AS A WHOLE GROWS FROM YEAR TO YEAR *
Source for both charts: HDE * Retail sales excl. cars, petrol stations and drugstores, excl. VAT
It would be easier for the high-street retail sector to absorb the impact of the 10 per cent annual growth in online shopping if overall market growth was stronger. True, retail sales showed strong annual growth ranging from 3 to more than 4 per cent between 2015 and 2017. However, these years were exceptions, since no sales growth on this scale had previously been recorded since the beginning of the 1990s. If we also take account of the growth in consumer prices, the picture becomes even gloomier. Adjusted for inflation, retail sales have grown in only a few years out of a 25-year period, essentially from 2014 to 2017, a phase characterised by high nominal sales growth and low inflation.
Conversely, there are signs of only zero growth in inflation-adjusted retail sales this year. The German Retail Association (HDE) thus expects growth of 2 per cent in total retail sales. However, this is only marginally higher than the expected trend in inflation, and the retail sector could therefore stagnate again despite generally excellent conditions. Based on the much stronger growth in online business, this even indicates a slight decline in high-street retail sales.
In many pedestrian zones, particularly in small and medium-sized towns, the abovementioned trend is already clearly visible. Footfall is limited and vacant properties are obvious. The situation is not quite as bad in many growing regional
-5
-4
-3
-2
-1
0
1
2
3
4
5
199
319
94
199
519
96
199
719
98
199
920
00
200
120
02
200
320
04
200
520
06
200
720
08
200
920
10
201
120
12
201
320
14
201
520
16
201
720
18e
nom inal yoy i n % real ggü. Vorjahr in %
01234567891011
050
100150200250300350400450500550
200
2
200
3
200
4
200
5
200
6
200
7
200
8
200
9
201
0
201
1
201
2
201
3
201
4
201
5
201
6
201
7
201
8e
reta il e -commerce sale s in EUR bn (lhs)reta il sal es excl . e-comm erce sal es in EUR bn ( lhs)e-comm erce sal es i n % of total retai l sa les (rhs)
Online shopping a growing concern for city centre retailers
Retail sales growth only briefly reached high levels
Price-adjusted retail sales likely to stagnate this year
Pedestrian zones in small and medium-sized towns already suffering visibly from e-commerce

14 Real Estate Market Germany2018 | 2019
centres and of course in top locations, where shopping streets and shopping centres are generally packed. However, this trend is also leaving its mark on top German retail locations.
National and international retailers are adapting their in-store concepts to the altered conditions. They are reacting to the shift towards e-commerce - via companies’ own online shops or large internet traders such as Amazon or Zalando - by scaling down sales space, concentrating on fewer locations and reducing branch size. However, rental costs are still being kept in check more by other measures. Generally speaking, rent increases are no longer acceptable in high-street locations. In some places, a shift is also taking place away from expensive locations towards much cheaper neighbour-ing areas. In particular, shorter rental contracts with fixed rents are being agreed and are being replaced by short leases of 3 years with an extension option; sales-related rental payments have also become commonplace.
Conditions are also therefore becoming more challenging for retail landlords. The era of automatic demand for sales space in top locations and of rents outpacing sales is over. Weaker demand for space is also being accompanied by a growing supply of new developments in shopping streets and shopping centres built in recent years. An increasing number of retail chains have also gone bankrupt in the recent past. Examples are Butlers, Strauss Innovation, Wöhrl and – only a few weeks ago – Bench.
Instead, it is likely to take longer to market sales space, rental contracts could become shorter, and rent payments more volatile as a result of vacant properties, insolvency or rents linked to sales. This means that high purchase prices for retail properties are also less likely to be justified by the prospect of rising rents, as in the past. The structure of the customer base and requirements are also shifting. Fashion retailers are often being replaced by restaurant chains, supermarkets and drugstores, as well as fitness studios. Owners of retail properties will also have to adjust to shorter periods between refurbishment measures, in order to ensure that their properties remain attractive to chain stores and their customers.
Retail: comparison of top locations In contrast to many other cities, demographic growth and flourishing tourism are enabling city-centre locations in prime locations to offset the decline in sales caused by online shopping. The populations of the seven top locations jointly have grown by around 1 million people since 2007. The population of Berlin alone has grown by around 360,000 people. This is creating significant additional purchasing power of nearly EUR 6 bn in the seven top locations, based on the average per capita figure of EUR 5,825 in Germany in 2018 calculated by GfK. The fact that some of this is spent in city centre shops and shopping centres at least mitigates the decline in sales caused by e-commerce.
However, the strong growth in the number of visitors has also clearly become a more important economic factor. This is already evident from the large number of hotels which have opened in major German cities. Below the line, around 85 million overnight stays were reported in the top seven locations in 2017, considerably more than in the past. In 1997 the figure was around 29 million, rising to about 50 million in 2007. This growth of 35 million overnight stays within ten years - 14 million of which were in Berlin - generates substantial cash flows for restaurants and hotels, as well as additional revenue for the retail sector. Shopping tourists from abroad in particular, for example from the Gulf states or China, often spend large amounts.
Retailers adapt sales channels and reduce sales space
Retail landlords lose some demand
More difficult to market space
Top locations benefit as retail destinations from strong demographic growth
Strong growth in visitor numbers creates additional sales potential

15Real Estate Market Germany2018 | 2019
STRONG DEMOGRAPHIC GROWTH ALSO CREATES MORE SALES PO-TENTIAL IN TOP LOCATIONS POPULATION 2007 = 100
IMPORTANCE OF VISITORS AS A DEMAND GROUP INCREASING FOR TOP RETAIL LOCATIONS OVERNIGHT STAYS IN MILLIONS
Source: Feri Source: BulwienGesa, German Tourism Association (2017)
Sales space has also nevertheless expanded strongly, although at a much slower rate than the very strong growth visible up to about 2010. Combined with high levels of migration to the Top 7 cities, sales space per capita has essentially stagnated since 2010. Average per capita sales space is around 1.7 sqm in the top locations, although this also includes all retail segments – i.e. also supermarkets and drugstores.
The slower growth in sales space, and growth in retail sales, have clearly had a positive impact on sales floor productivity – sales per sqm of sales space. For while sales floor productivity fell or at best stagnated between the beginning of the 1900s and 2008, sales per unit area recovered considerably again subsequently. However, the levels reached 25 years ago have not been regained. Since these are also nominal sales figures, the retail sector is clearly worse off today in terms of inflation-adjusted sales than 25 years ago.
TOP WEST GERMAN LOCATIONS SHOW CONSISTENTLY ABOVE-AV-ERAGE PURCHASING POWER
SHOPPING STREETS IN TOP LOCATIONS WELL REPRESENTED IN TOP 20 BASED ON FOOTFALL
Source: BulwienGesa Source: JLL/EHI calculated on 14 April 2018 (Saturday) from 13h to 16h
In contrast to the longstanding stagnation or decline in sales floor productivity, prime rents in all the top locations have picked up strongly since the end of the 1990s. Conversely, rent trends in most other large German cities are much flatter. High demand for space in top locations, which has driven rents up, is based on their particular attractions for national and international retailers. Because of their significant
96
100
104
108
112
116
120
124
Berli n Dusseldorf Frank-furt
Ham-burg
Cologne Munich Stuttgart
2007 2009 2011 2013 2015 2017
0
4
8
12
16
20
24
28
32
Berli n Dussel-dorf
Frank-furt
Ham-burg
Cologne Munich Stutt-gart
1997 2001 2005 2009 2013 2017
growth from1997 to 2017
290%
120%
177%
218%144%
123%128%
80
90
100
110
120
130
140
Berli n Dussel-dorf
Frank-furt
Ham-burg
Cologne Muni ch Stutt-gart
purchasing powe r central i ty average for Germ any 70407145740577607780786581108300
877087759130914594359670
1018010985
1304013455
1415514390
(20) W iesbaden, Kirchgasse(19) Berlin , Alexanderplatz
(18) Munich , Tal(17) Dresden, Prager Straße
(16) Berli n , Tauentzienstra ße(15) Munich , W e instraße
(14) Bremen, Obernstra ße(13) Nurem be rg, Ka roli nenstraße(12) Hamburg Mönckebergstraße
(11) Hannover, Bahnhofstraße(10) Dusseldorf, Schadowstraße
(9) Stuttgart, Königstra ße(8) Cologne, Hohe Stra ße
(7) Dusseldorf, F l inger Straße(6) Dortmund, W estenhellenweg
(5) Hannover, Ge orgstraße(4) Cologne, Sch i lderga sse
(3) Munich , Neuhauser Straße(2) Munich , Kaufingerstraße
(1) Frankfurt, Ze il
Sales space has expanded strongly over a long period…
… and, in conjunction with stagnating retail sales, has depressed sales floor productivity
Peak rents up sharply despite falling sales floor productivity

16 Real Estate Market Germany2018 | 2019
purchasing power, high footfall, and international flavour, they are well suited for retailers seeking to enter the German market or test new retail concepts. Other large cities are particularly appropriate for expansion strategies, and because they are more numerous, they are more interchangeable.
DEMOGRAPHIC GROWTH HALTS INCREASE IN PER CAPITA SALES SPACE PER CAPITA SALES SPACE IN SQM
SALES FLOOR PRODUCTIVITY ONLY POSITIVE AGAIN IN THE LAST FEW YEARS RETAIL SALES PER SQM IN EURO (TOP 7)
Source: Feri Source: Feri
Only ten years later, when the upturn which followed the financial crisis led to retail sales growth in 2010, sales floor productivity also picked up again. For some years it has been moving in parallel with the continuing growth in prime rents. However, the rent rally in the retail sector ended in 2016 after nearly 20 years at an average of nearly EUR 300 per sqm. During this period, average prime rents almost doubled. Neither the attractions of the top locations supported by demographic growth, falling unem-ployment and continuing growth in the number of visitors, nor the increase in sales floor productivity facilitated a further increase in rents. With rents already high, and given the continuing success of online shopping, prime city-centre retail locations have also reached the financially viable limits of rental expenditure for sales space.
RETAIL: PRIME RENTS STAGNATING, HAVING ALMOST DOUBLED SINCE THE END OF THE 1990S (TOP 7) PRIME RETAIL RENTS IN EURO PER SQM
WIDE DIVERGENCE IN PRIME RETAIL RENTS BETWEEN REGIONAL CENTRES AND TOP 7 PRIME RETAIL RENTS, INDEXED, 1999 = 100
Source: BulwienGesa, DZ BANK Research forecast Source: BulwienGesa, DZ BANK Research forecast
Up to 2016, prime rents in all seven top locations increased visibly. However, the pace varied. On average, prime rents increased by around 40 per cent between 2007 and 2017. However, the rate of increase was only half this level in Stuttgart, while prime
0, 6
0, 8
1, 0
1, 2
1, 4
1, 6
1, 8
2, 0
2, 2
Berli n Dussel-dorf
Frank-furt
Ham-burg
Cologne Muni ch Stutt-gart
1993 1998 2002 2006 2010 2014 2018
3. 000
3. 200
3. 400
3. 600
3. 800
4. 000
4. 200
0
3. 000
6. 000
9. 000
12. 000
15. 000
18. 000
1992 1997 2002 2007 2012 2017
reta il space in '000 sqm (lhs)reta il sal es i n EUR per sqm (rhs)
0
50
100
150
200
250
300
350
1999 2003 2007 2011 2015 2019eRegional-12 Top-7
8090
100110120130140150160170180190
199
9
200
0
200
1
200
2
200
3
200
4
200
5
200
6
200
7
200
8
200
9
201
0
201
1
201
2
201
3
201
4
201
5
201
6
201
7
201
8e
201
9e
Top-7 Regional-12
Increase in average prime rents halted in 2016 at just under EUR 300 per sqm
Within 10 years prime rents have risen by 20 to 50 per cent depending on the top location

17Real Estate Market Germany2018 | 2019
rents in Berlin and Dusseldorf picked up by only about 50 per cent. In mid-2018, prime rents per sqm were in the region of EUR 100. The two cheapest locations are Stuttgart and Cologne at EUR 250 and EUR 255 respectively. Levels in Dusseldorf and Hamburg are similar at EUR 280 and EUR 285 per sqm. The three most expensive cities are Frankfurt, Berlin and Munich at EUR 300, 310 and 345 per sqm. Prime rents everywhere have remained stable since mid-2017.
RETAIL: RANGE OF PRIME RENTS BETWEEN MUNICH AND STUTTGART NEARLY EUR 100 PER SQM PRIME RETAIL RENTS IN EUR PER SQM
IN THE LAST TEN YEARS, PRIME RENTS HAVE RISEN MODERATELY TO STRONGLY, DEPENDING ON THE LOCATION PRIME RETAIL RENTS, INCREASE BETWEEN 2007 AND 2017 IN %
Source: BulwienGesa, DZ BANK Research forecast Source: BulwienGesa
While retailers can adjust to the shift in customer behaviour caused by digitalisation by realigning their sales channels, landlords have to adapt sales space as demand from retailers declines. It remains to be seen whether the gap can be closed by the many restaurants and large food courts which are increasingly a feature of shopping streets and shopping centres. However, since eating out has become increasingly popular in Germany in recent years, the prospects for the catering sector are good.
In any case, city centres and shopping centres are likely to continue to face challenges in the years ahead as customer preferences change, and not only because it will be virtually impossible to implement rent increases. The merger of Kaufhof and Karstadt, which is close to completion (per the end of August), could prove to be a game changer, because it will probably lead to a number of store closures. However, top city centre locations are not expected to suffer, since footfall should remain high there.
120140160180200220240260280300320340360
199
5
199
7
199
9
200
1
200
3
200
5
200
7
200
9
201
1
201
3
201
5
201
7
201
9e
Ber li nDusseldorfFrankfurtHamburgCologneMunichStuttgartTop-7 19
24
33
39 40 41
4751
Stutt-gart
Cologne Muni ch Ham-burg
Frankfurt Top-7 Dussel-dorf
Berli n
Food courts a recipe for success? An easier adjustment for retailers than landlords
The next few years will be challenging for the retail sector

18 Real Estate Market Germany2018 | 2019
European retail In the European retail sector, London and Paris still enjoy a clear lead in terms of rent levels. Prime rents in top German locations are average by European standards, despite a buoyant economy and years of strong growth in retail rents. However, when making comparisons with other countries, it has to be borne in mind that capital cities often function as pre-eminent shopping locations in many countries. For example, this is the case in France/Paris, Austria/Vienna, the UK/London, and Ireland/Dublin. A large proportion of retailer interest is thus focused on these locations, since there are no equivalent alternatives. The situation is different in Germany which has seven top retail locations, giving retailers more choice.
PRIME EUROPEAN RETAIL RENTS: LEVELS ARE AVERAGE IN LARGE GERMAN CITIES, BUT MUCH HIGHER IN LONDON AND PARIS PRIME RETAIL RENTS IN EUR SQM MONTHLY
Source: BNP Real Estate Per: Q4/2017
0200400600800
1. 0001. 2001. 4001. 6001. 8002. 0002. 2002. 400
Prime rents in large German cities average by European standards

19Real Estate Market Germany2018 | 2019
Retail space in Berlin
PRIME RETAIL RENTS IN EUR PER SQM RETAIL SALES IN EUR PER SQM
Source: BulwienGesa, Feri, DZ BANK Research forecasts Source: Feri
Berlin has done exceptionally well as a retail location and, for some time now, the city has been scoring high with investors and retailers alike, driven by a catchment area of over five million people, strong population growth, and the fact that it is a trend-setter and tourist high spot with 31 million overnight stays p.a. Foreign retailers in particular are still keen on Berlin as their point of entry into the German market. Moreover, there has been a marked improvement in Berlin's economic situation with an increase of almost 300,000 in the number of people in employment in the space of ten years. Nevertheless, Berlin is still economically weak. The city scores 93 for purchasing power which is still well below the German-wide average of 100 points. Berlin's retail sector differs from the other top locations in view of its size and the fact that it has a few geographically quite separate shopping areas which are also very different in character. They include the Kurfürstendamm and Tauentzienstraße where rents are the highest, the Alexanderplatz with its high footfall and Friedrichstraße. The trendy Hackescher Markt is also in a good location. The shopping "miles" are bolstered by a large number of shopping centres such as the huge Mall of Berlin. The city is getting two more, the EAST SIDE MALL which opens in the autumn of 2018, while the Schultheiss-Quartier opened its doors to customers for the first time in August, as the first shopping centre in Moabit. As in the other top locations, the increase in floor space and growing online shopping have brought to a halt the rise in prime rents in Berlin at EUR 310 per sqm after a 50% increase over ten years up to mid-2016. The situation is expected to be unchanged this year and next.
RETAIL SPACE IN BERLIN
2016 2017 2019e 2019e
Demand
Per cap. disposable income EUR/month 1,648 1,683 1,713 1,749
Unemployment rate % 9.8 9.0 8.5 8.2
Retail sales EUR m/% yoy 16,348 / 2.5 16,832 / 3.0 17,279 / 2.7 17,756 / 2.8
Retail sales EUR/sqm 2,579 2,593 2,621 2,642
Supply
Retail space in sqm '000 6,339 6,490 6,591 6,720
Retail space % yoy 0.7 2.4 1.6 2.0
Retail rents
Prime/secondary location in Euro/sqm 310 / 14.5 310 / 15.5 310 / 15.5 310 / 15.5
Prime/secondary location % yoy 3.3 / 0.0 0.0 / 6.9 0.0 / -3.2 0.0 / 0.0
Source: Feri, BulwienGesa, DZ BANK Research forecasts
0
50
100
150
200
250
300
350
2003 2005 2007 2009 2011 2013 2015 2017 2019e
Berlin Top-7 Regional-12
0
1. 000
2. 000
3. 000
4. 000
5. 000
2003 2005 2007 2009 2011 2013 2015 2017 2019e
Berlin Top-7 Regional-12
Berlin has become a top retail location even Europe-wide

20 Real Estate Market Germany2018 | 2019
Retail space in Cologne
PRIME RETAIL RENTS IN EUR PER SQM RETAIL SALES IN EUR PER SQM
Source: BulwienGesa, Feri, DZ BANK Research forecasts Source: Feri
Along with Dusseldorf, the million-strong city of Cologne is the second most important shopping location in Germany’s West, a fact which has led to heightened competition. This is likely to be one of the reasons why Cologne now lags behind in the top segment in terms of prime rents, along with the fact that it has a relatively good supply of retail space. Unlike Dusseldorf, Cologne's city centre concentrates more on the mass market. This is true above all of the Schildergasse which has a high footfall and is 90 per cent occupied by high-street brand names. However, lately, Hohe Straße has had to battle with vacant stores. Cologne also has trendy locations which stand out from the typical retailer mix. Moreover, a fairly small luxury segment has become es-tablished in the Domkloster/Wallraffplatz area which is likely to benefit from the remod-elling of the Dom Hotel. One plus point in the inner city is the three-mile long shopping promenade and the fact that the city offers is an attractive visit experience. A three-million strong catchment area, large number of shoppers from the Benelux countries and over six million overnight stays by tourists and trade fair visitors are all of interest for retailers. However, purchasing power is slightly lower than in the other top western German locations. Unlike in other big shopping destinations, there have been no large-scale retail developments and there are none on the horizon. Slightly larger projects include the refurbishment of the DuMont Carré and of the former family-run clothing store Jacobi in Hohe Straße, in which the Saturn flagship store moved in across five storeys in May 2018. Prime rents are likely to remain at EUR 255 per sqm during the forecast period up to 2019.
RETAIL SPACE IN COLOGNE
2016 2017 2018e 2019e
Demand
Per cap. disposable income EUR/month 1,836 1,861 1,885 1,916
Unemployment rate % 8.7 8.4 8.0 7.7
Retail sales EUR m/% yoy 7,263 / 2.8 7,505 / 3.3 7,735 / 3.1 7,994 / 3.3
Retail sales EUR/sqm 5,157 5,329 5,487 5,665
Supply
Retail space in sqm '000 1,408 1,409 1,410 1,411
Retail space % yoy -0.1 0.0 0.1 0.1
Retail rents
Prime/secondary location in Euro/sqm 250 / 15.0 255 / 15.0 255 / 15.0 255 / 15.0
Prime/secondary location % yoy 0.0 / 0.0 2.0 / 0.0 0.0 / 0.0 0.0 / 0.0
Source: Feri, BulwienGesa, DZ BANK Research forecasts
0
50
100
150
200
250
300
350
2003 2005 2007 2009 2011 2013 2015 2017 2019e
Cologne Top-7 Regional-12
0
1. 000
2. 000
3. 000
4. 000
5. 000
6. 000
2003 2005 2007 2009 2011 2013 2015 2017 2019e
Cologne Top-7 Regional-12
Strong retail location in western Germany

21Real Estate Market Germany2018 | 2019
Retail space in Dusseldorf
PRIME RETAIL RENTS IN EUR PER SQM RETAIL SALES IN EUR PER SQM
Source: BulwienGesa, Feri, DZ BANK Research forecasts Source: Feri
For the past decade or so, Dusseldorf has been one big building site. The flyover has now been replaced by a tunnel and the new underground Wehrhahn line will provide better connections between the local transport network and high-street locations. Existing department stores have been modernised – Carsch-Haus, Kaufhof, Sevens and Kö-Galerie – and new ones added along with shopping centres such as the Kö-Bögen I. However, work on the spectacular Kö-Bogen II and new pedestrian area in the hitherto rather unattractive Schadowstraße have to be completed (scheduled for 2020) before the city can take advantage of all this building work. However, even in its old guise, the shopping location, which is synonymous with fashion and luxury, has performed well. The strength of the location reflects a large catchment area of two million people and high purchasing power, beaten only by Munich among the top seven. Unlike Berlin with its various decentralised shopping locations, retail in Dusseldorf is concentrated in the city centre, which accounts for a large share of one third of all shopping space in the city. Only Stuttgart has a similar concentration; in the remaining top seven, the city centre accounts for a maximum of a quarter of the total sales space. In addition, the luxury end of the Dusseldorf market, the "Kö" offers a quality visit experience, with a wide choice of places to eat and drink. The former strict split between a "bank side" and a "shopping side" is gradually disappearing. Last year, prime rents climbed to EUR 280 per sqm in spite of the endless building site in the city centre, although we expect them to remain unchanged until the end of 2019. Whether or not prime rents can then start picking up after the city's facelift will depend to a large extent on future conditions in the retail sector.
RETAIL SPACE IN DUSSELDORF
2016 2017 2018e 2019e
Demand
Per cap. disposable income EUR/month 2,145 2,191 2,232 2,278
Unemployment rate % 7.8 7.4 7.0 7.0
Retail sales EUR m/% yoy 4,624 / 3.4 4,782 / 3.4 4,937 / 3.3 5,110 / 3.5
Retail sales EUR/sqm 3,728 3,810 3,902 4,005
Supply
Retail space in sqm '000 1,240 1,255 1,265 1,276
Retail space % yoy 0.9 1.2 0.8 0.9
Retail rents
Prime/secondary location in Euro/sqm 275 / 16.0 280 / 16.0 280 / 16.0 280 / 16.0
Prime/secondary location % yoy 1.9 / 0.0 1.8 / 0.0 0.0 / 0.0 0.0 / -1.3
Source: Feri, BulwienGesa, DZ BANK Research forecasts
0
50
100
150
200
250
300
350
2003 2005 2007 2009 2011 2013 2015 2017 2019e
Dusseldorf Top-7 Regional-12
0
1. 000
2. 000
3. 000
4. 000
5. 000
2003 2005 2007 2009 2011 2013 2015 2017 2019e
Dusseldorf Top-7 Regional-12
After years of building works in Dusseldorf's city centre, the end is at last is sight

22 Real Estate Market Germany2018 | 2019
Retail space in Frankfurt
PRIME RETAIL RENTS IN EUR PER SQM RETAIL SALES IN EUR PER SQM
Source: BulwienGesa, Feri, DZ BANK Research forecasts Source: Feri
Frankfurt is one of the strongest retail locations in Germany with an affluent catchment area of 2.3 million inhabitants, a growing population, rising number of people in employment and visitors, all of which make the city even more attractive for retailers and hospitality firms. The market has responded to demand for retail space with a series of developments such as the Skyline Plaza shopping centre which opened near the trade centre in 2013; the centre is popular because of a large food court. Other examples are developments in the upmarket Goethestraße such as One Goetheplaza or the Ma'Ro. Most of the building at present is in the mass market Zeil area. The Zeilgalerie which has been pulled down is being replaced next to the Kaufhof by the new UpperZeil. Just a stone's throw away, after not even ten years in operation, the MyZeil shopping centre is undergoing a complete modernisation programme which will include a new restaurant area, Foodtopia, and an exclusive programme-cinema. On the eastern edge of the city, the HessenCenter was due to be modernised and expanded. However, the increase in floor space now seems to have reached capacity, and plans to expand the HessenCenter have been scrapped. Moreover, according to press reports, Kaufhof which wanted to take over most of the UpperZeil, which is nearing completion, is now pulling out. It has been known for some time that the branch in the Nordwestcenter is due to close in 2019. Prime rents are the most stable feature of the Frankfurt retail sector at present, having been unchanged at around EUR 300 per sqm since the end of 2015. We cannot see any headroom for prime rents during the forecast period up to 2019.
RETAIL SPACE IN FRANKFURT
2016 2017 2018e 2019e
Demand
Per cap. disposable income EUR/month 1,861 1,900 1,935 1,973
Unemployment rate % 6.3 5.9 5.7 5.6
Retail sales EUR m/% yoy 5,459 / 3.4 5,648 / 3.5 5,814 / 2.9 5,995 / 3.1
Retail sales EUR/sqm 3,555 3,630 3,703 3,793
Supply
Retail space in sqm '000 1,536 1,556 1,570 1,580
Retail space % yoy 2.2 1.3 0.9 0.6
Retail rents
Prime/secondary location in Euro/sqm 300 / 17.5 300 / 17.5 300 / 17.5 300 / 17.5
Prime/secondary location % yoy 0.0 / -2.8 0.0 / 0.0 0.0 / 0.0 0.0 / 0.0
Source: Feri, BulwienGesa, DZ BANK Research forecasts
0
50
100
150
200
250
300
350
2003 2005 2007 2009 2011 2013 2015 2017 2019e
Frankfurt Top-7 Regional-12
0
1. 000
2. 000
3. 000
4. 000
5. 000
2003 2005 2007 2009 2011 2013 2015 2017 2019e
Frankfurt Top-7 Regional-12
Big names pulling out of Frankfurt, highlighting growing challenges facing top locations

23Real Estate Market Germany2018 | 2019
Retail space in Hamburg
PRIME RETAIL RENTS IN EUR PER SQM RETAIL SALES IN EUR PER SQM
Source: BulwienGesa, Feri, DZ BANK Research forecasts Source: Feri
The leading shopping location in N. Germany is backed by a solid economic trend, population growth, high purchasing power and a large catchment area of 3.5 million people. In addition, the city has a flourishing tourism trade with some 14 million overnight stays p.a. and close to 900,000 cruise ship visitors. The city offers a broad range of shopping options from conventional mass consumer locations such as the Spitalerstraße and Mönckebergstraße in the eastern part of the city to luxury destinations such as the Neuer Wall in west Hamburg. In between, there is the Europa-Passage with its new Food Court as the only big shopping centre in the heart of the city. All in all, however, the supply of retail space is tight at only 350,000 sqm, which is roughly the same as in the much smaller city of Dusseldorf, although clear progress is being made through a large number of smaller and medium-sized projects. Prime rents have been less dynamic and have been unchanged since the end of 2015 at EUR 285 per sqm. In spite of attractive conditions, an increase is not expected during the forecast period until 2019 because of the success of e-commerce. Two major projects are likely to have an impact on the future of retail. Firstly, a long way in the future, the extension of the city's central station, which would benefit the crossing into the Spitalerstraße. In contrast, the new shopping centre being built by developer Unibail Rodamco in the southern Überseequartier in the HafenCity will have an impact much sooner. As an island solution with 200 shops and almost 70,000 sqm of sales space, the development which is due to open in 2021 could lead to significant competition for the inner city.
RETAIL SPACE IN HAMBURG
2016 2017 2018e 2019e
Demand
Per cap. disposable income EUR/month 2,052 2,084 2,112 2,145
Unemployment rate % 7.1 6.8 6.4 6.3
Retail sales EUR m/% yoy 15,279 / 3.9 15,904 / 4.1 16,480 / 3.6 17,094 / 3.7
Retail sales EUR/sqm 5,119 5,312 5,482 5,661
Supply
Retail space in sqm '000 2,985 2,994 3,006 3,019
Retail space % yoy 0.4 0.3 0.4 0.4
Retail rents
Prime/secondary location in Euro/sqm 285 / 40.0 285 / 40.0 285 / 40.0 285 / 40.0
Prime/secondary location % yoy 0.0 / 0.0 0.0 / 0.0 0.0 / 0.0 0.0 / 0.0
Source: Feri, BulwienGesa, DZ BANK Research forecasts
0
50
100
150
200
250
300
350
2003 2005 2007 2009 2011 2013 2015 2017 2019e
Hamburg Top-7 Regional-12
0
1. 000
2. 000
3. 000
4. 000
5. 000
2003 2005 2007 2009 2011 2013 2015 2017 2019e
Hamburg Top-7 Regional-12
Many retail developments enhance the attraction of Hamburg as a retail location

24 Real Estate Market Germany2018 | 2019
Retail space in Munich
PRIME RETAIL RENTS IN EUR PER SQM RETAIL SALES IN EUR PER SQM
Source: BulwienGesa, Feri, DZ BANK Research forecasts Source: Feri
Munich is number one in the German retail sector with the highest level of prime rents, retail-space productivity and purchasing power. One major factor in this is an economically strong and exceptionally affluent catchment area of over three million inhabitants, which moreover is growing very fast. In addition, the city welcomes many visitors from home and especially abroad, who account for around 16 million overnight stays p.a. Munich's attraction as a retail destination is also boosted by the fact that the city offers a high-quality visit experience with many cafés and restaurants and a broad range retail offer ranging from the mass-market outlets, to old specialist stores and luxury shops. All these factors mean that Munich has by far the highest prime rents in the German retail sector at EUR 345 per sqm. In addition, although the city has quite a substantial amount of retail space at around half a million sqm, it has not been able to keep up with high demand, not least because it hardly increased for a long time. However, this has changed with city-centre projects such as the Palais an der Oper or the Hofstatt. In addition, there are current developments which will soon boost availa-ble retail space, such as the old Hettlage building / the Alte Akademie, the remodelling of the Sattlerplatz or – slightly outside the city centre – the Forum Schwanthalerhöhe in the former XXXLutz, which will be turned into a conventional shopping centre by 2019. The biggest project is Munich's new central station which is expected to take until the end of the next decade to complete. We expect the improvement in space supply and the fact that demand is being dampened by e-commerce to keep a lid on Munich's prime rents until 2019.
RETAIL SPACE IN MUNICH
2016 2017 2018e 2019e
Demand
Per cap. disposable income EUR/month 2,362 2,416 2,463 2,516
Unemployment rate % 4.6 4.2 3.9 3.7
Retail sales EUR m/% yoy 9,317 / 3.9 9,689 / 4.0 10,028 / 3.5 10,389 / 3.6
Retail sales EUR/sqm 4,471 4,595 4,704 4,817
Supply
Retail space in sqm '000 2,084 2,109 2,132 2,157
Retail space % yoy 0.7 1.2 1.1 1.2
Retail rents
Prime/secondary location in Euro/sqm 345 / 38.0 345 / 39.0 345 / 39.0 345 / 39.0
Prime/secondary location % yoy 1.5 / 2.7 0.0 / 2.6 0.0 / 0.0 0.0 / 0.0
Source: Feri, BulwienGesa, DZ BANK Research forecasts
0
50
100
150
200
250
300
350
2003 2005 2007 2009 2011 2013 2015 2017 2019e
Munich Top-7 Regional-12
0
1. 000
2. 000
3. 000
4. 000
5. 000
2003 2005 2007 2009 2011 2013 2015 2017 2019e
Munich Top-7 Regional-12
Even as Germany's leading shopping destination, Munich should become even more attractive through the many developments underway

25Real Estate Market Germany2018 | 2019
Retail space in Stuttgart
PRIME RETAIL RENTS IN EUR PER SQM RETAIL SALES IN EUR PER SQM
Source: BulwienGesa, Feri, DZ BANK Research forecasts Source: Feri
The retail sector in Stuttgart benefits from 2.8 million inhabitants in a catchment area with a strong economy. Although the number of visitors to the city does not score the top mark, tourism is still important with over 6,000 overnight stays per 1,000 inhabitants. The strength of the city as a retail location and shortage of retail space in the prime location which is the Königstraße has prompted the development of several large inner-city retail projects, which led to an increase of over 20 per cent in sales space in one go: the MILANEO and Gerber shopping centres with a combined 60,000 sqm of retail space opened almost at the same time in the autumn of 2014, at opposite ends of the city centre shopping district. Nevertheless, the prime rent had increased a little more to EUR 250 by the spring of 2016, since the new centres not only increased sales space, but also the city's attraction. Since then, however, the prime rent has stagnated. Contributory factors are likely to have been not only muted demand for space from retailers and the opening in the spring of 2017 of the Dorotheen Quartier with a further 10,000 sqm of shopping floor, which is likely to have a positive impact on the luxury end of the market in Stiftstraße. The fear which was still being expressed quite recently that increasing retail space would be too much for the city has not materialised. The Königstraße has retained its dominant position in Stuttgart's retail scene, helped also by new stores such as the fashion outlet Saks Off 5th, the second Primark branch in Stuttgart and a Uniqlo store. This year, the Dutch cult department store Hema has opened a branch. Prime rents have been stable since 2016 and we expect this to continue during the forecast period up to 2019.
RETAIL SPACE IN STUTTGART
2016 2017 2018e 2019e
Demand
Per cap. disposable income EUR/month 2,112 2,149 2,179 2,216
Unemployment rate % 5.3 4.7 4.5 4.3
Retail sales EUR m/% yoy 3,636 / 3,0 3,749 / 3,1 3,852 / 2,8 3,964 / 2,9
Retail sales EUR/sqm 3,417 3,507 3,580 3,659
Supply
Retail space in sqm '000 1,064 1,069 1,076 1,083
Retail space % yoy 0.4 0.4 0.7 0.7
Retail rents
Prime/secondary location in Euro/sqm 250 / 15.0 250 / 16.0 250 / 16.0 250 / 16.0
Prime/secondary location % yoy 2.0 / 3.4 0.0 / 6.7 0.0 / 0.0 0.0 / 0.0
Source: Feri, BulwienGesa, DZ BANK Research forecasts
0
50
100
150
200
250
300
350
2003 2005 2007 2009 2011 2013 2015 2017 2019e
Stuttgart Top-7 Regional-12
0
1. 000
2. 000
3. 000
4. 000
5. 000
2003 2005 2007 2009 2011 2013 2015 2017 2019e
Stuttgart Top-7 Regional-12
The city has coped well with the increase in retail space from three new shopping centres in a short space of time

26 Real Estate Market Germany2018 | 2019
OFFICE SPACE
Whereas the shortage of housing is deeply felt by the public, office space has often been associated with a persistent vacancy problem, and consequently new office buildings are often regarded as superfluous. In fact, the opposite is true. Office space is as much in short supply in many office locations as housing. At the same time, the situation is almost more difficult for those needing office space, because unlike in the housing market where demand is for single homes, demand in the office market is often for larger, connecting spaces. Smaller office units spread over a town are irrelevant in such cases.
However, the times of high vacancy rates in the office market are not all that far back in time. The large number of office buildings which were constructed – often speculatively – during the dotcom boom after the turn of the millennium led the vacancy rate to shoot up. It remained high for almost ten years during the international financial market crisis and subsequent euro debt crisis, and is still the basis for the current perception that there are high vacancy rates in the office market. With the increasing housing shortage, many empty old office buildings were converted into living space. This was also an attractive proposition because flat rents had increased sharply and often exceeded office rents apart from in the best inner-city locations.
Against that background, new office building fell to a low level. Between 2011 and 2017, less than 800,000 sqm of new office space came to the market in the top seven locations. In contrast, from the year 2000 to 2010, there was an average of almost 1.3 sqm of new office space becoming available every year. In spite of the shortage, the delivery of new space is likely to remain under the 1 million sqm mark in 2018 as well. There signs of a much higher level of new space coming to the market for the first time since 2009 with an estimated 1.3 million sqm, but not until next year.
This space is urgently needed since the average vacancy rate in the top seven locations is likely to fall to 3.5 per cent by 2019. The rate is already down to 2 per cent in Berlin, Munich and Stuttgart. Supply in the office market is therefore likely to remain tight since it will not be so easy to ease the bottleneck rapidly, even with a high level of completions.
OFFICE SPACE VACANCY RATE CONTINUES TO FALL SHARPLY VACANCY RATE AS PER CENT
OFFICE CONSTRUCTION SLOWLY PICKING UP MOMENTUM ACCESS TO NEW OFFICE SPACE TOP SEVEN LOCATIONS IN '000 SQM
Source: BulwienGesa, DZ BANK Research forecasts Source: BulwienGesa
0
2
4
6
8
10
12
199
8
199
9
200
0
200
1
200
2
200
3
200
4
200
5
200
6
200
7
200
8
200
9
201
0
201
1
201
2
201
3
201
4
201
5
201
6
201
7
201
8e
201
9e
top locations regional centres
0
500
1.000
1.500
2.000
2.500
199
819
99
200
020
01
200
220
03
200
420
05
200
620
07
200
820
09
201
020
11
201
220
13
201
420
15
201
620
17
201
8e20
19e
new office space 1998-2007 2008-2017
Like the housing market, the supply of available office space has become very tight
Until a few years ago, the office market was still characterised by relatively high vacancy rates
High vacancy rates dampened construction of new office space
Vacancy rate in 2019 likely to fall to its lowest level in almost 20 years

27Real Estate Market Germany2018 | 2019
Number of office workers growing much faster than office space
The top locations in particular are proving to be engines of growth, and, in spite of high rents, they stand out as attractive locations for companies. They score points in view of outstanding transport links not only with other German cities, but also by making big international cities easily accessible – often via direct flights. In addition, there are big labour markets. The cities in question are also attractive with a broad range of leisure and cultural activities on offer. On balance, the strong momentum in the labour markets can easily absorb the rising labour force potential. In spite of a sharp rise in the number of inhabitants, unemployment rates in all the top locations are falling. This applies above all to Berlin, where the unemployment rate has fallen from a high of 19 per cent in 2005 to around 8 per cent in July 2018.
SO FAR, GERMAN LABOUR MARKET SHOWS NO SIGNS OF FATIGUE OFFICE EMPLOYMENT GROWING MUCH FASTER THAN OFFICE SPACE IN ALL THE TOP LOCATIONS
Source: Bundesbank, Bundesagentur für Arbeit Source: BulwienGesa, Feri, DZ BANK Research forecasts
Whereas offices space in the top locations has only increased at a muted space for some time, the number of office workers has risen sharply. Within the space of ten years, their numbers have swelled by around 500,000 to 2.4 million an increase of almost 25 per cent, whereas the amount of office space in the top locations has only grown by 6 per cent to around 80 million sqm. Whereas office workers had almost 40 sqm of space in 2006, that figure is now down to just under 33 sqm. Berlin is the biggest office location in Germany with around 19 million sqm, ahead of Hamburg and Munich which each have around 14 million sqm. Frankfurt only has just under 10 million sqm. Dusseldorf, Cologne and Stuttgart each have not quite 8 million sqm.
The situation in the office markets is likely to remain tight for the time being. Although the construction of new office projects has picked up, in view of the existing scarcity of space and likely further rise in the number of white collar workers, there is no sign of any lasting improvement on the horizon. Demand for office space would be even higher if it were not dampened by a shortage of qualified labour. The number of advertised vacancies in Germany has almost doubled in the space of ten years to 800,000 most recently.
5
6
7
8
9
10
11
12
13
3637383940414243444546
199
219
93
199
419
95
199
619
97
199
819
99
200
020
01
200
220
03
200
420
05
200
620
07
200
820
09
201
020
11
201
220
13
201
420
15
201
620
17
201
8
l abour force in mi ll ion persons (lhs)une mployment rate in % (lhs)
5558616467707376798285
1, 61, 71, 81, 92, 02, 12, 22, 32, 42, 52, 6
199
2
199
4
199
6
199
8
200
0
200
2
200
4
200
6
200
8
201
0
201
2
201
4
201
6
201
8e
off i ce workers in mi ll ion persons (l hs)off i ce space i n mi li on sqm (rhs)
Fast growing economy in the top locations leading to a sharp rise in the workforce
Office work in top locations has grown four times as fast as office space since 2007
No sign of any lasting easing in the office market

28 Real Estate Market Germany2018 | 2019
RECENTLY WEAKER EXPECTATIONS RECOVERED SIGNIFICANTLY IN AUGUST IFO BUSINESS CLIMATE: 2015 = 100, SEASONALLY ADJUSTED
ECONOMIC SITUATION STILL RATED AS QUITE GOOD, BUT EXPECTATIONS HAVE DETERIORATED ZEW INDEX: BALANCE OF POSITIVE AND NEGATIVE ASSESSMENTS
Source: ifo Institute Source: ZEW
So far, there are no signs of any end to job growth. However, the pace could slow down if companies adopt a more cautious attitude in view of an increase in the number of international crises such as the US trade dispute, Brexit or the tense situation in the Middle East. This is also reflected in the assessments of companies and economic experts surveyed by the ifo Institute and the Zentrum für Europäische Wirtschafts-forschung (ZEW). Whereas the situation of companies and the state of the German economy are still rated as good, expectations have declined considerably. This also fits in with a slower though still solid GDP trend, which grew by 0.5 per cent in Q2 against the previous quarter (Q1 2018 0.4 per cent). In contrast, the DAX30 is trading well below the 13,500 or so points which the index reached at the beginning of 2018.
WHEREAS THE GERMAN ECONOMY IS STILL PURRING IN SPITE OF MANY FLASH POINTS… REAL GDP VS. PREVIOUS QUARTER (%)
…SHARES PRICES OF COMPANIES LISTED IN THE DAX30 HAVE FALLEN SHARPLY SINCE THE BEGINNING OF THE YEAR DAX30 IN POINTS
Source: Federal Statistical Office Source: Deutsche Börse
All in all, the office market has done well in what have been generally positive conditions. This was clear from a high office take-up figure last year and in H1 2018, and from a rise in prime rents. Whereas the reason for the increase in prime rents is obvious in view of the scarcity of available space and high demand, it is slightly surprising that office space take-up still hit a new record in 2017.
70
75
80
85
90
95
100
105
110
115
200
0
200
1
200
2
200
3
200
4
200
5
200
6
200
7
200
8
200
9
201
0
201
1
201
2
201
3
201
4
201
5
201
6
201
7
201
8expectations i fo business cl im ate busine ss conditions
-100-80-60-40-20
020406080
100
200
0
200
1
200
2
200
3
200
4
200
5
200
6
200
7
200
8
200
9
201
0
201
1
201
2
201
3
201
4
201
5
201
6
201
7
201
8
economic sentiment economic situation
1, 0
-0, 1
0, 4
1, 0
-0, 1
0, 6
0, 3
0, 6
0, 9
0, 4
0, 2
0, 4
1, 1
0, 6 0, 6 0, 5
0, 40, 5
Q1
201
4
Q2
201
4
Q3
201
4
Q4
201
4
Q1
201
5
Q2
201
5
Q3
201
5
Q4
201
5
Q1
201
6
Q2
201
6
Q3
201
6
Q4
201
6
Q1
201
7
Q2
201
7
Q3
201
7
Q4
201
7
Q1
201
8
Q2
201
8
11. 600
11. 800
12. 000
12. 200
12. 400
12. 600
12. 800
13. 000
13. 200
13. 400
13. 600
13. 800
08/2
017
09/2
017
10/2
017
11/2
017
12/2
017
01/2
018
02/2
018
03/2
018
04/2
018
05/2
018
06/2
018
07/2
018
08/2
018
Companies upbeat about their present situation, but expectations show growing doubts
Office market did well in 2017 against robust economic background
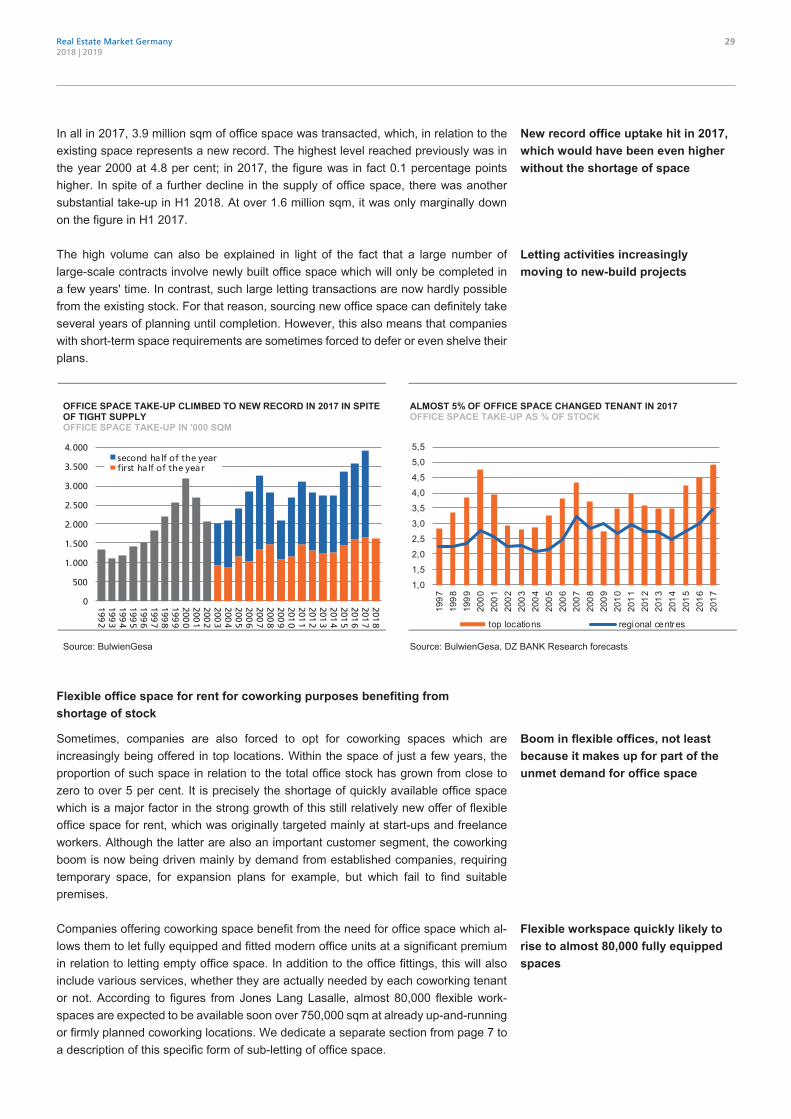
29Real Estate Market Germany2018 | 2019
In all in 2017, 3.9 million sqm of office space was transacted, which, in relation to the existing space represents a new record. The highest level reached previously was in the year 2000 at 4.8 per cent; in 2017, the figure was in fact 0.1 percentage points higher. In spite of a further decline in the supply of office space, there was another substantial take-up in H1 2018. At over 1.6 million sqm, it was only marginally down on the figure in H1 2017.
The high volume can also be explained in light of the fact that a large number of large-scale contracts involve newly built office space which will only be completed in a few years' time. In contrast, such large letting transactions are now hardly possible from the existing stock. For that reason, sourcing new office space can definitely take several years of planning until completion. However, this also means that companies with short-term space requirements are sometimes forced to defer or even shelve their plans.
OFFICE SPACE TAKE-UP CLIMBED TO NEW RECORD IN 2017 IN SPITE OF TIGHT SUPPLY OFFICE SPACE TAKE-UP IN '000 SQM
ALMOST 5% OF OFFICE SPACE CHANGED TENANT IN 2017 OFFICE SPACE TAKE-UP AS % OF STOCK
Source: BulwienGesa Source: BulwienGesa, DZ BANK Research forecasts
Flexible office space for rent for coworking purposes benefiting from shortage of stock
Sometimes, companies are also forced to opt for coworking spaces which are increasingly being offered in top locations. Within the space of just a few years, the proportion of such space in relation to the total office stock has grown from close to zero to over 5 per cent. It is precisely the shortage of quickly available office space which is a major factor in the strong growth of this still relatively new offer of flexible office space for rent, which was originally targeted mainly at start-ups and freelance workers. Although the latter are also an important customer segment, the coworking boom is now being driven mainly by demand from established companies, requiring temporary space, for expansion plans for example, but which fail to find suitable premises.
Companies offering coworking space benefit from the need for office space which al-lows them to let fully equipped and fitted modern office units at a significant premium in relation to letting empty office space. In addition to the office fittings, this will also include various services, whether they are actually needed by each coworking tenant or not. According to figures from Jones Lang Lasalle, almost 80,000 flexible work-spaces are expected to be available soon over 750,000 sqm at already up-and-running or firmly planned coworking locations. We dedicate a separate section from page 7 to a description of this specific form of sub-letting of office space.
0
500
1. 000
1. 500
2. 000
2. 500
3. 000
3. 500
4. 000
1992
1993
1994
1995
1996
1997
1998
1999
2000
2001
2002
2003
2004
2005
2006
2007
2008
2009
2010
2011
2012
2013
2014
2015
2016
2017
2018
second ha lf of the yearf irst ha lf of the yea r
1,0
1,5
2,0
2,5
3,0
3,5
4,0
4,5
5,0
5,519
97
199
819
99
200
020
01
200
220
03
200
420
05
200
620
07
200
820
09
201
020
11
201
220
13
201
420
15
201
620
17
top locations regional centres
New record office uptake hit in 2017, which would have been even higher without the shortage of space
Letting activities increasingly moving to new-build projects
Boom in flexible offices, not least because it makes up for part of the unmet demand for office space
Flexible workspace quickly likely to rise to almost 80,000 fully equipped spaces

30 Real Estate Market Germany2018 | 2019
CONSISTENT RISE IN PRIME RENTS SINCE 2011 PRIME RENT IN EURO PER SQM
BERLIN OFFICE MARKET ABOVE ALL CONTRIBUTED TO A SHARP IN-CREASE IN PRIME RENTS IN 2016 AND 2017 PRIME RENTS VS. PREVIOUS YEAR (%)
Source: BulwienGesa, DZ BANK Research forecasts Source: BulwienGesa, DZ BANK Research forecasts
In view of a robust labour market and further GDP growth, demand for office space is likely to continue to grow. However, demand for office space in the next few years will not only depend on the state of the economy; it will also be influenced by other factors. Demographics and digitalisation in the world of work are also likely to play a part. The first of the baby boomers will be reaching retirement age at the beginning of the next decade, thus weakening labour workforce participation. However, the impact can be mitigated by postponing retirement age, higher workforce participation by women or through immigration.
One as yet unanswered question is how increasingly smart technology will impact on demand for office space. A sharp rise in working from home could lead to a fall in demand for workspace in offices. As a result, companies and public-sector employers would save on the cost of office space, and a reduction in the number of commuters would ease the burden on public transport infrastructure. Even the housing markets in conurbations could benefit from such a trend. However, it is also possible that pres-ence in the office will remain the norm in day-to-day working life. At least this is the path adopted by the big names in digitalisation such as Apple, Facebook or Google, which have sprawling campuses as their head office in Cupertino, Palo Alto and MountainView where they try to make office work as attractive as possible to their staff by offering them first-class staff restaurants, gyms, etc.
Office: comparison of top locations
The attraction of top locations for companies described earlier has led to a sharp rise in the number of office workers in all seven locations. The increases within the space of ten years range from just over 15 per cent in Frankfurt to over 30 per cent in Berlin. In contrast, office space at the top locations has grown much more slowly. During the same period, the increase was within a range of 4 per cent in Frankfurt to not quite 9 per cent in Hamburg.
However, ten years ago, there was nothing of the present urgency to build office space. Back then, there was almost 7 million sqm of vacant office space, and therefore demand could easily be met from the existing stock. However, job growth picked up with the economic upturn which began in 2010 and is ongoing, leading to a rise in demand for office space. However, there was only a marginal increase in new building.
0
5
10
15
20
25
30
35
199
920
00
200
120
02
200
320
04
200
520
06
200
720
08
200
920
10
201
120
12
201
320
14
201
520
16
201
720
18e
201
9etop locations regional centres
-8
-6
-4
-2
0
2
4
6
8
200
4
200
5
200
6
200
7
200
8
200
9
201
0
201
1
201
2
201
3
201
4
201
5
201
6
201
7
201
8e
201
9e
top locations regional centres
Demand for office space could fall when baby boomers retire
Will the future world of work involve working from home or working in the office?
White-collar work is increasing much faster than office space in all the top locations
Office vacancy rate down from 7 to 3 million sqm in the space of ten years

31Real Estate Market Germany2018 | 2019
Even the fact that rents started picking up again failed to lead to a stronger upturn. Consequently, the amount of vacant space continued to dwindle to 3 million sqm by the end of Q2 2018.
OFFICE WORK INCREASING MUCH FASTER THAN OFFICE SPACE IN ALL TOP LOCATIONS,… INCREASE FROM 2007 TO 2017 (%)
… LEADING TO A VERY RAPID FALL IN THE HIGH LEVEL OF VACANT SPACE OF A FEW YEARS AGO VACANCY RATE (%)
Source: BulwienGesa, Feri Source: BulwienGesa, DZ BANK Research forecasts
Frankfurt accounts for almost two thirds of the vacant space at 865,000 sqm along with Dusseldorf and Hamburg with around 550,000 sqm respectively. With vacancy rates of 4 per cent in Hamburg, 7.2 per cent in Dusseldorf and 8.5 per cent in Frankfurt, the supply of office space is still relatively good in those cities. Things are not looking quite so good for anyone looking for space to rent in Stuttgart which has 170,000 sqm of vacant office space, in Cologne or Munich which each have around 260,000 sqm or Berlin with 360,000 sqm. In the case of the latter, moreover, the space is distributed over the entire city and consists to a large extent of older and less attractive space. The vacancy rate is 2 per cent in Berlin, Munich and Stuttgart and up to just over 3 per cent in Cologne.
BERLIN, FRANKFURT AND MUNICH TOP THE RANKINGS FOR OFFICE SPACE TAKE-UP OFFICE SPACE TAKE-UP AS % OF OFFICE STOCK
DYNAMIC LABOUR MARKETS: IN SPITE OF STRONG POPULATION IN-FLUX, UNEMPLOYMENT DOWN IN ALL TOP LOCATIONS UNEMPLOYMENT RATE (%)
Source: BulwienGesa Source: BulwienGesa, DZ BANK Research forecasts
In spite of a shrunken supply of office space, office space take-up was very high in some cases. Take-up in Berlin in 2017 amounted to over 5 per cent of the existing office space; the figure in Frankfurt was even above 6 per cent. Berlin was the first German office market to reach a take-up of over 1 million sqm. It was followed by
0
5
10
15
20
25
30
35
Berlin Dussel-dorf
Frank-furt
Ham-burg
Cologne Muni ch Stutt-gart
Top-7
offi ce space offi ce workers
0
2
4
6
8
10
12
14
16
18
20
Berli n Dussel-dorf
Frank-furt
Ham-burg
Cologne Munich Stutt-gart
Top-7
2007
2018e
0
1
2
3
4
5
6
7
Berlin Dussel-dorf
Frank-furt
Ham-burg
Cologne Munich Stutt-gart
Top-7
2007
2017
4
6
8
10
12
14
16
18
20
1998 2002 2006 2010 2014 2018e
Berli n
Dusseldorf
Frankfurt
Hamburg
Cologne
Munich
Stuttgart
Hardly any vacant office space left in Berlin, Cologne, Munich and Stuttgart
Office take-up in Berlin exceeds 1 million sqm

32 Real Estate Market Germany2018 | 2019
Munich at 750,000 sqm ahead of Hamburg and Frankfurt with around 630,000 respectively. Take-up in the three other locations – Dusseldorf, Cologne and Stuttgart – was around 300,000 sqm in 2017.
OFFICE RENTS HAVE MOSTLY RISEN MODERATELY OFFICE PRIME RENTS IN EURO PER SQM
THE ONLY SHARP INCREASE IN PRIME RENTS HAS BEEN IN BERLIN INCREASE IN PRIME OFFICE RENTS FROM 2007 TO 2017 (%)
Source: BulwienGesa, DZ BANK Research forecast Source: BulwienGesa, DZ BANK Research forecast
High demand for space and tight supply have led to an increase in prime rents in the last ten years. However, bearing in mind a humming economy and strong job growth, the increase in rents has not been that high. On average, prime rents for the top seven locations rose by 21 per cent to around EUR 30 per sqm in the period from 2007 to 2017 admittedly quite a significant increase, but not a dramatic one. The increase in prime rents in Cologne, Frankfurt and Dusseldorf was in fact rather modest at 5, 10 and 11 per cent respectively. The trend in Hamburg and Munich was largely in line with the average. Only Berlin and Stuttgart outperformed with an increase of 30 and 40 per cent respectively. At the half-way stage in 2018, prime rents per sqm fluctuated within a range of EUR 21.50 in Cologne to EUR 39 in Frankfurt.
What next for the office market? If the current upward cycle remains intact in 2019 as well, in line with forecasts, which would mean a ten-year cycle, the situation in the office market is likely to remain largely unchanged this year and next, with lively demand, resulting from further job growth met by a shortage of office space. This means that further rising prime rents are likely. However, we do not expect any sharp increases in the market as a whole. The reason for this is that, given imponderables surrounding many international flashpoints, and the fact that the economic cycle is already at an advanced stage, companies are likely to think long and hard before entering into any expensive long-term tenancy agreements. The level of take-up is rather unlikely to hit new records in view of a growing shortage of available space.
10
15
20
25
30
35
40
45
50
199
3
199
5
199
7
199
9
200
1
200
3
200
5
200
7
200
9
201
1
201
3
201
5
201
7
201
9e
Ber li n
Dusseldorf
Frankfurt
Hamburg
Cologne
Munich
Stuttgart
Top-7
5
10 11
1821 22
30
40
Cologne Frank-furt
Dussel-dorf
Ham-burg
Top-7 Munich Stutt-gart
Berlin
Favourable market conditions and tight supply not leading to any spike in prime rents
Trend in the office market likely to continue to be influenced by shortage of available space

33Real Estate Market Germany2018 | 2019
Top locations by European comparison
Jones Lang Lasalle's Office Property Clock for Q2 2018 shows at a glance the pleasing trend in the European office market. At present, the majority of European office locations are in quadrants representing slower rent rises. A number of European office markets even show an accelerated rise in rents. In contrast, the right-hand scale of the Office Property Clock which represents falling or stagnating rents is virtually swept clean with just one location. This picture of the situation in the office markets is in line with the trend in the European economy which is still growing although it has lost some of its momentum. The fall in unemployment in many European countries is likely to continue to drive solid demand for office space.
In relation to the rest of the European office market, German prime rents are middling. Even Frankfurt as the most expensive office market in Germany fails to make it into the top ranked European office locations with prime rents of above EUR 50 per sqm. However, the German office market is not concentrated in just one central location, unlike in many European countries where the marked tends to be based in and around the capital.
PRIME OFFICE RENTS IN EUROPE – GERMAN OFFICE LOCATIONS MIDDLING EURO PER MONTH PER SQM
Source: BNP Real Estate As per Q4 2017
0
20
40
60
80
100
120
Like in the rest of Europe, office rents are rising, but no longer quite so fast
German prime office rents average in relation to the rest of Europe

34 Real Estate Market Germany2018 | 2019
Office space in Berlin
PRIME RENTS FOR OFFICE SPACE YOY % CHANGE VACANCY RATE (%)
Source: BulwienGesa, DZ BANK Research forecasts Source: Feri, DZ BANK Research forecasts
There has been a lasting economic improvement in Berlin. This is evident from a steady decline in unemployment which has fallen from over 19 per cent in 2005 to 8 per cent at present. Germany's capital is now a sought-after location for e-commerce businesses and fintechs, as well as for established companies. This has led to the creation of around 150,000 office jobs within the space of ten years. Meanwhile, the office stock has increased by less than 1 million sqm, whereas many times that amount would have been needed. Ongoing demand for space has led to a growing shortage of office space and to a fall in the vacancy rate to around 2 per cent. Prime rents have risen from EUR 20 in 2010 to EUR 32.50 per sqm most recently. A high level of market activity means that Berlin was the first top location to generate a take-up of over 1 million sqm. Zalando accounts for almost one tenth of this, showing just what fertile ground the capital is for digital business models. H1 2018 was close to the previous-year period with a take-up of almost 400,000 sqm, although the number of major com-pletions was more modest. As such, the signs are that 2018 will be another strong year for the Berlin office market, which is fairly amazing, bearing in mind the fact that there is virtually no vacant office space left. As in the other top locations, coworking providers were also well represented in Berlin among the top 10 biggest tenancy transactions. The supply shortage should ease slightly by the end of next year on the back of a fairly high amount of new space coming onto the market, and help slow down the momentum in the rise in prime rents, which should then reach around EUR 34 per sqm.
OFFICE SPACE IN BERLIN
2016 2017 2018e 2019e
Demand
GDP % yoy 4.1 4.0 3.2 3.4
Per capita GDP in EUR 32,072 32,976 33,794 34,744
Per capita GDP % yoy 568.8 576.5 584.7 592.8
No. of office workers % yoy 4.9 1.4 1.4 1.4
Supply
Total office space in sqm '000 18,932 18,949 19,173 19,534
Total office space % yoy 0.0 0.1 1.2 1.9
Vacancy rate % 3.0 2.2 1.8 2.0
Office rents
Prime/secondary location EUR/sqm 28.0 / 11.0 30.0 / 12.0 32.7 / 12.5 34.0 / 12.5
Prime/secondary location % yoy 16.7 / 15.8 7.1 / 9.1 9.0 / 4.2 4.0 / 0.0
Source: Feri, BulwienGesa, DZ BANK Research forecasts
0
5
10
15
20
25
30
35
2003 2005 2007 2009 2011 2013 2015 2017 2019eBerli n Top-7 Regional-12
0
2
4
6
8
10
12
2003 2005 2007 2009 2011 2013 2015 2017 2019eBerlin Top-7 Regional-12
Ongoing upturn means that Berlin is running out of office space
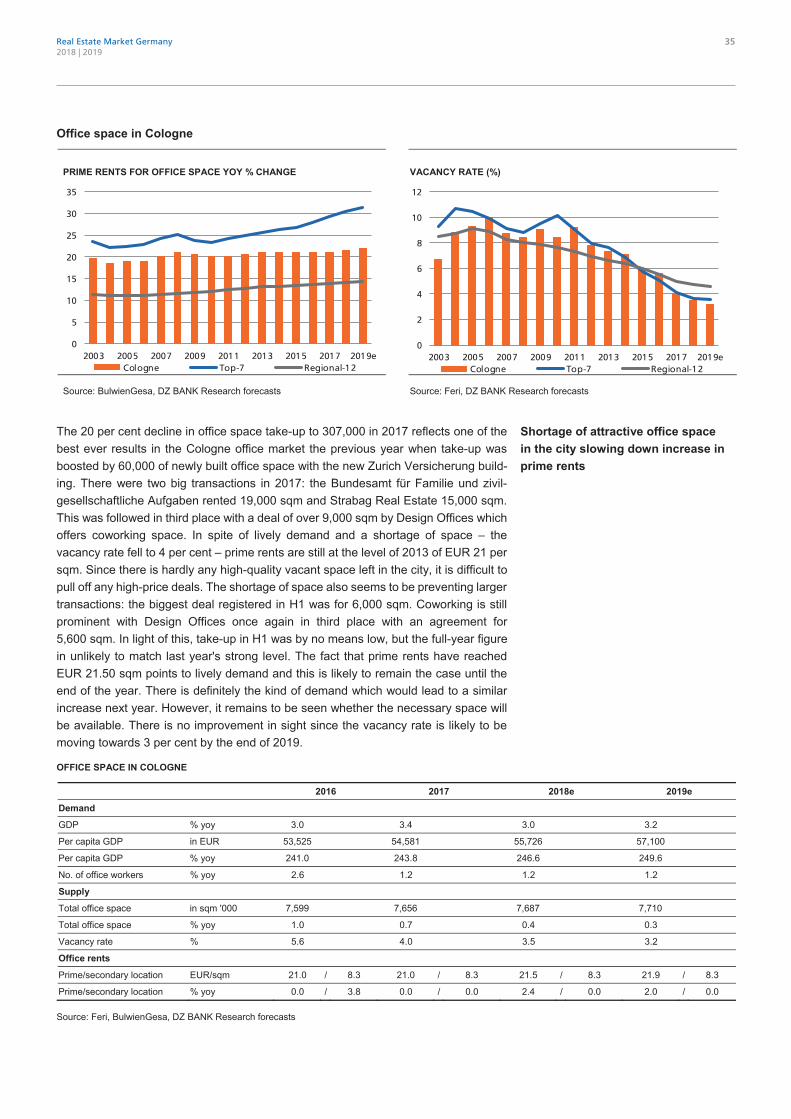
35Real Estate Market Germany2018 | 2019
Office space in Cologne
PRIME RENTS FOR OFFICE SPACE YOY % CHANGE VACANCY RATE (%)
Source: BulwienGesa, DZ BANK Research forecasts Source: Feri, DZ BANK Research forecasts
The 20 per cent decline in office space take-up to 307,000 in 2017 reflects one of the best ever results in the Cologne office market the previous year when take-up was boosted by 60,000 of newly built office space with the new Zurich Versicherung build-ing. There were two big transactions in 2017: the Bundesamt für Familie und zivil-gesellschaftliche Aufgaben rented 19,000 sqm and Strabag Real Estate 15,000 sqm. This was followed in third place with a deal of over 9,000 sqm by Design Offices which offers coworking space. In spite of lively demand and a shortage of space – the vacancy rate fell to 4 per cent – prime rents are still at the level of 2013 of EUR 21 per sqm. Since there is hardly any high-quality vacant space left in the city, it is difficult to pull off any high-price deals. The shortage of space also seems to be preventing larger transactions: the biggest deal registered in H1 was for 6,000 sqm. Coworking is still prominent with Design Offices once again in third place with an agreement for 5,600 sqm. In light of this, take-up in H1 was by no means low, but the full-year figure in unlikely to match last year's strong level. The fact that prime rents have reached EUR 21.50 sqm points to lively demand and this is likely to remain the case until the end of the year. There is definitely the kind of demand which would lead to a similar increase next year. However, it remains to be seen whether the necessary space will be available. There is no improvement in sight since the vacancy rate is likely to be moving towards 3 per cent by the end of 2019.
OFFICE SPACE IN COLOGNE
2016 2017 2018e 2019e
Demand
GDP % yoy 3.0 3.4 3.0 3.2
Per capita GDP in EUR 53,525 54,581 55,726 57,100
Per capita GDP % yoy 241.0 243.8 246.6 249.6
No. of office workers % yoy 2.6 1.2 1.2 1.2
Supply
Total office space in sqm '000 7,599 7,656 7,687 7,710
Total office space % yoy 1.0 0.7 0.4 0.3
Vacancy rate % 5.6 4.0 3.5 3.2
Office rents
Prime/secondary location EUR/sqm 21.0 / 8.3 21.0 / 8.3 21.5 / 8.3 21.9 / 8.3
Prime/secondary location % yoy 0.0 / 3.8 0.0 / 0.0 2.4 / 0.0 2.0 / 0.0
Source: Feri, BulwienGesa, DZ BANK Research forecasts
0
5
10
15
20
25
30
35
2003 2005 2007 2009 2011 2013 2015 2017 2019eCologne Top-7 Regional-12
0
2
4
6
8
10
12
2003 2005 2007 2009 2011 2013 2015 2017 2019eCologne Top-7 Regional-12
Shortage of attractive office space in the city slowing down increase in prime rents

36 Real Estate Market Germany2018 | 2019
Office space in Dusseldorf
PRIME RENTS FOR OFFICE SPACE YOY % CHANGE VACANCY RATE (%)
Source: BulwienGesa, DZ BANK Research forecasts Source: Feri, DZ BANK Research forecasts
Dusseldorf's economic strength and its function as the state capital has led to the development of a significant office market of 7.5 million sqm. Although it is the same size as the Cologne and Frankfurt markets, occupier activity is mostly higher as measured by office space take-up. In 2017, take-up of 325,000 sqm was also exactly in line with the ten-year average. Of the three biggest transactions of over 10,000 sqm, the financial sector accounted for two and the third was with the Berufsgenossenschaft Holz und Metall. In H1 2018, a 35,500 sqm transaction involving Deloitte helped bring office take-up to slightly over 170,000 sqm, which is largely in line with the level in the last three years. All the other transactions were for a maximum of 5,000 sqm. Two larger deals – of 4,100 sqm for Regus and 3,500 sqm for rent24 – were with providers of coworking space. After falling to just over 7 per cent in 2017, the vacancy rate has remained largely stable, but could rise slightly in H2 in view of space being freed up by the Uniper move. A further slight decline in the vacancy rate is likely in 2019 since, once again, there will not be all that much new space coming onto the market is (just under 90,000 sqm against 70,000 sqm in 2017 and 2018). Prime rents of EUR 24.50 per sqm have been stable since the beginning of 2017. In view of lively demand for office space, an increase of 2 per cent is possible by the end of the year. There could be a similar rise in 2019, if conditions in the German office market remain favourable.
OFFICE SPACE IN DUSSELDORF
2016 2017 2018e 2019e
Demand
GDP % yoy 3.5 3.9 3.6 3.7
Per capita GDP in EUR 72,491 74,963 77,373 80,015
Per capita GDP % yoy 206.7 209.2 211.8 214.6
No. of office workers % yoy 2.0 1.2 1.3 1.3
Supply
Total office space in sqm '000 7,554 7,560 7,600 7,650
Total office space % yoy 0.1 0.1 0.5 0.7
Vacancy rate % 8.3 7.1 7.3 7.1
Office rents
Prime/secondary location EUR/sqm 24.5 / 10.3 24.5 / 10.3 25.0 / 10.3 25.5 / 10.5
Prime/secondary location % yoy 2.1 / 3.0 0.0 / 0.0 2.0 / 0.0 2.0 / 1.9
Source: Feri, BulwienGesa, DZ BANK Research forecasts
0
5
10
15
20
25
30
35
2003 2005 2007 2009 2011 2013 2015 2017 2019eDusseldorf Top-7 Regional-12
0
2
4
6
8
10
12
2003 2005 2007 2009 2011 2013 2015 2017 2019eDusseldorf Top-7 Regional-12
Signs of a solid, but not record-breaking take-up In Dusseldorf

37Real Estate Market Germany2018 | 2019
Office space in Frankfurt
PRIME RENTS FOR OFFICE SPACE YOY % CHANGE VACANCY RATE (%)
Source: BulwienGesa, DZ BANK Research forecasts Source: Feri, DZ BANK Research forecasts
After two rather poor years, Germany's most expensive office market picked up considerable speed in 2016. Take-up rose by over 30 per cent to around 460,000 sqm. Last year, things looked even better with the second best figure since the dotcom boom at 624,000 sqm. This was helped by major transactions from Deutsche Bahn for 70,000 sqm and the Bundesbank for 44,000 sqm. Germany's central bank is taking over the FBC Tower near the central station as temporary accommodation during a complete refurbishment of its headquarters in Frankfurt-Ginnheim. The market has been bolstered among other things by favourable economic conditions in the Rhine-Main area, by Brexit-led moves to the city and the creation of coworking offers, includ-ing the take-up of 10,000 sqm by WeWork. These factors are likely to help the market to another good result in 2018. The biggest deal in H1 involved a 24,000 sqm take-up by FAZ, which is planning to move its headquarters to the Europaviertel in 2021. There have also been fairly substantial deals involving coworking space. On balance take-up in H1 is one of the best ever for a half-year at over 240,000 sqm. High demand has pushed up prime rents to EUR 39 per sqm and they could rise further by the end of the year. The vacancy rate is likely to fall from over 9 per cent last year towards the 8 per cent mark. Next year, we are confident prime rents will jump over the EUR 40 per sqm mark on the back of a further reduction in vacant space.
OFFICE SPACE IN FRANKFURT
2016 2017 2018e 2019e
Demand
GDP % yoy 3.2 3.5 3.2 3.3
Per capita GDP in EUR 83,823 85,861 87,961 90,268
Per capita GDP % yoy 289.0 292.1 295.4 298.8
No. of office workers % yoy 1.7 1.1 1.1 1.1
Supply
Total office space in sqm '000 10,250 10,164 10,200 10,310
Total office space % yoy -0.4 -0.8 0.4 1.1
Vacancy rate % 10.7 9.3 8.3 7.8
Office rents
Prime/secondary location EUR/sqm 35.5 / 9.5 38.5 / 9.6 39.5 / 9.6 40.5 / 9.7
Prime/secondary location % yoy 0.0 / 0.0 8.5 / 1.1 2.6 / 0.0 2.5 / 1.0
Source: Feri, BulwienGesa, DZ BANK Research forecasts
0
5
10
15
20
25
30
35
40
45
2003 2005 2007 2009 2011 2013 2015 2017 2019eFrankfurt Top-7 Regional-12
0
2
4
6
8
10
12
14
16
18
20
2003 2005 2007 2009 2011 2013 2015 2017 2019eFrankfurt Top-7 Regional-12
After a period of weakness, Frankfurt's office market is now surging

38 Real Estate Market Germany2018 | 2019
Office space in Hamburg
PRIME RENTS FOR OFFICE SPACE YOY % CHANGE VACANCY RATE (%)
Source: BulwienGesa, DZ BANK Research forecasts Source: Feri, DZ BANK Research forecasts
The uptrend in the Hamburg office market has continued. High demand in 2017 with take-up of 635,000 sqm beat the previous record from 2007. Two major transactions of over 34,000 sqm each involving Olympus and Gruner + Jahr contributed. The favourable trend has gone hand-in-hand with a moderate though steady rise in prime rents, which reached EUR 26.50 in 2017. The increase would probably have been even more had it not been for a relatively high level of new building, e.g. in HafenCity. Even so, available space has become tighter, leading to a more than 50 per cent reduction in the vacancy rate since 2010. The market is being buoyed by further favourable economic conditions and Hamburg's broadly diversified economy. Examples of this are an important logistics sector in Europe's third largest sea port and the aircraft industry which is benefiting from growing aviation business worldwide. The success story of Hamburg's office market is likely to continue in 2018, albeit a new record is not on the cards since there have been no major transactions of over 10,000 sqm so far – apart from one tenancy agreement with Iduna -Versicherung for 10,000 sqm. Bearing this fact in mind, take-up of over 240,000 sqm in H1 was impressive. Although prime rents are unchanged so far against 2017, they could increase to EUR 27 per sqm by year end. The vacancy rate is likely to fall to under 4 per cent. A further increase in prime rent and further reduction in the vacancy rate is likely in 2019, as economic conditions are expected to remain favourable.
OFFICE SPACE IN HAMBURG
2016 2017 2018e 2019e
Demand
GDP % yoy 2.6 4.2 3.2 3.4
Per capita GDP in EUR 56,043 57,803 59,249 60,909
Per capita GDP % yoy 426.2 431.7 437.4 443.2
No. of office workers % yoy 1.8 1.3 1.3 1.3
Supply
Total office space in sqm '000 13,718 13,706 13,795 13,900
Total office space % yoy 1.1 -0.1 0.6 0.8
Vacancy rate % 5.3 4.5 3.8 3.5
Office rents
Prime/secondary location EUR/sqm 26.0 / 10.8 26.5 / 11.0 27.0 / 11.5 27.5 / 11.5
Prime/secondary location % yoy 4.0 / 2.9 1.9 / 1.9 1.9 / 4.5 1.9 / 0.0
Source: Feri, BulwienGesa, DZ BANK Research forecasts
0
5
10
15
20
25
30
35
2003 2005 2007 2009 2011 2013 2015 2017 2019eHamburg Top-7 Regional-12
0
2
4
6
8
10
12
2003 2005 2007 2009 2011 2013 2015 2017 2019eHamburg Top-7 Regional-12
Upturn in Hamburg office market made 2017 a record year

39Real Estate Market Germany2018 | 2019
Office space in Munich
PRIME RENTS YOY % CHANGE VACANCY RATE (%)
Source: BulwienGesa, DZ BANK Research forecasts Source: Feri, DZ BANK Research forecasts
Munich's broadly diversified economy is flourishing it is home six DAX listed group headquarters leading to the creation of many new jobs, with which a muted level of new office building has long since failed to keep pace. This has led to a vacancy rate which is now below 2 per cent, as a result of which it is becoming increasingly difficult to rent larger amounts of office space from the existing stock. For this reason, it is hardly surprising that almost all big transactions involve new-build projects. Even so, given the shortage of space, it is astonishing, that office space take-up last year still reached a new record of 750,000 sqm. BMW alone accounted for one fifth of this, while the public sector rented almost 70,000 sqm of space. Even the emerging coworking sector is well represented. Prime rents climbed by almost 4 per cent to EUR 36 per sqm, and 2018 is following on seamlessly from last year with many large transactions: the first six months of the year saw the biggest office take-up so far at 380,000 sqm. Once again, the public sector was strongly represented. Coworking providers Design Offices and WeWork also took up large amounts of space. Prime rents rose by a further EUR 0.50 per sqm as available office space continued to dwindle. Prime rents are likely to rise by a good 3 per cent this year and next, leading to an estimated EUR 38 per sqm by the end of 2019. Although a relatively high level of new space coming onto the market will slow down the decline in the vacancy rate, this is unlikely to be enough to overcome the widespread shortage of office space in Munich.
OFFICE SPACE IN MUNICH
2016 2017 2018e 2019e
Demand
GDP % yoy 3.5 3.9 3.6 3.7
Per capita GDP in EUR 67,397 69,428 71,341 73,434
Per capita GDP % yoy 419.0 422.9 426.9 430.9
No. of office workers % yoy 3.2 0.9 0.9 0.9
Supply
Total office space in sqm '000 13,705 13,747 13,870 14,040
Total office space % yoy 0.0 0.3 0.9 1.2
Vacancy rate % 2.7 2.0 1.7 1.5
Office rents
Prime/secondary location EUR/sqm 34.7 / 13.5 36.0 / 14.5 37.0 / 14.5 38.0 / 14.5
Prime/secondary location % yoy 1.8 / 8.0 3.7 / 7.4 2.8 / 0.0 2.7 / 0.0
Source: Feri, BulwienGesa, DZ BANK Research forecasts
0
5
10
15
20
25
30
35
40
2003 2005 2007 2009 2011 2013 2015 2017 2019eMuni ch Top-7 Regional-12
0
2
4
6
8
10
12
2003 2005 2007 2009 2011 2013 2015 2017 2019eMunich Top-7 Regional-12
High-quality space practically only to be found in new-build projects, so prospective occupiers have to be resigned to a long wait

40 Real Estate Market Germany2018 | 2019
Office space in Stuttgart
PRIME RENTS FOR OFFICE SPACE YOY % CHANGE VACANCY RATE (%)
Source: BulwienGesa, DZ BANK Research forecasts Source: Feri, DZ BANK Research forecasts
High time too: last year, rents for prime office space in Stuttgart passed the EUR 20 per sqm mark for the first time – and by quite a long way! A rise to EUR 21.40 per sqm means an increase in the top one-digit percentage bracket, as in Berlin and Frankfurt. The sharp rise is likely to reflect the almost complete lack of available office space and a greater willingness by tenants to pay more. A reduction in the vacancy rate to just above 2 per cent – equating to 170,000 sqm across the entire office market – means a limited choice for prospective occupiers. This is especially true of larger, intercon-necting spaces. It is therefore hardly surprising that the two big transactions for over 10,000 sqm of office space – the tenants are Daimler and CMS Hasche Sigle – involve new developments. The sharp rise in rents in 2017 went hand-in-hand with take-up of 264,000 sqm high by Stuttgart standards. Given the demand, a higher figure would have been possible if there been a more ample supply. It is a similar story this year: without the 50,000 sqm Bosch new office building, office take-up up to June 2018 would only have been half last year's level at around 120,000 sqm, and therefore very low. The figure still includes a deal of around 11,000 sqm involving Landesbetriebe Vermögen und Bau. In spite of slightly more new office space coming onto the market by the end of 2019, there is no sign of any radical improvement in the shortage of space. The vacancy rate should remain stable while prime rents could increase up to EUR 22.50.
OFFICE SPACE IN STUTTGART
2016 2017 2018e 2019e
Demand
GDP % yoy 3.2 3.5 3.2 3.3
Per capita GDP in EUR 76,010 77,817 79,674 81,847
Per capita GDP % yoy 195.7 197.9 200.1 202.4
No. of office workers % yoy 0.9 1.1 1.1 1.2
Supply
Total office space in sqm '000 7,682 7,787 7,860 7,970
Total office space % yoy 1.0 1.4 0.9 1.4
Vacancy rate % 2.9 2.1 2.1 2.2
Office rents
Prime/secondary location EUR/sqm 19.7 / 8.8 21.4 / 9.1 22.0 / 9.1 22.5 / 9.1
Prime/secondary location % yoy 2.1 / 1.1 8.6 / 3.4 2.8 / 0.0 2.3 / 0.0
Source: Feri, BulwienGesa, DZ BANK Research forecasts
0
5
10
15
20
25
30
35
2003 2005 2007 2009 2011 2013 2015 2017 2019eStuttgart Top-7 Regional-12
0
2
4
6
8
10
12
2003 2005 2007 2009 2011 2013 2015 2017 2019eStuttgart Top-7 Regional-12
Tight supply limiting office space take-up and driving prime rents up sharply

41Real Estate Market Germany2018 | 2019
HOUSING MARKET
The housing market in top locations is still very tight. Even though new housing construction has now got into gear, there is still a shortage of accommodation, as illustrated by figures on population growth and completed housing units. In the past ten years, the population in the top seven locations has increased by between 7 per cent in Dusseldorf and 15 per cent in Frankfurt. Consequently, around 1 million more people leave in these cities than did back in 2007. This is equivalent to the city of Cologne which has one million inhabitants and 550,000 flats. In fact, however, only a total of 286,000 flats have been completed in the last ten years in the top locations. In addition, the gap between supply and demand in the housing market is not dwindling in any way; it just keeps on growing.
In 2017, 44,000 flats were built in the top locations double the number ten years previously. However, this is nowhere near the 80,000 unit increase in the number of households as a measure of housing needs. On this basis, an aggregated housing shortage of around 300,000 homes has been building up since 2007. However, it is very difficult to say whether this is the true scale of the demand or not. After all, those living in top locations have come to terms with the shortage of living space and compromised, otherwise there would be thousands of homeless people in these cities.
POPULATION GROWING IN ALL TOP LOCATIONS, BUT PACE VARIES POPULATION GROWTH FROM 2007 TO 2017
NUMBER OF NEW HOUSEHOLDS IN TOP LOCATIONS TWO TO THREE TIMES GREATER THAN NUMBER OF NEW HOMES BUILT SINCE 2007 INCREASE IN HOUSEHOLDS VS. NEW HOMES FROM 2007 TO 2017
Source: Feri Source: Feri, Statistische Ämter von Städten und Bundesländern
Not one of the top locations has managed to match the increase in households with a corresponding number of new homes with the exception of Dusseldorf where the gap is fairly small. The biggest gap by far is in Berlin where the number of households has increased almost three times as fast as new completions; in the other top locations, it has only increased twice as fast. However, housing construction in some of the cities under consideration, e.g. in Berlin and Hamburg, has picked up quite significantly.
The number of housing completions in Berlin has almost quadrupled to 16,000; in Hamburg, housing construction has doubled to 8,000 units. Is this sufficient to bridge the gap gradually? Unfortunately not since the big increases mainly reflect a low start-ing point. In reality, housing construction in relation to the number of inhabitants in Berlin and Hamburg is fairly average at around 4 units per 1,000 inhabitants. Frankfurt and Munich have shown that a much higher level of new housing construction is possible. Around 6 new housing units per 1,000 inhabitants have been built since 2017 in each of these two cities. This is especially remarkable in Munich since building land
362
39 99136
97
176
60
11
7
15
810
1410
Ber lin Dusseldorf Frank-furt
Ham-burg
Cologne Muni ch Stuttgart
in thousand persons in %
223
26
64
108
64
131
40
77
1429
56
30
61
18
Berlin Dussel-dorf
Frank-furt
Ham-burg
Cologne Muni ch Stutt-gart
growth of individual households i n thousa ndcumula ti ve dwel ling completions i n thousa nd
Even the increase in newly built housing stock is failing to keep pace with population growth
Number of households growing faster than supply of housing
Not one of the top locations has reached an adequate level of housing completions to meet the demand
New building in Berlin and Hamburg has picked up significantly from a low level

42 Real Estate Market Germany2018 | 2019
in Germany's cities with the highest population density is in very short supply. The fact that there is still a housing shortage in Frankfurt and Munich in spite of relatively abundant new building reflects particularly strong population growth.
HOUSING CONSTRUCTION UP NOTICEABLY IN BERLIN, HAMBURG AND MUNICH… HOUSING COMPLETIONS
… BUT MORE BUILT IN FRANKFURT AHEAD OF MUNICH IN RELATION TO POPULATION SIZE HOUSING COMPLETIONS PER 1,000 INHABITANTS
Source: Feri, Statistical offices of cities and federal states Source: Feri, Statistical offices of cities and federal states
In view of the shortage of homes, the press is calling almost daily for an increase in housing construction. Although this would definitely be possible from a technical point of view, it is likely to be hampered by the current process involved in designating building land, the planning permission process and also carrying out the construction work. If everything remains as it is at present, the current average of around 4 to 5 housing units per 1,000 inhabitants which is being completed across the seven top locations could remain the best that can be done.
At almost 60,000 units, the number of housing completions at the end of the 1990s was briefly well above the 44,000 units built last year. However, conditions back then were very different. One major difficulty now is the lack of manpower and the fact that the construction industry is now much more stretched. This is clear from the level of capacity utilisation calculated by the ifo Institute, which is now close to 80 per cent, i.e. 15 percentage points more than 20 years ago. At the time, there were still over 3 million people working in the labour-intensive construction industry. The figure is now down to only 2.5 million. In addition, the process of job growth is rather sluggish. People are no longer so keen to work on a building site, and consequently, other sectors do better when it comes to attracting skilled labour and apprentices.
The fact that the housing construction sector still has headroom is clear from the growing overhang of planning permissions in relation to building completions. The gap has risen to 20,000 housing units p.a. in the top locations. On an aggregated basis, there have been planning permissions for 360,000 homes since 2010, but only 247,000 units have been built. If all the homes had been built for which there was a planning permission, the current housing shortage would be considerably less.
However, other factors are also hampering housing construction. There is now much less space in cities. In 1997, the population in the top locations was around 8.8 million; today, the figure is close to ten million. Consequently, building land is becoming increasingly scarce and opposition from residents to housing plans is mounting. Local residents resent the fact that development generally makes the housing market more expensive in a specific location if attractive new housing is built because of the gentry
0
2000
4000
6000
8000
10000
12000
14000
16000
18000
200
7
200
8
200
9
201
0
201
1
201
2
201
3
201
4
201
5
201
6
201
7
Berli n
Dusseldorf
Frankfurt
Hamburg
Cologne
Munich
Stuttgart
0
1
2
3
4
5
6
7
Berli n Dussel-dorf
Frank-furt
Ham-burg
Cologne Munich Stutt-gart
2010 2011 2012 2013 2014 2015 2016 2017
Marked increase in house building over and above present level would be difficult
Construction firms building at close to capacity
Far more planning permissions than what is actually being built
Lack of building land and protests hampering housing construction

43Real Estate Market Germany2018 | 2019
fication effect. In addition, public services are mostly already under heavy pressure with full buses and trains and a lack of parking along with places in schools and childcare facilities.
COMPLETIONS IN TOP LOCATIONS LAGGING INCREASINGLY BEHIND NUMBER OF PLANNING PERMISSIONS
LACK OF SKILLED LABOUR IN CONSTRUCTION AND HIGH LEVEL OF UTILISATION OF THE CONSTRUCTION INDUSTRY
Source: Feri, Statistical offices of cities and federal states Source: ifo Institute, Federal Statistical Office
However, protests are not just directed at the in-filling of residential areas; they are also directed at new town planning. However, without the latter, it will be virtually im-possible to achieve the number of new homes needed. Plans to build a new town in the north-west of Frankfurt for example have led to a storm of protests by residents in neighbouring communities in the Hochtaunus district. However, the construction of urgently needed new housing is not being slowed down only by growing protests; the fact that too little land is being designated as building land, the long-winded planning permission process, speculation involving building plots and the technical status in the construction sector are all hampering housing construction. Industrial production methods and a digitalisation of building projects have so far failed to become established across the sector.
RENTS IN MUNICH IN A CLASS OF THEIR OWN AVERAGE INITIAL RENT IN EUR PER SQM
HOUSING COSTS 50% MORE EXPENSIVE IN SPACE OF TEN YEARS AVERAGE INITIAL RENT FROM 2007 TO 2017 (%)
Source: BulwienGesa, DZ BANK Research forecasts Source: BulwienGesa
On balance, it is unlikely that there will be any marked improvement in the already tight housing market in top locations in the near future. In any case, there are no reserves of vacant properties left which might offer a buffer. Consequently, rents are likely to continue to rise, even though they have already increased considerably. Average rents
-10. 000
0
10. 000
20. 000
30. 000
40. 000
50. 000
60. 000
70. 000
199
219
93
199
419
95
199
619
97
199
819
99
200
020
01
200
220
03
200
420
05
200
620
07
200
820
09
201
020
11
201
220
13
201
420
15
201
620
17
surplus bui lding comple tions bui lding perm its
2. 000
2. 250
2. 500
2. 750
3. 000
3. 250
3. 500
55
60
65
70
75
80
85
199
1
199
4
199
7
200
0
200
3
200
6
200
9
201
2
201
5
201
8
construction sector capaci ty uti li sation i n % , 4Q a ve rage (l hs)construction sector em ployee s in 000s, 4Q average ( rhs)
6
8
10
12
14
16
18
20
22
199
3
199
5
199
7
199
9
200
1
200
3
200
5
200
7
200
9
201
1
201
3
201
5
201
7
201
9e
Ber lin
Dusseldorf
Frankfurt
Hamburg
Cologne
Muni ch
Stuttgart
Top-7
32
4650 51
55 55
64 67
Cologne Hamburg Stutt-gart
Dussel-dorf
Frank-furt
Top-7 Munich Berlin
Many adjustments will have to be made to arrive at much higher new-build volume
Tight housing markets pushing up initial rents

44 Real Estate Market Germany2018 | 2019
for newly let or re-let properties ("initial rents") in the top locations rose by 55 per cent to EUR 12.50 per sqm from 2007 to 2017 with the exception of Cologne where the increase was much smaller at just over 30 per cent. Rents in Hamburg, Stuttgart, Dusseldorf and Frankfurt have risen by around 50 per cent. The strongest rises have been in Munich and Berlin at around 65 per cent. In Berlin, this also reflects a low starting point. What is more impressive is the performance in Munich since rents in the city were already well above average ten years ago. Munich residential rents have left rents in the other top locations well behind.
At the half-way stage in 2018, average initial rents per sqm ranged from not quite EUR 13 in Berlin, Dusseldorf and Cologne to almost EUR 19 in Munich. The figures in the other three top locations are EUR 14 in Hamburg and just under EUR 15 in Frankfurt and Stuttgart. The figure for the luxury end of new apartments is far higher. Prime properties can only be rented for under EUR 20 per sqm in Dusseldorf and Cologne. Prices in Berlin, Frankfurt, Hamburg and Stuttgart are just above EUR 20. Once again, Munich is in a class of its own in this respect, with rents for prime properties already nearing the EUR 30 per sqm mark.
MARKED SLOWDOWN IN INITIAL RENT RISE IN MOST TOP LOCATIONS YOY % CHANGE IN AVERAGE INITIAL RENT
GAP BETWEEN RENTS FOR NEW PROPERTY AND EXISTING HOUSING STOCK NOW WIDENING AT A SLOWER PACE YOY % CHANGE IN RENTS
Source: BulwienGesa Source: BulwienGesa
Whereas the aggregate increase in average initial rents were fairly close together over the last ten years, year-on-year rates of change have varied much more. In Dusseldorf, Frankfurt, Hamburg and Cologne, rents are currently only rising at a moderate rate of 2 to 3 per cent p.a. The rate is slightly higher in Berlin and Munich at over 4 per cent. However, at present, only rents in Stuttgart are rising faster with an annual increase just in two digits.
It is also clear that the rise in rents in the majority of top locations has recently eased off. This applies not only to initial rents, but also to rents for existing housing stock, for which rents still rose by over 8 per cent year-on-year in 2017. It is also interesting to note that rents in both market segments were almost neck-and-neck from 2010 to 2016, but that a gap opened up last year. In 2017, rents for existing properties rose much faster. One possible reason for this is the high level of rents charged for new-build homes and an increase in completions which has increased supply at the more expensive end of the rental market. In contrast, supply at the cheaper end of the market, consisting of existing housing stock, is still tight.
-2-10123456789
101112
201
3
201
4
201
5
201
6
201
7
201
8
Ber lin
Dusseldorf
Frankfurt
Hamburg
Cologne
Muni ch
Stuttgart
0
1
2
3
4
5
6
7
8
9
10
200
9
201
0
201
1
201
2
201
3
201
4
201
5
201
6
201
7
201
8
f ir st-tim e occupancy top-7 existing apartments top-7
Average initial rents ranging from under EUR 13 to almost EUR 19 per sqm
Rents rising fastest in Stuttgart
Recently, rents for existing properties have risen faster than initial rents

45Real Estate Market Germany2018 | 2019
The rise in rents in the housing market is likely to continue in all seven top locations. However, the momentum in the rental market for new builds as a whole is likely to ease. We anticipate an annual increase in rents this year and next of slightly over 3 per cent. There are two reasons for this: firstly, the fact that rents have already shot up, and secondly, the fact that there has been an increase in supply. Our forecasts for initial rents up to the end of 2019 are shown in the following table.
HOUSING FORECASTS FOR THE TOP SEVEN LOCATIONS UP TO 2019
Source: BA, BulwienGesa, Feri, DZ BANK Research forecasts
It is likely to be difficult for people living in many European cities to understand the frequent complaint by Germans that rents for flats are unaffordable. Figures which can be downloaded from the Numbeo comparison website show that renting in German cities is not that expensive. This is especially true if we take into account the strength of Germany's economy.
IN SPITE OF SHARP RISE IN RENTS, RENTS IN GERMANY STILL NOT ABOVE AVERAGE IN RELATION TO OTHER EUROPEAN COUNTRIES MONTHLY RENT, 4-ROOM FLAT, CITY LOCATION, IN EURO
Source: www.numbeo.com Data from 23 August 2018
Year Berlin CologneDüssel-
dorfFrank-
furtHam-burg M unich
Stutt-gart Top-7
D emandPopulation in thoausand 2017 3.591 1.085 614 739 1.817 1.465 633 9.9445-year change in % 2012-2017 7,3 6,5 4,0 8,2 5,4 6,6 6,6 6,6Private households in thousand 2017 2.109 596 334 413 1.052 848 343 5.695Unemployment rate in % Juli 2018 8,1 7,8 6,7 5,4 6,3 3,6 4,1 6,5Disposable income per capita in Euro 2017 20.195 22.328 26.292 22.799 25.012 28.995 25.784 23.530SupplyDwelling units in thousand 2017 1.957 545 338 386 946 791 309 5.272Completions p.a. (5-year average) 2011-2016 2,6 3,2 2,8 4,2 3,8 4,8 3,1 3,4per 1000 inhabitants 2016 4,4 2,0 4,6 6,6 4,4 5,7 3,4 4,4R entFirst-time occupancy, average rent 2017 12,5 12,5 12,8 15,1 13,9 18,5 14,5 14,0in Euro/sqm 2018e 12,9 13,0 13,2 15,5 14,3 19,2 15,4 14,4
2019e 13,2 13,5 13,5 16,0 14,7 20,0 16,0 14,92017 4,2 4,2 1,6 2,0 3,7 8,8 11,5 5,1
yoy change in % 2018e 2,8 4,0 3,1 2,6 2,9 3,8 6,2 3,42019e 2,7 3,8 2,3 3,2 2,8 4,2 3,9 3,2
5-year change in % 2012-2017 25,0 13,6 9,4 24,8 7,8 37,0 38,1 22,0First occupancy, maximum rent 2017 20,0 18,0 18,0 22,0 21,0 28,0 19,5 21,1in Euro/sqm 2018e 20,8 18,0 18,5 22,5 21,7 28,8 20,5 21,8
2019e 21,6 18,5 19,0 23,0 22,3 29,5 21,3 22,52017 17,6 12,5 9,1 4,8 4,0 12,0 8,3 11,3
yoy change in % 2018e 4,0 0,0 2,8 2,3 3,3 2,9 5,1 3,22019e 3,8 2,8 2,7 2,2 2,8 2,4 3,9 3,1
5-year change in % 2012-2017 30,7 24,1 18,4 23,6 13,5 47,4 39,3 28,5
0
500
1. 000
1. 500
2. 000
2. 500
3. 000
3. 500
Forecast up to 2019: more supply and high rents likely to dampen increase in rents
Rents in other European countries often much higher

46 Real Estate Market Germany2018 | 2019
FORECASTS AT A GLANCE
Structural data 2017 Inhabitants in '000 Inhabitants
2007-2017 (%) GDP EUR m Per capita GDP
EUR Disposable income per capita in EUR p.a. Unemployment rate
(%; July 2018)
Berlin 3,591 11.2 118 32,976 20,195 8.1
Cologne 1,085 9.9 59 54,581 22,328 7.8
Dusseldorf 614 6.8 46 74,963 26,292 6.7
Frankfurt 739 15.4 63 85,861 22,799 5.4
Hamburg 1,817 8.1 105 57,803 25,012 6.3
Munich 1,465 13.6 102 69,428 28,995 3.6
Stuttgart 633 10.4 49 77,817 25,784 4.1
Top locations 9,944 10.8 543 54,618 23,530 6.5
Retail space Retail space 2017
Prime rents EUR per sqm
Prime rents yoy % change
Retail sales yoy % change
in
1.000 sqm
2007-2017 in %
Per inhab-itant
in sqm 2017 2018e 2019e 2017 2018e 2019e 2017 2018e 2019e
Berlin 6,490 19.7 1.8 310 310 310 0.0 0.0 0.0 3.0 2.7 2.8
Cologne 1,409 5.8 1.3 255 255 255 2.0 0.0 0.0 3.3 3.1 3.3
Dusseldorf 1,255 37.9 2.0 280 280 280 1.8 0.0 0.0 3.4 3.3 3.5
Frankfurt 1,556 27.0 2.1 300 300 300 0.0 0.0 0.0 3.5 2.9 3.1
Hamburg 2,994 16.9 1.6 285 285 285 0.0 0.0 0.0 4.1 3.6 3.7
Munich 2,109 24.6 1.4 345 345 345 0.0 0.0 0.0 4.0 3.5 3.6
Stuttgart 1,069 14.7 1.7 250 250 250 0.0 0.0 0.0 3.1 2.8 2.9
Top locations 16,881 20.0 1.7 298.4 298.4 298.4 0.3 0.0 0.0 3.5 3.1 3.3
Office space Stock of office space 2017 Prime rents
EUR per sqm Prime rents yoy % change Vacancy rate
%
in
'000 sqm
Per capita
in sqm
Per office worker in sqm
2017 2018e 2019e 2017 2018e 2019e 2017 2018e 2019e
Berlin 18,949 5.3 32.9 30.0 32.7 34.0 7.1 9.0 4.0 2.2 1.8 2.0
Cologne 7,656 7.1 31.4 21.0 21.5 21.9 0.0 2.4 2.0 4.0 3.5 3.2
Dusseldorf 7,560 12.3 36.1 24.5 25.0 25.5 0.0 2.0 2.0 7.1 7.3 7.1
Frankfurt 10,164 13.8 34.8 38.5 39.5 40.5 8.5 2.6 2.5 9.3 8.3 7.8
Hamburg 13,706 7.5 31.7 26.5 27.0 27.5 1.9 1.9 1.9 4.5 3.8 3.5
Munich 13,747 9.4 32.5 36.0 37.0 38.0 3.7 2.8 2.7 2.0 1.7 1.5
Stuttgart 7,787 12.3 39.4 21.4 22.0 22.5 8.6 2.8 2.3 2.1 2.1 2.2
Top locations 79,569 8.0 33.5 29.3 30.5 31.3 4.7 4.1 2.8 4.1 3.7 3.5
Housing market Growth from 2012 to 2017 (%) Average initial rent
EUR per sqm Average initial rent yoy % change Initial rent top location
EUR per sqm
Inhabit-ants
House-holds
Housing stock 2017 2018e 2019e 2017 2018e 2019e 2017 2018e 2019e
Berlin 7.3 7.5 4.3 12.5 12.9 13.2 4.2 2.8 2.7 20.0 20.8 21.6
Cologne 6.5 7.5 0.2 12.5 13.0 13.5 4.2 4.0 3.8 18.0 18.0 18.5
Dusseldorf 4.0 4.5 1.0 12.8 13.2 13.5 1.6 3.1 2.3 18.0 18.5 19.0
Frankfurt 8.2 8.5 4.7 15.1 15.5 16.0 2.0 2.6 3.2 22.0 22.5 23.0
Hamburg 5.4 7.0 2.6 13.9 14.3 14.7 3.7 2.9 2.8 21.0 21.7 22.3
Munich 6.6 7.3 4.0 18.5 19.2 20.0 8.8 3.8 4.2 28.0 28.8 29.5
Stuttgart 6.6 6.9 1.6 14.5 15.4 16.0 11.5 6.2 3.9 19.5 20.5 21.3
Top locations 6.6 7.2 3.2 14.0 14.4 14.9 5.1 3.4 3.2 21.1 21.8 22.5
Source: Feri, BulwienGesa, DZ BANK Research forecasts
Note on the prime rents used for retail and office space: The prime rents adopted by BulwienGesa represent the mean of the three top three to five per cent of the rentals in the market, which means that the prime rents given are not the same as the absolute top prime rent. For this reason, the higher rent figures shown for indi-vidual locations, some of which are quoted in alternative market reports, are fundamentally not contradictory.

47Real Estate Market Germany2018 | 2019
I. Imprint
This study has been carried out by DZ BANK AG, Research and Economy Division, on behalf of and in cooperation with DZ HYP AG
Published by: DZ HYP AG
Hamburg Head OfficeRosenstrasse 2, 20095 Hamburg Tel. +49(0)40 3334-0
Münster Head OfficeSentmaringer Weg 1, 48151 Münster Tel. +49(0)251 4905-0
Homepage: www.dzhyp.deE-Mail: [email protected]
Represented by the Board of Managing Directors: Frank M. Mühlbauer (Chairman), Dr. Georg Reutter (Chairman),Manfred Salber, Dr. Carsten Düerkop
General Executive Managers: Jörg Hermes, Artur Merz, Markus Wirsen
Chairman of the Supervisory Board: Uwe Fröhlich
Head office of the company: Registered as public limited company in Hamburg, Commercial Register HRB 5604 and Münster, Commercial Register HRB 17424
Competent supervisory authorities: DZ HYP AG is subject to the supervision of the Federal Financial Supervisory Authority (60439) and the European Central Bank (ECB).
VAT ident. no.: DE 811141281
Protection schemes: DZ HYP AG is a member of the officially recognisedBVR Institutssicherung GmbH and the additional voluntary Sicherungs-einrichtung des Bundesverband der Deutschen Volksbanken und Raiffeisenbanken e.V. (Protection Scheme of the National Association of German Cooperative Banks): www.bvr-institutssicherung.dewww.bvr.de/SE
Responsible for the contents: Dr. Axel Roßdeutscher, Head of Communications, Marketing & Investor Relations
This document may only be reprinted, copied or used in any other way with the prior consent of DZ HYP AG

48 Real Estate Market Germany2018 | 2019
II. Mandatory Disclosures for Other Research Information and further Remarks
1. Responsible Company1.1 This Other Research Information has been prepared on behalf of and in cooperation with DZ HYP AG by DZ BANK AG Deutsche Zentral-Genossenschafts-
bank, Frankfurt am Main (DZ BANK) as an investment firm. Other Research Information is independent client information which does not contain any investment recommendations for specific issuers or specific
financial instruments. Such information makes no allowance for any individual investment criteria.1.2 The mandatory disclosures for Research Publications (Financial Analyses and Other Research Information) as well as further remarks, especially regarding
the Conflicts of Interest Policy of DZ BANK Research, used methods, procedures and statistics, can be read and downloaded free-of-charge underwww.dzbank.com/disclosures.
2. Competent Supervisory Authorities DZ BANK is supervised as a credit institution and as an investment firm by: – European Central Bank - www.ecb.europa.eu Sonnemannstrasse 20 in 60314 Frankfurt / Main and – Federal Financial Supervisory Authority (BaFin) - www.bafin.de Marie-Curie-Strasse 24 - 28 in 60349 Frankfurt / Main 3. Independent Analysts 3.1 The Research Publications (Financial Analyses and Other Research Information) of DZ BANK are independently prepared by its employed analysts or by
competent analysts commissioned in a given case on the basis of the binding Conflicts of Interest Policy.3.2 Each analyst involved in the preparation of the contents of this Other Research Publication confirms that – this Research Publication represents his independent specialist evaluation of the analysed object in compliance with the Conflicts of Interest Policy of
DZ BANK and – his compensation depends neither in full nor in part, neither directly nor indirectly, on an opinion expressed in this Research Publication. 4. Updates and Validity Periods for Other Research Information4.1 The frequency of updates of Other Investment Information depends in particular on the underlying macroeconomic conditions, current developments
on the relevant markets, the current development of the analyzed companies, measures undertaken by the issuers, the behavior of trading participants, the competent supervisory authorities and the competent central banks as well as a wide range of other parameters. The periods of time named below therefore merely provide a non-binding indication of when an updated investment recommendation may be expected.
4.2 No obligation exists to update an Other Investment Information. If an Other Research Information is updated, this update replaces the previous Other Research Information with immediate effect.
If no update is made, investment recommendations end / lapse on expiry of six months. This period begins on the day the Other Investment Information was published.
4.3 In a given case, updates of Other Research Information may also be temporarily suspended without prior announcement on account of compliance with supervisory regulations.
4.4 If no updates are to be made in the future because the analysis of an object / certain angle is to be discontinued, notification of this shall be made in the final publication or, if no final publication is made, the reasons for discontinuing the analysis shall be given in a separate notification.
5. Avoiding and Managing Conflicts of Interest5.1 DZ BANK Research has a binding Conflicts of Interest Policy which ensures that the relevant conflicts of interest of DZ BANK, the DZ BANK Group, the
analysts and employees of the Research and Economics Division and persons closely associated with them are avoided, or - if such interests are effectively unavoidable - are appropriately identified, managed, disclosed and monitored. Materiel aspects of this policy, which can be read and downloaded free-of-charge under www.dzbank.com/disclosures are summarized as follows.
5.2 DZ BANK organizes its Research and Economics Division as a confidentiality area and protects it against all other organizational units of DZ BANK and the DZ BANK Group by means of Chinese walls. The departments and teams of the Division that produce Financial Analyses are also protected by Chinese walls and by spatial separation, a closed doors and clean desk policy. Beyond the limits of these confidentiality areas, communication may only take place in both directions according to the need-to-know principle.
5.3 Other theoretically feasible, information-based personal conflicts of interest among employees of the Research and Economics Division and persons closely associated with them are avoided in particular by the measures explained in sub-paragraph 5.2 and the other measures described in the policy.
5.4 The remuneration of employees of the Research and Economics Division depends neither in whole nor in the variable part directly or materially on the earnings from investment banking, trade in financial instruments, other securities related services and / or trade in commodities, merchandise, currencies and / or on indices of DZ BANK or the companies of the DZ BANK Group.
5.5 DZ BANK and companies of the DZ BANK Group issue financial instruments for trading, hedging and other investment purposes which, as underlying instruments, may refer to financial instruments, commodities, merchandise, currencies, benchmarks, indices and / or other financial ratios also covered by DZ BANK Research. Respective conflicts of interest are primarily avoided in the Research and Economics Division by means of the aforementioned organizational measures.
6. Recipients and Sources of Information 6.1 Recipients Other Research Information of DZ BANK is directed at eligible counterparties as well as professional clients. They are therefore not suitable for dissemi-
nation to retail clients unless (i) an Other research Information has been explicitly labelled by DZ BANK as suitable for retail clients or (ii) is disseminated by an investment firm properly authorized in the European Economic Area (EEA) or Swiss to retail clients, who evidently have the necessary knowledge and sufficient experience in order to understand and evaluate the relevant risks of the relevant Other Research Information.
Other Research Information is authorized for dissemination by DZ BANK to the aforementioned recipients in in Member States of the European Eco-nomic Area and Switzerland.
It is neither allowed to provide Other Research Information to customers in the United States of America (USA) nor to conclude corresponding transac-tions with them.
The dissemination of Other Research Information in the Republic of Singapore is in any case restricted to DZ BANK AG Singapore Branch.

49Real Estate Market Germany2018 | 2019
6.2 Main Sources of Information For the preparation of its Research Publications, DZ BANK uses only information sources which it considers itself to be reliable. However, it is not feasible
to make own checks of all the facts and other information taken from these sources in every case. If in a specific case, however, DZ BANK has doubts over the reliability of a source or the correctness of facts and other information, it shall make specific reference to this in the Research Publication.
The main sources of information for Research Publications are: Information and data services (e.g. Reuters, Bloomberg, VWD, FactSet, Markit), licensed rating agencies (e.g. Standard & Poors, Moody‘s, Fitch, DBRS),
specialist publications of the sectors, the business press, the competent supervisory authorities, information of the issuers (e.g. annual reports, securities prospectuses, ad-hoc disclosures, press and analyst conferences and other publications) as well as its own specialist, micro and macro-economic research, examinations and evaluations.
III. Disclaimer
1. This document is directed at eligible counterparties and professional clients. Therefore, it is not suitable for retail clients unless (a) it has been explicitly labelled as appropriate for retail clients or (b) is properly disseminated by an investment firm authorized in the European Economic Area (EEA) or Switzerland to retail clients, who evidently have the necessary knowledge and sufficient experience in order to understand and evaluate the relevant risks of the relevant evaluation and / or recommendations.
It was prepared by DZ BANK AG Deutsche Zentral-Genossenschaftsbank, Frankfurt am Main, Germany (‚DZ BANK‘) and has been approved by DZ BANK only for dissemination to the aforementioned recipients in Member States of the EEA and Switzerland.
If this document is expressly marked as ‘Financial Analysis’ in sub-section 1.1 of the Mandatory Disclosures, its distribution to recipients is subject to the section International Restrictions of Use and these additional rules:
This document may only be brought into the Republic of Singapore by DZ BANK via the DZ BANK Singapore Branch, but not by other persons, and may only be disseminated there to ‚accredited investors‘ and / or ‚expert investors‘ ‘and used by them.
This document may only be brought into the United States of America (USA) by DZ BANK and via Auerbach Grayson, but not by other persons, and may only be disseminated there to ‚major U.S. institutional investors‘ and used by them, if it solely comprises equity research. DZ BANK is neither allowed to bring documents on debt instruments into the USA nor to conclude transactions in debt instruments.
If this document is expressly marked as ‘Other Research Information’ in sub-section 1.1 of the Mandatory Disclosures, its dissemination to recipients is subject to these additional rules:
It is neither allowed to provide Other Research Information to customers in the United States of America (USA) nor to conclude corresponding transac-tions with them.
The dissemination of Other Research Information in the Republic of Singapore is in any case restricted to DZ BANK AG Singapore Branch. In all before named countries, this document may only be distributed in accordance with the respective applicable laws and rules, and persons obtaining
possession of this document should inform themselves about and observe such laws and rules. 2. This document is being handed over solely for information purposes and may not be reproduced, redistributed to other persons or be otherwise pub-
lished in whole or in part. All copyrights and user rights to this document, also with regard to electronic and online media, remain with DZ BANK. Whilst DZ BANK may provide hyperlinks to web sites of companies mentioned in this document, the inclusion of a link does not imply that DZ BANK
endorses, recommends or guarantees any data on the linked page or accessible therefrom. DZ BANK accepts no responsibility whatsoever for any such links or data, nor for the consequences of its use.
3. This document is not to be construed as and does not constitute an offer, or an invitation to make an offer, to buy securities, other financial instruments
or other investment objects. Estimates, especially forecasts, fair value and / or price expectations made for the investment objects analyzed in this document may prove incorrect. This
may occur especially as a result of unpredictable risk factors. Such risk factors are in particular, but not exclusively: market volatility, sector volatility, measures undertaken by the issuer or owner, the general state
of the economy, the non-realisability of earnings and / or sales targets, the non-availability of complete and / or precise information and / or later occurrence of another event that could lastingly affect the underlying assumptions or other forecasts on which DZ BANK relies.
The estimates made should always be considered and evaluated in connection with all previously published relevant documents and developments relating to the investment object and to the relevant sectors and, in particular, capital and financial markets.
DZ BANK is under no obligation to update this document. Investors must inform themselves about the current development of business as well as of any changes in the business development of the companies.
During the validity period of an investment recommendation, DZ BANK is entitled to publish a further or other analysis based on other, factually- warranted or even missing criteria on the investment object.
4. DZ BANK has obtained the information on which this document is based from sources believed to be essentially reliable, but has not verified all of such information. Consequently, DZ BANK does not make or provide any representations or warranties regarding the preciseness, completeness or accuracy of the information or the opinions contained in this document.
Neither DZ BANK nor its affiliated companies accept any liability for disadvantages or losses incurred as a result of the distribution and / or use of this document and / or which are connected with the use of this document.
5. DZ BANK and its affiliated companies are entitled to maintain investment banking and business relationships with the company or companies that are
the subject of the analysis contained in this document. Within the limits of applicable supervisory law, DZ BANK’s research analysts also provide informa-tion regarding securities-related services and ancillary securities-related services.
Investors should assume that (a) DZ BANK and its affiliated companies are or will be entitled to engage in investment banking operations, security operations or other business transactions from or with the companies that are the subject of the analysis contained in this document, and that (b) analysts involved in the preparation of this document can generally be indirectly involved in the conclusion of such business transactions to the extent permitted by supervisory law.
DZ BANK and its affiliated companies and their employees may have positions in securities of the analyzed companies or investment objects or effect transactions with these securities or investment objects.

50 Real Estate Market Germany2018 | 2019
6. The information and recommendations of DZ BANK contained in this document do not constitute any individual investment advice and, depending on the specific investment targets, the investment horizon or the individual financial situation, may therefore be unsuitable or only partially suitable for certain investors. In preparing this document DZ BANK has not and does not act in the capacity of an investment advisor to, or asset manager for, any person.
The recommendations and opinions contained in this document constitute the best judgment of DZ BANK’s research analysts at the date and time of preparation of this document and are subject to change without notice as a result of future events or developments. This document constitutes an inde-pendent appraisal of the relevant issuer or investment objects by DZ BANK; all evaluations, opinions or explanations contained herein are those of the author of this document and do not necessarily correspond with those of the issuer or third parties.
Any decision to effect an investment in securities, other financial instruments, commodities, merchandise or other investment objects should not be made on the basis of this document, but on the basis of independent investment analyses and methods as well as other analyses, including but not limited to information memoranda, sales or other prospectuses. This document can be no replacement for individual investment advice.
7. By using this document, in any form or manner whatsoever, or referring to it in your considerations and / or decisions, you accept the restrictions, speci-
fications and regulations contained in this document as being exclusively and legally binding for you.
Additional Information of Markit Indices Limited Neither Markit, its affiliates or any third party data provider makes any warranty, express or implied, as to the accuracy, completeness or timeliness of
the data contained herewith nor as to the results to be obtained by recipients of the data. Neither Markit, its affiliates nor any data provider shall in any way be liable to any recipient of the data for any inaccuracies, errors or omissions in the Markit data, regardless of cause, or for any damages (whether direct or indirect) resulting therefrom.
Markit has no obligation to update, modify or amend the data or to otherwise notify a recipient thereof in the event that any matter stated herein changes or subsequently becomes inaccurate.
Without limiting the foregoing, Markit, its affiliates, or any third party data provider shall have no liability whatsoever to you, whether in contract (including under an indemnity), in tort (including negligence), under a warranty, under statute or otherwise, in respect of any loss or damage suffered by you as a result of or in connection with any opinions, recommendations, forecasts, judgments, or any other conclusions, or any course of action determined, by you or any third party, whether or not based on the content, information or materials contained herein.
Copyright © 2016, Markit Indices Limited.
51Real Estate Market Germany2018 | 2019
DZ HYP OFFICES
Hamburg Head Office Münster Head Office
Rosenstrasse 2 Sentmaringer Weg 120095 Hamburg, Germany 48151 Münster, Germany PO Box 10 14 46 Mailing address:20009 Hamburg, Germany 48136 Münster, Germany Phone +49 40 3334-0 Phone +49 251 4905-0
Regional Centres
Berlin Regional Centre Berlin Regional CentrePariser Platz 3 Friedrichstrasse 6010117 Berlin, Germany 10117 Berlin, GermanyPhone +49 30 31993-5101 Phone +49 30 220021-0
Dusseldorf Regional Centre Dusseldorf Regional CentreSteinstrasse 13 Ludwig-Erhard-Allee 2040212 Dusseldorf, Germany 40227 Dusseldorf, GermanyPhone +49 211 220499-10 Phone +49 211 210942-0
Frankfurt Regional Centre CITY-HAUS I, Platz der Republik 6 60325 Frankfurt am Main, Germany Phone +49 69 750676-21
Hamburg Regional Centre Hamburg Regional CentreRosenstrasse 2 Valentinskamp 2420095 Hamburg, Germany 20354 Hamburg, GermanyPhone +49 40 3334-3778 Phone +49 40 5544869-0
Munich Regional Centre Munich Regional CentreTürkenstrasse 16 Brienner Strasse 1480333 Munich, Germany 80333 Munich, GermanyPhone +49 89 512676-10 Phone +49 89 4523207-0
Stuttgart Regional CentreHeilbronner Strasse 41 70191 Stuttgart, Germany Phone +49 711 120938-0
Institutional Clients Rosenstrasse 220095 Hamburg, GermanyPhone +49 40 3334-2159
Regional Offices
Hanover Regional OfficeBerliner Allee 530175 Hanover, GermanyPhone +49 511 86643808
Heidelberg Regional OfficeKonrad-Adenauer-Strasse 8769207 Sandhausen, GermanyPhone +49 6224 145151
Kassel Regional OfficeRudolf-Schwander-Strasse 134117 Kassel, GermanyPhone +49 561 602935-23
Leipzig Regional OfficeSchillerstrasse 304109 Leipzig, GermanyPhone +49 341 962822-92
Mannheim Regional OfficeAugustaanlage 6168165 Mannheim, GermanyPhone +49 621 728727-20
Münster Regional OfficeSentmaringer Weg 148151 Münster, GermanyPhone +49 251 4905-7314
Nuremberg Regional OfficeAm Tullnaupark 490402 Nuremberg, GermanyPhone +49 911 94009816
Schwäbisch Gmünd Regional OfficeMaiglöckchenweg 1273527 Schwäbisch Gmünd, GermanyPhone +49 7171 8077230


As
at =
Oct
ob
er 2
018
DZ HYP AG
Rosenstrasse 2 20095 Hamburg Germany Phone +49 40 3334-0
dzhyp.de
Sentmaringer Weg 148151 MünsterGermanyPhone +49 251 4905-0