Embed Size (px)
Citation preview
Efficiency, Optimizationand Predictive Reliability
WHITE PAPER | OCTOBER 2014CA TECHNOLOGIES CAPACITY MANAGEMENT RESOURCE SCORING EXPLAINED

2 | CA TECHNOLOGIES CAPACITY MANAGEMENT RESOURCE SCORING EXPLAINED
Executive Summary 3
Section 1: 4Resource scores explained
Section 2: 5Resource score to the rescue
Section 3: 10Resource scores at work
Section 4: 13Conclusions
Section 5: 14References
Table of Contents
ca.com
3 | CA TECHNOLOGIES CAPACITY MANAGEMENT RESOURCE SCORING EXPLAINED
ChallengeIT organizations are increasingly being called upon to cost-effectively deliver reliable support for the entire catalog of business services, or risk outsourcing to a managed service provider. Previously, capacity planners and IT architects would use historical trends to predict capacity requirements and simply over-provision to account for any peaks caused by seasonality, error, or extraneous influences like mergers & acquisitions. Over-provisioning, combined with poor lifecycle management of new resources provisioned in the data center, has led to capacity utilization and inefficiency issues. While historical data is great for understanding past issues and current state of the environment, the performance of servers, hosts and clusters is not linear; at some level of saturation, the performance of that infrastructure will quickly start to degrade. The impact is that business services dependent on that infrastructure suffer, and users experience longer response times, unavailable applications and unacceptable performance. Lack of predictability and uncertainty has caused many IT organizations to suffer “VM Stall,” meaning they have been unable to advance to a strategic deployment of virtualization and achieve expected levels of consolidation. IT must understand the impact of change on the infrastructure to ensure performance. Without that insight IT may be unwilling to take that risk.
OpportunityTo proactively plan for capacity in order to support mission critical business services, IT must assess historical data captured by their current investment of infrastructure performance tools and couple it with predictive analytics. With a focus on the actual “capacity utilization” of business services, IT can more efficiently manage those services today and what they will be as the workloads change, the infrastructure virtualizes, or other changes are introduced. Given this predictive capability, IT could effectively foresee capacity issues in the future to assess alternatives and provision the right infrastructure when needed.
BenefitsCA Technologies patented predictive capacity management enables the combination of real-world performance data and financial information with modeling, simulation and automation designed to deliver highly accurate, dependable projections of future performance and service levels. The business insights derived from this unique set of inputs give you information to help effectively plan capital budgets, improve spend on innovation, avoid costly downtime, and better manage risk across your portfolio of IT applications.
Executive Summary
ca.com
4 | CA TECHNOLOGIES CAPACITY MANAGEMENT RESOURCE SCORING EXPLAINED
Section 1
Resource scores explainedHeadroomLet’s begin this discussion with a simple hypothetical example: a single-core, hyper-threaded processor (Cepeda, 2012-Note this technology goes back as far as the Intel Pentium 4 HT processor, circa 2003.) The additional throughput is about 20% higher for this processor when hyper-threading is engaged. So, if you achieved a workload throughput of “one” without hyper-threading you could achieve a throughput of 1.2 with hyper-threading enabled and more than one thread of execution. Twenty percent is a good thing! (Wouldn’t you like to have 20% more money?)
The problem arises when we start measuring (and reporting) utilization of the processor. If hyper-threading is enabled, the operating system (and a monitoring agent) “sees” two CPUs. If only one CPU is running you get a throughput equivalent to 1.0 but monitoring sees one CPU idle and reports 50% utilization. But the “capacity” of the full processor is 1.2 and you are currently achieving 1.0; which means you’re actually running at 83% of the processor capacity! (That leaves only 17%—not 50% of headroom).
But, the problem doesn’t stop at headroom. Assume you are running a single unit of work on this processor—at an equivalent throughput of 1.0—and observed a response time of one second. You now start running two units of work—at an equivalent throughput of 1.2—but the throughput of each of the threads of execution drops from 1.0 to 0.6 (each one achieves half of the 1.2 total throughput). Because each of your units of work is now progressing 40% slower, the response time becomes 1.667 seconds which is equivalent to an almost 70% increase in response time!
Now jump forward a few generations of hardware evolution to 2012. AMD® has the Opteron 6300 series of processors (AMD, 2012) with up to 16 cores on a single chip. Intel® has the Xeon E5-2600 (Intel, 2012) and E5-4600 (Intel, Intel Xeon processor E5-4600 Product Family, 2012) series of hyper-threaded processors with 8 cores and a total of 16 threads on a single chip. IBM® has the POWER7 series of processors with up to 8 cores and a total of 32 threads on a single chip (Tendler, 2009)—and up to 32 chips in a single system. Oracle® has the SPARC T4 series of processors (Oracle, 2012) with 8 cores and a total of 64 threads on a single chip and they all scale differently.
So, how much headroom do you really have and how do you find out?
Performance portabilityLet’s take another example: You have a business application that’s running on seven, aging 8-core servers that are due for replacement. These servers are four years old and are running at 60 – 70% CPU utilization. You would like to virtualize the application and move it onto a fairly new cluster of six hosts with 16 cores, each which is currently at about 60% CPU utilization. Can you add this business application to that cluster and still have 25% headroom to accommodate one host fail-over and workload spikes in the cluster? How do you determine that?
Obviously, you need more information about the old and new servers. The old servers have Intel processors but the new cluster has AMD processors. We can assume the new cores are more powerful than the old ones, but are they really, or are there just more of them? If they are more powerful then how do we determine by how much?
How do you determine the compute power an application needs when evaluating different hosting environments?
ca.com
5 | CA TECHNOLOGIES CAPACITY MANAGEMENT RESOURCE SCORING EXPLAINED ca.com
Section 2
Resource score to the rescueWhat is resource score?CA’s patented resource score (Rx) is actually a collection (or “vector” if you prefer) of scores that characterize the capacity of a system to provide resources to users of the system and of the consumption of those resources by the users of the system. Resource score vector currently includes CPU, memory, network and IO characterizations. Memory, network and IO resource scores are typically intuitive to performance professionals.
CPU Resource Score for a system is a computed value of the capacity of that system to deliver CPU computing power to applications. It is computed such that it is hardware vendor independent and architecture independent and determines the CPU computing power that can be delivered to applications. The computation takes into account the unique scalability characteristics of the host hardware, operating system and virtualization environment. This enables reporting of aggregate compute capacity across individual or groups of hosts, VMs or datacenters in a clear, consistent manner.
The resource score for CPU, Memory Network and Storage IO enable comparison of workloads across different hardware architectures, operating systems and hypervisors. This approach to scoring results is a significant advancement in understanding efficiency of an enterprise IT infrastructure.
How is CPU Resource Score computed?There are two basic parts contributing to CPU Resource Score computation:
1. Component Model Library (CML) of computers, operating systems and virtualization technologies
2. A common base of CPU performance—SPECint2006
The active (currently distributed) CML contains performance scalability models of over 5000 computer systems developed using CA Technologies patented analysis process and representation. As of today (early 2013) the CML also contains scalability models of 71 operating systems, 21 virtualization technologies, numerous public cloud vendors’ offerings and 5 converged architectures. CA Capacity Management provides these models predefined and ready for use in all our CA Capacity Management products, with no additional benchmarking being required by a customer. Updates are typically rolled out with every release cycle and upon request for customers under maintenance. In addition, CA Technologies has a “legacy” library of about 1000 older, mostly obsolete (but some still in use) computers and a half-dozen operating systems—which may also be made available upon request.
Results from the Standard Performance Evaluation Corporation (SPEC) CPU benchmark (Standard Performance Evaluation Corporation, 2011) is the most widely reported vendor-independent, third party measure of processor performance. After many years of evaluation by our customers, it became clear that the integer benchmark better corresponded to the observed performance of their critical applications than either the floating point benchmark or an average of the two. SPEC CPU2006 is the most recent version of the SPEC CPU benchmark and is used in the calculation to determine a portable, vendor-independent resource score of CPU performance.

6 | CA TECHNOLOGIES CAPACITY MANAGEMENT RESOURCE SCORING EXPLAINED
How is resource score used?CPU Resource Score is used in two critical areas: to express the CPU “capacity” of a system and to report the CPU “consumption” of one or more entities (workloads, applications, VMs, etc.) running on that system. The strength and power of the CPU Resource Score is that we have a “standard” measure of capacity and consumption that enables aggregations that can express consistent measures of capacity and consumption across heterogeneous groups of things like VMs, hosts, clusters, datacenters, applications, IT services and/or business services. And, because we have both capacity and consumption expressed in terms of Resource Score we can now, realistically, express “capacity utilization” of VMs, hosts, clusters, datacenters and services.
How is resource score capacity determined?Basic CPU capacity information (expressed in terms of SPECint2006) about many systems within a specific operating system’s environment is publicly available from SPEC. However, a customer’s system configuration may be significantly different from that of any measurements reported to SPEC (e.g., different number of processors installed, different amount of memory, virtualized with VMware instead of using SUSE Linux, etc.). CA computes the “available” resource score capacity of a system from:
• The basic performance information from SPEC
• The customer’s configuration information of their system
• CA Technologies model of hardware scalability for that specific system at varying configuration definitions
• CA Technologies model of the scalability (i.e., overhead) of the operating system or virtualization technology (virtual machine monitor, or VMM) in use on the system.
As work (processes and tasks or VMs in the case of a virtualized host) is deployed onto the system the remaining available capacity (or “headroom”) of a system declines—and not just by the amount of added work. Operating system, and particularly VMM, overhead increases as more work is added to the system, further decreasing the headroom. Also note that the OS within a VM contributes to resource consumption by the VM—which may change if a VM is moved to a different host or cluster. (E.g., faster CPUs typically result in reduced OS overhead.) All of these factors are taken into account as CA Capacity Management computes the resource score of each system.
CA Technologies recognizes that not all systems are benchmarked and reported to SPEC. CA is capable of creating highly accurate models of most other systems within a few days of being requested via CA Support.
ca.com
Some other popular measures of capacityFollowing is a brief summary of the strengths and weaknesses of three popular measures of capacity: MHz, system-level benchmarks and SPECint2006, per se.
Megahertz (MHz)Twenty-five or thirty years ago, when RISC (Reduced Instruction Set Computer) systems were first introduced, MHz was a reasonable way to estimate performance because generally one instruction was executed during each clock cycle which translated directly into millions of instructions per second (MIPS)—the standard metric of performance at the time. Processor architectures have evolved considerably since that time with deep execution pipelines, multiple functional units, branch prediction and out-of-order execution. Multiple cores per chip and multiple threads per core have further complicated the picture.
A popular method of assessing/comparing performance of two systems (or determining the CPU consumption of an application or VM) is to multiply the number of cores times the clock rate (MHz). This is a simple, easy to implement, easy to understand approach to express CPU capacity of systems. Its distinct weakness is that it can be significantly misleading in heterogeneous (e.g., multi-architecture) environments. Following is a spreadsheet compiled from the spec.org website that outlines how performance has evolved with clock rates since the introduction of the SPEC2006 CPU benchmarks for two popular processor vendors. (Pay particular attention to the last column: SPECint2006 /Core /GHz).
7 | CA TECHNOLOGIES CAPACITY MANAGEMENT RESOURCE SCORING EXPLAINED ca.com
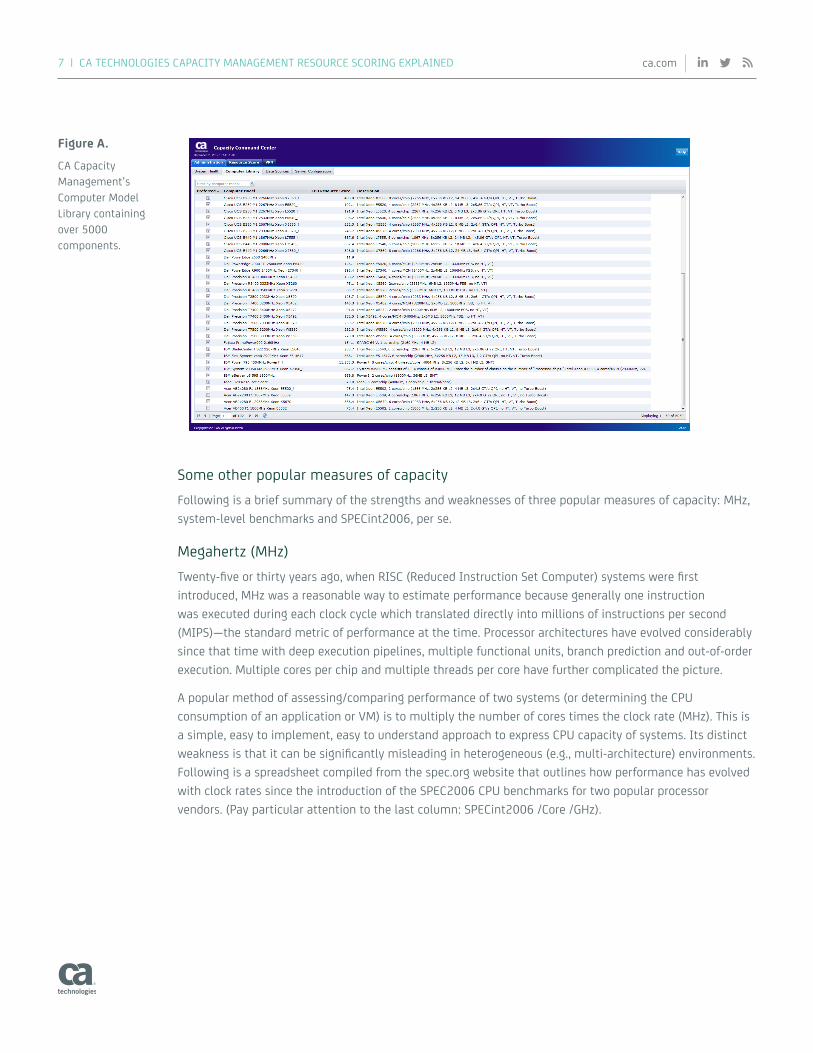
Figure A.
CA Capacity Management’s Computer Model Library containing over 5000 components.
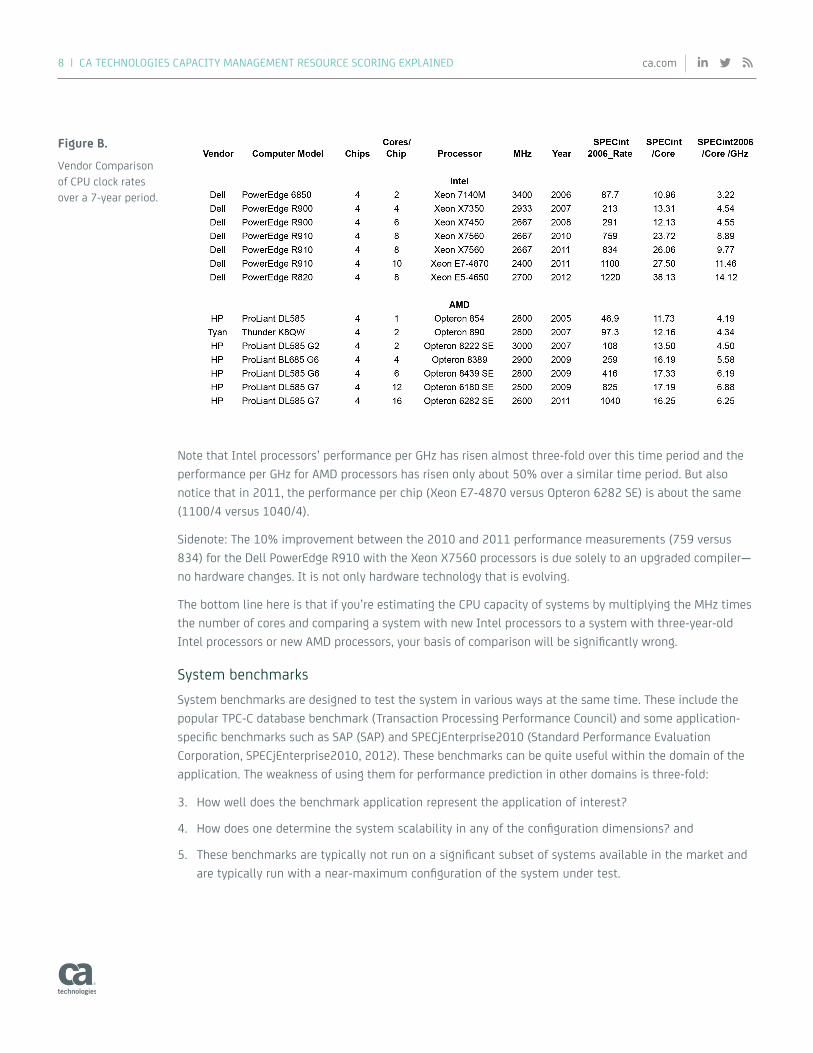
Note that Intel processors’ performance per GHz has risen almost three-fold over this time period and the performance per GHz for AMD processors has risen only about 50% over a similar time period. But also notice that in 2011, the performance per chip (Xeon E7-4870 versus Opteron 6282 SE) is about the same (1100/4 versus 1040/4).
Sidenote: The 10% improvement between the 2010 and 2011 performance measurements (759 versus 834) for the Dell PowerEdge R910 with the Xeon X7560 processors is due solely to an upgraded compiler—no hardware changes. It is not only hardware technology that is evolving.
The bottom line here is that if you’re estimating the CPU capacity of systems by multiplying the MHz times the number of cores and comparing a system with new Intel processors to a system with three-year-old Intel processors or new AMD processors, your basis of comparison will be significantly wrong.
System benchmarksSystem benchmarks are designed to test the system in various ways at the same time. These include the popular TPC-C database benchmark (Transaction Processing Performance Council) and some application-specific benchmarks such as SAP (SAP) and SPECjEnterprise2010 (Standard Performance Evaluation Corporation, SPECjEnterprise2010, 2012). These benchmarks can be quite useful within the domain of the application. The weakness of using them for performance prediction in other domains is three-fold:
3. How well does the benchmark application represent the application of interest?
4. How does one determine the system scalability in any of the configuration dimensions? and
5. These benchmarks are typically not run on a significant subset of systems available in the market and are typically run with a near-maximum configuration of the system under test.
8 | CA TECHNOLOGIES CAPACITY MANAGEMENT RESOURCE SCORING EXPLAINED ca.com
Figure B.
Vendor Comparison of CPU clock rates over a 7-year period.
9 | CA TECHNOLOGIES CAPACITY MANAGEMENT RESOURCE SCORING EXPLAINED ca.com
But a TPC-C test is memory, IO and processor intensive. How can a system be expected to perform (relatively) if it has the same number of processors but half the memory and slower (or faster) disks than the system that was reported to TPC? Does it get half the performance of the reported system? Two-thirds? The most that can be said with any confidence, based on the benchmark reports is that the peak possible performance of the system is greater (or less) than system B, with those prescribed configurations. How the performance of either of these systems scale with alternate configurations is virtually impossible to predict—based on the reported performance data alone. It is similarly difficult to use the results of measured systems to infer the performance of other, non-benchmarked systems—significantly limiting the needed “portability” of the approach to other systems and configurations.
SPECint2006 (SPECint2006_Rate)The raw, reported SPECint2006 performance can be used directly as a characterization of system performance but suffers from the same issues as the System Benchmarks. In particular, how does the system scale if that configuration does not match the configuration of the reported system? Many modern systems scale very well. That is, if you have half the number of installed CPUs as the reported system you will probably get about half of the reported CPU performance—typically within 10%. That seems like a reasonable tolerance, but a 10% error aggregated over 50 or 100 servers in a datacenter is the equivalent of several servers – an error that can lead to over- or under-procurement.
How is resource score consumption determined?CPU consumption is initially reported by performance monitoring agents in terms of some type of utilization. If we return to the first example of a single-core, hyper threaded processor, when one thread of that processor is in use, a monitoring agent might report that consumption as 50% “utilization.” At CA Technologies, that is referred to as “traditional utilization.” Our Capacity Management products use hardware configuration information about the reported system, scalability factors from the CML model for that system and statistical analysis to convert “traditional” utilization data into “capacity” utilization information.
Different monitoring agents in different environments may report other types of utilization. Some monitoring agents report “PURR” utilization (Saravanan, 2010) from IBM Power systems. Some monitoring agents report “MHz consumption” or “MHz utilization” from x86 systems. In each of these cases CA Technologies data adapters gather reported data from the monitoring systems and store it in a database along with information about the monitoring system so that the data can be interpreted appropriately and, using computer models from the CML for the source systems, converted into Resource Score consumption.
The use of the CML scalability factors for each computer system is vital to the correct calculation of CPU consumption—particularly for those system that are reported by the monitoring systems with “traditional” utilization. The algorithm that converts “traditional” utilization to “capacity” utilization takes into account the configuration of the reported system, the CML scalability factors for that system and the knowledge that CPU dispatch algorithms will prefer to dispatch work to separate cores (utilizing only one thread per core) when possible.
10 | CA TECHNOLOGIES CAPACITY MANAGEMENT RESOURCE SCORING EXPLAINED ca.com
Section 3:
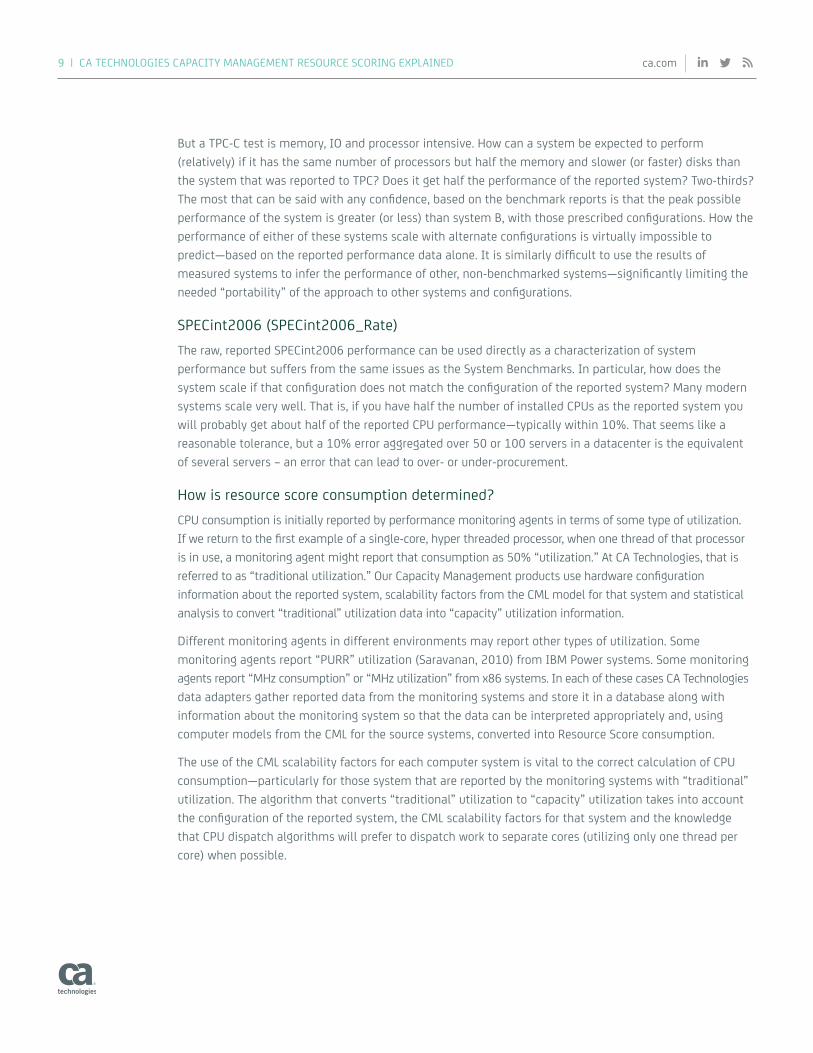
Resource scores at workCapacity Command Center (CCC) Rx ReportingResource Scores take the angst out of interpreting hourly, daily and monthly usage reports because the usage of all your “systems” of interest (VMs, hosts, clusters, datacenters, services and user-defined groups) are reported in the same Resource Score units. Resource Score reporting enables you to immediately make apples-to-apples comparisons of:
• The capacity and consumption of different hosts or clusters
• The capacity and consumption of business applications
• The capacity and consumption of different business services
• The headroom of different hosts or clusters
• The CPU consumption of different VMs running on different types of hosts
Figure C.
Gaining clear visibility into cyclical patterns of usage of your entire IT infrastructure gives you unique insight into the efficiency of your data center.

11 | CA TECHNOLOGIES CAPACITY MANAGEMENT RESOURCE SCORING EXPLAINED ca.com
Virtual Placement Manager (VPM)VPM considers the capacities and consumptions of CPU, memory, network and storage resources to enable users to model:
• Placing the workload(s) from multiple physical systems into an existing or new hypothetical virtualized cluster
• Placing VMs from an existing host or cluster into an existing or new hypothetical cluster
• Optimization of the placement of VMs on hosts within their existing cluster
• Cost outcomes associated with the variety of technical and performance alternatives
While performing these operations, VPM uses computed resource capacity of hosts and clusters and resource consumption of workloads and VMs to:
• Right-size VMs based on the consumption requirements of the VM and the ability of the destination host to deliver resources to the VM
• Balance resource headroom across the hosts in the cluster (to minimize the probability that any resource consumption spikes will adversely affect application performance)
• Balance resource consumption across the hosts in the cluster (e.g., minimize multiple heavy I/O VMs on the same host)
• Right-size the number of hosts in a new cluster while maintaining reserve capacity constraints
The appropriate number of VCPUs to select is not always obvious when right-sizing a new VM or when moving a VM from one cluster to another. The “right” number of VCPUs is determined by dividing the required Resource Score consumption by the Resource Score capacity deliverable by a processor unit of the destination host (and rounding up, of course). That means when moving a VM from one environment to another it may be appropriate to either increase or decrease the number of configured VCPUs or GBs of memory of the VM, depending on the characteristics of the source and destination host systems.
Balancing resource headroom across the hosts in a cluster when placing new VMs into that cluster or when optimizing an existing cluster is complicated by a couple of factors. Significant over-subscription of memory is generally realized to be a potential source of performance issues (If the VMM on a host is forced to start swapping VM memory to rotating storage, it typically results in significant impact to those VMs’ performance). However, over-subscription of processors (the ratio of VCPUs to physical processors on a host) is generally considered “safe” as long as there is sufficient CPU capacity to satisfy the consumption demand. What is often over-looked is that adding VMs with multiple VCPUs to a host increases the resource overhead consumed by the VMM. VPM considers the VMM overhead in each host of a cluster during placement or optimization based on the number of VMs and their configurations. This often has the surprising result of identical hardware hosts in a cluster being reported by VPM as having different capacities. Virtualized host capacities are represented by VPM as capacities available for delivery to assigned VMs (i.e., with VMM overhead removed from the host capacity).

CA Capacity ManagerCA Capacity Manager provides a rich, powerful set of “what-if” scenario capabilities to predict the performance of systems and workloads under conditions that are different from today. Examples of issues to be addressed might be:
• At our current rates of application growth in the Xanadu cluster, how long before we cross our (self-imposed) performance thresholds? (What’s our “time-to-live?”)
• If the volume of our sales fulfillment application increases by 50% (due to acquisition or new product launch), will our current infrastructure support that workload? If not, what additional resources do we need? (I.e., where does the system bottleneck? What’s the second bottleneck?)
• If we replace half of our servers with hot new Super Servers from Dipsie-Doodle, how many of them will we need to purchase to ensure we achieve our performance metrics for the next six months?
Note that all of these issues address what we should expect to happen in the future and how to appropriately prepare for it. Do we scale up? Do we scale out? Which is more effective? What are my tradeoffs?
12 | CA TECHNOLOGIES CAPACITY MANAGEMENT RESOURCE SCORING EXPLAINED ca.com
Figure D.
Right size virtual and physical infrastructures according to workloads, plan for upcoming projects.
Section 4:
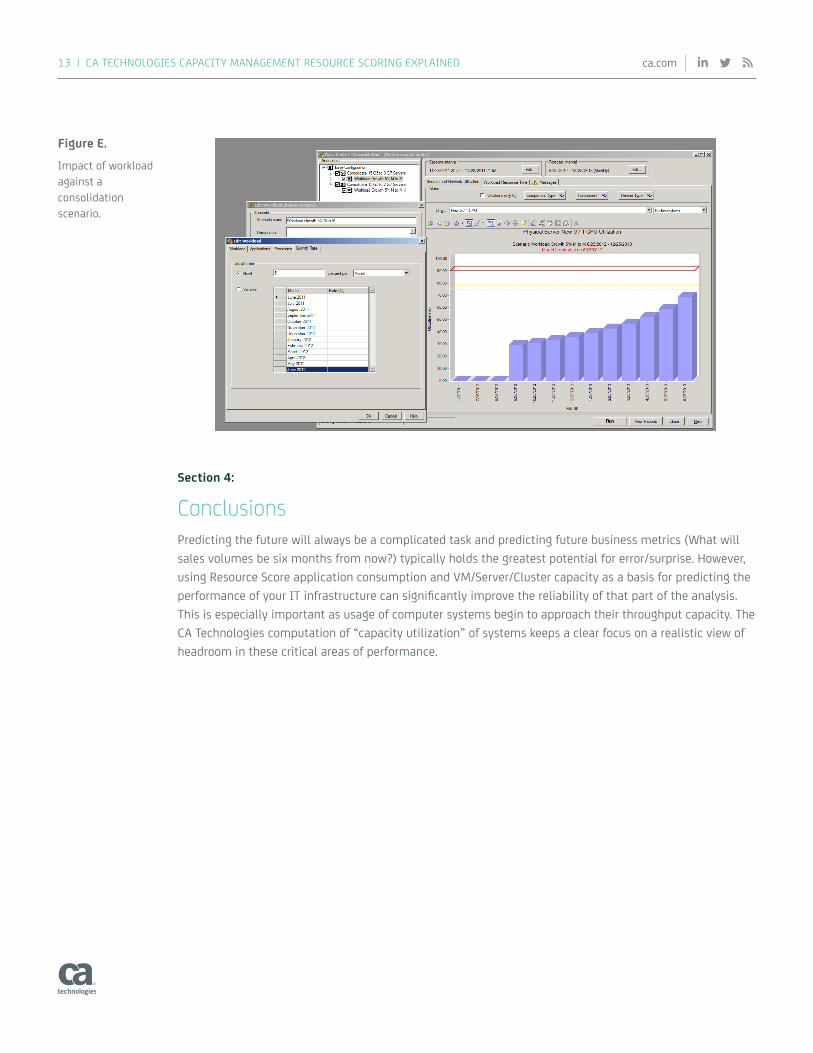
ConclusionsPredicting the future will always be a complicated task and predicting future business metrics (What will sales volumes be six months from now?) typically holds the greatest potential for error/surprise. However, using Resource Score application consumption and VM/Server/Cluster capacity as a basis for predicting the performance of your IT infrastructure can significantly improve the reliability of that part of the analysis. This is especially important as usage of computer systems begin to approach their throughput capacity. The CA Technologies computation of “capacity utilization” of systems keeps a clear focus on a realistic view of headroom in these critical areas of performance.
13 | CA TECHNOLOGIES CAPACITY MANAGEMENT RESOURCE SCORING EXPLAINED ca.com
Figure E.
Impact of workload against a consolidation scenario.
14 | CA TECHNOLOGIES CAPACITY MANAGEMENT RESOURCE SCORING EXPLAINED ca.com
Section 5:
ReferencesAMD. (2012). AMD Opteron 6300 Series Processors. Retrieved January 2, 2013, from amd.com: amd.com/us/products/server/processors/6000-series-platform/6300/Pages/6300-series-processors.aspx#2
Cepeda, S. (2012, January 27). Intel Hyper-Threading Technology: Your Questions Answered. Retrieved January 2, 2013, from software.intel.com: software.intel.com/en-us/articles/intel-hyper-threading-technology-your-questions-answered
Intel. (2012). Fact Sheet: Intel Xeon Processor E5-2600 Product Family. Retrieved January 2, 2013, from intel com: http://download.intel.com/newsroom/kits/xeon/e5/pdfs/Intel_Xeon_E5_Factsheet.pdf
Intel. (2012). Intel Xeon processor E5-4600 Product Family. Retrieved January 2, 2013, from ark.intel.com: ark.intel.com/products/series/64581
Oracle. (2012, April). How the SPARC T4 Processor Optimizes Throughput Capacity: A Case Study. Retrieved January 2, 2013, from oracle.com: oracle.com/technetwork/server-storage/sun-sparc-enterprise/documentation/t-series-latency-1579242.pdf
SAP. (n.d.). SAP Standard Application Benchmarks. Retrieved January 2, 2013, from sap.com: sap.com/campaigns/benchmark/index.epx
Saravanan, D. R. (2010, August 27). Understanding Processor Utilization on POWER Systems. Retrieved January 2, 2013, from ibm.com: ibm.com/developerworks/wikis/display/WikiPtype/Understanding+Processor+Utilization+on+POWER+Systems+-+AIX
Standard Performance Evaluation Corporation. (2011, September 7). SPEC CPU2006. Retrieved January 2, 2013, from spec.org: spec.org/cpu2006/
Standard Performance Evaluation Corporation. (2012, April 5). SPECjEnterprise2010. Retrieved January 2, 2013, from spec.org: http://spec.org/cpu2006/
Tendler, J. M. (2009). POWER7 Processors: The Beat Goes On. Retrieved January 2, 2013, from ibm.com: com/developerworks/wikis/download/attachments/104533501/POWER7+-+The+Beat+Goes+On.pdf
Transaction Processing Performance Council. (n.d.). Overview of the TPC Benchmark C. Retrieved January 2, 2013, from tpc.org: http://www.tpc.org/tpcc/detail.asp
CA Technologies (NASDAQ: CA) creates software that fuels transformation for companies and enables them to seize the opportunities of the application economy. Software is at the heart of every business, in every industry. From planning to development to management and security, CA is working with companies worldwide to change the way we live, transact and communicate – across mobile, private and public cloud, distributed and mainframe environments. Learn more at ca.com.
15 | CA TECHNOLOGIES CAPACITY MANAGEMENT RESOURCE SCORING EXPLAINED
Copyright © 2014 CA. All rights reserved. Intel and Xeon are trademarks of Intel Corporation in the U.S. and other countries. IBM and POWER7 are trademarks of International Business Machines Corporation in the United States, other countries, or both. Linux® is the registered trademark of Linus Torvalds in the U.S. and other countries. All other trademarks, trade names, service marks and logos referenced herein belong to their respective companies. Certain information in this publication may outline CA’s general product direction. However, CA may make modifications to any CA product, software program, method or procedure described in this publication at any time without notice, and the development, release and timing of any features or functionality described in this publication remain at CA’s sole discretion. CA will support only the referenced products in accordance with (i) the documentation and specifications provided with the referenced product, and (ii) CA’s then-current maintenance and support policy for the referenced product. Notwithstanding anything in this publication to the contrary, this publication shall not: (i) constitute product documentation or specifications under any existing or future written license agreement or services agreement relating to any CA software product, or be subject to any warranty set forth in any such written agreement; (ii) serve to affect the rights and/or obligations of CA or its licensees under any existing or future written license agreement or services agreement relating to any CA software product; or (iii) serve to amend any product documentation or specifications for any CA software product. This document is for your informational purposes only. CA assumes no responsibility for the accuracy or completeness of the information. To the extent permitted by applicable law, CA provides this document “as is” without warranty of any kind, including, without limitation, any implied warranties of merchantability, fitness for a particular purpose, or noninfringement. In no event will CA be liable for any loss or damage, direct or indirect, from the use of this document, including, without limitation, lost profits, business interruption, goodwill or lost data, even if CA is expressly advised in advance of the possibility of such damages. Certain figures and other potential cost, savings and performance information contained herein are based upon CA Technologies experiences with the referenced software and/or hardware products (“Products”) in a variety of development and/or customer environments and/or estimations derived from the analysis of benchmark data which is a composite of data derived from industry analyst published information, interviews with subject matter experts and experiential data from prior projective analyses. Past performance of the Products is not indicative of the future performance of such Products in identical, similar or different environments. Calculations are estimates only. Your actual costs, savings and performance results may vary. CA Technologies does not warrant that the Products will operate as specifically set forth in this publication. CS200_94816_1014
Connect with CA Technologies at ca.com