Embed Size (px)
Citation preview
WBG052114205536FLL
PREVENTATIVE MAINTENANCE OPTIMIZATION & RELIABILITY BEST PRACTICES SWOWEA PLANT OPERATIONS SEMINAR MASON, OH NOVEMBER 20, 2014 JD SOLOMON, PE, CRE, CMRP
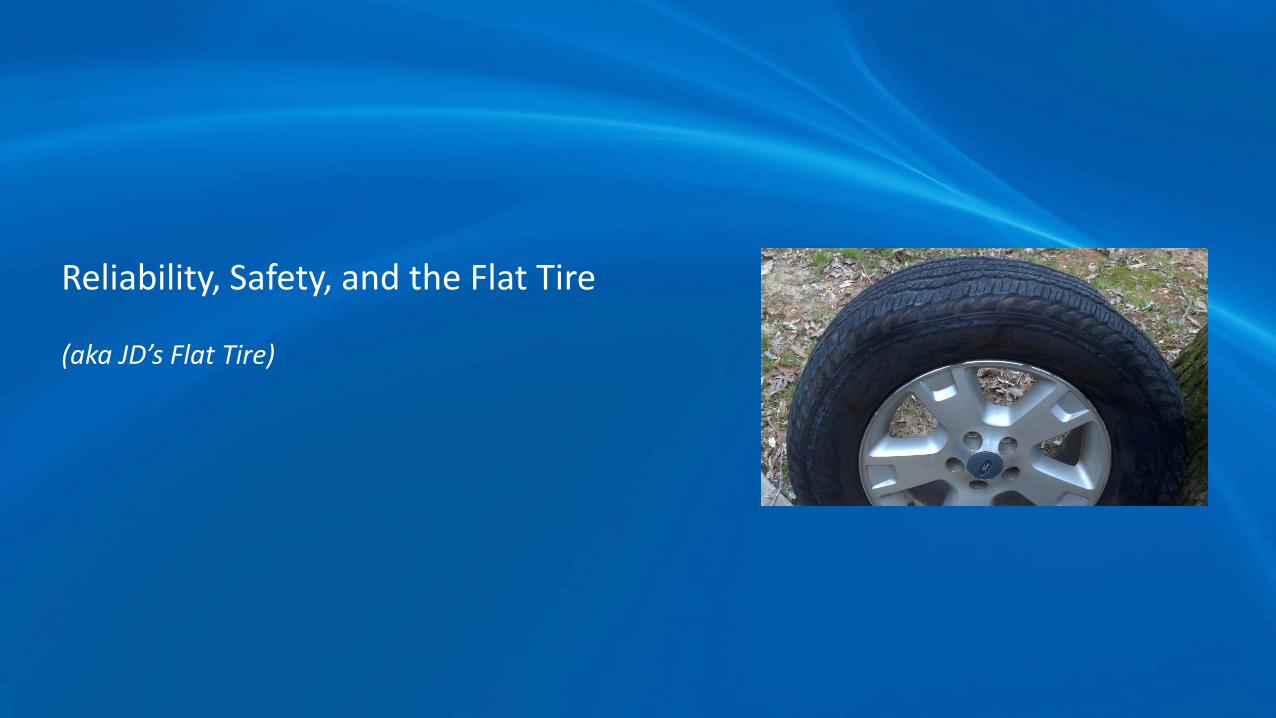
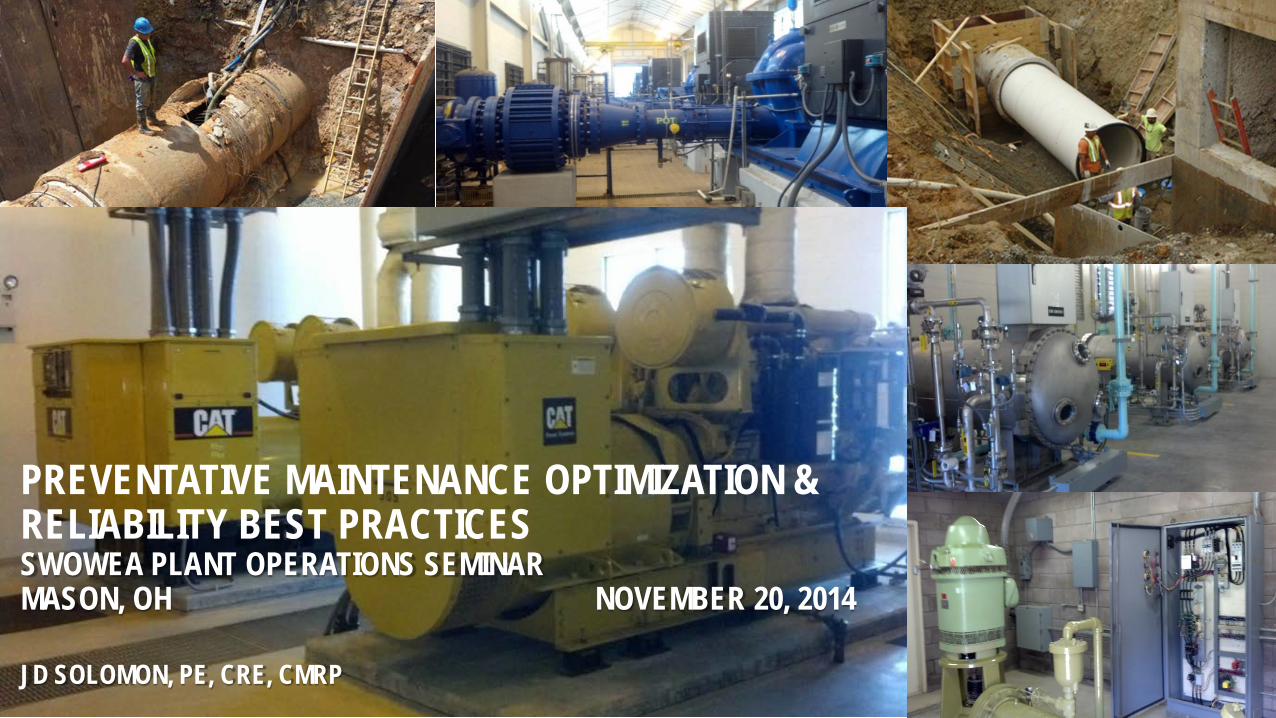
Reliability, Safety, and the Flat Tire (aka JD’s Flat Tire)
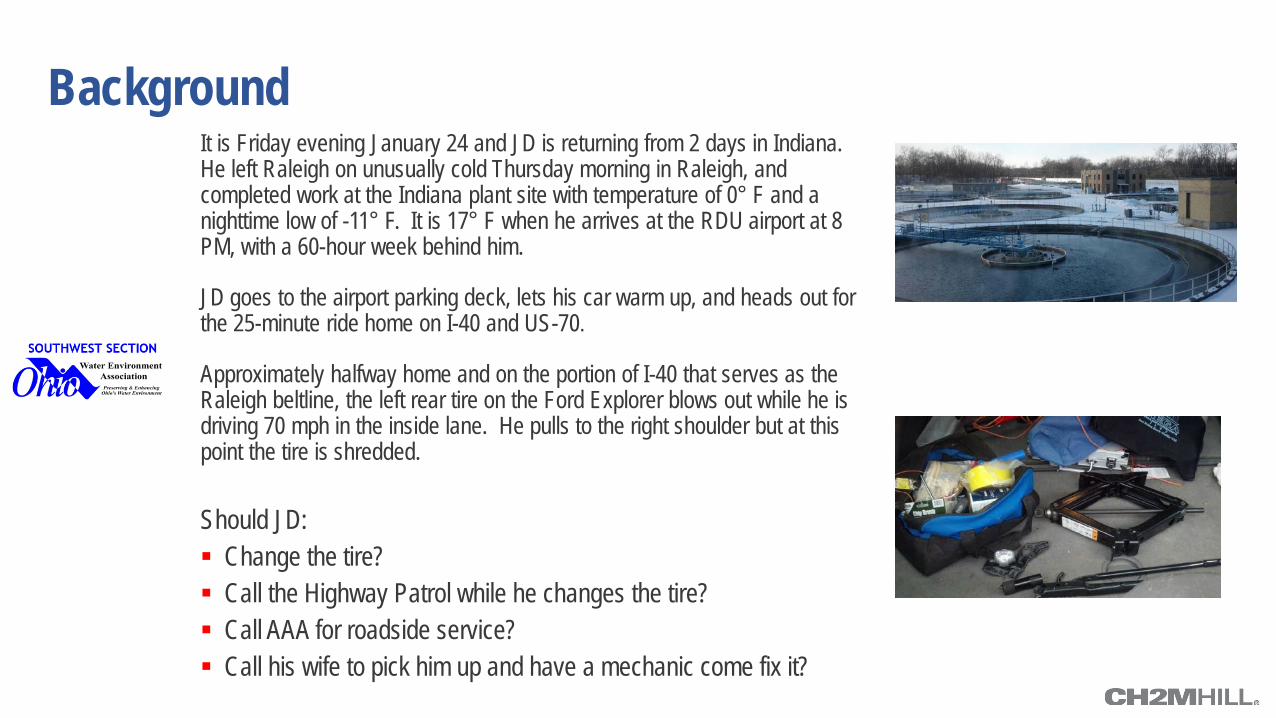
Background It is Friday evening January 24 and JD is returning from 2 days in Indiana. He left Raleigh on unusually cold Thursday morning in Raleigh, and completed work at the Indiana plant site with temperature of 0° F and a nighttime low of -11° F. It is 17° F when he arrives at the RDU airport at 8 PM, with a 60-hour week behind him.
JD goes to the airport parking deck, lets his car warm up, and heads out for the 25-minute ride home on I-40 and US-70.
Approximately halfway home and on the portion of I-40 that serves as the Raleigh beltline, the left rear tire on the Ford Explorer blows out while he is driving 70 mph in the inside lane. He pulls to the right shoulder but at this point the tire is shredded.
Should JD: Change the tire? Call the Highway Patrol while he changes the tire? Call AAA for roadside service? Call his wife to pick him up and have a mechanic come fix it?
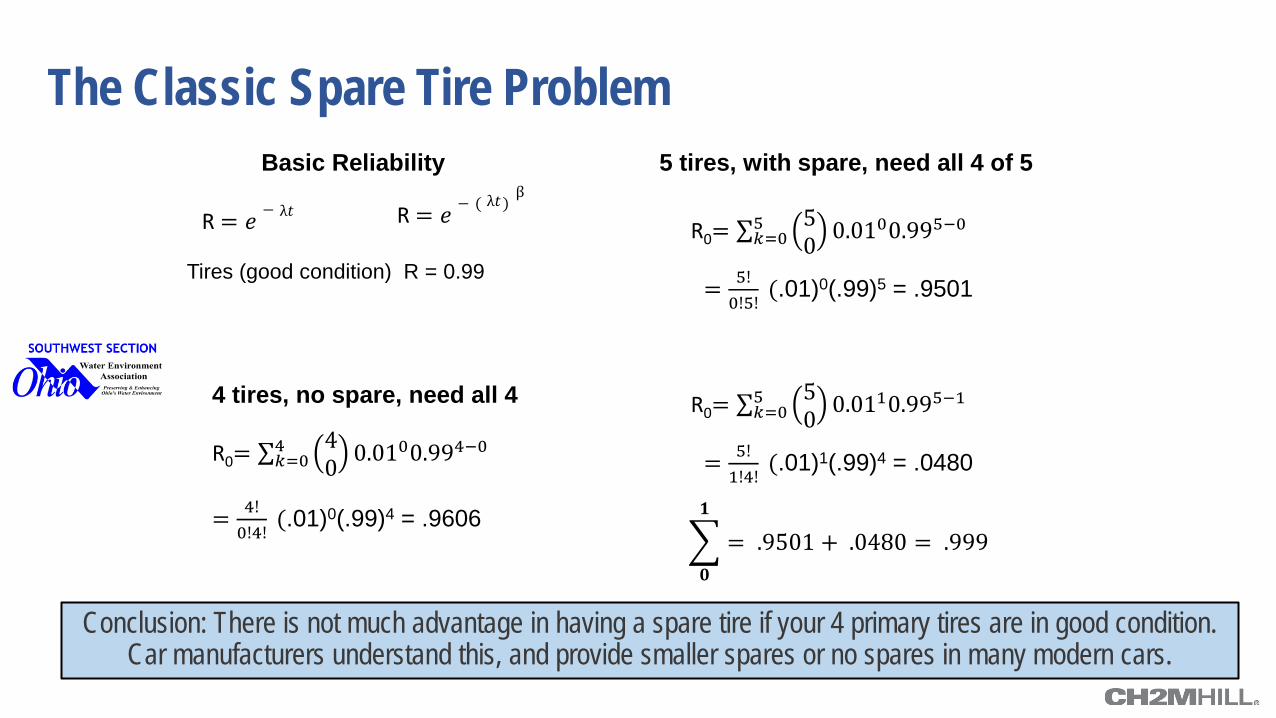
The Classic Spare Tire Problem
Conclusion: There is not much advantage in having a spare tire if your 4 primary tires are in good condition. Car manufacturers understand this, and provide smaller spares or no spares in many modern cars.
R0= ∑ 40 0.0100.994−04
𝑘=0
= 4!0!4!
(.01)0(.99)4 = .9606
4 tires, no spare, need all 4
R0= ∑ 50 0.0100.995−05
𝑘=0
= 5!0!5!
(.01)0(.99)5 = .9501
= 5!1!4!
(.01)1(.99)4 = .0480
R0= ∑ 50 0.0110.995−15
𝑘=0
� = .9501 + .0480 = .999𝟏
𝟎
5 tires, with spare, need all 4 of 5
λ𝑡 R = 𝑒 − R = 𝑒 − ( ) λ𝑡 β
Tires (good condition) R = 0.99
Basic Reliability
Design for …. Reliability, Safety, Robustness
Some non-design risk-reliability mitigation strategies for flat tires • AAA or other roadside assistance programs • Cell phones (usually never out of service area) • Highway Patrol
We cannot improve reliability through operations or maintenance. It must be
designed into the system.
O&M Tradeoffs, Dilemmas and Conundrums As the operator, what are my responsibilities for maintenance?
• Should I have performed a checklist inspection before leaving airport? • Should I expect my mechanic to have done a checklist before I left the airport? • Is the repair my responsibility as the operator?
Concept in practice is called Operator Driven Reliability (ODR), and also component of Total Productive Maintenance in Japanese manufacturing.
What should my mechanic have done? • How about air pressure in spare tire?
Should I make the time to do a Root Cause Analysis (RCA)? • Does is depend on what happened while I changed the tire? • Does safety impact the importance of an RCA?
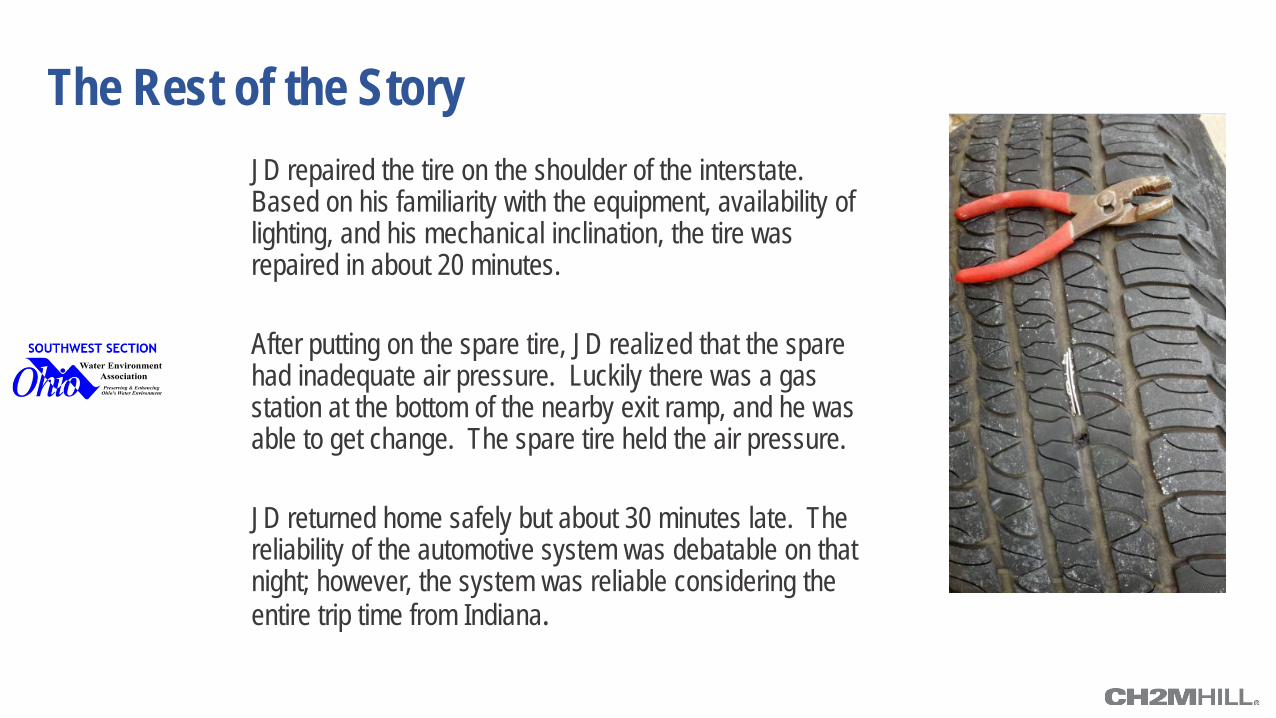
The Rest of the Story JD repaired the tire on the shoulder of the interstate. Based on his familiarity with the equipment, availability of lighting, and his mechanical inclination, the tire was repaired in about 20 minutes. After putting on the spare tire, JD realized that the spare had inadequate air pressure. Luckily there was a gas station at the bottom of the nearby exit ramp, and he was able to get change. The spare tire held the air pressure. JD returned home safely but about 30 minutes late. The reliability of the automotive system was debatable on that night; however, the system was reliable considering the entire trip time from Indiana.
Thinking About It…… It was probably not a safe situation. Reliability goes to zero in the event of an
accident or death. There is a need for different reliability and risk mitigation strategies over time
and as the organization context changes. Designing for safety and reliability, in the appropriate operating environment, is
critically important. A low clearance sports car may have proven less reliable in this situation. Closing the gaps between designer, operator, and mechanic are very important.
Training, checklists, and refreshers are needed.
How does the situation change when I consider my fleet?
• Program should be based on average operator, not the best. • Root Cause Analysis and Lessons Learned on near misses are important. • A real system, including checklists, training, and checklists, is needed.
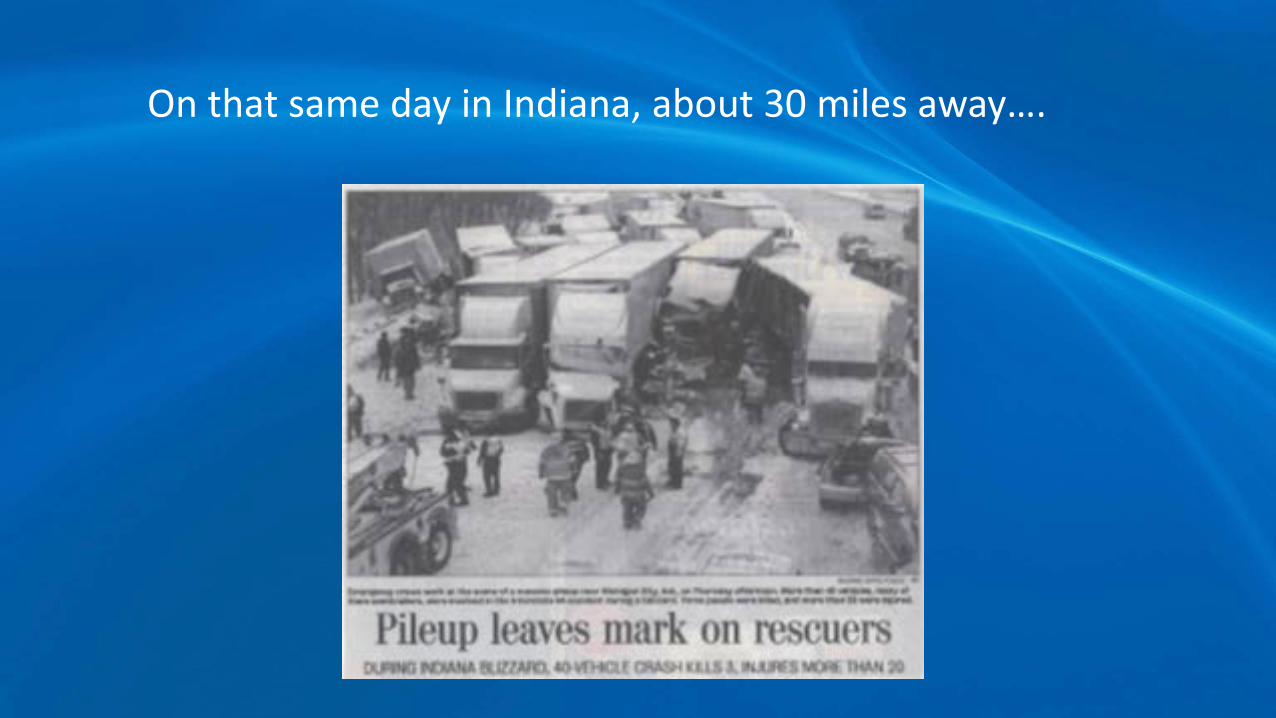
On that same day in Indiana, about 30 miles away….
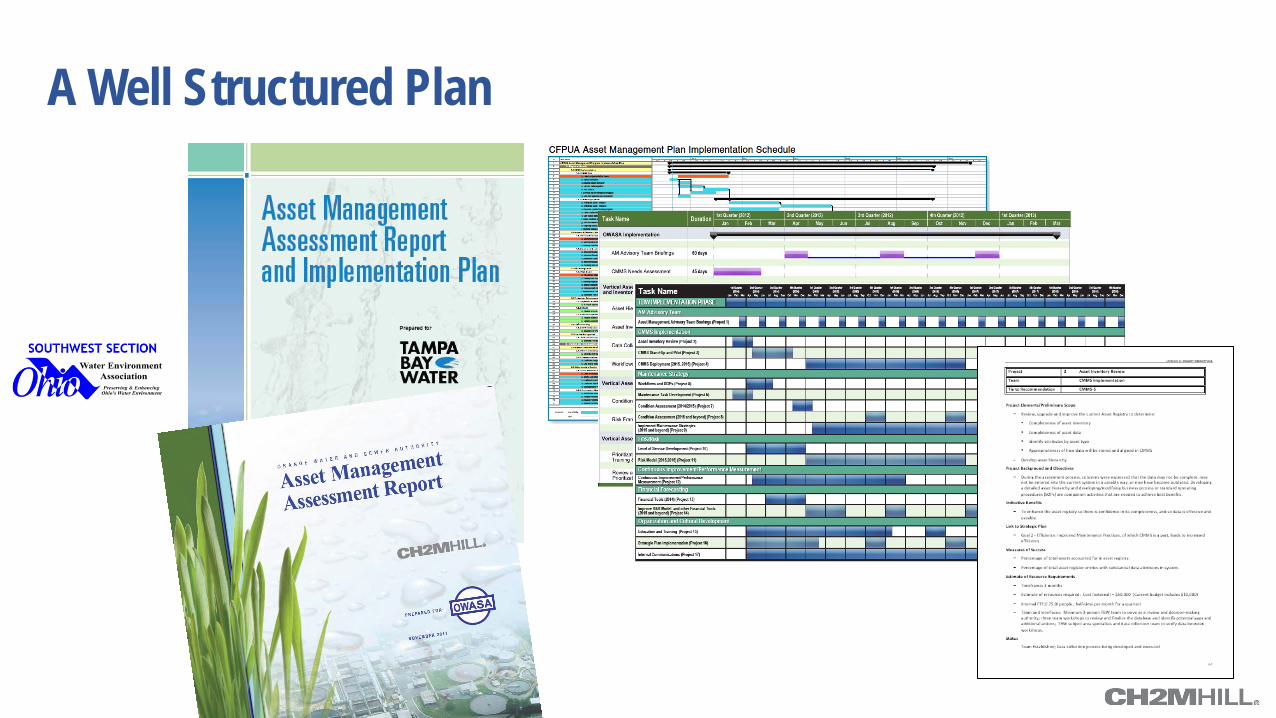
A Well Structured Plan
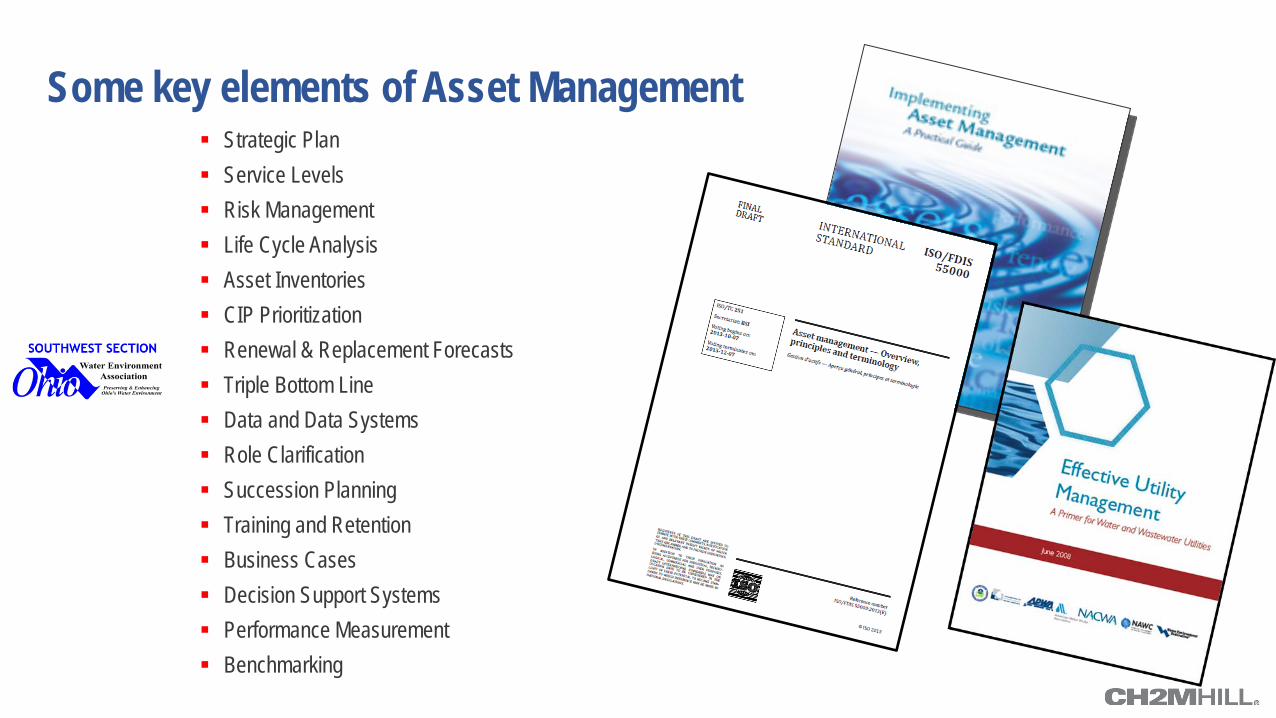
Some key elements of Asset Management Strategic Plan Service Levels Risk Management Life Cycle Analysis Asset Inventories CIP Prioritization Renewal & Replacement Forecasts Triple Bottom Line Data and Data Systems Role Clarification Succession Planning Training and Retention Business Cases Decision Support Systems Performance Measurement Benchmarking
Answer
Maintenance: 16 times, but not defined
Reliability: 7 times, but not defined
How many times are the words “maintenance” and “reliability” used in the new ISO 55000 (55000, 55001, 55002) standard?
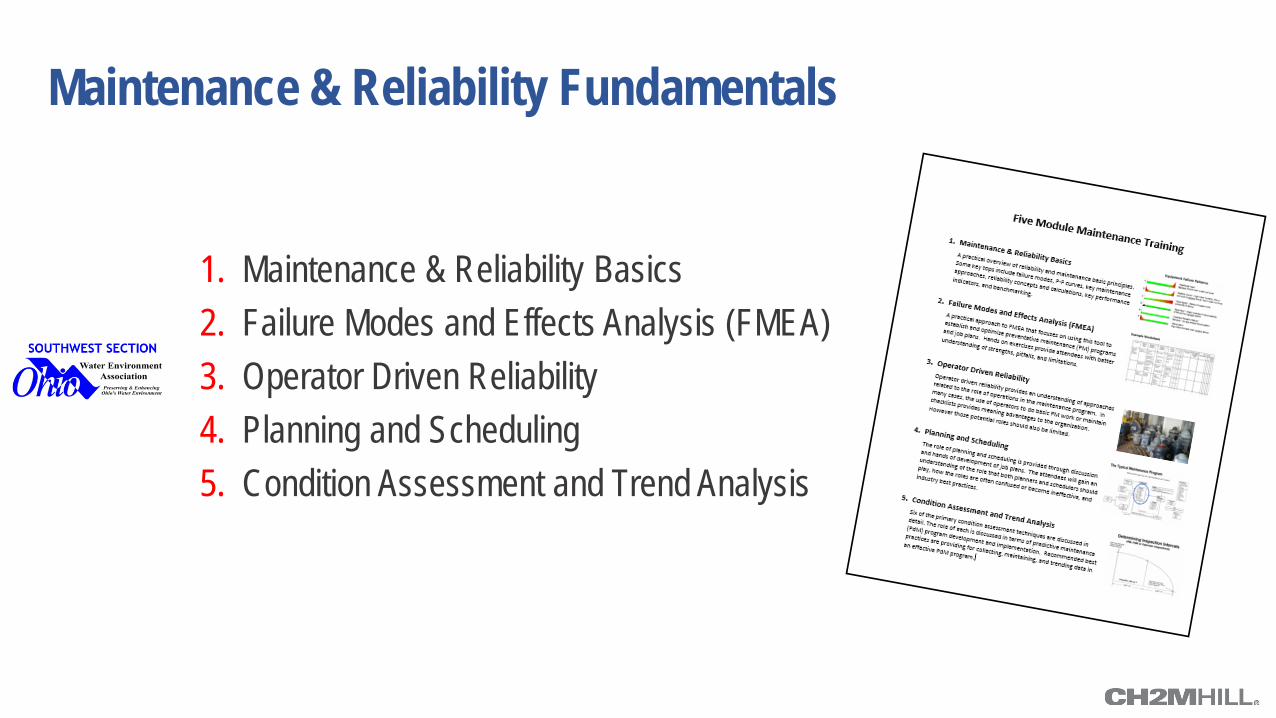
Maintenance & Reliability Fundamentals
1. Maintenance & Reliability Basics 2. Failure Modes and Effects Analysis (FMEA) 3. Operator Driven Reliability 4. Planning and Scheduling 5. Condition Assessment and Trend Analysis
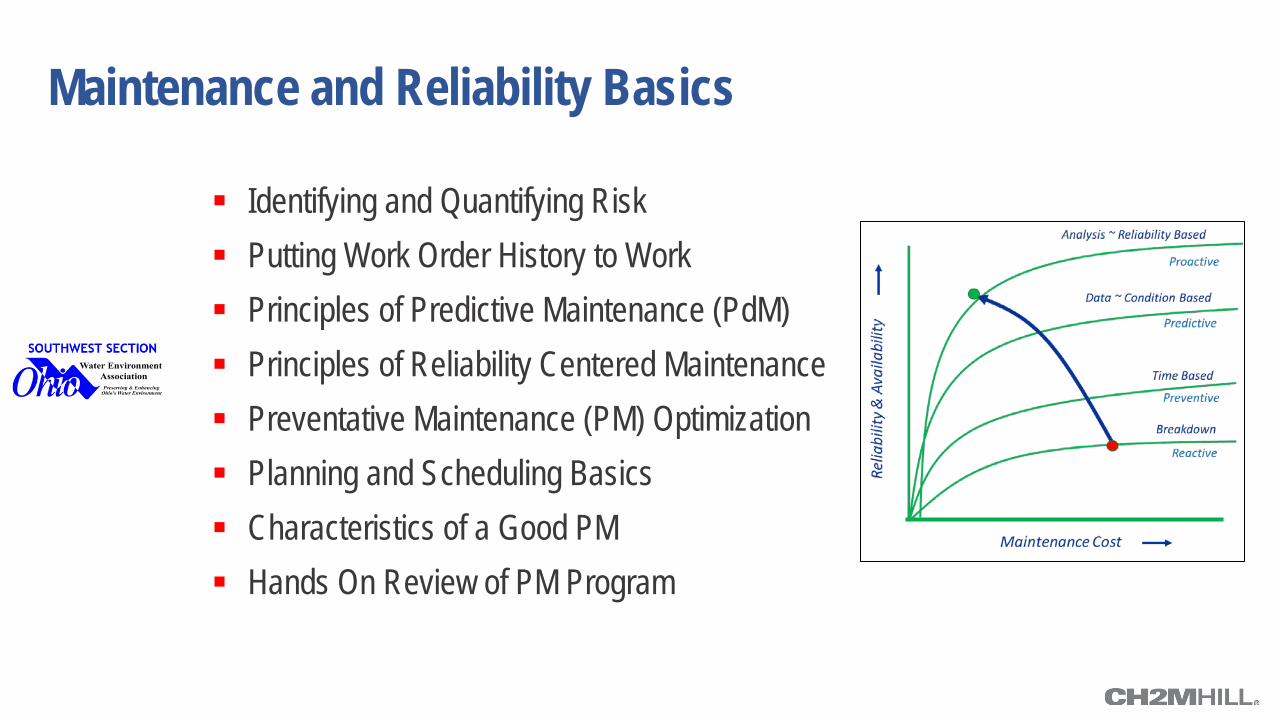
Maintenance and Reliability Basics
Identifying and Quantifying Risk Putting Work Order History to Work Principles of Predictive Maintenance (PdM) Principles of Reliability Centered Maintenance Preventative Maintenance (PM) Optimization Planning and Scheduling Basics Characteristics of a Good PM Hands On Review of PM Program
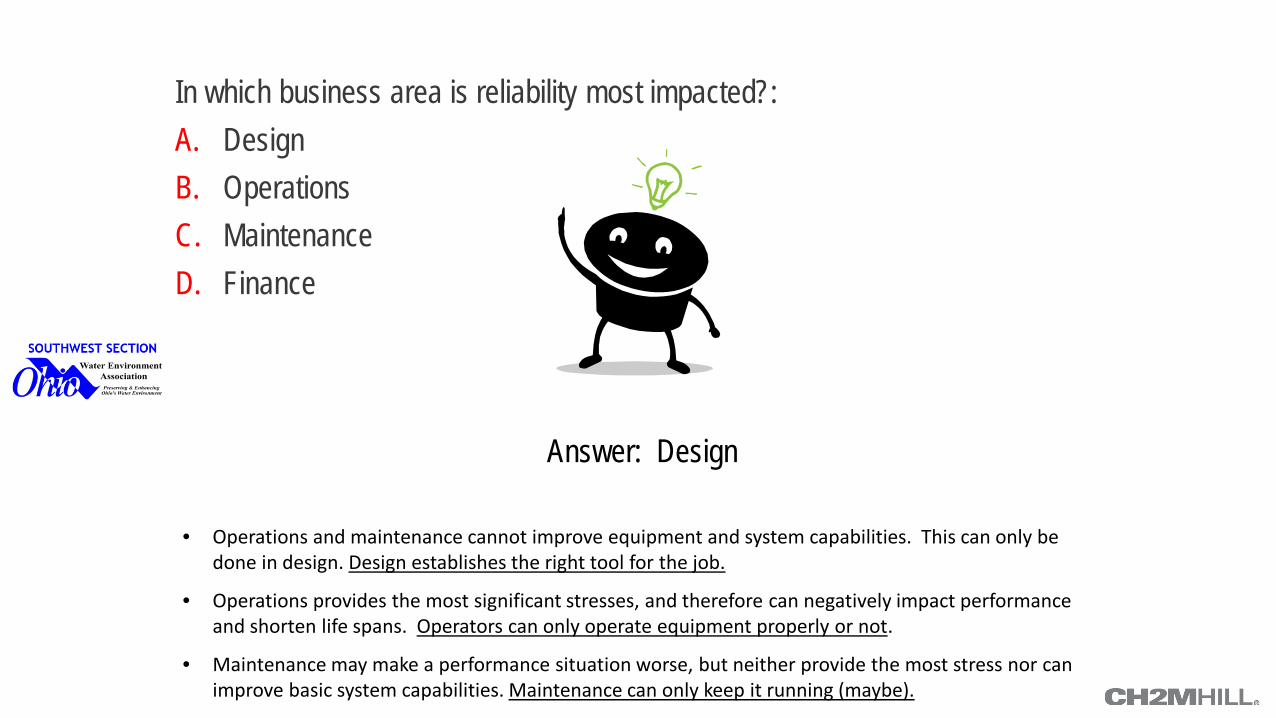
Answer: Design
In which business area is reliability most impacted?: A. Design B. Operations C. Maintenance D. Finance
• Operations and maintenance cannot improve equipment and system capabilities. This can only be done in design. Design establishes the right tool for the job.
• Operations provides the most significant stresses, and therefore can negatively impact performance and shorten life spans. Operators can only operate equipment properly or not.
• Maintenance may make a performance situation worse, but neither provide the most stress nor can improve basic system capabilities. Maintenance can only keep it running (maybe).
Answer: More than 60%
What is best-in-class for Labor Effectiveness (“wrench time”), in terms of percentage of total maintenance hours? a) More than 60% b) 50 to 60% c) 30 to 50% d) Less than 30%
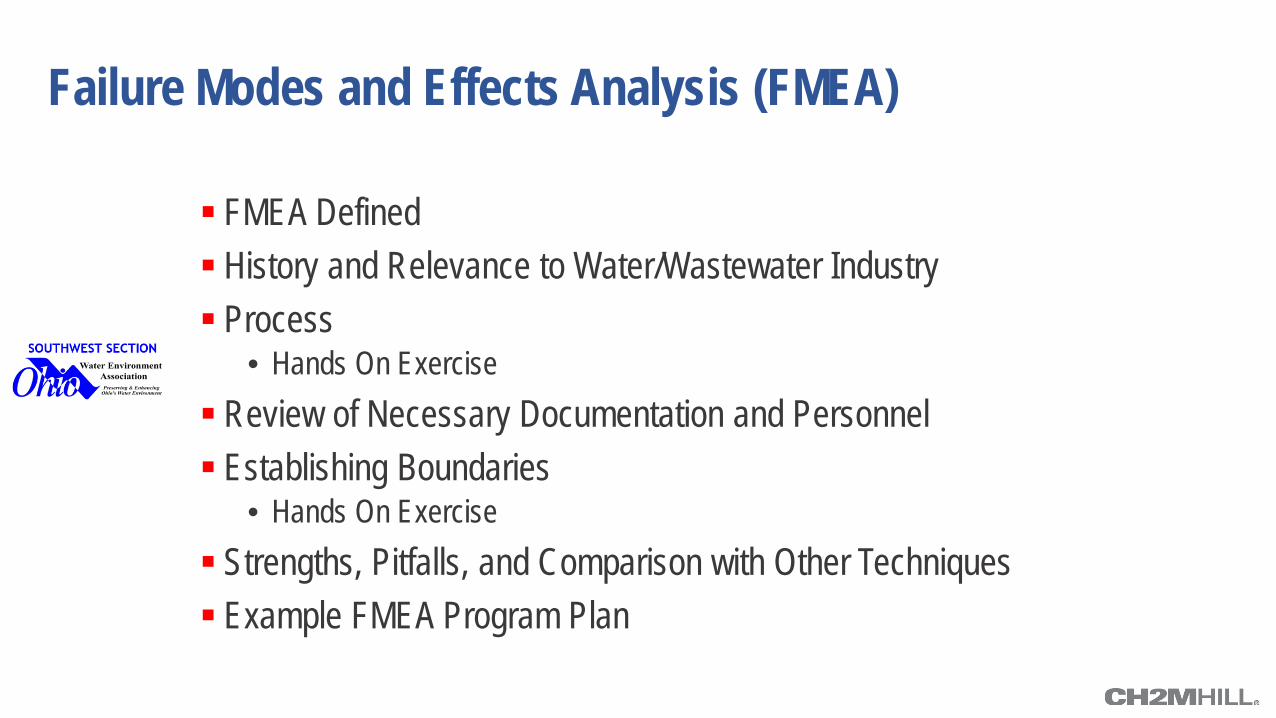
Failure Modes and Effects Analysis (FMEA)
FMEA Defined History and Relevance to Water/Wastewater Industry Process
• Hands On Exercise Review of Necessary Documentation and Personnel Establishing Boundaries
• Hands On Exercise Strengths, Pitfalls, and Comparison with Other Techniques Example FMEA Program Plan
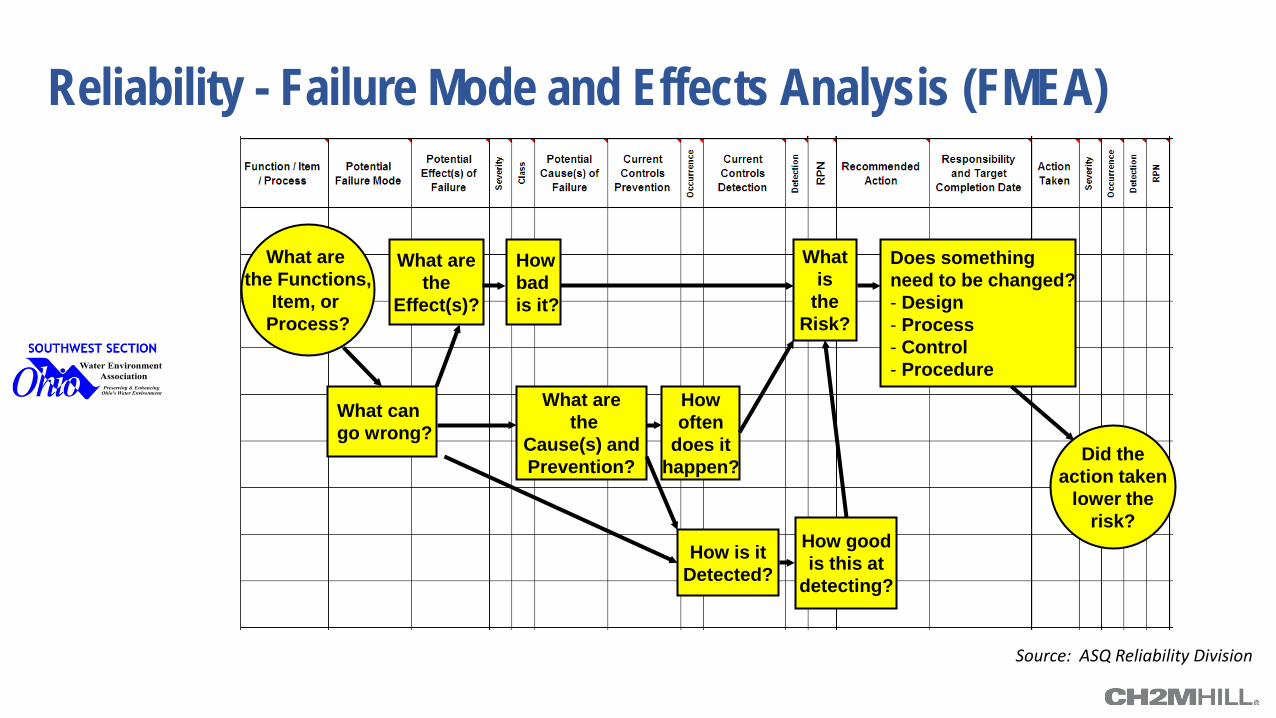
Reliability - Failure Mode and Effects Analysis (FMEA)
What are the Functions,
Item, or Process?
What can go wrong?
What are the
Effect(s)?
How bad is it?
What are the
Cause(s) and Prevention?
How often
does it happen?
How is it Detected?
How good is this at
detecting?
What is
the Risk?
Does something need to be changed? - Design - Process - Control - Procedure
Did the action taken
lower the risk?
Source: ASQ Reliability Division
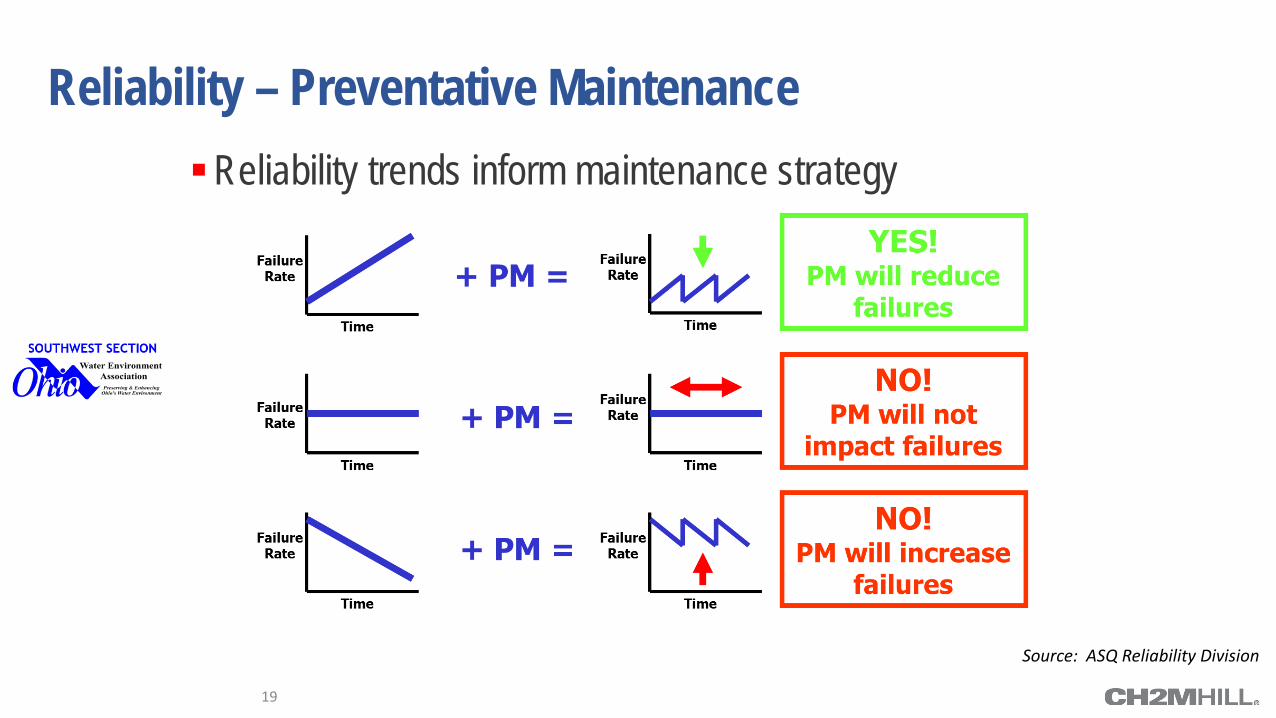
Reliability – Preventative Maintenance Reliability trends inform maintenance strategy
19
Source: ASQ Reliability Division
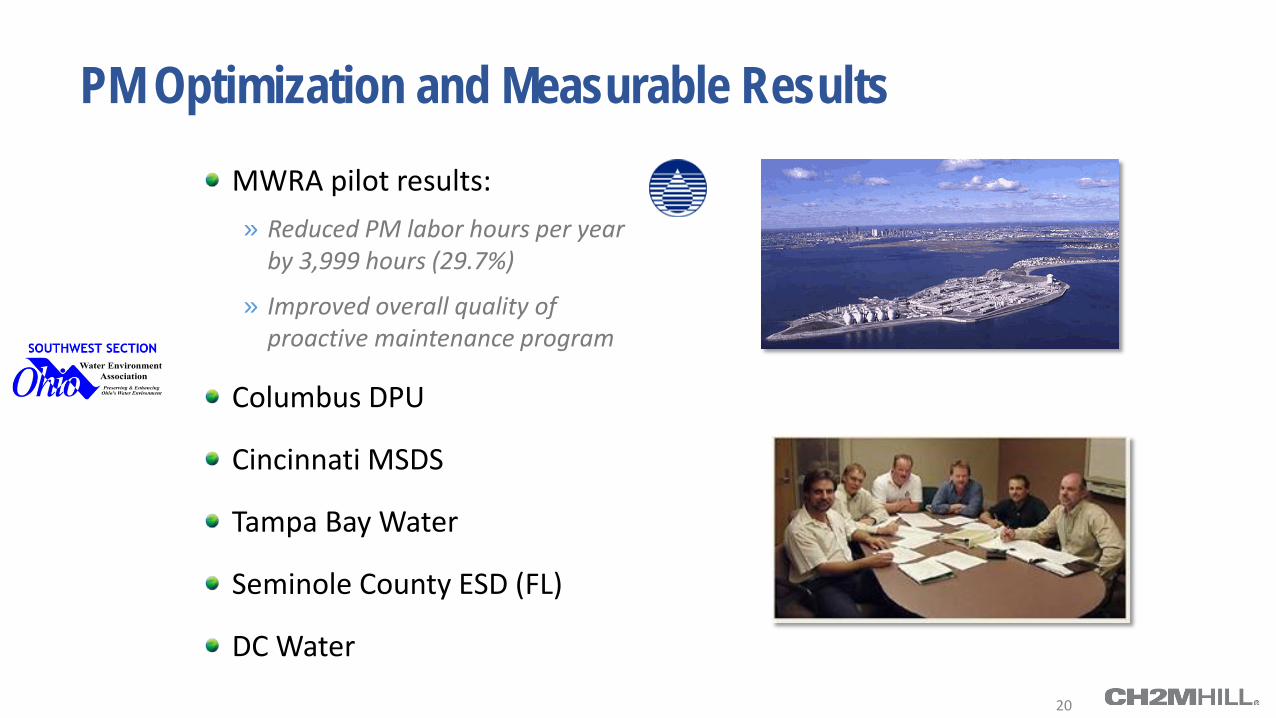
PM Optimization and Measurable Results MWRA pilot results: » Reduced PM labor hours per year
by 3,999 hours (29.7%)
» Improved overall quality of proactive maintenance program
Columbus DPU
Cincinnati MSDS
Tampa Bay Water
Seminole County ESD (FL)
DC Water
20
Operator Driven Reliability (ODR)
Traditional Roles of Operations and Maintenance ODR Overview and Benefits Setting up an ODR program
• Resources • Scheduling • Training • Documentation
Hands On Exercise – designing an ODR route
Planning (and Scheduling)
The Maintenance Process Identify - Job capture and identification Plan - What is maintenance planning and why do it
• Planning Break-out session Schedule - What is scheduling
• Scheduling Break-out session Execute - Getting the work done Complete – What “completing” a job involves and how it should be defined Analyze – What gets measured gets managed
Answer: None
How much time should a planner spend managing inventory or kitting parts? a) 21 to 30% b) 11 to 20% c) 1 to 10% d) None
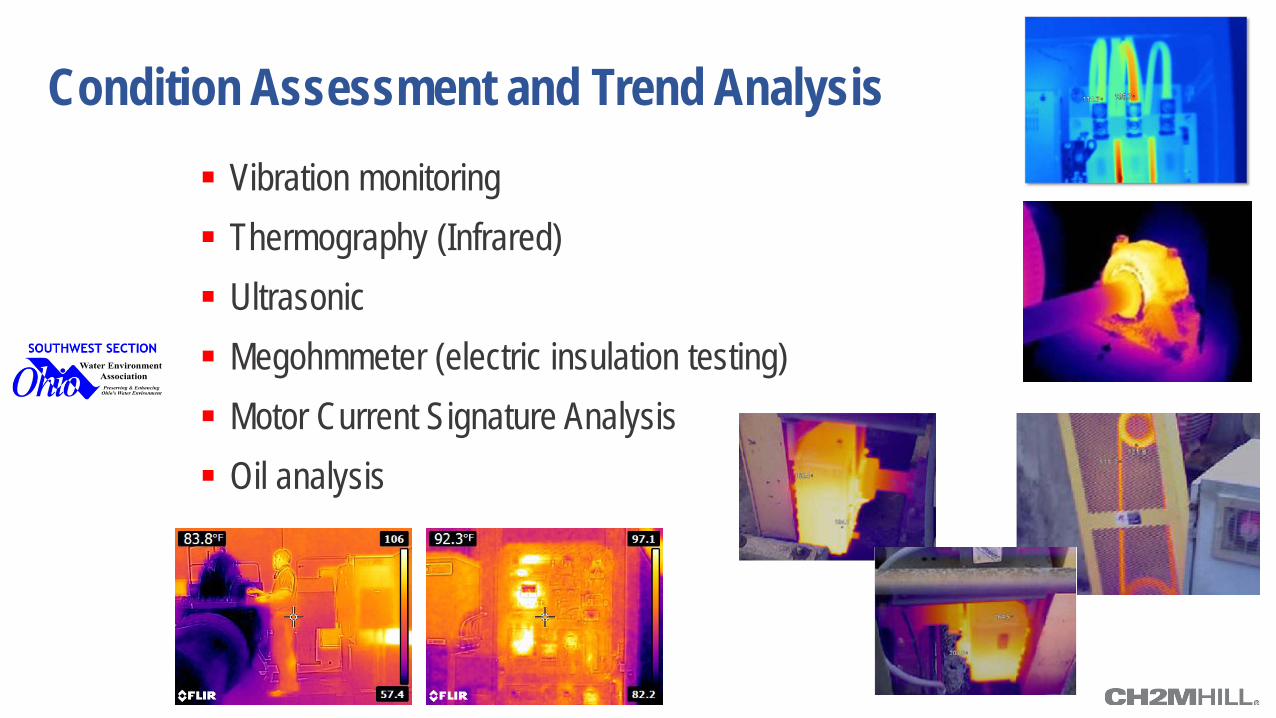
Condition Assessment and Trend Analysis Vibration monitoring Thermography (Infrared) Ultrasonic Megohmmeter (electric insulation testing) Motor Current Signature Analysis Oil analysis
Answer: 20 to 30%
In terms of total maintenance hours, how much time should be spent on predictive maintenance (PdM) or Condition Based Analysis (CBA) activities? a) 1 to 19% b) 20 to 30% c) 31 to 60% d) More than 60%
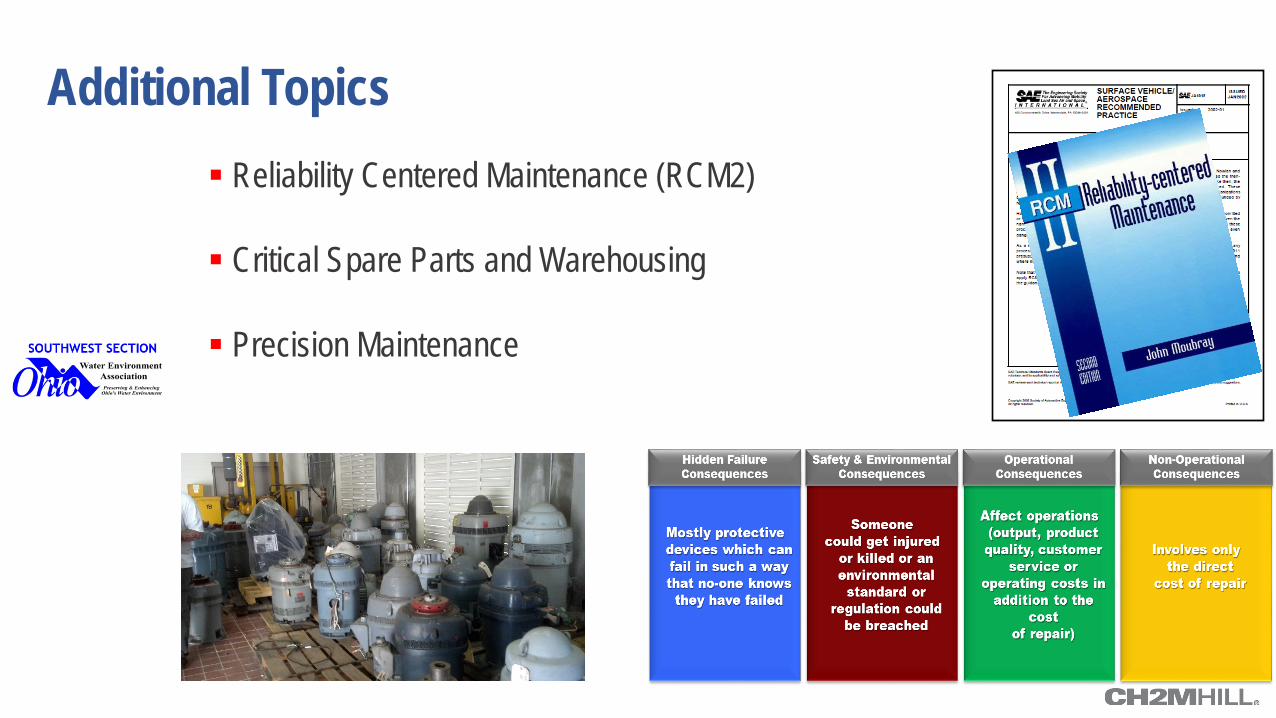
Additional Topics Reliability Centered Maintenance (RCM2) Critical Spare Parts and Warehousing
Precision Maintenance
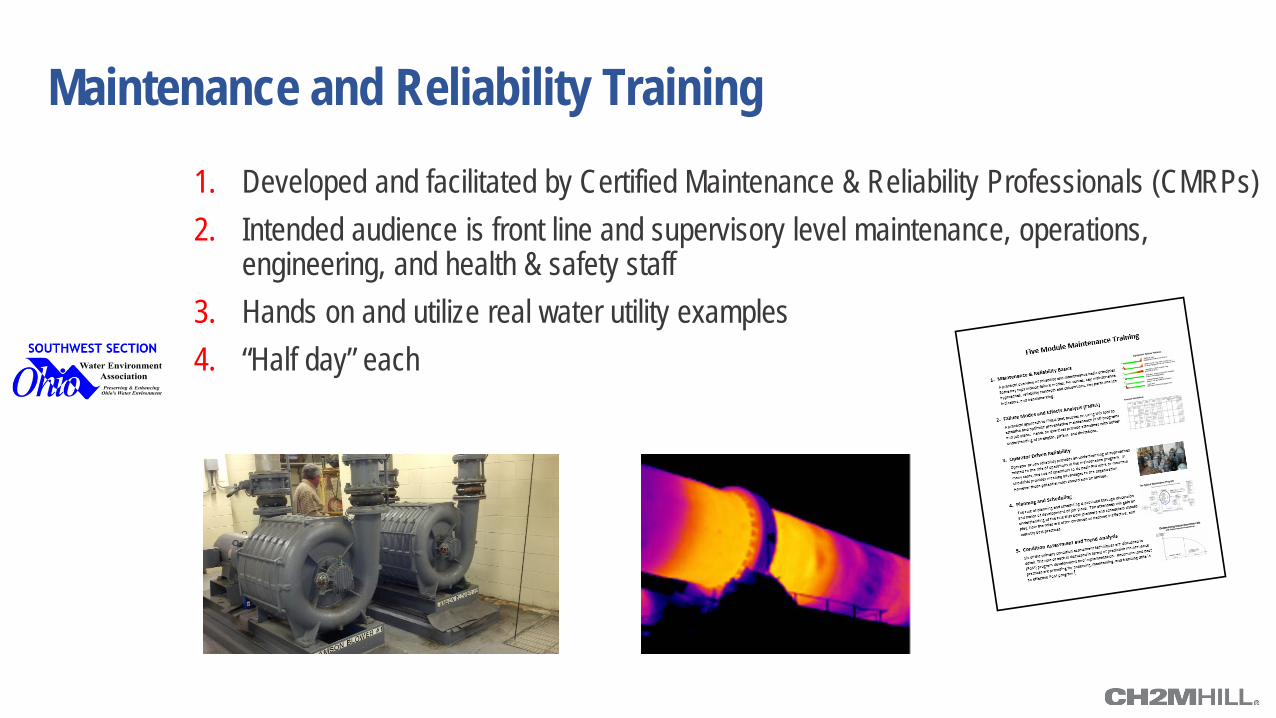
Maintenance and Reliability Training 1. Developed and facilitated by Certified Maintenance & Reliability Professionals (CMRPs) 2. Intended audience is front line and supervisory level maintenance, operations,
engineering, and health & safety staff 3. Hands on and utilize real water utility examples 4. “Half day” each
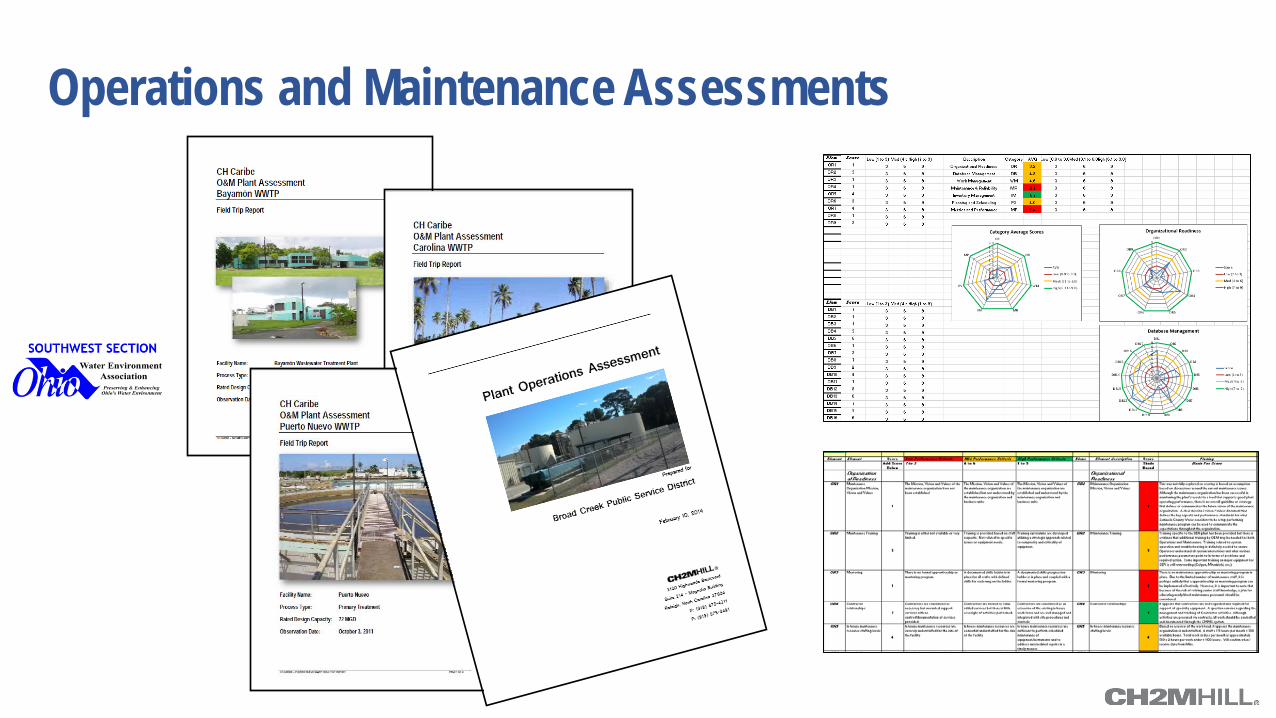
Operations and Maintenance Assessments
Reliability Best Practices Reliability Assessments: Understanding Redundancy
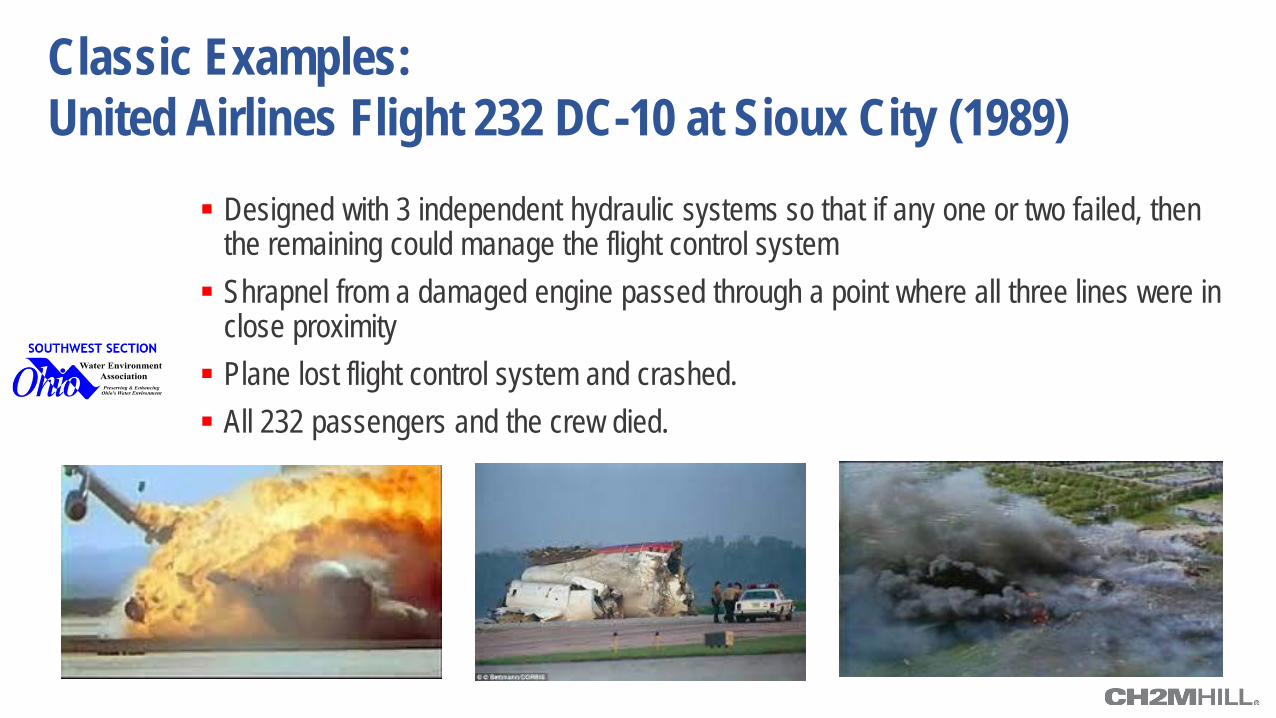
Classic Examples: United Airlines Flight 232 DC-10 at Sioux City (1989)
Designed with 3 independent hydraulic systems so that if any one or two failed, then the remaining could manage the flight control system Shrapnel from a damaged engine passed through a point where all three lines were in
close proximity Plane lost flight control system and crashed. All 232 passengers and the crew died.
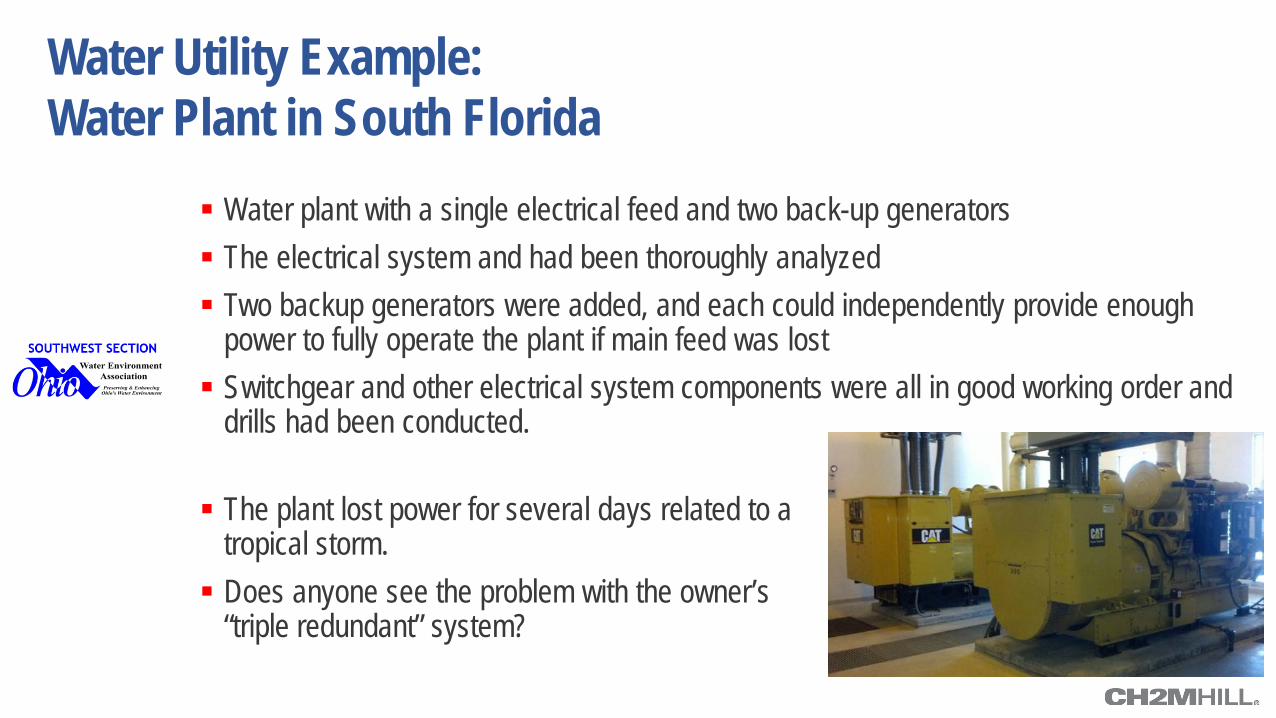
Water Utility Example: Water Plant in South Florida
Water plant with a single electrical feed and two back-up generators The electrical system and had been thoroughly analyzed Two backup generators were added, and each could independently provide enough
power to fully operate the plant if main feed was lost Switchgear and other electrical system components were all in good working order and
drills had been conducted.
The plant lost power for several days related to a tropical storm. Does anyone see the problem with the owner’s
“triple redundant” system?
Benefits of Redundancy
Central tenet of high reliability engineering for over 50 years Fundamental to the way we navigate what has been called the ‘risk society’ Ironically, when faced with reliability challenges and associated risks with early
computer systems, Jon von Neumann realized – radically – that a redundant system could be more reliable than its constituent parts. ‘Lens’ of redundancy allows us to see levels of reliability far beyond those that would
be visible in a laboratory or on paper Henry Petroski describes as a unifying foundation that ties together the many different
disciplines associated with any system.
Redundancy is the single most important tool for designing, implementing, and – importantly – proving reliability in all complex, safety-critical technologies.
Relationships Reliability, Redundancy, & Risk
Reliability is the probability that an item will perform its intended function for a specified interval under stated conditions.1
Redundancy is the existence of more than one means for accomplishing a given
function. Each means of accomplishing the function need not necessarily be identical.1
Risk is the effect of uncertainty on objectives.2
• An effect is a deviation from the expected – positive and/or negative. • Objectives (and risk) have different aspects and can apply at different levels.
1 MIL-STD-721C (1981), O’Connor et al, American Society for Quality; 2 ISO 31000-2009, ANSI/ASSE Z690, ISO 55000-2014, ISO 9000-2015
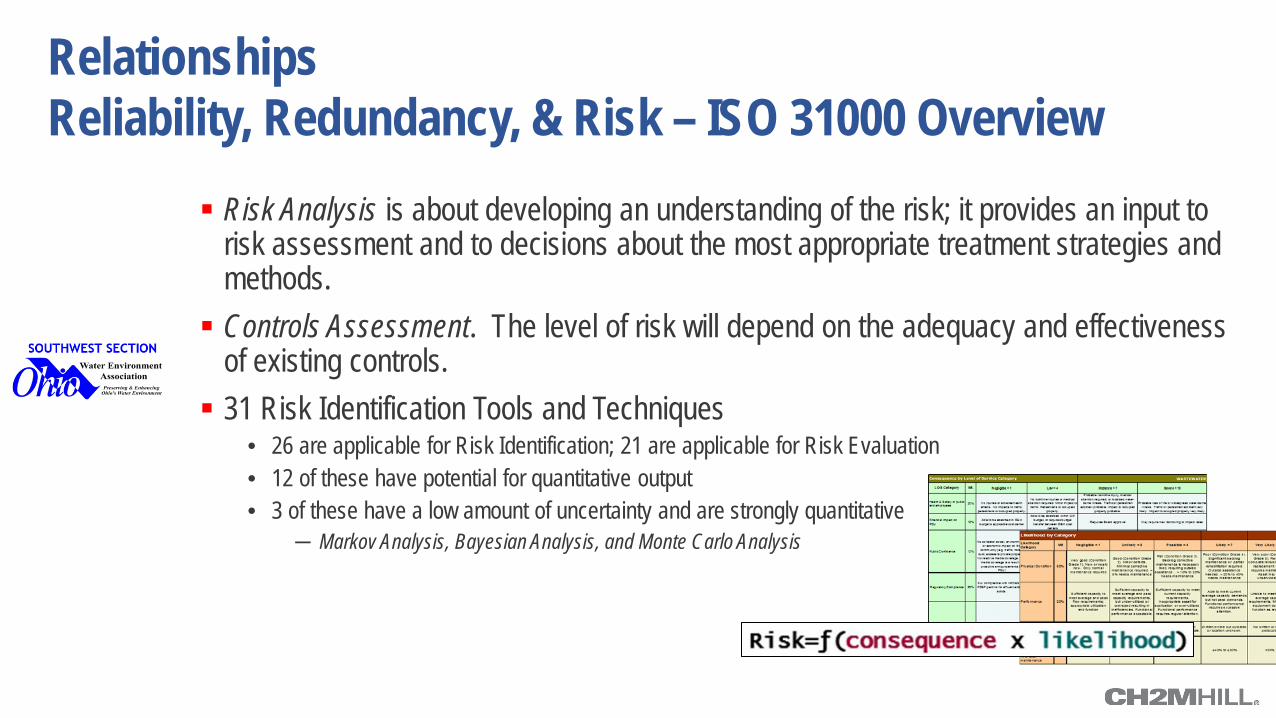
Relationships Reliability, Redundancy, & Risk – ISO 31000 Overview
Risk Analysis is about developing an understanding of the risk; it provides an input to risk assessment and to decisions about the most appropriate treatment strategies and methods. Controls Assessment. The level of risk will depend on the adequacy and effectiveness
of existing controls. 31 Risk Identification Tools and Techniques
• 26 are applicable for Risk Identification; 21 are applicable for Risk Evaluation • 12 of these have potential for quantitative output • 3 of these have a low amount of uncertainty and are strongly quantitative
─ Markov Analysis, Bayesian Analysis, and Monte Carlo Analysis
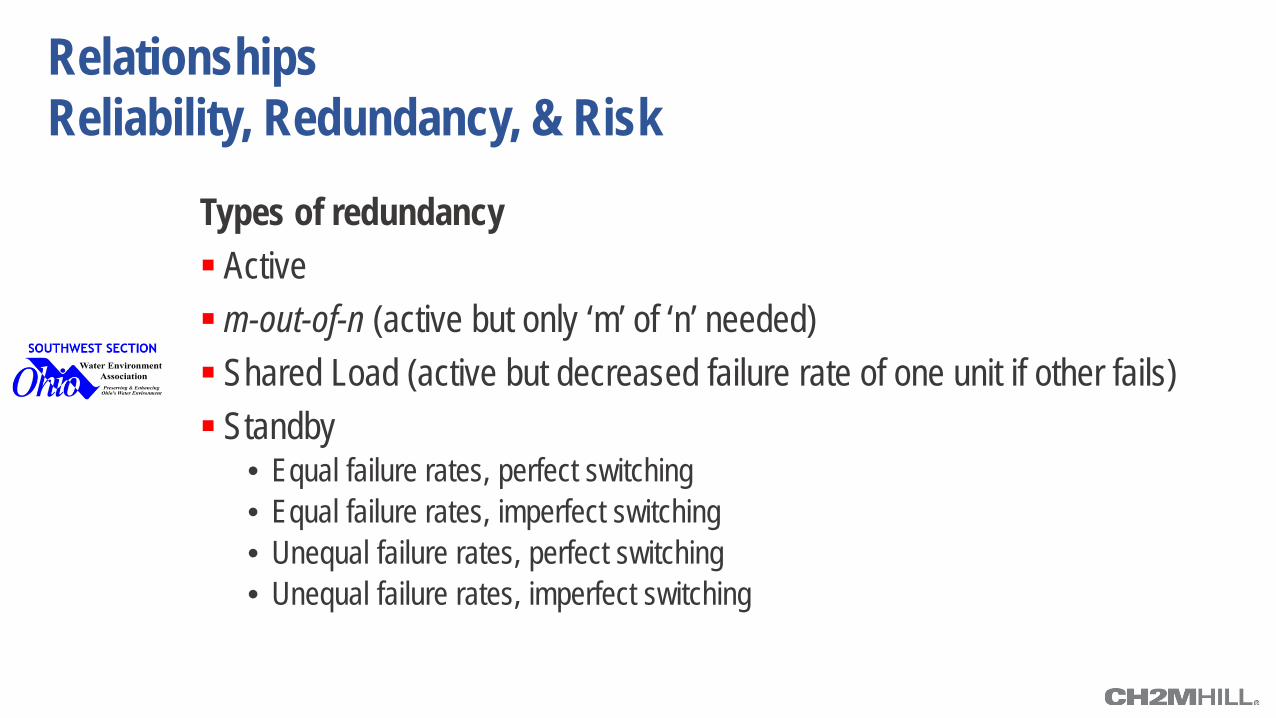
Relationships Reliability, Redundancy, & Risk
Types of redundancy Active m-out-of-n (active but only ‘m’ of ‘n’ needed) Shared Load (active but decreased failure rate of one unit if other fails) Standby
• Equal failure rates, perfect switching • Equal failure rates, imperfect switching • Unequal failure rates, perfect switching • Unequal failure rates, imperfect switching

Redundancy Examples
Splitter trough to two parallel primary treatment trains (Trains may be active parallel or standby)
Blowers or pumps or pipes (May be active parallel or standby)
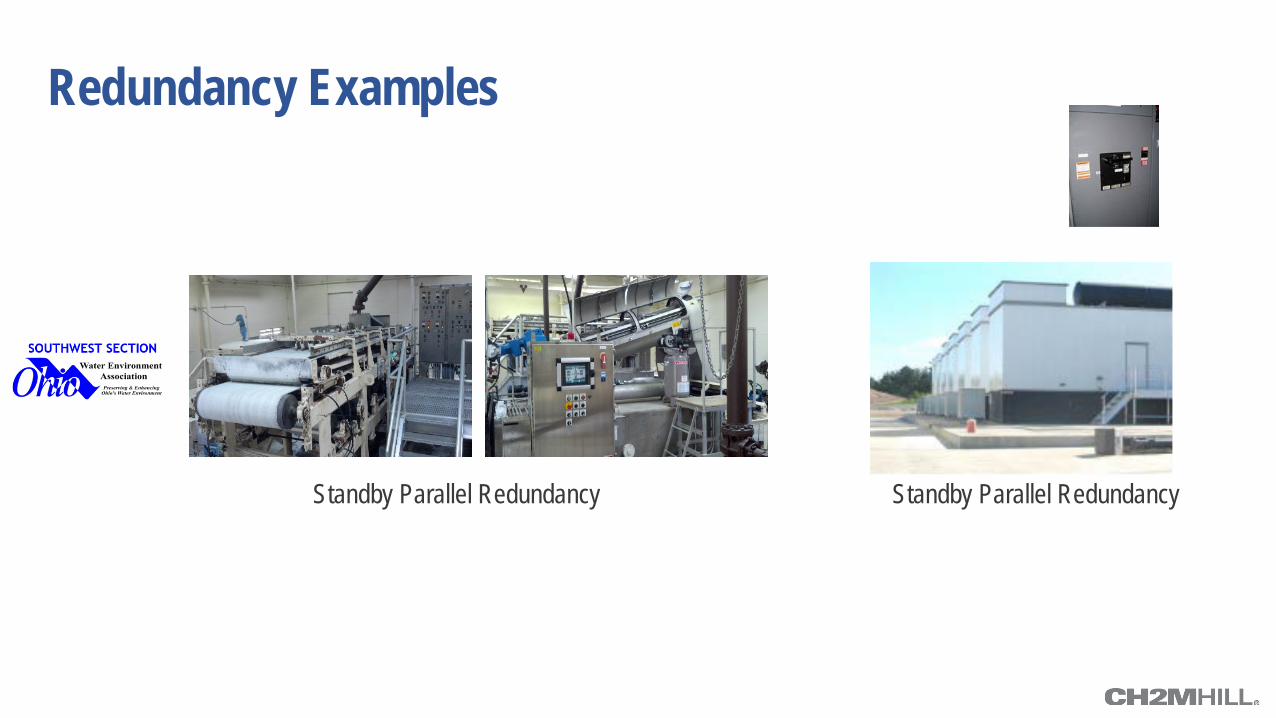
Redundancy Examples
Standby Parallel Redundancy Standby Parallel Redundancy
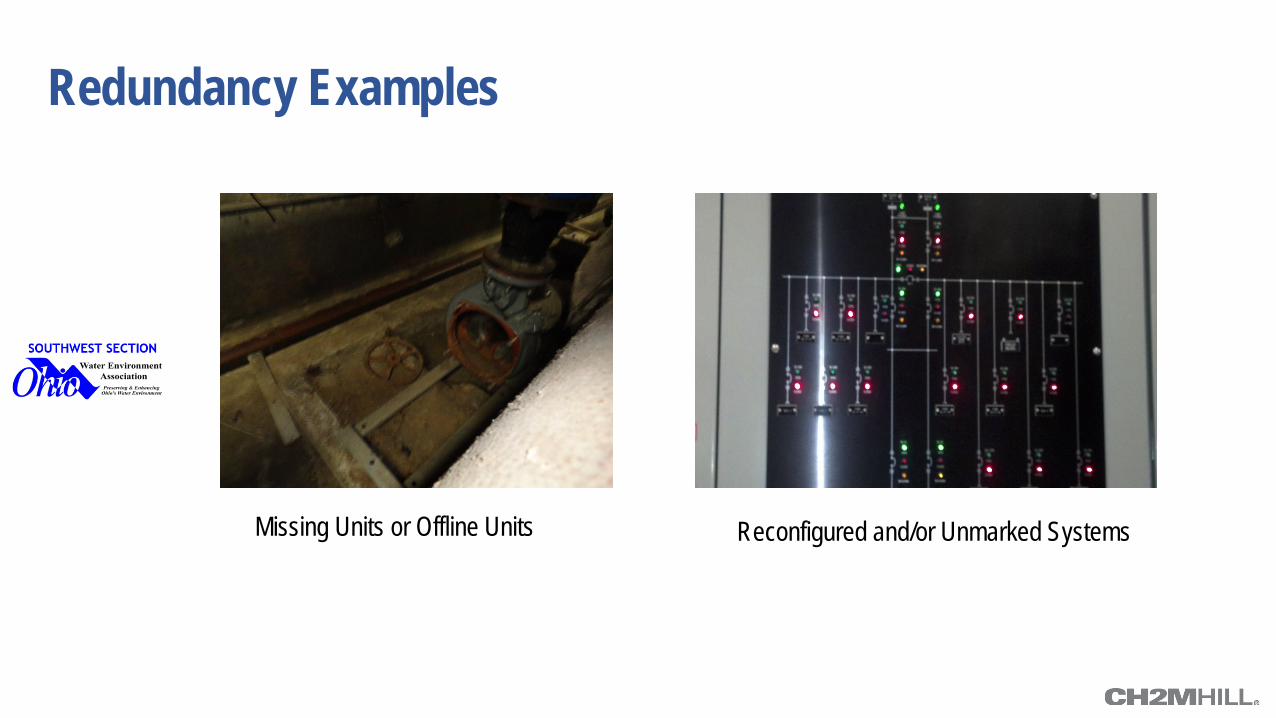
Redundancy Examples
Missing Units or Offline Units Reconfigured and/or Unmarked Systems
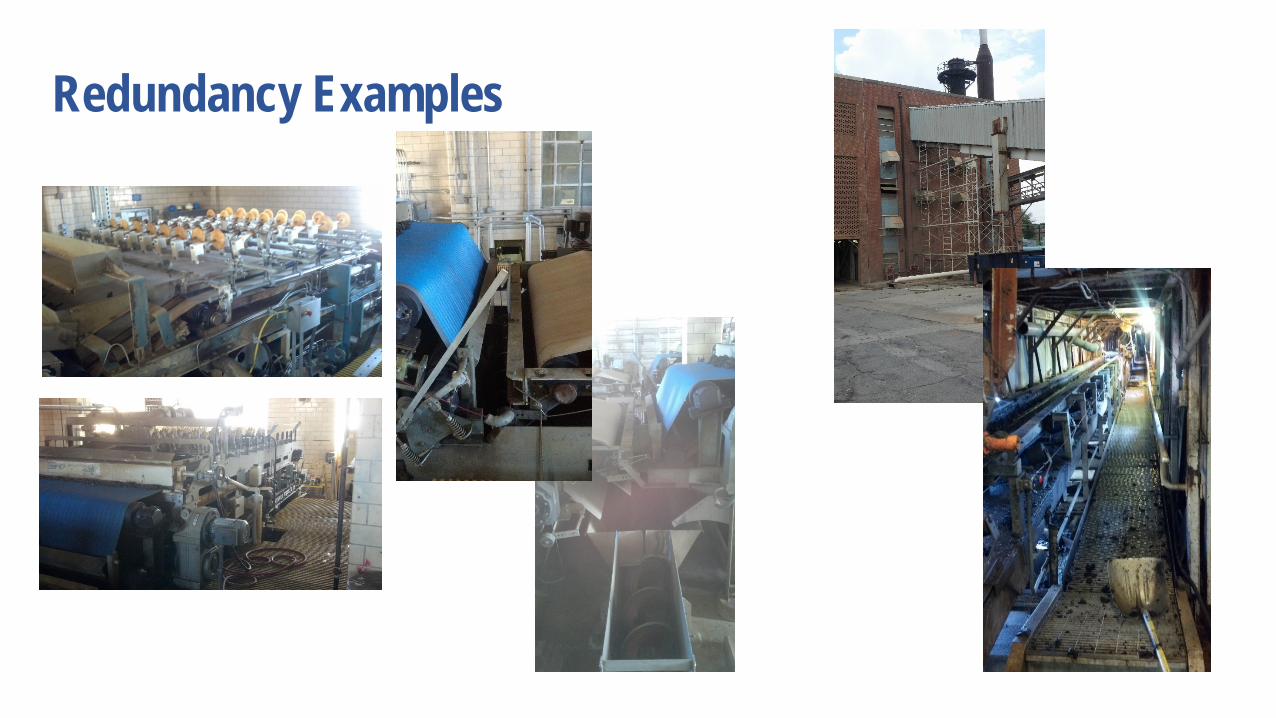
Redundancy Examples
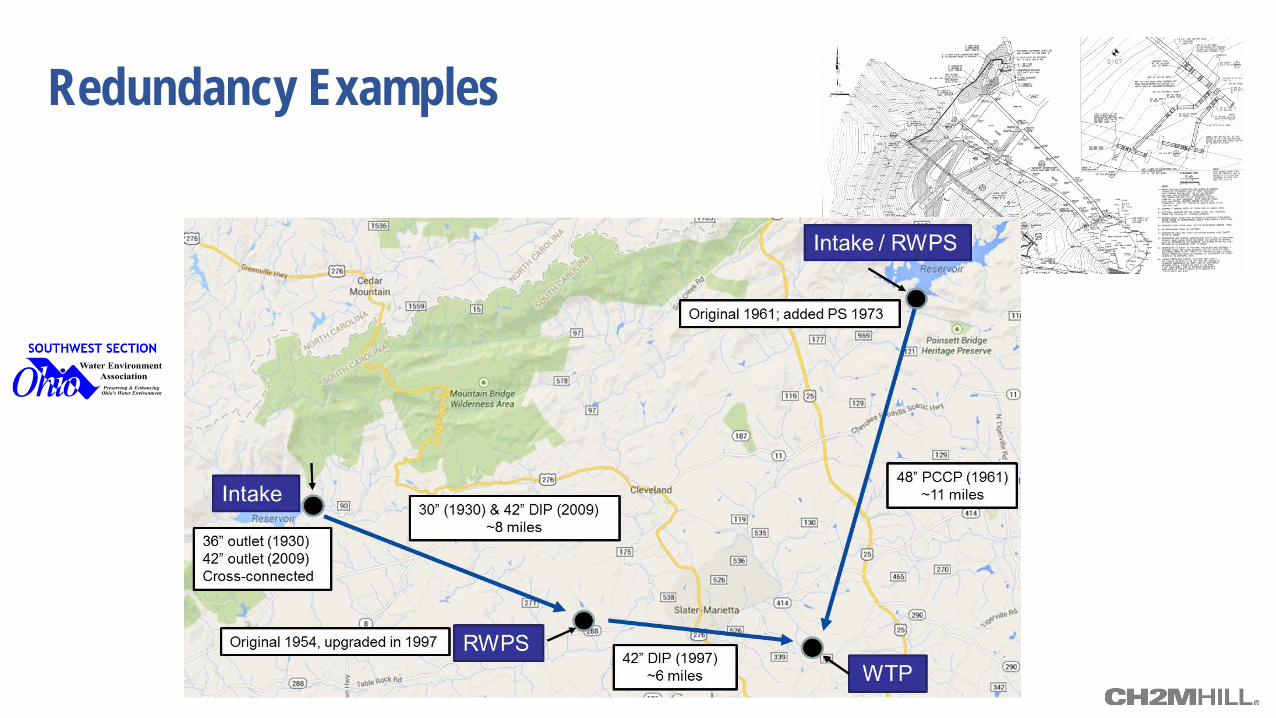
Redundancy Examples
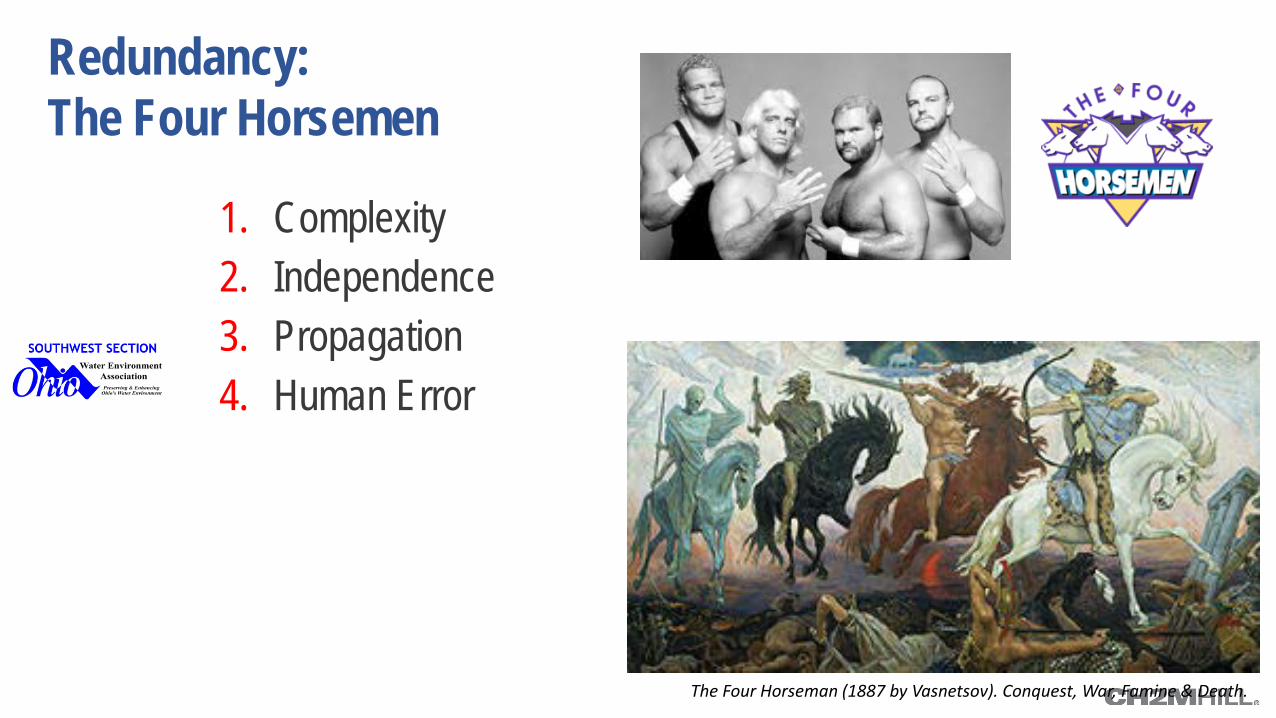
Redundancy: The Four Horsemen
1. Complexity 2. Independence 3. Propagation 4. Human Error
The Four Horseman (1887 by Vasnetsov). Conquest, War, Famine & Death.
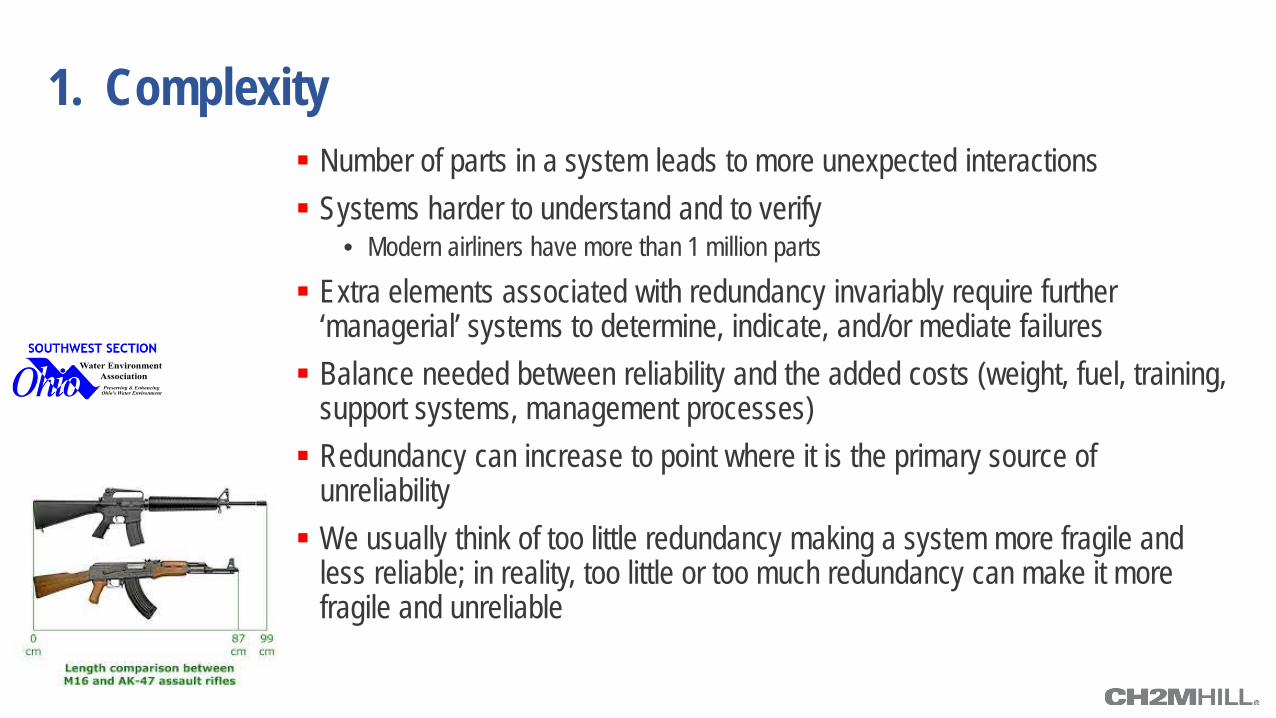
1. Complexity Number of parts in a system leads to more unexpected interactions Systems harder to understand and to verify
• Modern airliners have more than 1 million parts
Extra elements associated with redundancy invariably require further ‘managerial’ systems to determine, indicate, and/or mediate failures Balance needed between reliability and the added costs (weight, fuel, training,
support systems, management processes) Redundancy can increase to point where it is the primary source of
unreliability We usually think of too little redundancy making a system more fragile and
less reliable; in reality, too little or too much redundancy can make it more fragile and unreliable
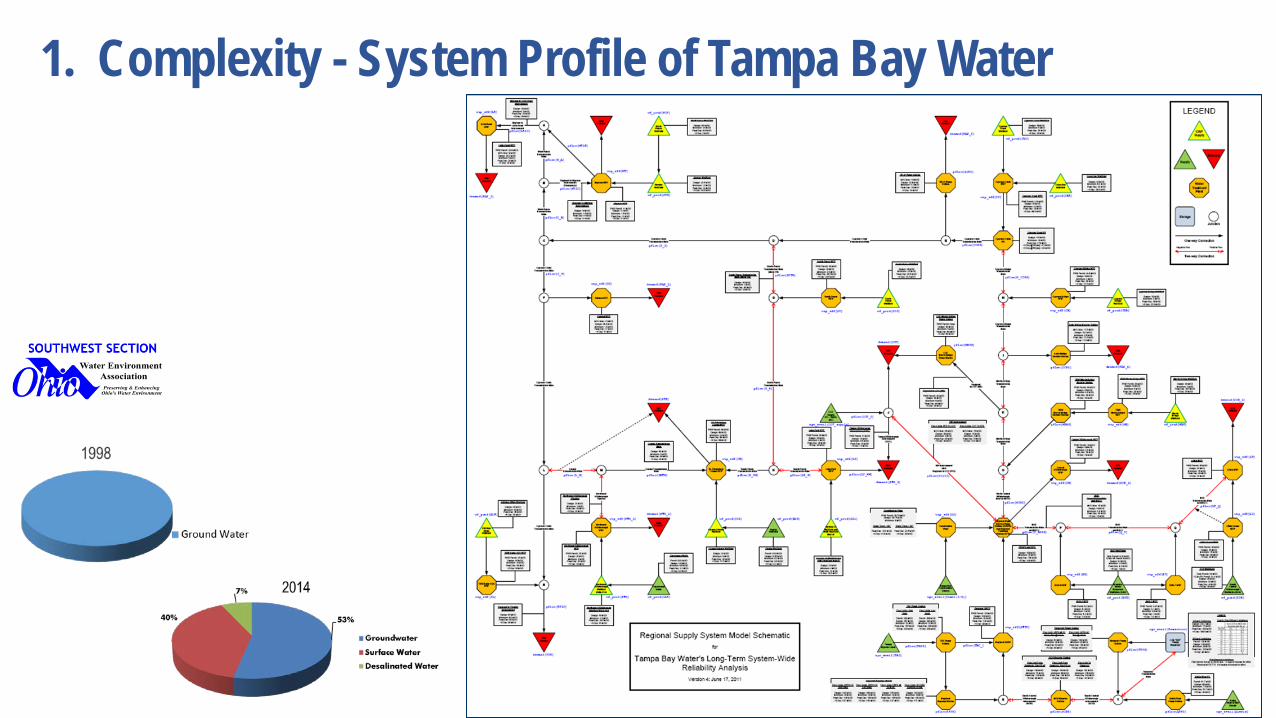
1. Complexity - System Profile of Tampa Bay Water
2. Independence
Many redundancy calculations assume that redundant systems behave completely independently of each other
• ‘Independent’ means that the chances of one failing are not linked in any way to the chances of the other failing
• This is frequently not the case ‘Identical’ elements will likely wear in similar ways and, consequently, fail at similar
times when they both operate simultaneously Most failures result from external pressures acting on a system. Redundant elements
in close proximity will likely face the same pressures at the same time. In this way, ‘operating environment’ can act as a source of interdependence
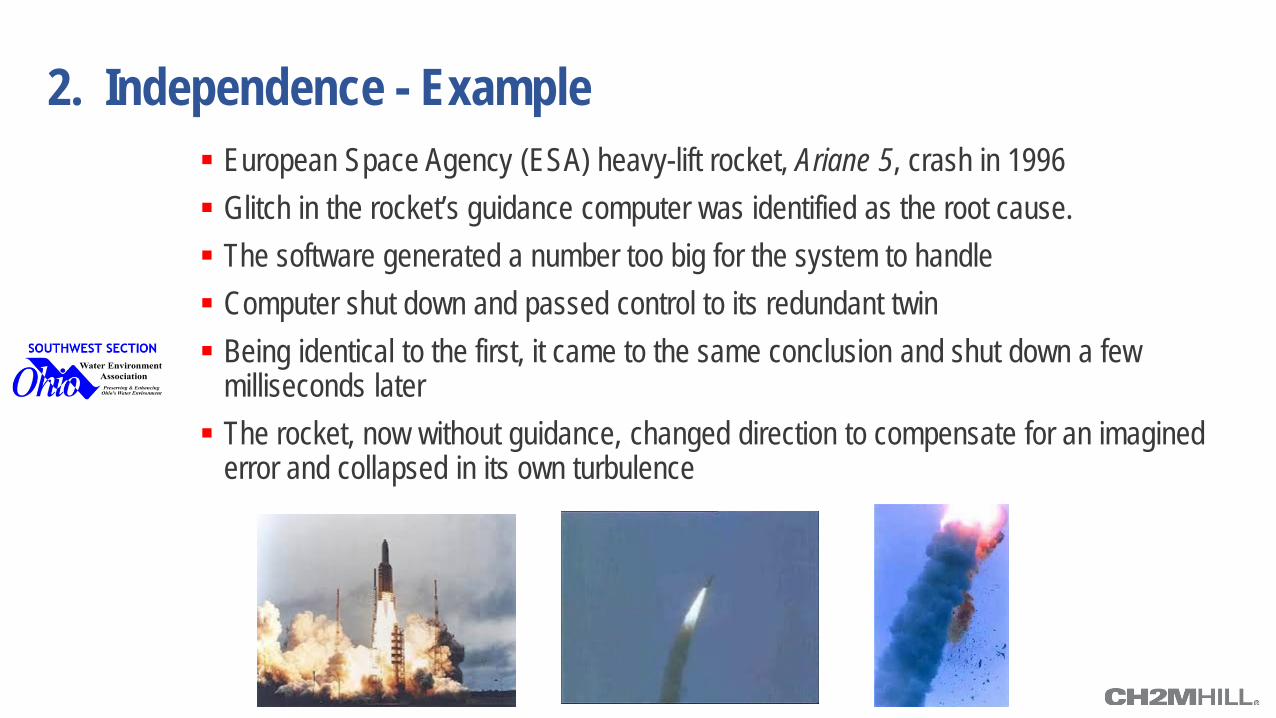
2. Independence - Example European Space Agency (ESA) heavy-lift rocket, Ariane 5, crash in 1996 Glitch in the rocket’s guidance computer was identified as the root cause. The software generated a number too big for the system to handle Computer shut down and passed control to its redundant twin Being identical to the first, it came to the same conclusion and shut down a few
milliseconds later The rocket, now without guidance, changed direction to compensate for an imagined
error and collapsed in its own turbulence
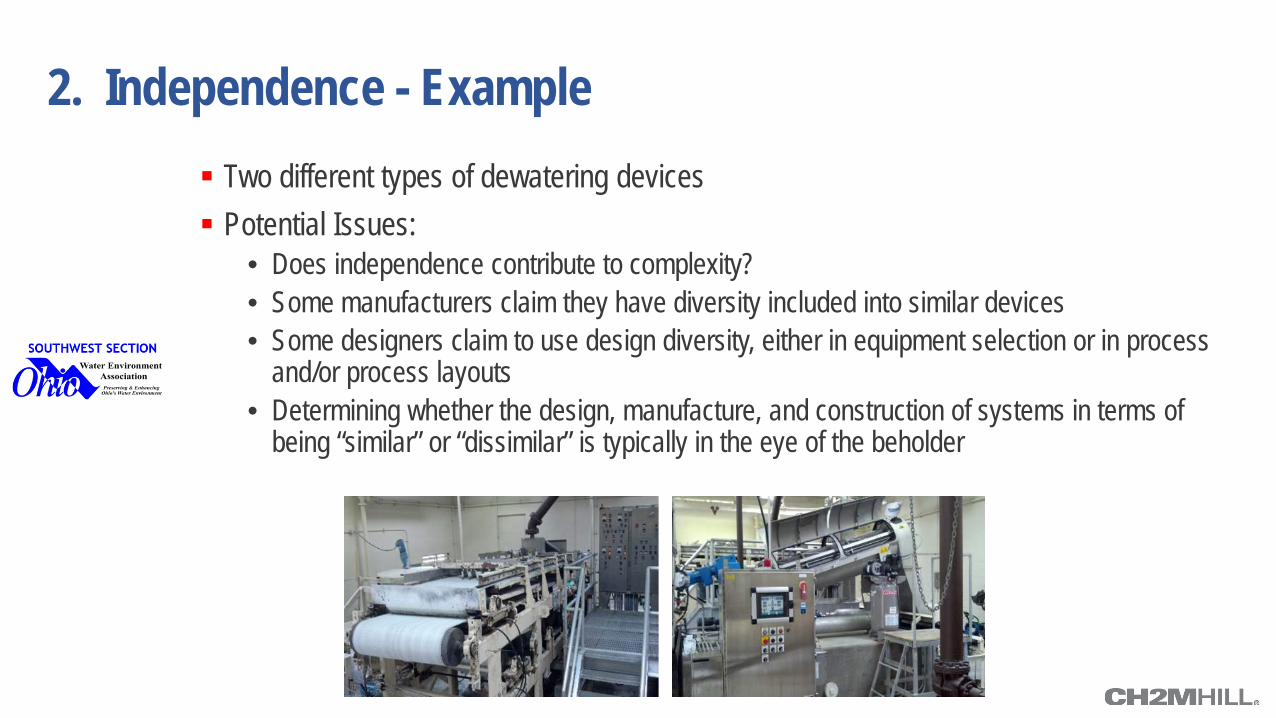
2. Independence - Example Two different types of dewatering devices Potential Issues:
• Does independence contribute to complexity? • Some manufacturers claim they have diversity included into similar devices • Some designers claim to use design diversity, either in equipment selection or in process
and/or process layouts • Determining whether the design, manufacture, and construction of systems in terms of
being “similar” or “dissimilar” is typically in the eye of the beholder
3. Propagation
It is often difficult to predict how things will fail, especially in service An item may fail ‘open’ rather than ‘closed’, thus impacting the stresses on other systems
• Accelerometers in cars or planes • Accuators and valves in water/wastewater systems
The unexpected catastrophic failure of an upstream system may wipe out a downstream system
• Boeing claims 777 is safer because it has two engines rather than four engines
An unexpected failure mode or effect in an upstream system may unexpectantly impact the performance of downstream systems A majority of fatal accidents involve unanticipated chains of failures, where the failure of
one element propagates to others in what the NTSB call a ‘cascade’ (NAS 1980: 41)
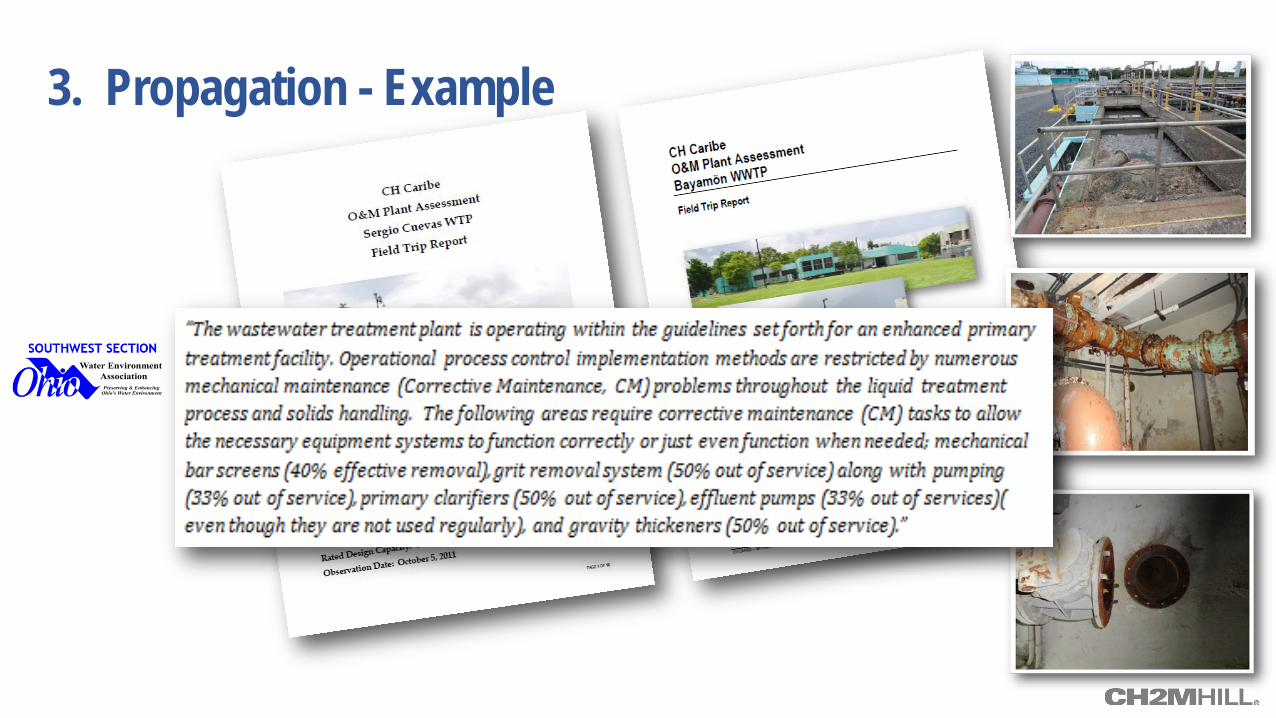
3. Propagation - Example
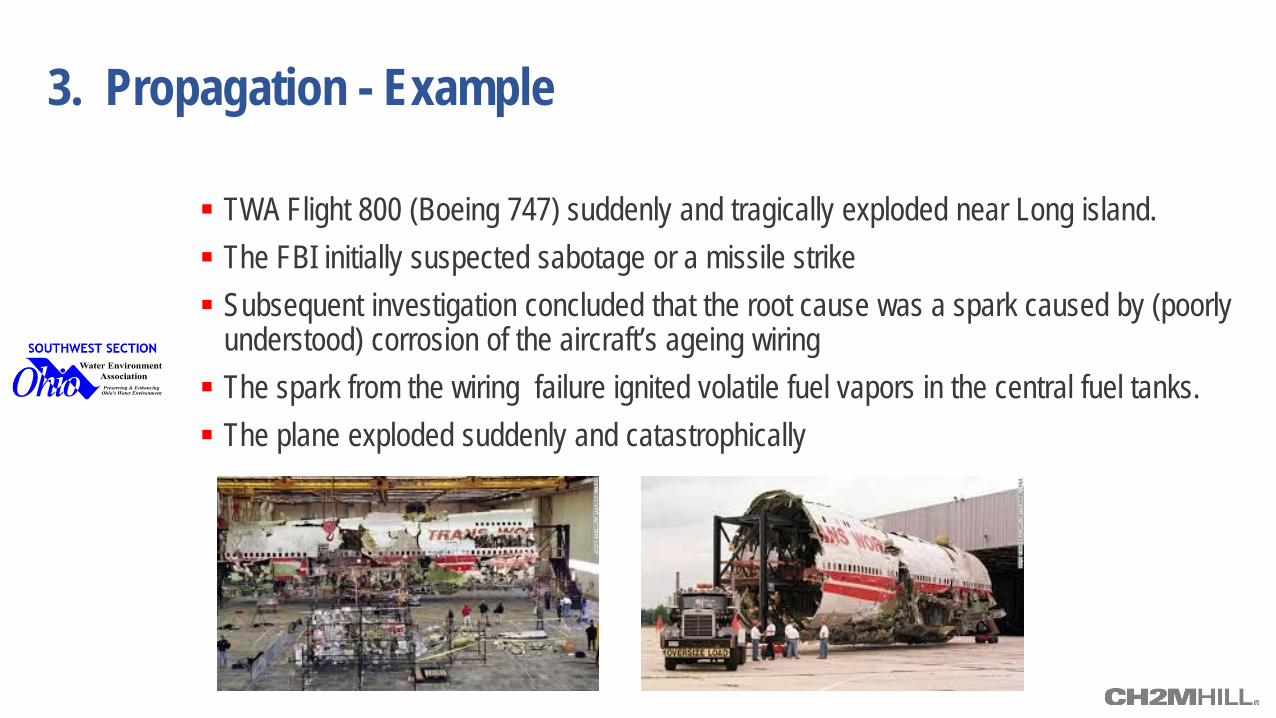
TWA Flight 800 (Boeing 747) suddenly and tragically exploded near Long island. The FBI initially suspected sabotage or a missile strike Subsequent investigation concluded that the root cause was a spark caused by (poorly
understood) corrosion of the aircraft’s ageing wiring The spark from the wiring failure ignited volatile fuel vapors in the central fuel tanks. The plane exploded suddenly and catastrophically
3. Propagation - Example
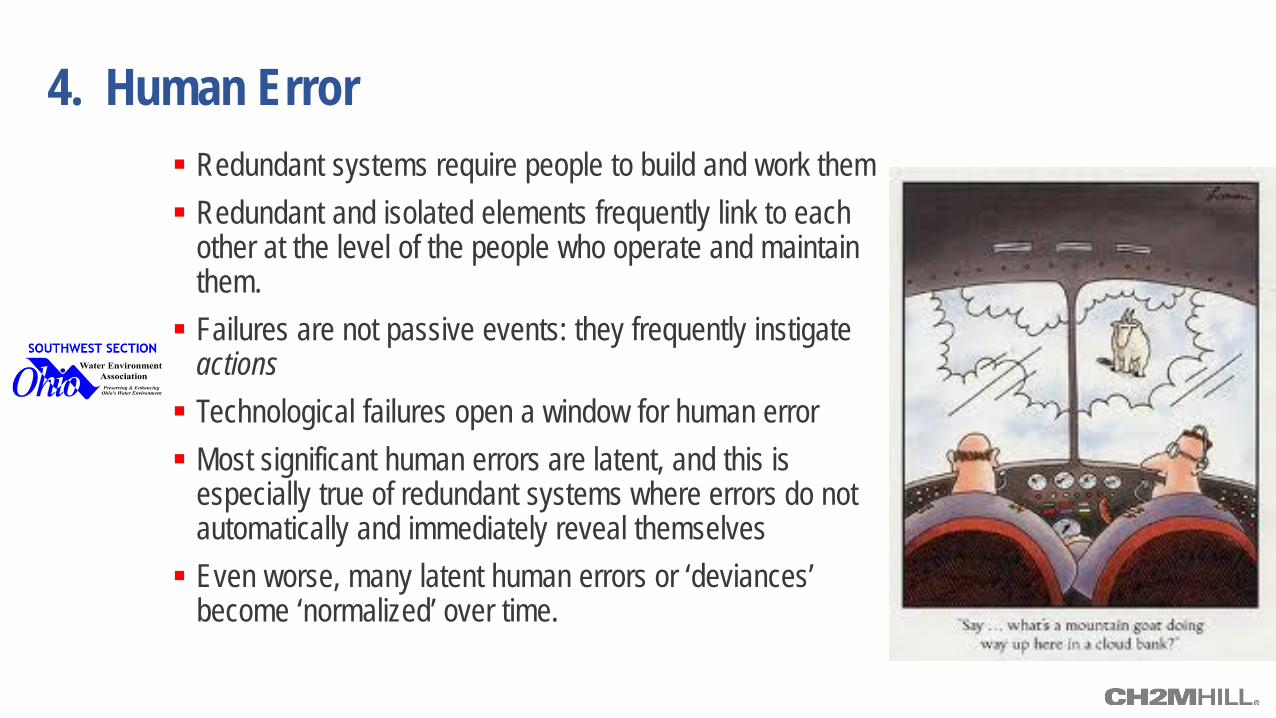
4. Human Error Redundant systems require people to build and work them Redundant and isolated elements frequently link to each
other at the level of the people who operate and maintain them. Failures are not passive events: they frequently instigate
actions Technological failures open a window for human error Most significant human errors are latent, and this is
especially true of redundant systems where errors do not automatically and immediately reveal themselves Even worse, many latent human errors or ‘deviances’
become ‘normalized’ over time.
4. Human Error
A closely linked dimension of redundancy, and hard to quantify, is ‘overcompensation’
• The extra security that redundancy offers can lead people to act less cautiously. • In some case, humans compensate for lower risks in one area by taking greater risks in another due to
where the perceive redundancy to be
Closely related to overcompensation is a tendency towards overconfidence • Humans may reduce the perceived need for things like safety, specification, and/or rigorous testing
Engineers realize that human reliability is a safety issue and a design problem • Many manufacturers invest much effort in making human-machine interfaces intuitive and error-tolerant • However, such efforts may come at their own cost in terms of overconfidence and morale
4. Human Error - Example
Eastern Airlines Flight 401 crashed just outside Miami (1972) Crew became so fixated with a faulty landing gear light that they failed to notice the
autopilot was disengaged They continued in their distraction until the aircraft smashed into the Everglades 101 of the 176 passengers were killed
National Transportation Safety Board (NTSB) estimates that 43 percent of fatal accidents involving commercial jetliners are initiated by pilot error (Lewis, 1990) A surprising number happen when pilots misread navigational instruments – usually
under stress – and fly into the ground. (Euphemistically known as Controlled Flight Into Terrain or CFIT). There were at least 43 CFIT incidents involving large commercial jets in the decade
between 1992-2002 (Flight Safety Foundation 2004).
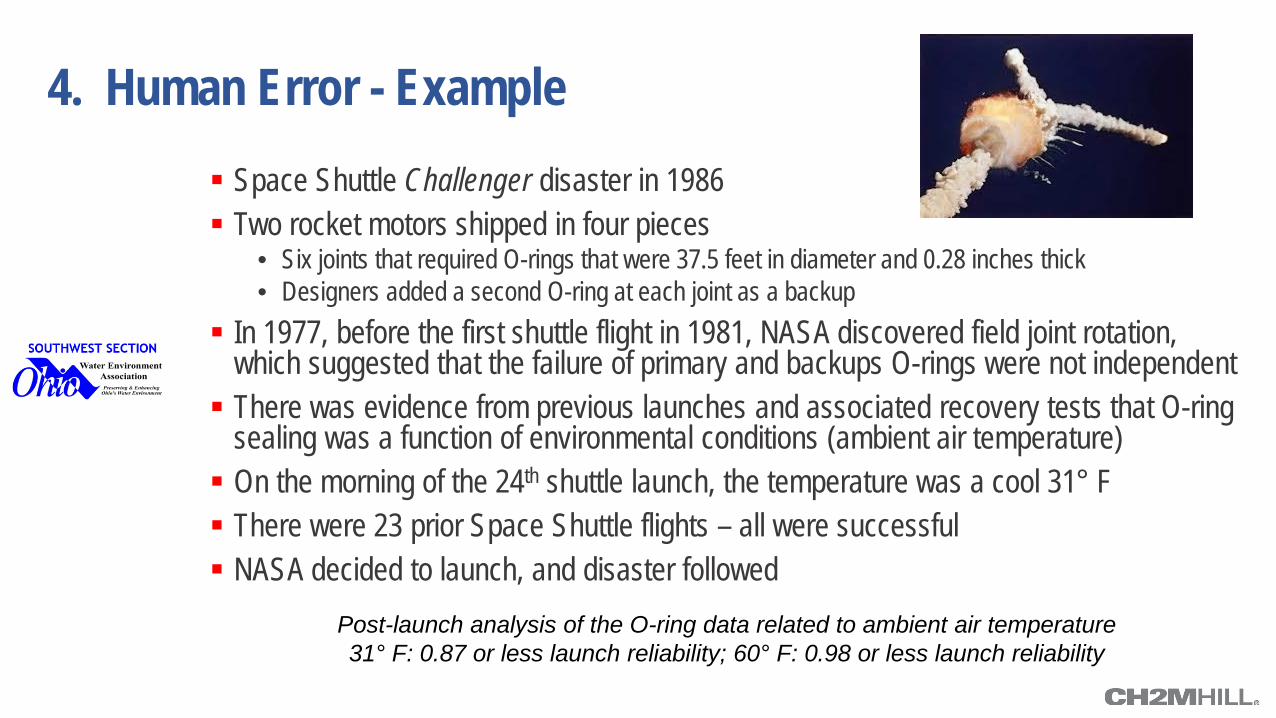
4. Human Error - Example Space Shuttle Challenger disaster in 1986 Two rocket motors shipped in four pieces
• Six joints that required O-rings that were 37.5 feet in diameter and 0.28 inches thick • Designers added a second O-ring at each joint as a backup
In 1977, before the first shuttle flight in 1981, NASA discovered field joint rotation, which suggested that the failure of primary and backups O-rings were not independent There was evidence from previous launches and associated recovery tests that O-ring
sealing was a function of environmental conditions (ambient air temperature) On the morning of the 24th shuttle launch, the temperature was a cool 31° F There were 23 prior Space Shuttle flights – all were successful NASA decided to launch, and disaster followed
Post-launch analysis of the O-ring data related to ambient air temperature 31° F: 0.87 or less launch reliability; 60° F: 0.98 or less launch reliability
Summary Thoughts on Redundancy
1. Redundancy is not all the same 2. We must first understand redundancy before we can accurately estimate
the “likelihood of failure” 3. Managing assets depends on understanding redundancy and reliability 4. Human error will always have a huge impact on redundancy, reliability, and
risk – training and business process improvement is extremely important 5. Reliability assessments are essential for saving resources, identifying
weak points, meeting levels of service, and understanding risks
One Last Thing!
Closing Thought Preventative Maintenance Optimization & Reliability Best Practices
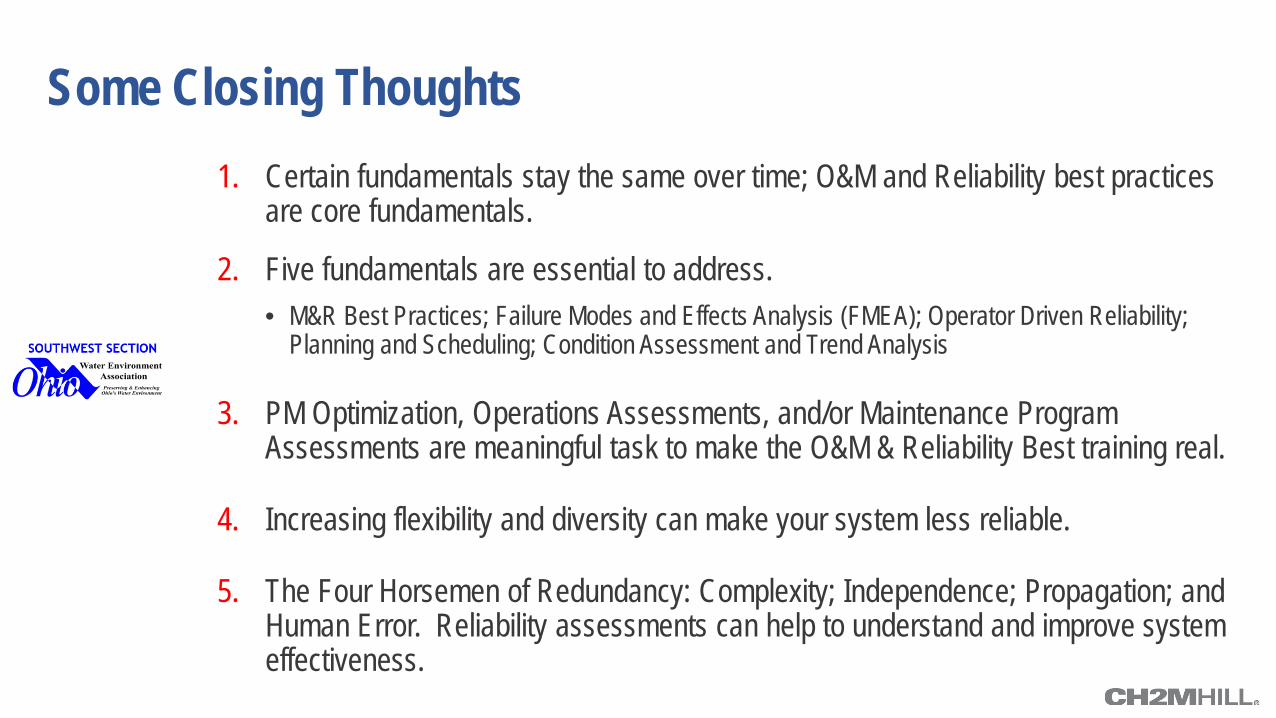
Some Closing Thoughts 1. Certain fundamentals stay the same over time; O&M and Reliability best practices
are core fundamentals.
2. Five fundamentals are essential to address. • M&R Best Practices; Failure Modes and Effects Analysis (FMEA); Operator Driven Reliability;
Planning and Scheduling; Condition Assessment and Trend Analysis
3. PM Optimization, Operations Assessments, and/or Maintenance Program Assessments are meaningful task to make the O&M & Reliability Best training real.
4. Increasing flexibility and diversity can make your system less reliable.
5. The Four Horsemen of Redundancy: Complexity; Independence; Propagation; and Human Error. Reliability assessments can help to understand and improve system effectiveness.

WBG052114205536FLL
PREVENTATIVE MAINTENANCE OPTIMIZATION & RELIABILITY BEST PRACTICES SWOWEA PLANT OPERATIONS SEMINAR MASON, OH NOVEMBER 20, 2014 JD SOLOMON, PE, CRE, CMRP