Embed Size (px)
Citation preview
SRI International 1100 Wilson Boulevard, Suite 2800 ■ Arlington, VA 22209-3915 ■ 703-524-2053
®
• May 2003
Effects of Using Instructional Technology in Elementary and Secondary Schools: What Controlled Evaluation Studies Say Final Report
Prepared by: James A. Kulik Consultant to SRI International SRI Project Number P10446.001
This literature review was prepared by James A. Kulik of the University of Michigan, as a consultant to the Science and Technology Policy Program of SRI International, Arlington, Virginia.
Funding was provided by the National Science Foundation. Any opinions, findings, and conclusions or recommendations expressed in this material are those of the author and do not necessarily reflect the views of the National Science Foundation.
This report and related issue briefs are available at: http://www.sri.com/policy/csted/reports/sandt/it
Copyright © 2003 SRI International
Questions or comments may be addressed to:
James Kulik, at [email protected], or
Lori Thurgood, at [email protected]
ii
Contents
CONTENTS ........................................................................................................................................... II
TABLES................................................................................................................................................. III
EXECUTIVE SUMMARY ...................................................................................................................... IV
INTRODUCTION.................................................................................................................................... 1
BACKGROUND AND METHODS.......................................................................................................... 6
INTEGRATED LEARNING SYSTEMS ................................................................................................ 16
LEARNING TO READ BY WRITING ................................................................................................... 27
READING MANAGEMENT.................................................................................................................. 34
WORD PROCESSING AND COMPUTER ENRICHMENT ................................................................. 39
MICROCOMPUTER–BASED LABORATORIES ................................................................................. 47
TUTORIALS AND SIMULATIONS....................................................................................................... 52
CONCLUSION ..................................................................................................................................... 60
REFERENCES..................................................................................................................................... 62
iii
Tables
Table 1. Achievement effect sizes for computer-based applications of different types at different instructional levels, as reported in 8 meta-analytic studies published before 1990 .............. 8
Table 2. Achievement effect sizes for 6 types of computer-based applications, calculated from evaluation studies published before 1990 ........................................................................... 10
Table 3. Achievement effects for 8 categories of instructional innovations, calculated from meta-analytic reports published before 1990................................................................................ 12
Table 4. Number of evaluation studies reviewed in this report, by program type.............................. 15 Table 5. Study features and effect sizes in 7 evaluation reports on integrated learning systems
(ILSs) in mathematics .......................................................................................................... 18 Table 6. Study features and effect sizes in 9 evaluation reports on integrated learning systems
(ILSs) in mathematics and reading...................................................................................... 21 Table 7. Study features and effect sizes in 12 evaluation reports on Writing to Read (WTR) .......... 29 Table 8. Study features and effect sizes in 6 evaluation reports on the Accelerated Reader (AR)
reading management program ............................................................................................ 36 Table 9. Study features and effect sizes in 10 reports on word processing and computer enrichment
effects on student writing ..................................................................................................... 43 Table 10. Study features and effect sizes in 8 evaluation reports on microcomputer-based
laboratories (MBLs) ............................................................................................................. 49 Table 11. Study features and effect sizes in 9 evaluation reports on computer tutorials ................... 54 Table 12. Study features and effect sizes in 6 evaluation reports on computer simulations.............. 57
iv
Executive Summary
Access to technology has grown rapidly in American schools during the last decade. Today, nearly all schools own computers and have access to Internet resources, and students are using school computers in more ways than ever before. And yet controversy still swirls around the use of computers in schools. At the eye of the storm are questions about effectiveness. Are schools doing a better job because of their embrace of technology? Can schools improve their teaching effectiveness by investing more heavily in technology? How can schools best use technology? Questions spring up on all sides.
To answer these questions, this report reviews findings from controlled evaluations of technology applications in elementary and secondary schools. Not reviewed in this report are theoretical works, case studies, policy and cost analyses, and other studies that investigate learning processes or social dimensions of technology without measuring learning outcomes. The report uses two different review methods for the literature covered, one method for evaluation studies published since 1990 and another for earlier evaluation studies. Reviewers have not often visited the instructional technology literature of the 1990s, and they have not yet given the studies from this decade the careful scrutiny they deserve. This report, therefore, provides information on features and results in studies published since 1990 located through computer searches of library databases. There is little need, however, to take a magnifying glass to the evaluation literature of the 1970s and 1980s. More than a dozen individuals or groups have already written reviews of this literature, and these reviews provide a firm ground for conclusions about evaluation results of the 1970s and 1980s. Overall, therefore, this report focuses on studies published since 1990 and on reviews of studies published before 1990.
Like most recent reviews on technology applications in education, this report uses effect-size measures to summarize findings. An effect size specifies the number of standard deviation units separating the outcome scores of treatment and control groups in a study. Effect sizes can therefore be used to express results from different studies on a single uniform scale of effectiveness. Effect sizes may be positive or negative. An effect size is positive when the treatment group in a study outperforms the control group, and it is negative when the control group comes out on top. Effect sizes of around 0.2 are usually considered to be small, 0.5 to be moderate, and 0.8 to be large in size (Cohen, 1977). When effect sizes in education are above 0.25, results are considered large enough to be educationally meaningful (Slavin, 1990a).
Reading Reviewed in this report are 27 controlled evaluation studies on instructional technology
and reading. The 27 studies focused on three major applications of technology to reading instruction: (a) integrated learning systems; (b) writing-based reading programs; and (c) reading management programs.
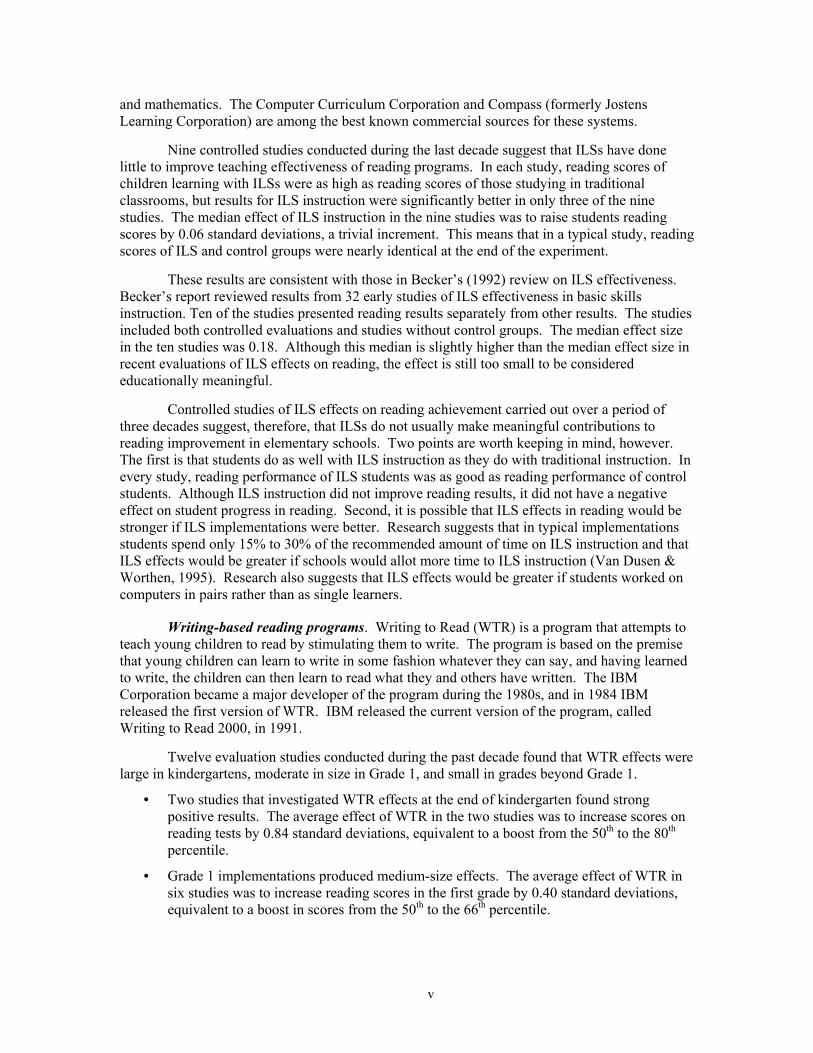
Integrated learning systems. The term integrated learning system (ILS) is used to describe software programs that provide sequential instruction for students over several grades while keeping extensive records of student progress. Most ILS programs use tutorial instruction as a basic teaching methodology, and most provide instruction in the basic skill areas of reading
v
and mathematics. The Computer Curriculum Corporation and Compass (formerly Jostens Learning Corporation) are among the best known commercial sources for these systems.
Nine controlled studies conducted during the last decade suggest that ILSs have done little to improve teaching effectiveness of reading programs. In each study, reading scores of children learning with ILSs were as high as reading scores of those studying in traditional classrooms, but results for ILS instruction were significantly better in only three of the nine studies. The median effect of ILS instruction in the nine studies was to raise students reading scores by 0.06 standard deviations, a trivial increment. This means that in a typical study, reading scores of ILS and control groups were nearly identical at the end of the experiment.
These results are consistent with those in Becker’s (1992) review on ILS effectiveness. Becker’s report reviewed results from 32 early studies of ILS effectiveness in basic skills instruction. Ten of the studies presented reading results separately from other results. The studies included both controlled evaluations and studies without control groups. The median effect size in the ten studies was 0.18. Although this median is slightly higher than the median effect size in recent evaluations of ILS effects on reading, the effect is still too small to be considered educationally meaningful.
Controlled studies of ILS effects on reading achievement carried out over a period of three decades suggest, therefore, that ILSs do not usually make meaningful contributions to reading improvement in elementary schools. Two points are worth keeping in mind, however. The first is that students do as well with ILS instruction as they do with traditional instruction. In every study, reading performance of ILS students was as good as reading performance of control students. Although ILS instruction did not improve reading results, it did not have a negative effect on student progress in reading. Second, it is possible that ILS effects in reading would be stronger if ILS implementations were better. Research suggests that in typical implementations students spend only 15% to 30% of the recommended amount of time on ILS instruction and that ILS effects would be greater if schools would allot more time to ILS instruction (Van Dusen & Worthen, 1995). Research also suggests that ILS effects would be greater if students worked on computers in pairs rather than as single learners.
Writing-based reading programs. Writing to Read (WTR) is a program that attempts to teach young children to read by stimulating them to write. The program is based on the premise that young children can learn to write in some fashion whatever they can say, and having learned to write, the children can then learn to read what they and others have written. The IBM Corporation became a major developer of the program during the 1980s, and in 1984 IBM released the first version of WTR. IBM released the current version of the program, called Writing to Read 2000, in 1991.
Twelve evaluation studies conducted during the past decade found that WTR effects were large in kindergartens, moderate in size in Grade 1, and small in grades beyond Grade 1.
• Two studies that investigated WTR effects at the end of kindergarten found strong positive results. The average effect of WTR in the two studies was to increase scores on reading tests by 0.84 standard deviations, equivalent to a boost from the 50th to the 80th percentile.
• Grade 1 implementations produced medium-size effects. The average effect of WTR in six studies was to increase reading scores in the first grade by 0.40 standard deviations, equivalent to a boost in scores from the 50th to the 66th percentile.
vi
• Five studies examined WTR effects in grades beyond Grade 1. Two of the studies found strong positive WTR effects, but three studies reported small or trivial effects. The median effect of WTR in the five studies was to increase reading scores by 0.25 standard deviations, equivalent to a boost in scores from the 50th to the 60th percentile.
A very different picture emerged from a review of WTR evaluations conducted a decade ago by Slavin (1990a). Slavin examined 21 studies of kindergarten effects, 13 studies of Grade 1 effects, and 4 follow-up studies of effects beyond Grade 1. The review was notable for its lack of positive conclusions. Overall, Slavin found no credible evidence for WTR effects in kindergartens, in first grades, or in grades beyond first.
It is impossible to say with certainty why early and later evaluation results on WTR differ so strikingly. One possibility is that later implementations of WTR were more adequate than earlier implementations. Another possibility is that later evaluations were better designed and analyzed. Whatever the explanation for the failure to find strong results in early evaluations of WTR, the fact remains that WTR has a good record of effectiveness in recent evaluation studies.
Reading management programs. Reading management programs, such as Accelerated Reader (AR), help students make book selections and then test the students on their understanding of what they have read. Evaluators have carried out both statewide correlational studies and controlled studies of AR during the past decade.
Three statewide correlational studies showed that reading scores were higher at schools that owned AR. The three studies examined reading scores in (a) 6000 schools in Texas; (b) 740 schools in Tennessee; and (c) 500 schools in Illinois. The significant correlation between AR-ownership and reading achievement does not prove that use of AR causes reading scores to go up. Mathematics and science scores were also higher at AR-owning schools, and so it is possible that some other factor produced the correlation between AR-ownership and school achievement. For example, AR purchases might be more frequent and test scores higher at schools with high parental involvement.
Results of three controlled comparisons, however, also suggest that AR has positive effects on students’ reading development. One of the studies found a strong AR effect; one found a moderate-size effect; and one found a trivial effect. Median AR effect in the three studies was an increase in reading test scores of 0.43 standard deviations, equivalent to an increase from the 50th to the 67th percentile. These results suggest that AR helps students improve their reading skills, but the results are not conclusive. Too few controlled studies of AR are available for firm conclusions, and further controlled evaluation studies of AR are needed.
Writing Also reviewed in this report are 12 controlled studies of technology effects on student
writing. The 12 studies fall into three categories: (a) word processing studies; (b) studies of computer writing prompts; and (c) studies of computer enrichment.
Word processing. Studies of word processing effects on writing began to appear in the education literature during the 1980s. In a typical study, students in an experimental group wrote their compositions on word processors while control students wrote with paper and pencil. After several months of this experimental treatment, students in both groups wrote compositions under common conditions.
vii
In 1993 Bangert-Drowns wrote the first meta-analytic review of studies of word processing. The review covered 20 studies of overall writing quality. Ten of these studies were conducted in elementary and secondary schools. The median effect of word processing in these 10 studies was an increase in ratings of writing quality of 0.28 standard deviations. Four evaluation studies from the past decade also examined word processing effects on writing skills. In three out of the four studies, word processing produced significant positive effects on student writing skills. In the remaining study, however, writing with word processors had a significant negative effect on student writing skills. The median effect in the four studies was to increase writing skill, as measured by ratings of quality of their compositions, by 0.30 standard deviations.
For two decades, then, evaluation studies have been reporting that students who use word processors for writing compositions demonstrate superior writing skills in later follow-up tests of writing skills. Still, word processing effects are usually small. In a typical study, word processing raises writing scores by around 0.3 standard deviations, equivalent to an increase from the 50th to the 62nd percentile. In addition, increases in writing skill are not an invariable effect of word processor use. Overall, therefore, schools have usually, but not always, helped students to develop better writing skills by teaching them to write their compositions with word processors.
Computer writing prompts. Researchers have modified standard word processing programs to provide writing prompts while students are composing with the programs. The prompts may focus on writing mechanics, or they may provide guidance in development of new ideas. In his 1993 review of word processing research, Bangert-Drowns described two studies that suggested that these processing-plus-prompting programs might be more useful in instruction than standard word processing programs are. Both studies found positive effects from prompting, and Bangert-Drowns concluded that prompts could amplify the benefits of ordinary word processing.
Two studies carried out during the past decade advanced our knowledge of computer writing prompts. In one of the studies, students who received unsolicited prompts wrote better essays than control students did, but students who received prompts only when they asked for them performed at the same level as control students. In the second study, students received prompts only when they asked for them and did not improve in writing skill as a result of prompting. Together, the studies suggest that the effectiveness of writing prompts may depend on how the writing prompts are presented. Prompting seems to be effective when students receive unsolicited writing prompts, but prompting seems to be ineffective when students must ask the computer for prompts. Clearly, more research is needed to confirm this conclusion.
Computer enrichment. Schools provide students with enriched computer access in a variety of ways. They may let students work on a variety of relatively unstructured exercises in the classroom, including games, simulations, and tutorial programs. Or they may extend student access to Internet resources, or they may provide students with anytime-anywhere laptop access to computers. A common goal in enrichment programs is to help students develop as writers by giving them more opportunities for authentic writing and research.
Evaluators seldom examined the effectiveness of programs of computer enrichment during the 1970s and 1980s. Out of 96 studies described in James A. Kulik’s (1994) review of the literature on instructional technology in elementary and secondary schools, only five examined effects of computer enrichment. In three of the studies, student test scores were lower in the group that had such computer access. The median effect of computer enrichment in the five studies was to decrease posttest scores by 0.14 standard deviations. An effect size of -0.14 is equivalent to a drop in test scores from the 50th to the 44th percentile.
Six studies conducted during the past decade, however, present a more favorable picture of computer-enriched instruction. Five out of the six studies found that computer enrichment
viii
helped students to improve their writing skills. In the remaining study, computer enrichment had a small, statistically significant, negative effect on student writing. The median effect size of computer enrichment programs in the six studies was an increase in writing scores of 0.34 standard deviations, equivalent to an increase from the 50th to the 63rd percentile.
Mathematics and Science Also reviewed in this report are 36 controlled studies of technology effects on
mathematics and science learning. The 36 studies covered computer applications in four areas: (a) integrated learning systems in mathematics; (b) computer tutorials; (c) computer simulations; and (d) microcomputer-based laboratories.
Integrated learning systems in mathematics. Sixteen controlled studies conducted during the last decade reported on the effectiveness of integrated learning systems (ILSs) in mathematics. Each of the 16 studies found that mathematics test scores were at least slightly higher in the group taught with an ILS, and in nine of the studies, the ILS effect was large enough to be considered both statistically significant and educationally meaningful. The median ILS effect in the 16 studies was to increase mathematics test scores by 0.38 standard deviations, or from the 50th to the 65th percentile.
In seven of the studies, students received ILS instruction in mathematics only; in the remaining nine studies, students received ILS instruction in both mathematics and reading. ILS effects were greater in the seven studies in which the ILSs were used exclusively for mathematics instruction. ILS effects were lower in the nine studies in which the ILSs were used for both mathematics and reading instruction. It seems possible that students received too little ILS instruction in mathematics when ILS instruction was split between reading and mathematics.
Becker’s 1992 review of studies of ILS effectiveness reported similar results. Becker’s report reviewed results from 32 early studies of ILS effectiveness in basic skills instruction. Eleven of the studies presented mathematics results separately from other findings. The median effect on mathematics achievement in these 11 studies was an increase in test scores of 0.40 standard deviations. An effect size of 0.40 is equivalent to an increase in test scores from the 50th to the 66th percentile. This median is virtually identical to the median ILS effect on mathematics tests in recent evaluations.
Computer tutorials. Teachers have been using computer tutorials in science instruction since the early 1970s. The tutorials usually focus on specific science topics taught in specific courses. These focused programs have proved to be effective in both earlier and more recent evaluation studies.
Six studies conducted during the past decade paint a positive picture of computer tutorials in the natural and social sciences. In all but one of the six cases, the effect of computer tutoring was large enough to be considered both statistically significant and educationally meaningful. In the remaining study, the boost from computer tutoring was near zero. In the median case, the effect of computer tutorials was to raise student achievement scores by 0.59 standard deviations, or from the 50th to the 72nd percentile. Tutorial effects on student attitudes toward instruction and subject matter were also strong and positive. In all cases, computer tutoring produced significant positive effects on attitudes. In the median study, the effect of computer tutorials was to raise attitude scores by 1.10 standard deviations.
Evaluation studies carried out during the 1970s and 1980s also found that computer tutoring has positive effects on student learning. A major meta-analytic review (J. Kulik, 1994), for example, reported that the average effect of computer tutorials was to raise student test scores
ix
by 0.36 standard deviations. This is equivalent to a boost in test scores from the 50th to the 64th percentile. These 58 studies included many evaluations of computer tutorials in mathematics and reading but very few evaluations of computer tutorials in science. Too few studies were available in science education, in fact, to warrant separate conclusions about the effectiveness of computer tutorials in natural and social sciences.
Computer simulations. Computer simulations provide science students with theoretical or simplified models of real-word phenomena—for example, a frictionless world where the laws of Newtonian physics are more apparent—and they invite students to change features of the models so that they can observe the results. Science teachers can use simulations to prepare students for future learning, to supplement or replace other expositions of a topic, or to help students integrate facts, concepts, and principles that they learned separately.
Many science educators consider simulation programs to be a real advance over tutorial programs because simulation programs seem to focus on higher-level instructional objectives. Early evaluation studies, however, provided little evidence of improved learning with simulations. A major meta-analytic review (J. Kulik, 1994) described six simulation studies carried out during the 1970s and 1980s, none of which found a significant positive effect from instructional simulations. Simulation results were negative as often as positive, and were small in size in each of the studies. The median effect size in the six studies was –0.06. This means that students learning with and without simulations scored at nearly identical levels on the relevant tests of science learning.
Six studies published since 1990 painted a more positive picture of simulation effects. Four of the studies found positive effects on student learning, and two studies found negative effects. In the median case, the effect of computer tutorials was to raise student achievement scores by 0.32 standard deviations, or from the 50th to the 63rd percentile.
Microcomputer-based laboratories. Microcomputer-based laboratories (MBLs) use electronic sensors to collect data on physical systems, immediately convert the analog data into digital input, and concurrently transform the digital data to a graphical system. As a result, learners in MBLs are able to witness a phenomenon in the laboratory while concurrently viewing the development of a graph describing the phenomenon.
Reviewers who examined the early evaluation literature had a hard time finding studies that showed learning advantages for MBL instruction, however. Mixed evaluation results were a common finding. Eight reports from the last decade confirm the earlier findings. Seven of the eight studies found either small negative or small positive effects of MBL instruction on student learning. The remaining study found a very strong effect of MBL instruction, but the study had a design flaw that might account for the anomalous result. The median of the eight effect sizes was 0.01, a trivial effect. This means that students who learned in MBLs typically performed no better on tests than did students who learned in conventional laboratories.
Conclusion It is not yet clear how much computer-based programs can contribute to the improvement
of instruction in American schools. Although many researchers have carried out controlled evaluations of technology effects during the last three decades, the evaluation literature still seems patchy. For most technologies, results are available only at selected grade levels, in selected subjects, and on selected instructional outcomes. The literature is too uneven for sweeping conclusions about the effectiveness of instructional technology. Nonetheless, results are consistent enough for some tentative conclusions in some areas.
x
Evaluation studies of the past decade have consistently found, for example, that ILSs make little or no contribution to the improvement of reading programs. Other research suggests, however, that ILSs are usually incompletely implemented. The job for future evaluators is to determine whether fully implemented ILSs will make more of a contribution. Questions also surround WTR programs. WTR has a good record of effectiveness in evaluation studies carried out during the past decade, but WTR has a rather poor record in earlier evaluation studies. Researchers and analysts still have to find an explanation for the difference in results of early and later evaluations of WTR. Finally, several studies found that the reading management program Accelerated Reader may be very helpful to students in both elementary and secondary schools. However, too few experimental studies are available at this point for firm conclusions.
It has become clear during the past decade that computers can be valuable tools in improving writing skills. Evaluation studies from the 1980s usually found that students who were required to compose on word processors improved in writing skills more than control students did, and evaluation studies from the last decade found similar results. Although effects in most studies of word processing were only moderate in size, the effects were nonetheless large enough to be considered educationally meaningful. In addition, a few studies have found that word processing programs would have greater instructional effects if they could provide writing tips for the students who were using them. Studies from the last decade also show that simply giving students greater access to computers and Internet resources often results in gains in writing skill. Evaluators during the 1980s often reported that such computer enrichment produced only indifferent results. The failure to find positive effects may have been due to the limited amount of enrichment in the programs of the 1980s or to weaknesses in the evaluation designs in these early studies. Whatever the reason for the poor findings in earlier studies, the picture changed dramatically during the last decade. Most studies carried out during the last decade found that enrichment programs have positive effects on student writing skills.
It is also clear that instructional technology often improves teaching programs in mathematics and the natural and social sciences. ILS programs, which usually rely heavily on tutorial instruction, have been producing positive results in mathematics programs for decades. Computer tutorials in natural and social science classes also have an almost uniformly positive record of effectiveness in the1970s, 1980s, and 1990s. Science educators often think of simulation programs and microcomputer-based laboratories as advances over tutorial programs. Evaluation results from simulations and MBLs, however, are weaker and less consistent than are the results from tutorial programs. Although simulation programs sometimes improve the effectiveness of science teaching, a number of studies conducted during the 1980s and 1990s found negative effects from simulations. Teachers therefore have to use some care in deciding when to use simulations, which simulations to use, and how to use them. Results from MBLs are usually small, and they are negative as often as positive.
Overall, however, evaluation studies suggest that schools have been more successful in using instructional technology during the past decade than they were in earlier years. The growing effectiveness of instructional technology should not come as a great surprise. Computers have improved dramatically since they were first used in instruction. Today’s computers are faster, friendlier, and more visually and aurally sophisticated than yesterday’s models. In addition, students are more computer-literate today than they were in years past, and many teachers have become sophisticated users of instructional software. Recent evaluation studies suggest that instructional technology is thriving in this climate and that computers—which have transformed society in so many ways—can also make teaching more effective in elementary and secondary schools.
1
Introduction
There is no question that access to technology has been growing rapidly in American schools and that we are now at a point where nearly all schools own computers and have access to Internet resources. It is also clear that schools are using instructional technology in more ways than ever before. The statistics on these points are convincing, and no one seriously questions them. And yet controversy continues to swirl around the use of technology in schools. At the eye of the storm are questions about effectiveness. Are schools doing a better job because of their embrace of technology? Can schools improve their teaching effectiveness by investing more heavily in technology? Or are schools misusing technology? Are they using it inequitably? Questions spring up on all sides.
To answer these questions, this report reviews findings from controlled evaluations of technology applications in elementary and secondary schools. Not reviewed in this report are theoretical works, case studies, policy and cost analyses, and other studies that investigate learning processes or social dimensions of technology without measuring learning outcomes. Two different review methods are used for the literature covered—one for evaluation studies of the past decade and another for prior evaluation studies. For the past decade, individual studies are examined closely. For the earlier literature, reviews of earlier reviews are used.
Given the number of reviews already written on effectiveness of instructional technology, it seemed reasonable to adopt this dual methodology. More than a dozen individuals or groups have already written careful reviews of the evaluation literature of the 1970s and 1980s, and one of the reviews alone describes results from more than 100 controlled and quantitative studies (J. Kulik, 1994). There is little need to take a magnifying glass to an area that has already been examined and re-examined in detail. The report's approach therefore is to survey the earlier literature on instructional technology from the shoulders of earlier reviewers.
Studies of instructional technology published since 1990 are as numerous and scattered as earlier studies are, but reviewers have not visited this more recent literature so often. It still requires careful scrutiny. This report therefore examines individual studies published since 1990, not reviews. The report uses an approach that is similar to the meta-analytic approach developed by Glass and his colleagues (Glass, McGaw, & Smith, 1981) to locate studies and describe results. Meta-analytic reviewers use objective procedures to locate as many studies of an issue as possible. They describe features and outcomes of the studies using objective and quantitative methods. Finally, meta-analysts use statistical methods to describe overall findings and to chart the relationships between study features and outcomes.
School Access to Technology The effectiveness studies that are reviewed in this report were carried out during a decade
of rapid growth in school computing (Market Data Retrieval, 1999; Quality Education Data, 1998; U.S. Department of Education, 2002). By 1999 nearly all schools in America owned computers, and more than half of the computers were multimedia models with sound cards and CD-ROM capabilities. In 1999 the ratio of students to computers was at an all-time low of 5.7 to 1. In contrast the ratio of students to computers was 125 to 1 in 1984; 25 to 1 in 1989; 14 to 1 in 1994; 7.3 to 1 in 1997; and 6.3 to 1 in 1998. Internet access increased even more dramatically
2
during the past decade. In 2000, 98% of American schools had Internet access. In contrast, Internet access was available in only 3% of schools in 1989; 7% of schools in 1992; 78% in 1997; 89% in 1998; 95% in 1999; and 98% in 2000.
It would be a mistake to infer from these statistics that students do a lot of their work on computers in American schools. According to the National Center for Education Statistics (U.S. Department of Education, 1998), for example, 11% of fourth graders, 23% of eighth graders, and 16% of eleventh graders reported never using a computer in school in 1996. And only a small percentage of students used computers frequently. Only 10% of fourth graders, 18% of eighth graders, and 18% of twelfth graders reported using a computer every day in their schoolwork. It would also be a mistake to conclude that all students have access to up-to-date computer technology. While the ratio of students to computers in 1999 was 5.7 to 1, the ratio of students to multimedia computers was 9.8 to 1 and the ratio of students to Internet-wired computers was 13.6 to 1.
Although the computer bandwagon has been rolling steadily along during the last decades, data collected at the end of the century suggest that there is still room for growth in school computing. The majority of students do not use computers regularly in schools. The nation has not reached the Department of Education’s goal of one multimedia microcomputer to five students in every classroom in the nation. Nor has it reached the Department of Education’s goal of having every classroom in every school connected to the Internet. The question of effectiveness therefore still weighs heavily on the minds of policy experts. Will further growth improve school effectiveness? Data on effectiveness can help to guide decisions about future investments in technology.
Student Use of Technology The growth in school computing since the 1980s is not just a matter of an increase in
number of machines. How computers are used in schools has also been changing. At the end of the 1980s, schools were using computers as tutorial devices for basic skills instruction and as objects for study in computer literacy courses. At the end of the 1990s, students were most often using computers as tools for word processing and reference. The shift from computer-as-tutor and computer-as-topic toward computer-as-tool is one of the important developments in the recent story of instructional technology in schools. No single study provides a definitive account of how students have been using computers in schools over time, but a number of surveys provide relevant data. Becker, Ravitz, and Wong’s report (1999) on their recent national survey is one of the key documents. In response to one question in the survey, teachers listed their main objectives for student use of computers. The objective chosen by most teachers (51%) was to have students find out about ideas and information. The next most popular objectives were to help students express themselves in writing (44%), to help students master skills (37%), and to improve students’ computer skills (32%). Thus teacher objectives emphasized, in order of importance, reference work, word processing, basic skills tutorials, and development of computer literacy. In Becker’s surveys of a decade ago (e.g., Becker, 1991), teachers said that they most often used computers for basic skills training and computer literacy.
In their 1999 survey, Becker and his associates also asked teachers to identify the categories of software that their students were using in school. Word processing and reference software were the most popular categories. About 50% of all teachers reported that their students were using word processing software. Other popular types of software used in schools were CD-ROM (36% of teachers reported student use), World Wide Web (29%), skill practice games (28%), and simulations (23%). Teacher reports on the specific software that they considered
3
most valuable gave a similar picture of student use of computers. Becker and his colleagues found in 1999 that ClarisWorks (now AppleWorks), an integrated office application, is the program most widely viewed by teachers as valuable for students. Other programs singled out by teachers as especially valuable included another integrated office application (Microsoft Works), a word processing program (Microsoft Word), and a Web browser (Netscape). Other programs that found adherents among a substantial percentage of elementary teachers were the multimedia authoring program Hyperstudio and the reading management program Accelerated Reader.
Another survey asked college-bound seniors about their computer-related experiences (Coley, Cradler, & Engel, 1997). Most students (72%) reported using computers for word processing in schools. About half of the students (51%) reported coursework or experience in computer literacy. Nearly half (44%) had used a computer in an English course. A smaller percentage (27%) used computers to solve math problems. Like Becker’s data, the data of Coley and his associates suggest that computers are today used more often as tools than as tutors.
These data on computer use remind us again of the importance of knowing about the effectiveness of various technological applications. If computers are to be used in schools, they should be used in ways that are helpful to students. But what are the best ways to use computers in teaching? Should students use computers as tutors or as tools? What are the best ways to use computers in tutorial instruction? Which computer tools are most useful? It is difficult to answer such questions without knowing what the evaluation literature says about computer effectiveness.
Equity in Access and Use It is impossible to discuss instructional technology without raising the question of equity.
School access to technology may be increasing rapidly, but is access increasing equally rapidly for rich and poor students and for minority and other students? Are poor and minority students tracked into ineffective uses of computers while affluent, nonminority students use computers in more productive ways?
Recent reports suggest that students from different socioeconomic strata and different racial and ethnic groups have different access to computers. The U.S. Department of Commerce’s National Telecommunications and Information Administration (NTIA), for example, has issued several reports recently on a digital divide that separates the information-rich and the information-poor segments of American society (e.g., National Telecommunications and Information Administration, 1995, 1998, 1999, 2000). Information-rich groups include whites, Asians/Pacific Islanders, the more affluent, the more highly educated, and those in dual-parent households. The information-poor include blacks and Hispanics, those with lower incomes and education levels, and those in rural areas or central cities. According to the NTIA’s most recent report Falling Through the Net: Toward Digital Inclusion, the information-poor have recently begun making greater gains, and the digital divide is beginning to narrow.
Nonetheless, the divide is still disturbingly wide. NTIA data reveal, for example, that Internet access was available to 46% of households earning $35,000 to $49,000, to 61% of households earning $50,000 to $74,999, and to 78% of households earning above $75,000. There is also a racial and ethnic divide. Asians and Pacific Islanders have the highest level of home Internet access at 57%. Blacks and Hispanics have the lowest level of access at 24%. There is also a large gap in computer ownership for different income groups and racial and ethnic groups.
Survey data show that a digital divide also exists in schools, but the digital divide in schools is not as wide as it is in households. Schools in affluent areas (those with a low percentage of students eligible for the federal free lunch program) averaged 4.9 students to
4
computer, compared to 6.2 for schools in less affluent areas (Market Data Retrieval, 1999). Schools in affluent areas also have greater Internet access (U.S. Department of Education, 2002). In 2000 Internet access was available in 94% of schools with a high percentage of students qualifying for the free lunch program and in 99% of schools with few students eligible for the free lunch program. This gap appears to be closing, however. In 1998, 79% of schools with high student need had Internet access, compared to 92% of schools with low student need. In 1999, 89% of schools with high need had Internet access, compared to 95% of schools with low need. The relationship is less clear between school computer usage and such factors as student gender, socioeconomic status, and minority status. On the one hand, U.S. Census data from households suggest that inequities exist (U.S. Department of Education, 2002). According to census data, students in higher-income families are more likely to use computers in schools; white students are more likely than black and Hispanic students to use computers; and male students are somewhat more likely than females to use computers in school. Teacher data from the National Assessment of Educational Progress (NAEP) show the same pattern (Coley et al., 1997). Student data from the NAEP, however, show the opposite pattern of relationships. For example, Coley and his colleagues summarized what students said about their computer use in a recent NAEP reading assessment. Students from low-income families were more likely than students from high-income families to report frequent computer use in schools. Black and Hispanic students were more likely than white and Asian students to report frequent computer use in schools.
A report from the Educational Testing Service (ETS), authored by ETS researcher Harold Wenglinsky (1998), suggests that the greatest inequities occur in how students use computers in schools rather than in how often they use them. The report presents a correlational analysis of data from the 1996 NAEP mathematics assessment for fourth and eighth graders. Wenglinsky found that the following variables were significantly intercorrelated: mathematics achievement, minority status, and student-reported use of computers in lower- vs. higher-order tasks. Wenglinsky classified drill-and-practice programs as lower-order activities. He classified mathematics learning games as a higher-order activity for fourth graders and simulations and applications as higher-order activities for eighth graders.
Wenglinsky found, for example, that black, poor, urban, and rural eighth graders were less likely than other eighth graders to engage in higher-order uses of computers, and they were more likely to engage in lower-order uses. Black, poor, urban, and rural students were also less likely to be high performers on the mathematics assessments. Wenglinsky suggested that white students from affluent homes may get an extra boost from the way computers are used in their classes, whereas minority students from less affluent homes may get short-changed.
This conclusion should be considered suggestive rather than definitive. First, Wenglinsky’s report is based on a correlational analysis, and it is hazardous to draw inferences about causes from correlational data. Wenglinsky himself wrote that a correlation between type of computer use and mathematics achievement is open to several interpretations. The correlation may indicate, as Wenglinsky supposes, that higher-order computer programs promote higher levels of achievement in children, but the correlation may also indicate that high-achieving students are more likely than low-achievers to use school computers for higher-order tasks. Second, Wenglinsky’s analysis is based on children’s self-reports on their use of computers in schools. Self-report data from children on this topic do not agree in important ways with reports from parents and teachers. Wenglinsky’s analysis does not take into account this anomaly in his data.
Overall, the data show that schools with minority and less affluent students have fewer computers and less Internet access than other schools have. Although the inequities are not so strong as those existing in homes, the inequities are nonetheless real and significant. The data on how often children use computers in school are less clear. Survey data from parents and teachers
5
suggest that inequities exist in amount of computer use, but self-report data from students do not agree. Finally, it is possible that inequities exist in the way that students experience school computers. White students from affluent homes may use computers for open-ended problem solving, while minority students from poor homes use computers for drill-and-practice and rote learning. The data on inequities in the way that students use computers is suggestive only.
Like discussions of technology access and use, discussions of equity lead eventually to the question of effectiveness. If computer technology improves educational effectiveness, then it is important that technology be distributed equally among schools in rich and poor areas and among schools with many and few minority children. It is clearly inequitable for poor and minority children to have less access to a valuable resource than other children do. Equity also demands that students from information-rich and information-poor homes be able to use school computers in the same ways.
Purpose The purpose of this report is to describe the current state of knowledge provided by
controlled evaluations studies of instructional technology in elementary and secondary schools. The report is based on individual studies of instructional technology published during the 1990s and on reviews of studies published before 1990. The next section of this report gives an overview of findings from studies carried out before 1990. The six sections that follow then look in greater depth at specific technological applications evaluated during the 1990s. Finally, a concluding section summarizes the review results.
It is important to note that this review will not cover all evaluation studies of instructional technology. Nor will it cover all studies that have been called evaluations. The focus throughout this report will be on controlled and quantitative evaluation studies. Such studies do not address all questions relevant for an assessment of the promise of new technologies. Theoretical works, qualitative case studies, policy studies, and anecdotal reports may address interesting evaluation questions, but it is beyond the scope of this report to review such works. In addition, it is important to note that the controlled studies reviewed in this report—indeed, virtually all research studies in all fields—are partial studies. They do not capture completely the larger context within which each study is done, and so few studies provide definitive answers. Research to date is only the latest chapter in a continuing story.
6
Background and Methods
Researchers have long been aware of the need for organizing the vast educational literature so that it will be useful to policymakers, administrators, teachers, and other researchers. But no one has made a better case for the importance of research syntheses than Gene V. Glass did in his 1976 presidential address to the American Educational Research Association.
Before what has been found can be used, before it can persuade skeptics, influence policy, affect practice, it must be known. Someone must organize it, extract the message . . . We face an abundance of information. Our problem is to find the knowledge in the information. We need methods for the orderly summarization of studies so that knowledge can be extracted from the myriad individual researches (Glass, 1976, p. 4).
For Glass, the chronologically arranged descriptions of research in most narrative reviews do not transform information into knowledge. Most narrative reviews are too selective, too subjective, and too imprecise to do the job.
Glass advocated the use of sophisticated techniques of measurement and statistical analysis in reviews, and he developed a quantitative methodology for reviewers to follow. Glass’s method is meta-analysis, the statistical analysis of a collection of results from individual studies for the purpose of integrating the findings (Glass, McGaw, & Smith, 1981). More simply, it is the statistical analysis of analyses. Reviewers who carry out meta-analyses first locate studies of an issue by clearly specified procedures. They then characterize the outcomes and features of the studies in quantitative or quasi-quantitative terms. Finally, meta-analysts use multivariate techniques to relate characteristics of the studies to outcomes.
During the 1980s meta-analysis became the method of choice for reviews of the effectiveness of instructional technology. At least eight separate meta-analyses were carried out during the 1980s to answer questions about the effectiveness of instructional technology in elementary and secondary schools (J. Kulik, 1994). Research teams at six different research centers produced these reviews. Because meta-analysis dominated the review literature on instructional technology during the 1980s and remains a potent influence on research reviews today, it is important to be clear about some of its central features.
One of the major innovations in meta-analysis was the use of measures of effect size to summarize study results. Researchers had used effect sizes in designing studies long before meta-analysis was developed, but they failed to see the contribution that effect sizes could make to research reviews. Glass saw that results from a variety of different studies could be expressed on a common scale of effect size. After making such transformations, reviewers could carry out statistical analyses that were as sophisticated as those carried out by experimenters.
Size of effect can be measured in several ways, but the measure of effect size most often used is the standardized mean difference. This index gives the number of standard deviation units that separate outcome scores of experimental and control groups. Reviewers calculate it by subtracting the average control group outcome score from the average experimental group score and then dividing the remainder by the standard deviation of the outcome measure. For example, if a group that receives computer-based coaching on the SAT obtains an average score of 550 on the test, whereas a group that receives conventional teaching averages 500, the effect size for the coaching treatment is 0.5 since the standard deviation on the SAT is 100.
7
Effect sizes can be negative or positive. They are positive when an experimental or treatment group outperforms a control group. They are negative when the control group comes out on top. Effect sizes can be large or small. Cohen (1977) suggested rough guidelines for classifying effect sizes. Effects are small, he said, when effect sizes are around 0.2, medium when they are around 0.5, and large when they are around 0.8. Looking specifically at educational effects, Slavin (1990a) suggested that effect sizes of +0.25 or more are large enough to be considered to be educationally meaningful.
The meaning of effect sizes can be grasped by relating them to other measures, such as percentile scores and standard scores. Suppose, for example, that a study finds an effect size of 1.00 for an SAT coaching program. Using what we know about SAT norms (i.e., average score approximately 500 and standard deviation approximately 100), we can say that a typical coached student would score 550 on the SAT, whereas a typical uncoached student would score 500. Using areas of the normal curve, we can also say that a typical coached student would score at the 84th percentile, whereas a typical uncoached student would score at the 50th percentile.
Review Findings from the 1980s The meta-analyses of the 1980s yielded the conclusion that programs of computer-based
instruction have a positive record in the evaluation literature (J. Kulik, 1994). The following are the major points emerging from these meta-analyses:
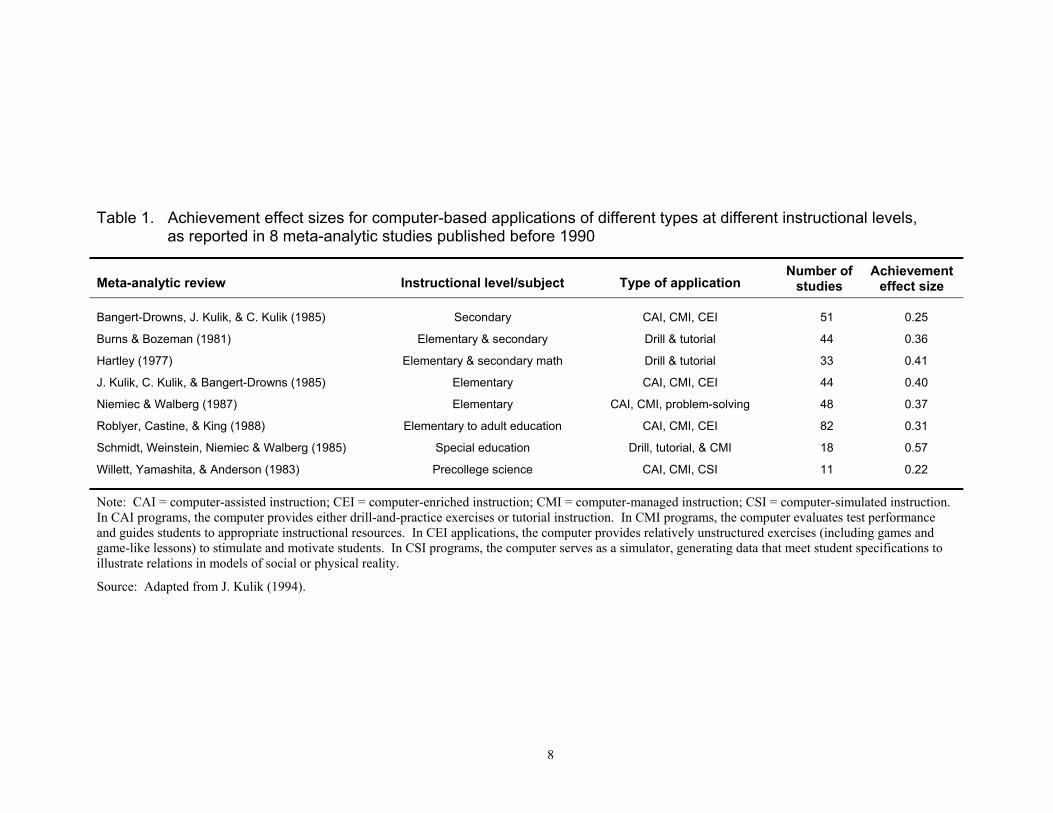
1. Students usually learned more in classes in which they received computer-based instruction (Table 1). The eight reviews that examined effects of computer-based instruction on student learning produced somewhat different estimates of the magnitude of the effects, but all the estimates were positive. At the low end of the estimates was an average effect size of 0.22 in 22 studies conducted in elementary and high school science courses (Willett, Yamashita, & Anderson, 1983). At the other end of the scale, Schmidt, Weinstein, Niemiec, & Walberg (1985) found an average effect size of 0.57 in 18 studies conducted in special education classes. The median effect size in the eight meta-analyses was 0.36. This means that the average effect of computer-based instruction was to raise examination scores by 0.36 standard deviations, or from the 50th to the 64th percentile.
2. Students also liked their classes more when they received computer help in them. The average effect of computer-based instruction in 22 studies was to raise attitude- toward-instruction scores by 0.28 standard deviations (C. Kulik & J. Kulik, 1991).
3. Students developed more positive attitudes toward computers when they received help from them in school. The average effect size in 19 studies on attitude toward computers was 0.34 (C. Kulik & J. Kulik, 1991).
4. Computers did not, however, have positive effects in every area in which they were studied. The average effect of computer-based instruction in 34 studies of attitude toward subject matter was near zero (C. Kulik & J. Kulik, 1991).
8
Table 1. Achievement effect sizes for computer-based applications of different types at different instructional levels, as reported in 8 meta-analytic studies published before 1990
Meta-analytic review Instructional level/subject Type of application Number of
studies Achievement
effect size
Bangert-Drowns, J. Kulik, & C. Kulik (1985) Secondary CAI, CMI, CEI 51 0.25
Burns & Bozeman (1981) Elementary & secondary Drill & tutorial 44 0.36
Hartley (1977) Elementary & secondary math Drill & tutorial 33 0.41
J. Kulik, C. Kulik, & Bangert-Drowns (1985) Elementary CAI, CMI, CEI 44 0.40
Niemiec & Walberg (1987) Elementary CAI, CMI, problem-solving 48 0.37
Roblyer, Castine, & King (1988) Elementary to adult education CAI, CMI, CEI 82 0.31
Schmidt, Weinstein, Niemiec & Walberg (1985) Special education Drill, tutorial, & CMI 18 0.57
Willett, Yamashita, & Anderson (1983) Precollege science CAI, CMI, CSI 11 0.22
Note: CAI = computer-assisted instruction; CEI = computer-enriched instruction; CMI = computer-managed instruction; CSI = computer-simulated instruction. In CAI programs, the computer provides either drill-and-practice exercises or tutorial instruction. In CMI programs, the computer evaluates test performance and guides students to appropriate instructional resources. In CEI applications, the computer provides relatively unstructured exercises (including games and game-like lessons) to stimulate and motivate students. In CSI programs, the computer serves as a simulator, generating data that meet student specifications to illustrate relations in models of social or physical reality.
Source: Adapted from J. Kulik (1994).
9
During the 1980s, therefore, meta-analytic reviewers agreed that computer-based instruction had positive effects on students. The literature said that adding computer-based instruction to a school program, on the average, improved the results of the program. But the meta-analyses differed somewhat on the size of the gains to be expected. It is necessary to look more closely at the studies to find out which factors were related to the variation in meta-analytic results.
Specific Computer Approaches
The computer was used in conceptually and procedurally different ways in studies examined in these meta-analyses. A plausible hypothesis is that some applications produced results that were better than average, whereas other approaches produced below-average results. To test this hypothesis, James A. Kulik’s 1994 review looked carefully at 97 studies carried out in elementary schools and secondary schools. Each of the studies was a controlled quantitative study, in which achievement outcomes in a class taught with computer-based instruction were compared to achievement outcomes in a class taught without computer-based instruction. Some of the studies measured achievement outcomes on nationally standardized tests and some measured outcomes on locally developed tests.
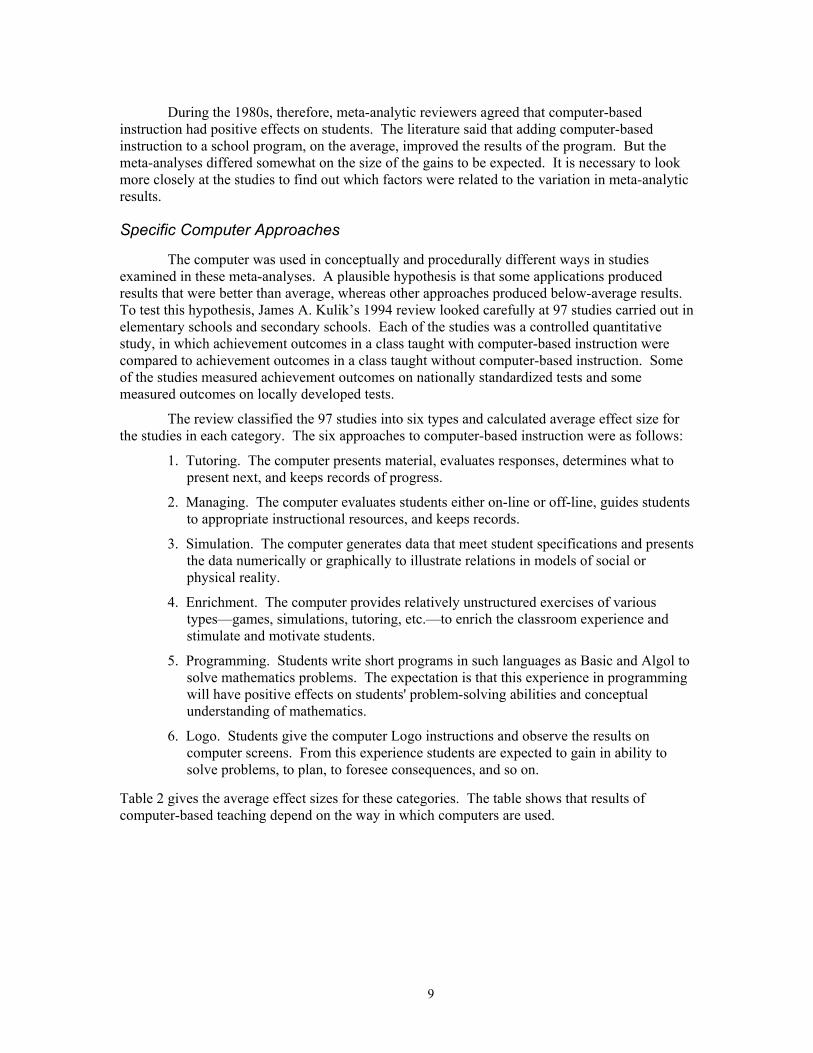
The review classified the 97 studies into six types and calculated average effect size for the studies in each category. The six approaches to computer-based instruction were as follows:
1. Tutoring. The computer presents material, evaluates responses, determines what to present next, and keeps records of progress.
2. Managing. The computer evaluates students either on-line or off-line, guides students to appropriate instructional resources, and keeps records.
3. Simulation. The computer generates data that meet student specifications and presents the data numerically or graphically to illustrate relations in models of social or physical reality.
4. Enrichment. The computer provides relatively unstructured exercises of various types—games, simulations, tutoring, etc.—to enrich the classroom experience and stimulate and motivate students.
5. Programming. Students write short programs in such languages as Basic and Algol to solve mathematics problems. The expectation is that this experience in programming will have positive effects on students' problem-solving abilities and conceptual understanding of mathematics.
6. Logo. Students give the computer Logo instructions and observe the results on computer screens. From this experience students are expected to gain in ability to solve problems, to plan, to foresee consequences, and so on.
Table 2 gives the average effect sizes for these categories. The table shows that results of computer-based teaching depend on the way in which computers are used.
10
Table 2. Achievement effect sizes for 6 types of computer-based applications, calculated from evaluation studies published before 1990
Type of application Number of studies Achievement effect size
Tutoring 58 0.38
Managing 10 0.14
Simulation 6 0.10
Enrichment 5 0.14
Programming 9 0.09
Logo 9 0.58
Source: J. Kulik (1994).
11
Results for three categories of computer use are especially noteworthy: results for computer tutoring, results for Logo programming, and other results. Computer tutoring usually produced positive results in elementary and high schools. Students usually learned more in classes that included computer tutoring. Results of Logo evaluations were impressive on average, but Logo results were also variable. Logo evaluations that measured gains on individually administered tests reported strong positive results. Logo evaluations that employed group administered tests reported indifferent results. Results were unimpressive for several other computer applications: managing, simulations, enrichment, and programming.
Other Instructional Innovations
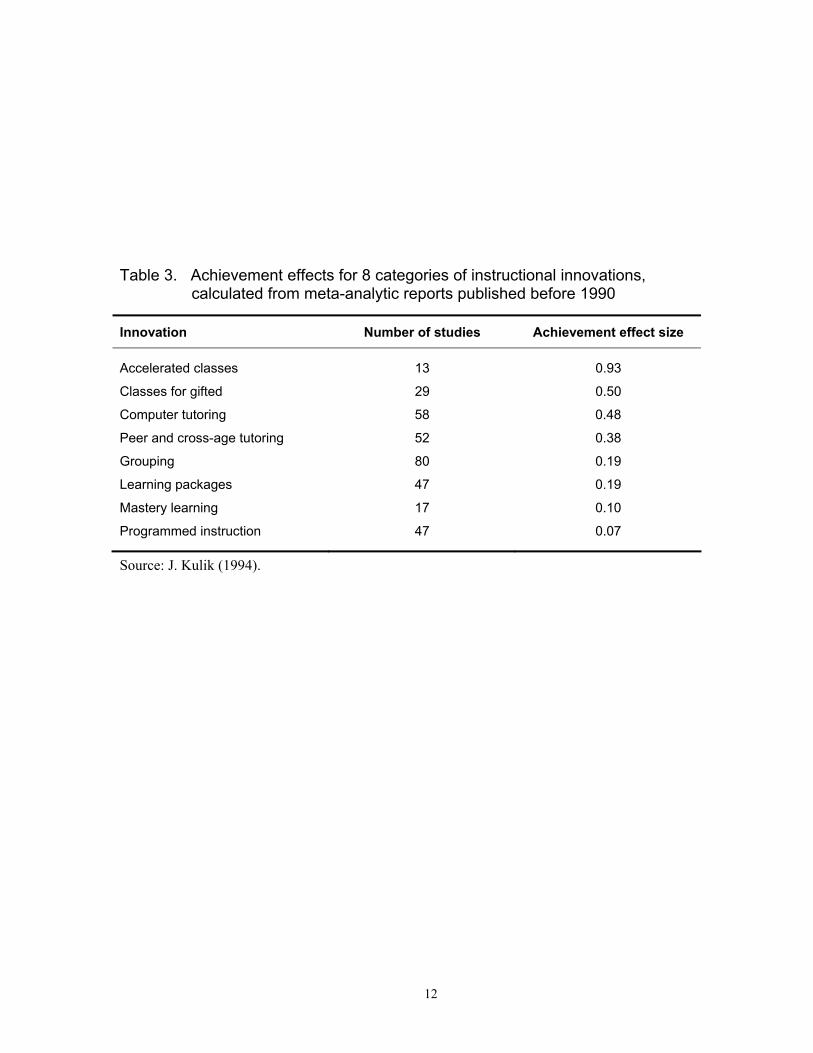
Kulik’s 1994 review also looked at the evaluation records of instructional innovations that did not involve technologies. Listed in Table 3 are seven instructional areas and the number of effectiveness studies found in each area. Also given is the average effect size in each area. This is the average increase in examination scores that is produced by use of the innovation, where the increase is measured in standard deviation units. The effect sizes are based on studies that (a) were reported in journal articles or technical reports, (b) used standardized rather than locally developed tests as outcome measures, and (c) were at least one month in duration.
The table suggests that the innovations that made the biggest difference for student learning involved curricular change for high-achieving individuals. Schools dramatically improved their effectiveness by developing programs that provided greater curricular challenge for their high-aptitude learners. The next most potent innovations involved individual tutoring by computers or by other students. During the 1980s computer tutoring seemed to be slightly more effective than peer and cross-age tutoring. Instructional technologies that relied on paper and pencil were at the bottom of the scale of effectiveness.
Review Methods for Recent Literature In the 1980s computers were still a recent arrival in school classrooms. Technological
applications were relatively homogeneous. And the question for most reviewers was a straightforward one: Do students learn better with or without the help of technology? Today this question seems overly simple. In today’s schools, students use computers in too many ways for a simple thumbs-up or thumbs-down on instructional technology. Reviewers need to focus on specific technological applications rather than on technology in general.
Slavin’s (1990b) analysis of levels of instructional innovation may be useful here. Slavin wrote that innovations can be defined with different degrees of precision, and he specified three different levels of innovations. At Level I, innovations are defined vaguely. According to Slavin, such broad categories as open-education and whole-language instruction suggest only fuzzy models for instructional practice. The terms cover a variety of procedures that do not have a distinct conceptual basis. Level II innovations are more clearly specified. They usually have a conceptual basis that is easy to describe, but in practice, Level II approaches are implemented in different ways. Slavin's examples are cooperative learning, direct instruction, mastery learning, and individualized instruction. Level III approaches are precisely defined. They include specific instructional materials, well-developed training procedures for teachers, and detailed prescriptive manuals. Slavin's examples are DISTAR and Man: A Course of Study.
12
Table 3. Achievement effects for 8 categories of instructional innovations, calculated from meta-analytic reports published before 1990
Innovation Number of studies Achievement effect size
Accelerated classes 13 0.93
Classes for gifted 29 0.50
Computer tutoring 58 0.48
Peer and cross-age tutoring 52 0.38
Grouping 80 0.19
Learning packages 47 0.19
Mastery learning 17 0.10
Programmed instruction 47 0.07
Source: J. Kulik (1994).
13
Computer-based instruction, the focus of meta-analysts in the 1980s, should probably be thought of as a Level I category. Instructional technology and computer-based instruction refer to a variety of procedures with a variety of conceptual bases. They are chapter headings rather than technical terms. At the end of the decade, meta-analysts were focusing more directly on Level II categories. James A. Kulik's 1994 review, for example, examined computer tutoring, managing, simulation, enrichment, programming, and Logo. These can be thought of as Level II categories of computer use. Computer applications within these categories may share common conceptual roots, but in practice the applications vary. Today, a decade later, it should be possible to focus on both Level II and Level III innovations.
Preliminary searches of three library databases revealed that viable evaluation literatures existed in six areas: (a) integrated learning systems; (b) reading management systems; (c) writing programs for teaching reading; (d) word processing and Internet resources; (e) microcomputer-based laboratories; and (f) science tutoring and simulations. Innovations in two of these areas, reading management systems and writing programs for teaching reading, fall at Level III on Slavin’s scale of specificity. Like other Level III innovations, these programs use precisely defined methods and materials, including specific instructional materials, well-developed training procedures for teachers, and detailed prescriptive manuals. The remaining innovations seem to fall at Level II on Slavin’s scale.
After defining these areas, the project located relevant evaluation studies by computer searching three library databases: the ERIC database of the U.S. Department of Education’s Office of Educational Research and Improvement; the Dissertation Abstracts International (DAI) of Bell and Howell Information and Learning; and the Road Maps database of the National Science Foundation’s Division of Science Resources Statistics. Use of the first two databases needs little justification. The ERIC database is a comprehensive depository for research documents published in journals or presented at professional conferences and meetings. The DAI database contains a record of virtually every doctoral dissertation written in American universities during the last century. Although the NSF database is smaller than the ERIC and DAI databases, it has a unique strength. It contains references to Web documents as well as print documents. It therefore serves as a useful supplement to the ERIC and DAI databases.
The purpose of this review is to analyze evaluation findings not covered in earlier reviews, and so this review covers only studies published since 1990. Although the focus of this review is on recent evaluation studies, it is important to note that the evaluation literature lags behind the cutting edge in instructional technology, and even the most recent evaluation studies may not cover the most recent developments in technology. It takes time for people to implement ideas, establish school programs, evaluate programs, write reports on results, and publish the reports. As a result, today’s evaluation reports are not likely to focus on technologies in today’s headlines.
Evaluation studies also had to meet some basic methodological standards to be included in this review. First, the studies had to be actual field implementations in which students received for-credit instruction. Laboratory studies with paid or volunteer subjects were not included in the pool of studies analyzed for this project. Second, the studies had to provide quantitative results on outcome variables measured in the same way in both experimental and comparison groups. Third, the studies had to be free from such crippling methodological flaws as substantive differences on pretests or on other aptitude measures, unfair teaching of the criterion test to one of the comparison groups, and differential rates of subject attrition from the groups being compared.
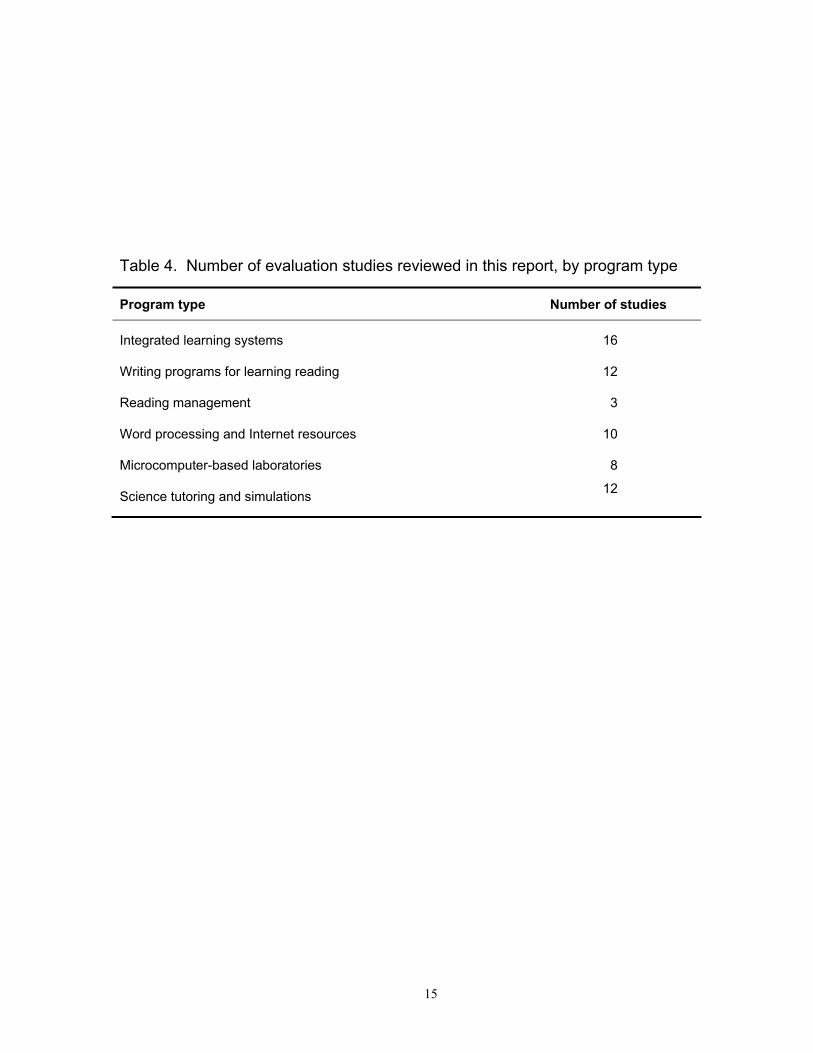
This project located a total of 61 controlled evaluation studies in these six areas. Table 4 gives the number of studies in each area. The instructional outcome measured most often in the studies was student learning, as indicated on an achievement examination given at the end of the
14
program of instruction. Very few studies carried out controlled comparisons of other instructional outcomes: performance on follow-up or retention examinations; attitudes toward instruction, computing, or subject matter; or time needed for instruction. Where controlled comparisons of these outcome measures were available, they are mentioned in this report.
This project calculated effect sizes for study outcomes from the statistics presented in the original reports. Glass’s guidelines for calculating these statistics (Glass et al., 1981) were followed. Effect sizes were calculated directly from the measurement provided in the original reports for those studies that reported means and standard deviations for both experimental and control groups. For less fully reported studies, this project calculated effect sizes from statistics such as t and F.
The application of the formulas given by Glass and his colleagues was straightforward in most cases. In some studies, however, more than one value was available for use in the numerator of the formula for the effect size and more than one value was available for the denominator. For example, some investigators reported raw-score differences between groups as well as covariance-adjusted differences, and some reported differences on a postmeasure as well as differences in pre-post gains. In such cases, this project used as numerator in the effect-size formula the difference that gave the most accurate estimate of the true treatment effect. That meant using covariance-adjusted differences rather than raw-score differences, and differences in gains rather than differences on posttests. In addition, some reports contained several measures of variation that might be considered for use as the denominator of effect size. This project used the measure that provided the best estimate of the unrestricted population variation in the criterion variable.
The methodology used in preparing this review combines features of narrative and meta-analytic reviews. Specifically, this project followed clearly defined procedures for locating studies and expressed results from all studies in terms of effect sizes. This project did not carry out regression analyses between study features and outcomes as many meta-analysts have done in the past. Instead of focusing on such difficult-to-interpret correlational analyses, this project has focused on describing the studies to a fuller extent. This review thus incorporates both features of narrative and meta-analytic reviews.
The remaining sections of this report analyze study findings and present the results of the analyses. The next section of the report focuses on integrated learning systems, which have been used in both mathematics and reading instruction. Three sections of the report then review studies of technology-based programs for reading and writing instruction, including writing-based programs for teaching reading, reading management systems, word processing programs, and other computer enrichment programs. Two sections of the report focus on technology-based programs in science teaching, including tutorial programs, simulation programs, and microcomputer-based laboratories. The report concludes with a brief summary of the main findings.
15
Table 4. Number of evaluation studies reviewed in this report, by program type
Program type Number of studies
Integrated learning systems 16
Writing programs for learning reading 12
Reading management 3
Word processing and Internet resources 10
Microcomputer-based laboratories 8
Science tutoring and simulations 12
16
Integrated Learning Systems
The term integrated learning system (ILS) is little more than a decade old, but the term refers to an instructional approach that goes back to the early 1960s when Patrick Suppes and Richard Atkinson of Stanford University developed the first comprehensive programs of computer-assisted instruction in arithmetic and language arts for school children. The Stanford programs presented drill-and-practice and tutorial lessons, required students to respond during the lessons, and kept detailed records of student performance. In the late 1960s, Suppes helped establish the Computer Curriculum Corporation (CCC) to market this type of courseware, and later other instructional developers followed Suppes’ lead and began marketing their own courseware. During the late 1980s and early 1990s, educational experts began referring to these instructional programs as integrated learning systems (Wilson, 1992).
One of the earliest uses of the term was in a 1988 report of the U. S. Congress’s Office of Technology, Power On! New Tools for Teaching and Learning. The report defines an ILS as a system that includes both courseware and management software running on a computer network. Bailey (1992) listed five key characteristics of an ILS. According to Bailey, ILSs
• specify instructional objectives and tie these objectives to individual lessons;
• provide for integration of lessons into the standard curriculum;
• span several grade levels in one or more curriculum areas;
• run on a networked system of computers or terminals;
• collect and record results of student performance.
By the early 1990s, it was possible to identify a dozen companies that marketed ILS software (Wilson, 1992). Estimates were that about a quarter of all schools in this country were using ILSs and one-half of the money schools spent on software went to ILS companies (Bailey, 1992). Use of ILSs had also spread beyond American schools. Becker and Hativa (1994) reported that ILSs were in use in schools in Austria, Canada, Germany, Guatemala, Hungary, Israel, Kenya, Namibia, South Africa, Spain, and the United Kingdom.
The term integrated learning system continues to be widely used today, and the term still refers to systems with the features defined by Bailey. In addition, today’s ILSs usually manage student registration, assign students to classes or classrooms, prepare reports on student progress for teachers, and perhaps most important of all manage student progress toward intended outcomes or objectives. It is worth noting, however, that the term integrated learning system is not universally used to describe these systems. Some vendors of what are commonly called ILSs, for example, do not use the term in describing their products.
The instructional materials used in today’s ILSs also differ from materials used in yesterday’s models. Yesterday’s ILSs presented information in text screens of black and white, and children typed their answers on typewriter keyboards. The ILSs emphasized drill-and-practice and tutorial instruction in frames that were similar in format to the ones that B. F. Skinner had developed for his programmed teaching machines. Today’s ILSs use color graphics, sounds, and sophisticated visual simulations, and children input their answers both by selecting objects on a screen and by typing. Today’s ILSs may also incorporate constructivist approaches to learning along with more traditional methods.
17
Many educators believe that ILSs have positive effects on children’s learning and motivation, but others believe that ILSs have negative effects (White, 1992). According to proponents, ILSs expose all children to the same curriculum while providing for individualized pacing and review until each child reaches the desired mastery level. Proponents also believe that ILSs motivate students through their interactivity and game format. Critics of ILSs doubt that machines can ever be as effective as live teachers are. To these critics, computer lessons are too mechanical and impersonal to teach conceptual thinking or higher-order skills, and the lessons are too boring and repetitive to motivate student learning.
Empirical studies of ILS effects may be more helpful. School districts wrote many reports on ILS effects during the 1980s, and in 1992 Henry Becker published an influential meta-analytic review of these reports. Becker’s review covered more than two dozen two-page evaluation summaries in a brochure compiled by WICAT systems, five annotated statistical reports from the Computer Curriculum Corporation, three reports from the Jostens Learning Corporation, and a few reports by independent researchers. Using the normative information provided in the reports, Becker was able to estimate effect sizes for 32 ILS implementations. Taking the norms at face value, he calculated an average effect size of 0.40 for these implementations. Becker argued, however, that much of the normative information included in the reports was inadequate. He adjusted effect sizes downward because of these purported inadequacies. With these adjustments, the average effect size dropped to 0.22. Becker drew two conclusions. His substantive conclusion was that ILSs have a moderately positive impact on student achievement. His methodological conclusion was that the poor quality of most evaluations and the likely bias in what does get reported limit the utility of the evaluations.
Most of the reports that Becker reviewed contained only aggregate results in mathematics and reading, but almost a dozen reports contained separate mathematics and reading results. Findings were not identical in these two areas. When Becker took evaluator-reported mathematics results at face value, the median effect of ILS instruction was an increase of 0.42 standard deviations in mathematics scores. When Becker adjusted these reported results for norm inadequacies, the average effect size dropped only slightly to 0.40 standard deviations. An increase in test scores of 0.40 standard deviations is equivalent to an increase from the 50th to the 66th percentile. Reading results were different. When Becker took reported reading results at face value, he found that the median effect of ILS instruction was an increase in scores of 0.36 standard deviations. When Becker adjusted these results for norm inadequacies, however, the average effect size dropped to 0.18. This effect was not large enough to be considered educationally meaningful.
More Recent Studies of Effectiveness The 16 studies located for this review provide a better basis for conclusions about
effectiveness of ILSs today. Seven of these studies examined mathematics learning alone. The remaining nine studies examined effects in both mathematics and reading.
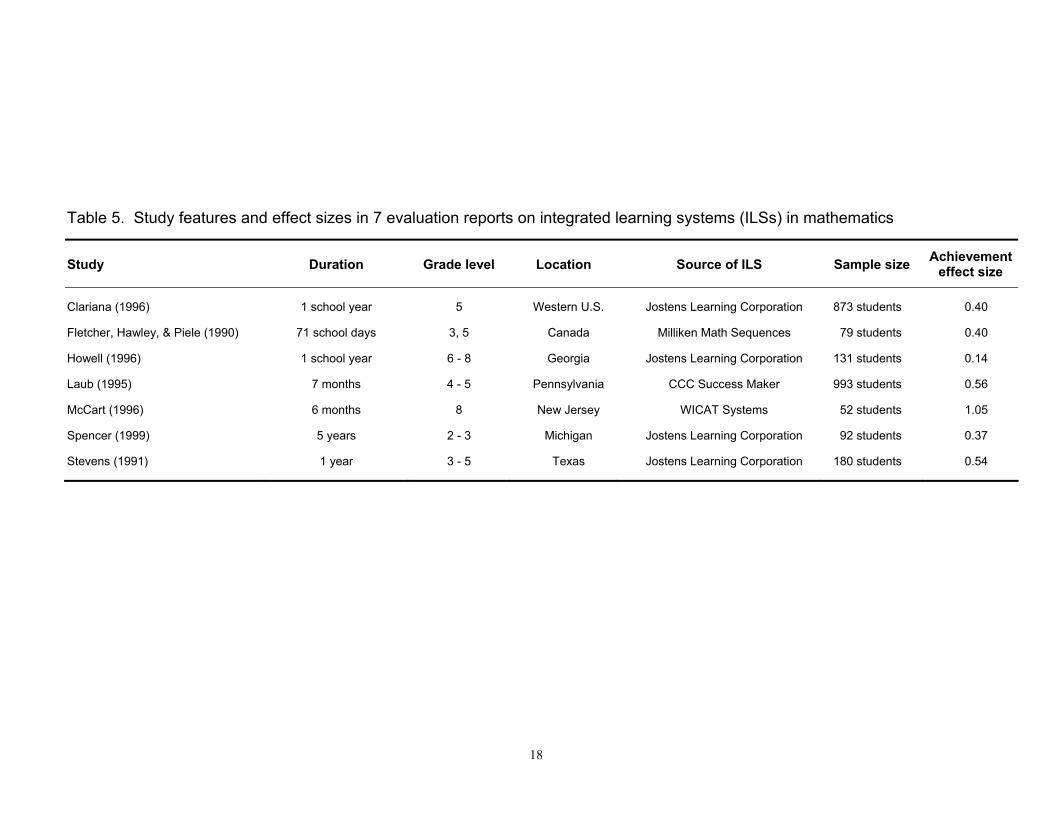
18
Table 5. Study features and effect sizes in 7 evaluation reports on integrated learning systems (ILSs) in mathematics
Study Duration Grade level Location Source of ILS Sample size Achievement effect size
Clariana (1996) 1 school year 5 Western U.S. Jostens Learning Corporation 873 students 0.40
Fletcher, Hawley, & Piele (1990) 71 school days 3, 5 Canada Milliken Math Sequences 79 students 0.40
Howell (1996) 1 school year 6 - 8 Georgia Jostens Learning Corporation 131 students 0.14
Laub (1995) 7 months 4 - 5 Pennsylvania CCC Success Maker 993 students 0.56
McCart (1996) 6 months 8 New Jersey WICAT Systems 52 students 1.05
Spencer (1999) 5 years 2 - 3 Michigan Jostens Learning Corporation 92 students 0.37
Stevens (1991) 1 year 3 - 5 Texas Jostens Learning Corporation 180 students 0.54
19
Studies of Mathematics Instruction
Each of the seven studies in which ILSs were used in mathematics alone found that ILS instruction was at least as effective as conventional instruction (Table 5). The effect sizes in the seven studies were between 0.14 and 1.05. In all but one of the studies, the effect size was large enough to be considered statistically and educationally meaningful.
Of all the studies, McCart’s (1996) found the strongest ILS effect. McCart’s study focused on supplemental mathematics instruction program for at-risk eighth graders in a New Jersey school district. Twenty-four students from one New Jersey school served as the experimental group; 28 students from another school served as the control group. The experimental group received supplemental mathematics instruction from an ILS by WICAT Systems for 60 minutes per week for six months; control students received supplemental tutorial instruction from a teacher for 90 minutes per week for six months. The New Jersey Early Warning Test was used to establish equivalence of the two groups, and it also served as the posttest in mathematics. On this second administration of the test, the experimental students clearly outperformed the control students. Effect size was 1.05, a very strong effect. With an effect size of 1.05, about 85 per cent of the ILS students would outperform the average student in the control group.
Five of the studies found statistically reliable and educationally meaningful ILS effects that were moderate in size. These were the studies by Clariana (1996); Fletcher, Hawley, and Piele (1990); Laub (1995); Spencer (1999); and Stevens (1991). In each of the studies, students receiving ILS instruction outperformed control students on a standardized mathematics posttest. Effect sizes in the five studies were between 0.27 and 0.56.
Clariana’s study (1996) examined effects of an ILS from Jostens Learning Corporation. Subjects were 873 students who were fifth graders during three consecutive years in five elementary schools of a rural western school district. During the first and second years, 579 of these children were taught traditionally; during the third year, 294 of the children received traditional classroom instruction plus ILS instruction in mathematics. Group equivalence was established by examining total scores on the Stanford Achievement Test; mathematics scores on this test also served as the posttest measure. Clariana found that computation, concepts, and applications scores were consistently greater for the ILS students. ILS effect size was 0.63 for mathematics concepts, 0.33 for applications, and 0.13 for computation. Overall, effect size for the study was 0.40.
Fletcher, Hawley, and Piele’s study (1990) was a quasi-experiment conducted in a single school in a rural area of Saskatchewan, Canada. The experimental group of 39 students were third and fifth graders who received instruction from an ILS, the Milliken Math Sequences, during part of their mathematics class period for 71 school days; the control group of 40 students were third and fifth graders from other classrooms at the same school who did not receive ILS instruction. The total mathematics score on the Canadian Test of Basic Skills served as pretest and posttest in the study. In both grades, the experimental group’s covariance-adjusted posttest scores were significantly better than the control group’s (effect size = 0.40).
Laub’s study (1995) investigated the effects of a Computer Curriculum Corporation program on the mathematics achievement of fourth and fifth graders in a Pennsylvania school district. During the seven-month study, 314 experimental students used the system 12 minutes each day as a supplement to 45 minutes of conventional mathematics instruction. Gains on the Stanford Achievement Test for these students were compared to gains for 679 fourth and fifth graders in the same schools in earlier years, when an ILS was not used in math instruction. Pre-
20
post gains for the experimental group were larger than the gains for the control group. ILS effect size was 0.56.
Spencer (1999) carried out a longitudinal study to determine the effect of an ILS on the mathematics achievement of elementary school students in an urban school district located in southeastern Michigan. The district used stratified random sampling to select second and third grade students to participate in its 1991-1992 magnet school programs. Students who participated in the program used the Jostens ILS as a supplement to traditional math instruction for five years; students who did not participate in the magnet school received only traditional mathematics instruction. Students with California Achievement Test mathematics scores from 1991 to 1996 served as the experimental group of 46 students; 46 students not selected for the program served as the control group. The two groups had similar mathematics test scores before ILS instruction began. At the end of the experiment, scores of the experimental group were higher (effect size = 0.38).
Stevens’s study (1991) investigated the impact of an ILS from Jostens Learning Corporation on mathematics achievement of third, fourth, and fifth graders in a Texas school district. The 90 students in the experimental group received ILS instruction; the 90 students in the control group received traditional instruction. The two groups were similar initially, but they came from different schools. The Metropolitan Achievement Test served as pretest and posttest in this quasi-experiment. Analysis of covariance showed that experimental students performed at a higher level than control students on the mathematics posttest (effect size = 0.54).
Only one study (Howell, 1996) found little difference in the effectiveness of ILS and conventional instruction in mathematics. Howell’s study investigated the effects of an ILS from Jostens Learning Corporation on the mathematics achievement of disadvantaged sixth, seventh, and eighth graders. The 66 students in the experimental group received ILS instruction; the 65 control students received traditional instruction. The intact groups were selected from students eligible for Chapter One support in one rural Georgia public middle school. An analysis of covariance was used for the statistical analysis. Posttest scores on the mathematics subtest of the Iowa Test of Basic Skills served as the dependent variable; pretest mathematics scores on this test served as the covariate. Gains in mathematics scores for the experimental group were higher than those for the control group (effect size estimated as 0.14), but the difference was not large enough to be considered practically or educationally meaningful.
Overall, the results of these seven studies suggest that ILSs are effective when they are used in schools solely in the teaching of mathematics. The effect sizes in the seven studies reviewed here were between 0.14 and 1.05. No study reported a negative ILS, and in all but one of the seven studies, the size of effect was large enough to be considered statistically and educationally meaningful. The median effect size in the seven studies was 0.40. This suggests that students receiving ILS instruction in mathematics would perform at the 66th percentile on mathematics tests, whereas comparable students receiving conventional instruction only would perform at the 50th percentile.
Studies of Mathematics and Reading
Nine studies examined ILS effects in both mathematics and reading (Table 6). The studies could be classified into four groups: (a) one study found significant effects in both mathematics and reading; (b) two studies found a significant ILS effect in mathematics but not in reading; (b) two studies found a significant effect in reading but not in mathematics; and (c) four studies found nonsignificant effects in both areas.
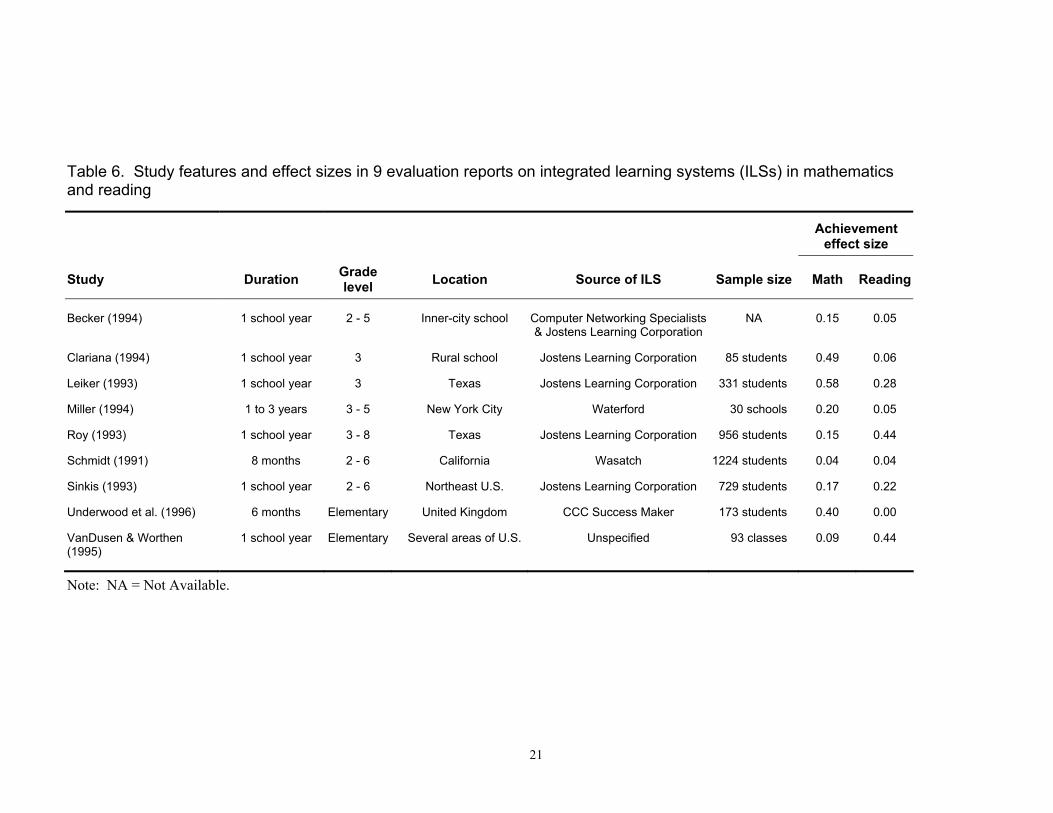
21
Table 6. Study features and effect sizes in 9 evaluation reports on integrated learning systems (ILSs) in mathematics and reading
Achievement effect size
Study Duration Grade level Location Source of ILS Sample size Math Reading
Becker (1994) 1 school year 2 - 5 Inner-city school Computer Networking Specialists & Jostens Learning Corporation
NA 0.15 0.05
Clariana (1994) 1 school year 3 Rural school Jostens Learning Corporation 85 students 0.49 0.06
Leiker (1993) 1 school year 3 Texas Jostens Learning Corporation 331 students 0.58 0.28
Miller (1994) 1 to 3 years 3 - 5 New York City Waterford 30 schools 0.20 0.05
Roy (1993) 1 school year 3 - 8 Texas Jostens Learning Corporation 956 students 0.15 0.44
Schmidt (1991) 8 months 2 - 6 California Wasatch 1224 students 0.04 0.04
Sinkis (1993) 1 school year 2 - 6 Northeast U.S. Jostens Learning Corporation 729 students 0.17 0.22
Underwood et al. (1996) 6 months Elementary United Kingdom CCC Success Maker 173 students 0.40 0.00
VanDusen & Worthen (1995)
1 school year Elementary Several areas of U.S. Unspecified 93 classes 0.09 0.44
Note: NA = Not Available.
22
Significant effects in both mathematics and reading. Leiker (1993) examined effects of supplemental ILS instruction on reading and mathematics performance of third graders in two Texas school districts. A total of 72 students in one district served as the experimental group and received instruction from a Jostens Learning Corporation ILS; 259 students in another district served as controls. Metropolitan Achievement Test served as pretest; scores from the Texas Assessment of Academic Skills served as posttest. An analysis of covariance revealed that mean scores in mathematics and reading were higher for the experimental than for the control students. Effect sizes were 0.58 in mathematics and 0.28 in reading.
Significant effects in mathematics. Clariana (1994) and Underwood et al. (1996) found statistically significant and educationally meaningful ILS effects only in mathematics. Effects on mathematics tests in the two studies were moderate in size, but effects on reading tests were small or trivial.
Clariana’s study (1994) examined effects of a Jostens Learning Corporation ILS on test scores of third graders in a predominantly white, rural elementary school. The test scores came from four classes taught by the same teacher in four consecutive years. During the first two years of the study, 38 students received traditional classroom instruction in the third grade; these students served as the control group. During the third and fourth years, 47 students received traditional classroom instruction plus ILS instruction; these students served as the experimental group. The California Test of Basic Skills, given at the end of second and third grades, served as pretest and posttest. An analysis of covariance found a significant ILS effect in mathematics (effect size = 0.49) but a nonsignificant effect in reading (effect size = 0.06).
Underwood et al. (1996) measured mathematics and reading effects of the Computer Curriculum Corporation’s Success Maker during a six-month instructional period in nine United Kingdom primary and secondary schools. The experimental group consisted of 97 students, and the control group consisted of 76 students. Standardized tests in mathematics, given at both the start and end of the six-month instructional period, served as posttests and covariates in the analysis. Underwood and his colleagues found a significant effect of ILS instruction in mathematics (effect size = 0.4) but a nonsignificant effect in reading (effect size about zero).
Significant effects in reading. Two studies found statistically significant and educationally meaningful ILS effects on reading tests but not on mathematics tests. The two studies are by Roy (1993) and VanDusen and Worthen (1995). Both studies were large-scale evaluations of ILSs from Jostens Learning Corporation.
Roy’s study (1993) examined effects of a Jostens Learning Corporation ILS on the mathematics and reading achievement of elementary school children. Subjects were 956 students in Grades 3 through 8 in four Texas public school districts. A total of 478 students in the treatment group received supplemental computer-assisted instruction; 478 matched control students received only traditional instruction. Posttest data tests came from tests given in the Norm-Referenced Assessment Program for Texas. Roy reported that effects were higher in Grades 3, 4, and 5 (where effect sizes averaged 0.54 for reading and 0.31 for mathematics) than in Grades 6, 7, and 8 (where effect sizes averaged 0.34 for reading and 0.00 for mathematics). Effects were also larger for reading (where average effect size was 0.44) than for mathematics (where average effect size was 0.15). Van Dusen and Worthen’s study (1995) investigated ILS effects in a large-scale two-year study conducted in six elementary schools selected from several different geographic areas in the United States. The investigators assigned intact classes from each school to either a control condition or an experimental condition in which students received an adequate exposure to an ILS. This exposure included use of an ILS for more than 30 minutes per week on the average, completion of more than 3 lessons per week in either reading or math, and good integration of the ILS with regular classroom lessons. Achievement measures included
23
a norm-referenced test and an objective-referenced test specifically designed by the ILS publisher to test objectives from the ILS curriculum. The norm-referenced test provides a fairer basis for measuring ILS effects. On this test, the experimental group of 46 classes clearly outperformed the control group of 47 classes in reading (effect size = 0.44) but not in mathematics (effect size = 0.09).
Nonsignificant effects. Four studies found effects that were positive but not large enough to be considered educationally meaningful in either mathematics or reading. These are the studies of Becker (1994), Miller (1994), Schmidt (1991), and Sinkis (1993). Effect sizes in mathematics in these studies were between 0.04 and 0.20. Effect sizes in reading were between 0.05 and 0.22.
Becker’s study (1994) investigated the effects of two ILS programs in two inner-city elementary schools. One school used an ILS from Computer Networking Specialists, a firm based in the state of Washington. The other school used the Basic Learning System of the Jostens Learning Corporation. Students in Grades 2 through 5 at each school received ILS instruction in a computer laboratory for three half-hour periods each week. Half the students in a class used the computer for math, and half used it for reading. The students who received ILS mathematics instruction served as the experimental group in measurement of mathematics effects and control group in measurement of reading effects. The students who received ILS reading instruction served as the experimental group in measurement of reading effects and the control group in measurement of mathematics effects. Assignment to the ILS mathematics and reading groups was random. The reading and mathematics scores came from both a standardized test (the California Achievement Test) and project-developed, curriculum-specific tests. Comparison of covariate-adjusted means of experimental and control groups showed near-zero ILS effect. Effect size for reading tests was 0.05; effect size for math tests was 0.15.
Miller’s study (1994) investigated ILS effects in mathematics and reading in Grades 3 through 5 in the New York City schools. Ten experimental schools used the Waterford Integrated Learning System for four years, whereas 20 matched control schools used a non-ILS approach to instruction during this period. Pretest and posttest scores for the nearly 1000 students used in the analysis came from the Metropolitan Achievement Tests, California Achievement Test, and Degrees of Reading Power. Miller based his calculation of effect sizes on the mean gains for experimental and control groups. He described the results of these comparisons as “at best mixed and at worst negative” (p. 135). Effect size for math was approximately 0.2; effect size for reading was approximately 0.05.
Schmidt’s study (1991) examined effects of Wasatch ILS courseware on reading, math, and language achievement of 1224 second through sixth graders in Southern California. Students in the experimental group received ILS instruction for eight months; control students studied without an ILS during the same period. The students in the two groups came from two different school districts, but the schools were similar in relevant characteristics. The Comprehensive Test of Basic Skills served as pretest and posttest. Gains in reading and mathematics scores were nearly identical for the experimental and control groups (effect sizes were 0.04 in mathematics and 0.04 in reading and language arts).
Sinkis’s study (1993) evaluated the impacts of a Jostens Learning Corporation ILS on the achievement of Chapter One students in a large urban school system in the Northeast. The study used a quasi-experimental design. The 422 experimental students attended four schools, where they received ILS instruction in reading and mathematics; the 307 control students attended four comparison schools, which did not use ILS instruction. The students took the Metropolitan Achievement Tests as pretests and posttests. The study found that students who were exposed to the Jostens ILS achieved significantly higher on tests of achievement than did the children who
24
did not receive any computer-assisted instruction, but the size of effects were not large enough to be considered practically meaningful (effect sizes were 0.17 in mathematics and 0.22 in reading).
Overall, these studies suggest that ILS effects are mixed when the ILSs are used for instruction in both mathematics and reading. The median effect size was 0.17 on the mathematics sub-tests; it was 0.06 on the reading sub-tests. ILSs appear to be more effective when they are used in a focused way in mathematics teaching. With more focused use, ILSs appear to raise mathematics test scores by around 0.40 standard deviations. It seems possible that students receive too little ILS instruction in mathematics when ILS instructional time is split between reading and mathematics, but the research reviewed here does not provide a definitive explanation.
Improving ILS Effectiveness Are there ways to make ILS effects stronger and more consistent? Researchers have
carried out a number of studies to answer this question, and the results of these studies suggest that implementation methods play a critical role in determining ILS outcomes. Teachers can improve their likelihood of success with an ILS, the studies suggest, by ensuring that students spend an adequate amount of time on the programs and that ILS instruction is integrated with regular classroom instruction. It also seems to be important that teachers pay attention to social factors in learning situations when they implement an ILS.
Van Dusen and Worthen (1995) tested the hypothesis that ILSs produce significant effects only when teachers follow developer guidelines in implementing them. Van Dusen and Worthen found that very few teachers actually follow developer guidelines for ILS use. They estimated, for example, that students typically spend only 35% of the recommended time on ILS instruction, and in some schools students spend less than 15% of the recommended time on the ILS (or as little as 10 minutes per week). They also found that many teachers do not try to integrate the ILS curriculum with the regular classroom curriculum. Instead, they view ILSs as a curricular supplement, like art or music.
Van Dusen and Worthen suggested that many studies have underestimated the potential of ILS because of these inadequacies in implementation. Specifically, the implementations may have given students too little time on the system; students may not have actually completed enough ILS lessons; and teachers may not have integrated the ILS curriculum with regular classroom instruction. To test their ideas, Van Dusen and Worthen compared student achievement of three groups: (a) a group that received an adequate implementation of ILS; (b) a group that received a weak implementation, and (c) a group with no ILS instruction.
Van Dusen and Worthen found that adequacy of implementation had a significant impact on student performance in reading and a slight, but nonsignificant, impact in math. Students in classes with a good overall ILS implementation in reading did slightly better than students in classes with a weak implementation and significantly better than students in the control condition. In mathematics the trend was similar. Van Dusen and Worthen concluded that premature evaluation—evaluation of an ILS before it met the vendor’s implementation standards—could result in serious underestimation of the potential effectiveness of the ILS.
Mevarech (1994) and Brush (1997) examined the importance of pairing students at a single computer, a factor not usually singled out as important by ILS developers. Both found that pairing students for ILS lessons led to better academic outcomes. Mevarech studied performance of 623 third and sixth graders in 19 classrooms in 5 Israeli schools. At each grade level, the researcher randomly assigned classes to work cooperatively or individually with the ILS. After one academic year, cooperative users at both grade levels outperformed their counterparts who
25
used the system individually. The beneficial effects of the cooperative ILS were clear both on tests of basic skills and on tests of higher cognitive processes. Brush (1997) randomly assigned 65 fifth graders to cooperative and individual groups. Students assigned to the cooperative treatment worked on ILS mathematics in pairs. Students assigned to the individual treatment worked without partners. Pre-post changes on an achievement test in mathematics were greater for students working in cooperative groups than for students working individually. In addition, students assigned to the cooperative treatment were more positive toward mathematics and activities in computer mathematics.
These two studies suggest that ILS effects could be stronger if schools paid attention to three elements in implementing them. The first element is the amount of time that students spend at the computer. In typical implementations, students apparently spend only a small fraction of the recommended amount of time on ILS instruction. Effectiveness goes up when students spend more time on ILS instruction. A second important factor in ILS effectiveness is integration of ILS instruction and regular classroom instruction. ILS effectiveness appears to improve when classroom instruction and ILS instruction are mutually supportive. Finally, ILSs appear to be more effective when students work in pairs on ILS lessons. ILSs seem to be less effective when ILS learning is a solo activity.
Summary The overall picture that emerges from these studies is positive. First, none of the studies
found that ILSs had a negative effect on students. In each study, students receiving ILS instruction along with conventional instruction scored at least as high on standardized tests as did students who received conventional instruction alone. Furthermore, the median of all effect sizes in the studies was large enough to be considered statistically significant and educationally meaningful. In the median case, children receiving ILS instruction scored 0.28 standard deviation units higher on standardized achievement tests than did students who received conventional instruction. By most standards, an effect of this size is large enough to be considered educationally meaningful. Slavin (1990a), for example, wrote that effect sizes over 0.25 are large enough to be considered educationally meaningful.
An effect size of 0.28 for ILS studies may be misleading, however, because it is a composite of reading and mathematics effects, and effect sizes on mathematics and reading tests appear to be different. Specifically, ILS effects appear to be greater in mathematics than in reading. In 16 studies, the median ILS effect was to increase performance in mathematics by 0.38 standard deviations. Although several evaluators found educationally meaningful effects on student achievement in reading, most studies found only small effects in this area. In the nine studies that investigated ILS effects in reading and mathematics, the median effect size in reading was 0.06.
The picture of ILS effectiveness may be even more complex than this. ILS mathematics effects were clearer in the evaluation studies in which the ILS was used for mathematics instruction alone. Mathematics effects were less clear in studies in which the ILS was used for both mathematics and reading instruction. This was an unexpected result, and it is not easy to explain. One possibility is that time on ILS mathematics instruction was greater in the studies in which only mathematics was taught by ILS.
Evaluators have found evidence suggesting that ILS effects would be stronger if schools followed some simple rules in implementing them. Particularly important factors in implementing an ILS seem to be the amount of time that students are allowed to spend on ILS instruction, the degree of integration of ILS instruction into the regular curriculum, and the social

26
environment in which students study with ILSs. Studies suggest that ILSs are more effective, for example, when students spend more time on ILS instruction. In typical ILS implementations, students apparently spend only 15% to 30% of the recommended time with these programs. It also appears to be helpful for teachers to integrate ILS instruction and regular classroom instruction. Finally, ILSs appear to be more effective when students work on ILS instruction in pairs rather than individually.
27
Learning to Read by Writing
Writing to Read (WTR) is a reading program that attempts to teach young children to read by stimulating them to write. The program is based on the premise that young children can learn to write in some fashion whatever they can say, and having learned to write, the children can then easily learn to read what they and others have written. John Henry Martin, an educator and former superintendent in school districts in New Jersey and New York, came up with the original idea for the program more than two decades ago. The IBM Corporation became Martin’s partner in developing, evaluating, and marketing the system during the early 1980s, and in 1984, IBM released the first version of WTR for sale to schools. Children were expected to use the program for one hour daily during the second semester of the kindergarten year and for one hour daily during both semesters of first grade. During the WTR hour, children were to circulate among six WTR workstations, spending 12 to 15 minutes at one station before moving on to the next one. The six stations were designed for (a) computer instruction, (b) typing, (c) journal work, (d) listening, (e) writing, and (f) word games. Two of the stations, the computer station and the typing station, involved computer activities. At the computer station, the children learned sound/letter relationships; at the typing station, they typed their own stories. At the remaining stations, children practiced phonics relationships using a variety of materials, including work journals, manipulative materials, and books.
WTR had an immediate impact on reading instruction in U.S. schools. In 1989, five years after the rollout, IBM reported that the program was used in 5000 schools and that an estimated two million students had received WTR instruction. In 1991 IBM released a revised version of its program called WTR 2000. Compared to the original version, WTR 2000 placed more emphasis on blending sounds, featured improved graphics, included new games, and was more interactive. Unlike the early version of the program, which was designed for implementation in a learning lab, WTR 2000 could be implemented in either a learning lab or in the regular classroom.
Educators have identified several influences on the design of WTR (Freyd & Lytle, 1990). The most obvious one is phonemic writing. During the 1960s, some English teachers tried using a phonemic writing system, Pitman’s Initial Teaching Alphabet, as an aid in teaching English as a second language to non-native speakers. This writing system regularized the relationship between English-language sounds and letters. In 1971 Carol Chomsky, a linguist, suggested that phonemic writing might also play a role in primary education. In an article entitled “Write First, Read Later,” she noted that reading a word, once a child had written it, was harder for the child than the writing had been. Chomsky suggested therefore that the usual order in reading and writing instruction—read first, write later—be reversed. Another unmistakable influence on WTR is the whole-language approach to reading. Such WTR activities as spontaneous writing on the computer and manipulative play with letters by pairs of children fit comfortably with the whole-language emphasis on using language in meaningful contexts, talking to share information, and writing for a purpose. Finally, WTR shows the influence of behavioral psychology. Like the ILS programs that came before it, WTR uses a tutorial and drill-and-practice approach to some aspects of instruction. WTR tutors children in sounds and words, and they later practice writing these sounds and words in workbooks.
28
Early Studies of Effectiveness Some experts have been critical of the WTR program. Freyd and Lytle (1990), for
example, criticized both the theoretical underpinnings of WTR and claims about its effectiveness. They wrote that the only unique feature of WTR, the phonics drill and practice using a phonemic alphabet, has no empirical foundation in research on language learning. They also suggested that phonics instruction could be implemented without a computer; the computer machinery merely added a Rube Goldberg touch to phonics teaching. More important, Freyd and Lytle concluded that evaluations provided little evidence that students benefited from WTR and that both start-up and ongoing costs of the program were high.
Slavin (1990a) provided a formal review of WTR effects on reading in kindergartens, first grades, and beyond. Slavin considered WTR effects in kindergartens to be unimpressive. He found that the median effect size in 21 kindergarten studies was 0.28, but he considered this effect-size estimate to be of doubtful validity. He argued that kindergarten studies exaggerated the size of WTR effects because the evaluators often compared academically-oriented WTR kindergartens to nonacademic control kindergartens. In addition, Slavin found no evidence that WTR had a positive effect on the reading skills of first graders, even when the first graders had started WTR instruction in kindergarten. The median effect size of WTR in 13 studies of first graders was 0.00. Finally, Slavin found no evidence that effects of WTR on reading skills could be detected after the year in which students were in the program. The median effect size of WTR in four follow-up studies was 0.06.
Slavin made two points in discussing these findings. First, he pointed out that nontechnology-based reading programs for kindergarteners produced much better results than WTR did. A report by Karweit (1989), for example, identified five reading programs that produced effect sizes in kindergartens ranging from 0.25 to 0.89 on standardized reading tests. Second, Slavin pointed out that the cost of WTR was very high. The first-year costs of the programs identified by Karweit were reportedly between $100 and $150 per class. Slavin estimated that the cost of a WTR lab that served four classes would cost $12,000 to $16,000 per class.
More Recent Studies of Effectiveness Do the WTR evaluation studies of recent years produce the same mediocre results that
Slavin found? The 12 studies from the 1990s located for this literature review help to answer the question (Table 7). The 12 studies fall into three groups: (a) studies of kindergarten effects; (b) studies of Grade 1 effects; and (c) studies of effects beyond Grade 1. One study (Shower & Wise, 1990) examined both kindergarten and Grade 1 effects.
Kindergarten effects. The two studies that investigated WTR effects at the end of kindergarten were by Christopher (1991) and Shaver and Wise (1990). Both of these studies found positive effects of WTR on kindergarteners’ reading skills.
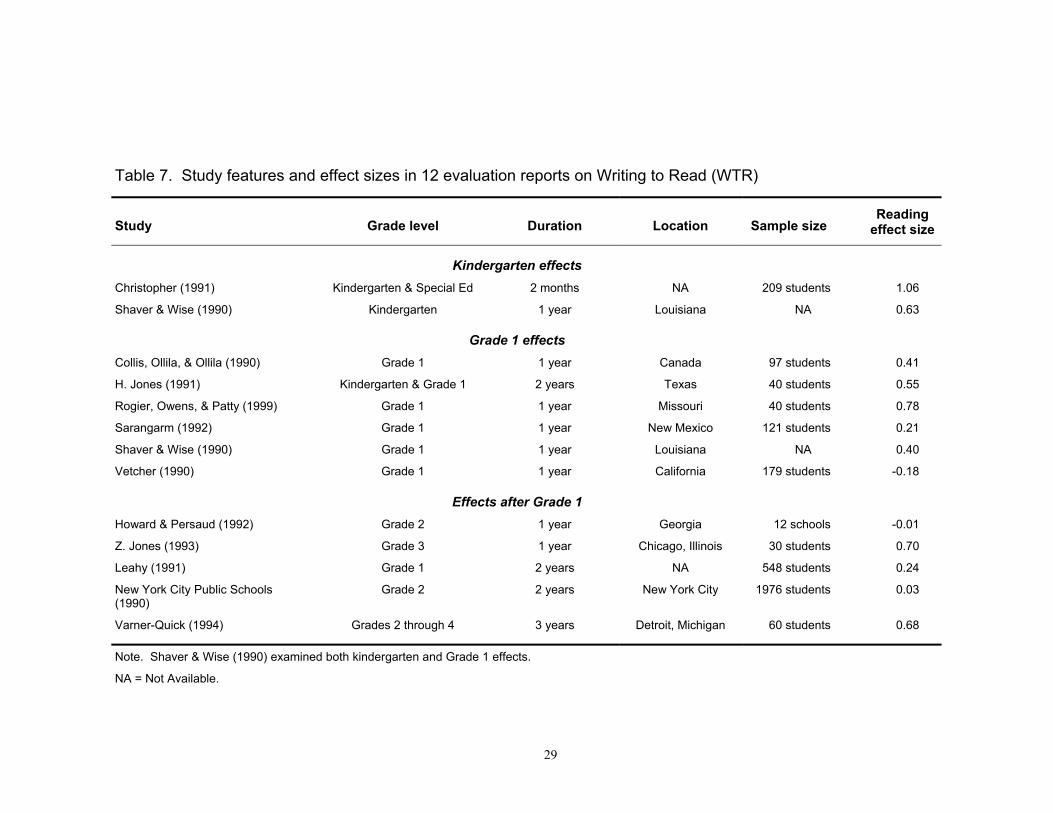
29
Table 7. Study features and effect sizes in 12 evaluation reports on Writing to Read (WTR)
Study Grade level Duration Location Sample size Reading
effect size
Kindergarten effects
Christopher (1991) Kindergarten & Special Ed 2 months NA 209 students 1.06
Shaver & Wise (1990) Kindergarten 1 year Louisiana NA 0.63
Grade 1 effects
Collis, Ollila, & Ollila (1990) Grade 1 1 year Canada 97 students 0.41
H. Jones (1991) Kindergarten & Grade 1 2 years Texas 40 students 0.55
Rogier, Owens, & Patty (1999) Grade 1 1 year Missouri 40 students 0.78
Sarangarm (1992) Grade 1 1 year New Mexico 121 students 0.21
Shaver & Wise (1990) Grade 1 1 year Louisiana NA 0.40
Vetcher (1990) Grade 1 1 year California 179 students -0.18
Effects after Grade 1
Howard & Persaud (1992) Grade 2 1 year Georgia 12 schools -0.01
Z. Jones (1993) Grade 3 1 year Chicago, Illinois 30 students 0.70
Leahy (1991) Grade 1 2 years NA 548 students 0.24
New York City Public Schools (1990)
Grade 2 2 years New York City 1976 students 0.03
Varner-Quick (1994) Grades 2 through 4 3 years Detroit, Michigan 60 students 0.68
Note. Shaver & Wise (1990) examined both kindergarten and Grade 1 effects.
NA = Not Available.
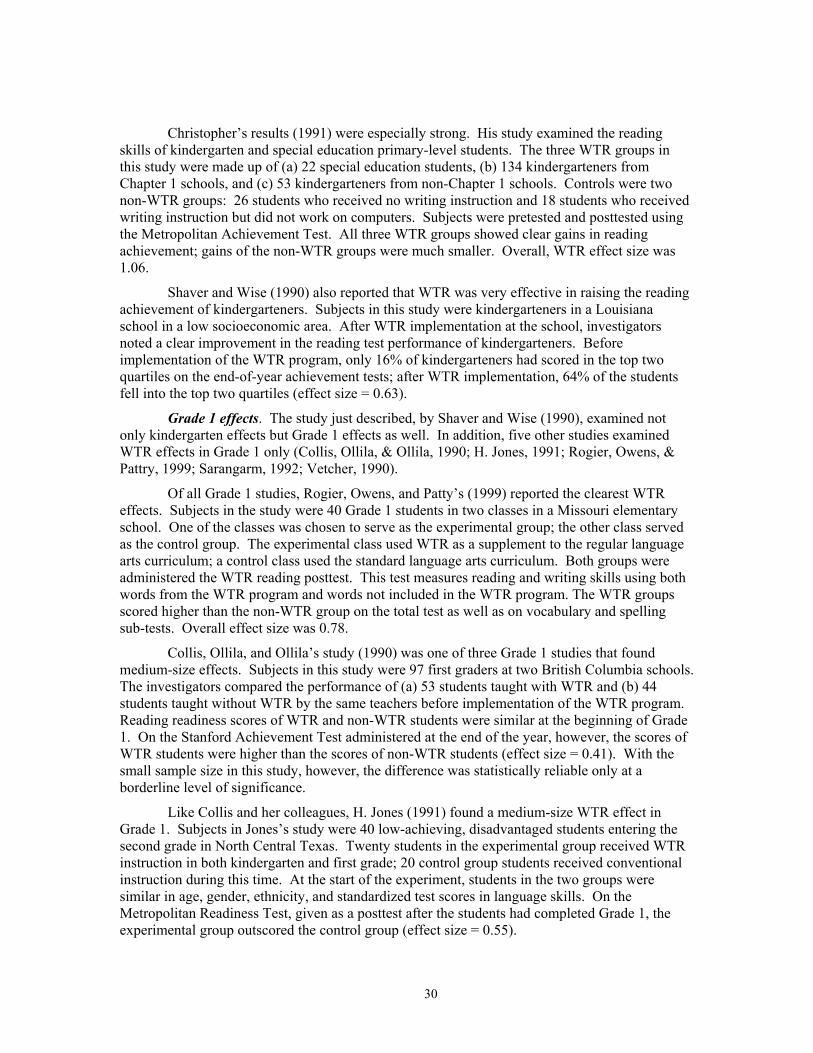
30
Christopher’s results (1991) were especially strong. His study examined the reading skills of kindergarten and special education primary-level students. The three WTR groups in this study were made up of (a) 22 special education students, (b) 134 kindergarteners from Chapter 1 schools, and (c) 53 kindergarteners from non-Chapter 1 schools. Controls were two non-WTR groups: 26 students who received no writing instruction and 18 students who received writing instruction but did not work on computers. Subjects were pretested and posttested using the Metropolitan Achievement Test. All three WTR groups showed clear gains in reading achievement; gains of the non-WTR groups were much smaller. Overall, WTR effect size was 1.06.
Shaver and Wise (1990) also reported that WTR was very effective in raising the reading achievement of kindergarteners. Subjects in this study were kindergarteners in a Louisiana school in a low socioeconomic area. After WTR implementation at the school, investigators noted a clear improvement in the reading test performance of kindergarteners. Before implementation of the WTR program, only 16% of kindergarteners had scored in the top two quartiles on the end-of-year achievement tests; after WTR implementation, 64% of the students fell into the top two quartiles (effect size = 0.63).
Grade 1 effects. The study just described, by Shaver and Wise (1990), examined not only kindergarten effects but Grade 1 effects as well. In addition, five other studies examined WTR effects in Grade 1 only (Collis, Ollila, & Ollila, 1990; H. Jones, 1991; Rogier, Owens, & Pattry, 1999; Sarangarm, 1992; Vetcher, 1990).
Of all Grade 1 studies, Rogier, Owens, and Patty’s (1999) reported the clearest WTR effects. Subjects in the study were 40 Grade 1 students in two classes in a Missouri elementary school. One of the classes was chosen to serve as the experimental group; the other class served as the control group. The experimental class used WTR as a supplement to the regular language arts curriculum; a control class used the standard language arts curriculum. Both groups were administered the WTR reading posttest. This test measures reading and writing skills using both words from the WTR program and words not included in the WTR program. The WTR groups scored higher than the non-WTR group on the total test as well as on vocabulary and spelling sub-tests. Overall effect size was 0.78.
Collis, Ollila, and Ollila’s study (1990) was one of three Grade 1 studies that found medium-size effects. Subjects in this study were 97 first graders at two British Columbia schools. The investigators compared the performance of (a) 53 students taught with WTR and (b) 44 students taught without WTR by the same teachers before implementation of the WTR program. Reading readiness scores of WTR and non-WTR students were similar at the beginning of Grade 1. On the Stanford Achievement Test administered at the end of the year, however, the scores of WTR students were higher than the scores of non-WTR students (effect size = 0.41). With the small sample size in this study, however, the difference was statistically reliable only at a borderline level of significance.
Like Collis and her colleagues, H. Jones (1991) found a medium-size WTR effect in Grade 1. Subjects in Jones’s study were 40 low-achieving, disadvantaged students entering the second grade in North Central Texas. Twenty students in the experimental group received WTR instruction in both kindergarten and first grade; 20 control group students received conventional instruction during this time. At the start of the experiment, students in the two groups were similar in age, gender, ethnicity, and standardized test scores in language skills. On the Metropolitan Readiness Test, given as a posttest after the students had completed Grade 1, the experimental group outscored the control group (effect size = 0.55).
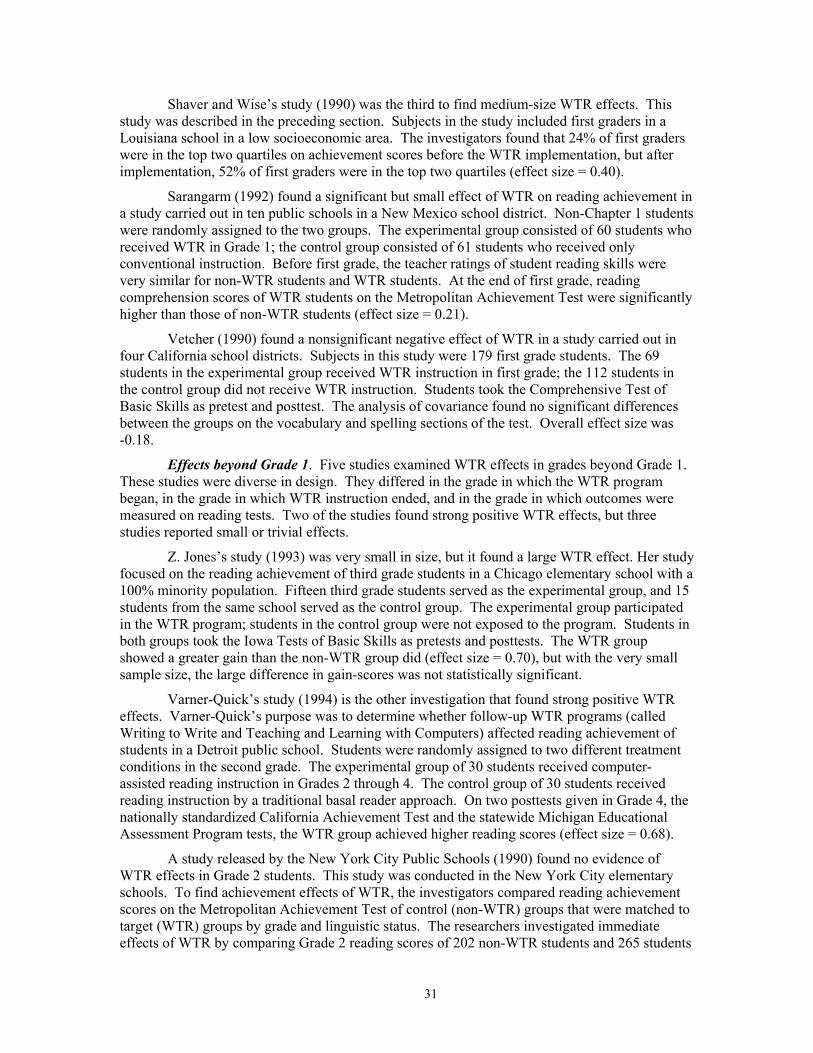
31
Shaver and Wise’s study (1990) was the third to find medium-size WTR effects. This study was described in the preceding section. Subjects in the study included first graders in a Louisiana school in a low socioeconomic area. The investigators found that 24% of first graders were in the top two quartiles on achievement scores before the WTR implementation, but after implementation, 52% of first graders were in the top two quartiles (effect size = 0.40).
Sarangarm (1992) found a significant but small effect of WTR on reading achievement in a study carried out in ten public schools in a New Mexico school district. Non-Chapter 1 students were randomly assigned to the two groups. The experimental group consisted of 60 students who received WTR in Grade 1; the control group consisted of 61 students who received only conventional instruction. Before first grade, the teacher ratings of student reading skills were very similar for non-WTR students and WTR students. At the end of first grade, reading comprehension scores of WTR students on the Metropolitan Achievement Test were significantly higher than those of non-WTR students (effect size = 0.21).
Vetcher (1990) found a nonsignificant negative effect of WTR in a study carried out in four California school districts. Subjects in this study were 179 first grade students. The 69 students in the experimental group received WTR instruction in first grade; the 112 students in the control group did not receive WTR instruction. Students took the Comprehensive Test of Basic Skills as pretest and posttest. The analysis of covariance found no significant differences between the groups on the vocabulary and spelling sections of the test. Overall effect size was -0.18.
Effects beyond Grade 1. Five studies examined WTR effects in grades beyond Grade 1. These studies were diverse in design. They differed in the grade in which the WTR program began, in the grade in which WTR instruction ended, and in the grade in which outcomes were measured on reading tests. Two of the studies found strong positive WTR effects, but three studies reported small or trivial effects.
Z. Jones’s study (1993) was very small in size, but it found a large WTR effect. Her study focused on the reading achievement of third grade students in a Chicago elementary school with a 100% minority population. Fifteen third grade students served as the experimental group, and 15 students from the same school served as the control group. The experimental group participated in the WTR program; students in the control group were not exposed to the program. Students in both groups took the Iowa Tests of Basic Skills as pretests and posttests. The WTR group showed a greater gain than the non-WTR group did (effect size = 0.70), but with the very small sample size, the large difference in gain-scores was not statistically significant.
Varner-Quick’s study (1994) is the other investigation that found strong positive WTR effects. Varner-Quick’s purpose was to determine whether follow-up WTR programs (called Writing to Write and Teaching and Learning with Computers) affected reading achievement of students in a Detroit public school. Students were randomly assigned to two different treatment conditions in the second grade. The experimental group of 30 students received computer-assisted reading instruction in Grades 2 through 4. The control group of 30 students received reading instruction by a traditional basal reader approach. On two posttests given in Grade 4, the nationally standardized California Achievement Test and the statewide Michigan Educational Assessment Program tests, the WTR group achieved higher reading scores (effect size = 0.68).
A study released by the New York City Public Schools (1990) found no evidence of WTR effects in Grade 2 students. This study was conducted in the New York City elementary schools. To find achievement effects of WTR, the investigators compared reading achievement scores on the Metropolitan Achievement Test of control (non-WTR) groups that were matched to target (WTR) groups by grade and linguistic status. The researchers investigated immediate effects of WTR by comparing Grade 2 reading scores of 202 non-WTR students and 265 students
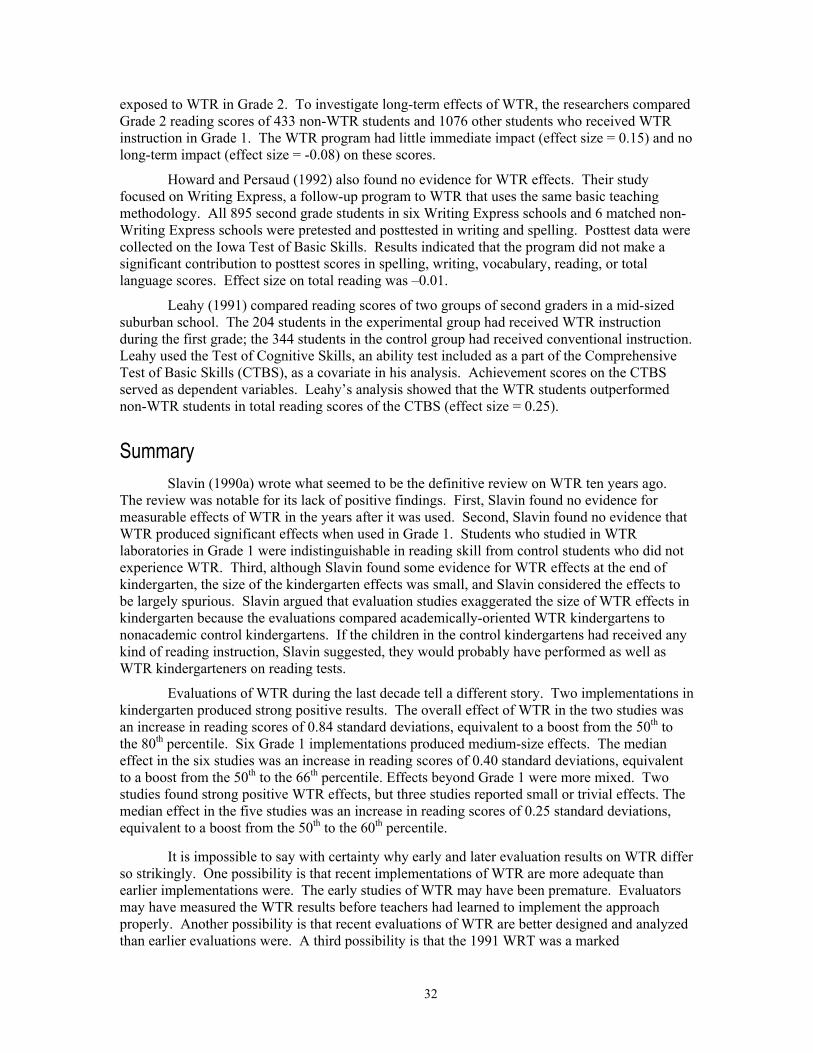
32
exposed to WTR in Grade 2. To investigate long-term effects of WTR, the researchers compared Grade 2 reading scores of 433 non-WTR students and 1076 other students who received WTR instruction in Grade 1. The WTR program had little immediate impact (effect size = 0.15) and no long-term impact (effect size = -0.08) on these scores.
Howard and Persaud (1992) also found no evidence for WTR effects. Their study focused on Writing Express, a follow-up program to WTR that uses the same basic teaching methodology. All 895 second grade students in six Writing Express schools and 6 matched non-Writing Express schools were pretested and posttested in writing and spelling. Posttest data were collected on the Iowa Test of Basic Skills. Results indicated that the program did not make a significant contribution to posttest scores in spelling, writing, vocabulary, reading, or total language scores. Effect size on total reading was –0.01.
Leahy (1991) compared reading scores of two groups of second graders in a mid-sized suburban school. The 204 students in the experimental group had received WTR instruction during the first grade; the 344 students in the control group had received conventional instruction. Leahy used the Test of Cognitive Skills, an ability test included as a part of the Comprehensive Test of Basic Skills (CTBS), as a covariate in his analysis. Achievement scores on the CTBS served as dependent variables. Leahy’s analysis showed that the WTR students outperformed non-WTR students in total reading scores of the CTBS (effect size = 0.25).
Summary Slavin (1990a) wrote what seemed to be the definitive review on WTR ten years ago.
The review was notable for its lack of positive findings. First, Slavin found no evidence for measurable effects of WTR in the years after it was used. Second, Slavin found no evidence that WTR produced significant effects when used in Grade 1. Students who studied in WTR laboratories in Grade 1 were indistinguishable in reading skill from control students who did not experience WTR. Third, although Slavin found some evidence for WTR effects at the end of kindergarten, the size of the kindergarten effects was small, and Slavin considered the effects to be largely spurious. Slavin argued that evaluation studies exaggerated the size of WTR effects in kindergarten because the evaluations compared academically-oriented WTR kindergartens to nonacademic control kindergartens. If the children in the control kindergartens had received any kind of reading instruction, Slavin suggested, they would probably have performed as well as WTR kindergarteners on reading tests.
Evaluations of WTR during the last decade tell a different story. Two implementations in kindergarten produced strong positive results. The overall effect of WTR in the two studies was an increase in reading scores of 0.84 standard deviations, equivalent to a boost from the 50th to the 80th percentile. Six Grade 1 implementations produced medium-size effects. The median effect in the six studies was an increase in reading scores of 0.40 standard deviations, equivalent to a boost from the 50th to the 66th percentile. Effects beyond Grade 1 were more mixed. Two studies found strong positive WTR effects, but three studies reported small or trivial effects. The median effect in the five studies was an increase in reading scores of 0.25 standard deviations, equivalent to a boost from the 50th to the 60th percentile.
It is impossible to say with certainty why early and later evaluation results on WTR differ so strikingly. One possibility is that recent implementations of WTR are more adequate than earlier implementations were. The early studies of WTR may have been premature. Evaluators may have measured the WTR results before teachers had learned to implement the approach properly. Another possibility is that recent evaluations of WTR are better designed and analyzed than earlier evaluations were. A third possibility is that the 1991 WRT was a marked

33
improvement over earlier versions. Whatever the explanation for the failure to find strong results in early evaluations of WTR, the fact remains that WTR has a good record of effectiveness in recent evaluation studies.
34
Reading Management
Reading management programs use the computer not as a tutorial device but rather as a tool for guiding and tracking student reading. Accelerated Reader (AR), a program designed for use in K-12 schools, is by far the most widely used of the reading management programs (Renaissance Learning, 2003). Introduced in 1986, the program is now used in an estimated 55,000 schools nationwide. Students begin using the program by selecting a story or book from thousands of titles stored in the program’s database. After reading the selected work, the student takes a computer quiz on it, and the program gives the students points based on quiz score and the length and difficulty of the selected work. The program also generates reading reports for school staff, students, and parents.
AR has gotten high ratings for effectiveness from school personnel. In a 1999 survey Becker and his associates asked school personnel about especially effective instructional software (Becker et al., 1999). AR was one of the two instructional programs most often mentioned by respondents. According to Renaissance Learning, the developer of the system, a 1994 survey by Quality Education Data asked 30,000 school librarians and media specialists to name the special school program that worked best toward improving the quality of education. More respondents named AR than any other software program.
Proponents of AR like several things about the system (Poock, 1998). They typically point to its motivational effects, noting that it fosters a love of reading and gets children excited about books. Proponents also think that the program helps students cognitively. Books that interest and challenge students, they say, stretch their minds. The more that students read, the stronger their reading and thinking skills become. Finally, proponents say that AR helps teachers with classroom management. AR tracks student performance and prints relevant reports, leaving teachers with more time for other tasks.
AR is not without its critics, however. Carter (1996) described what she considers to be some major shortcomings of the program. According to Carter, AR devalues reading and diminishes children’s intrinsic motivation by emphasizing test performance and tangible rewards for reading. Further, Carter believes that AR limits children’s freedom to choose books and thus interferes with their development of skills in independent book selection. Finally, Carter charges, AR interferes with a school’s development of an appropriate book collection, and it does not make the best uses of a school’s existing library resources.
Developer-sponsored Reviews The Web site of the School Renaissance Institute, an organization that supports school
implementation of AR, contains a list of research and evaluation reports on AR and related programs (Renaissance Learning and School Renaissance Institute, 2001). Among the 61 items listed on the site recently were 26 field reports from schools and districts; 12 journal articles, graduate theses, and independent evaluations; 9 research and evaluation reports by the developers of AR; 11 white papers by the AR developers; and 3 international research studies.
The school district reports are short summaries that contain some evaluation data on AR. For example, a report by David Moore, principal at Shelby Oaks Elementary School in Memphis, Tennessee, describes results of his school’s implementation of AR. According to the report,
35
students in Grades 4 through 6 at Shelby Oaks read 71,605 books, or one book per child every two days, in the year following AR implementation. Analysis also showed that the AR students performed very well on the Tennessee Value-Added Assessment System. Their gain in reading scores was 95% higher than the national average gain and was equivalent to two years’ growth in one year. The students also gained in other subjects, including math (28% higher than the national gain) and in language (67% higher than the national gain).
Other school reports contain similar results. Buford Elementary School in Buford, Georgia, reported that after AR implementation, students in Grades 1 through 4 showed three years of reading growth in a two-year period. Heritage Middle School in Middlebury, Indiana, reported that after AR implementation, sixth grade students achieved an average reading growth of 1.5 years during a single school year.
These reports lack some characteristics that experts have come to expect of scientific evidence. First, there is no indication on the School Renaissance Web site that independent experts checked these reports for scientific adequacy. Journal articles, conference papers, and dissertation research are usually disseminated only after undergoing expert review. Although the imprimatur of experts is not an absolute guarantee of study quality, it significantly increases confidence in research results. Second, there is no description on the Web site of procedures used to locate reports and to post them on the site.
In addition, almost all of the studies described on the School Renaissance Web site used pre-experimental designs. The studies report results for treatment groups that used AR, but they rarely if ever provide control group results. Instead of comparing scores from AR and control schools, the studies compare pretest and posttest scores in schools that use AR, or they compare scores of AR students to national or state norms. Such comparisons are far less informative than are comparisons involving control groups.
Other reports on the School Renaissance Web site describe more extensive, peer-reviewed research studies (Table 8). For example, Paul, VanderZee, Rue, and Swanson (1996) presented their report at a national reading research conference. Carried out by the developer of AR, the study investigated the relationship between school ownership of AR and standardized test scores in Texas schools. Paul and his associates formed two groups of schools for their study: 2500 schools that owned AR and 3500 schools with similar geographic and demographic characteristics that did not own AR. The investigators found that AR-owning schools performed better than non-AR schools on the Texas Assessment of Academic Skills in reading (effect size = 0.10). AR-owning schools also performed better than non-AR schools on tests in writing, math, science, and social studies. Finally, the amount of superiority of AR schools increased with the length of time the schools owned AR. Effect size on reading scores was 0.33.
Paul, Swanson, Zhang, and Hehenberger (1997) found similar results in the state of Tennessee. Their study covered five subjects in Grades 3 through 8. Paul and his colleagues formed two groups of schools: 500 schools that purchased AR and 240 that did not purchase it. For their analysis, Paul and his colleagues used test scores on the Tennessee Comprehensive Assessment Program. They analyzed both adjusted end-of-year scores and gain scores at AR and non-AR schools. The analysis showed that AR schools outperformed non-AR schools in all grades and subjects.
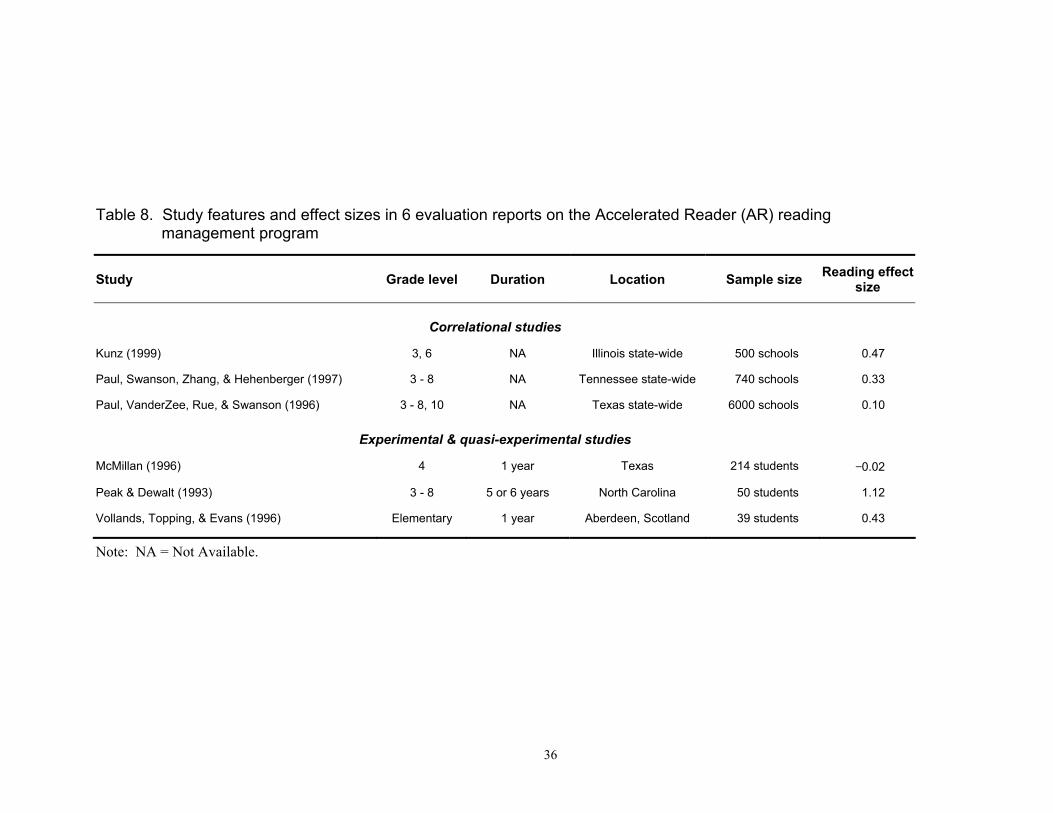
36
Table 8. Study features and effect sizes in 6 evaluation reports on the Accelerated Reader (AR) reading management program
Study Grade level Duration Location Sample size Reading effect size
Correlational studies
Kunz (1999) 3, 6 NA Illinois state-wide 500 schools 0.47
Paul, Swanson, Zhang, & Hehenberger (1997) 3 - 8 NA Tennessee state-wide 740 schools 0.33
Paul, VanderZee, Rue, & Swanson (1996) 3 - 8, 10 NA Texas state-wide 6000 schools 0.10
Experimental & quasi-experimental studies
McMillan (1996) 4 1 year Texas 214 students −0.02
Peak & Dewalt (1993) 3 - 8 5 or 6 years North Carolina 50 students 1.12
Vollands, Topping, & Evans (1996) Elementary 1 year Aberdeen, Scotland 39 students 0.43
Note: NA = Not Available.
37
It is important to note that these studies by Paul and his associates are correlational studies. The weakness of correlational evidence is well known. It is trite but true to point out that correlation does not imply causation. Investigators who use correlational designs are usually interested in making statements about cause and effect. Paul and his colleagues, for example, were interested in determining whether school ownership of AR caused student achievement to go up. Their data, however, show only that AR ownership correlates with student achievement. Although Paul and his associates argue that the correlation can be sensibly explained only by positing a causal link between the two, they cannot completely eliminate all other causal possibilities. Other factors can also explain the correlation. For example, schools with strong administrative leadership or active parent groups or more resources may be more likely to buy AR software and also to have students who do well on achievement tests.
It is also important to note that the correlation between AR ownership and reading test scores is no stronger than the correlation between AR ownership and math or science scores. Paul and his associates argue that the pervasive test superiority at AR schools is a ripple effect. That is, they believe that AR directly affects reading performance and indirectly affects performance in math and other subjects through its effect on reading. The ripple effect, however, does not explain the size of the correlations between AR ownership and math and science test scores. These correlations are as large as the correlation between AR ownership and reading achievement is. Under the ripple hypothesis, the correlation between AR ownership and math or science scores should not be so large. Ripples dissipate as you move away from the target. Another hypothesis should therefore be given very serious consideration. AR purchases may be more likely at strong schools with highly motivated students, parents, and teachers.
Whatever it is that causes the correlation between AR ownership and reading achievement, it should be noted that Paul and his associates are not the only ones who have reported it. In her doctoral dissertation, Kunz (1999) examined the relationship between school ownership of AR and student achievement in the schools of Illinois. She found 197 schools that owned AR and 303 that did not. Reading scores were higher in the schools that owned AR. The effect size was 0.47.
Independent Evaluations Results from three controlled evaluations of AR supplement the findings in school reports
and vendor-supported evaluations (Table 8). Of the three studies, Peak and Dewalt’s (1993) produced the clearest support for AR effectiveness. This five-year longitudinal study was conducted at two schools in North Carolina. Peak and Dewalt chose the two schools because they were similar in student populations, minority populations, and socioeconomic levels. One school used AR during Grades 4 through 8; the other did not. Peak and Dewalt tracked the reading scores of 25 students in Grades 3, 6, and 8 from each school. Analyses showed that the scores of the AR group increased 18 points each year from the third to the sixth grade, whereas the control group gained 10.3 points. The AR group also gained 8.5 points yearly from the sixth to the eighth grade, whereas the control group gained 4.0 points. Overall, AR effect size was 1.12.
Vollands, Topping, and Evans (1996) also found evidence of positive AR effects on reading in two projects. These projects were carried out in two primary schools in Aberdeen, Scotland. In the first project, experimental and control students had nearly identical mean ages and similar pretest scores on a reading test, but in the second project, experimental and control students were similar in neither age nor reading scores. Only the first project can yield meaningful evidence about the effects of AR. The experimental group in the first project, consisting of 27 pupils, received AR guidance in reading. The control group, consisting of 12
38
pupils, followed the normal noncomputer-based classroom reading program. Analyses showed that gains on the reading test were greater for experimental than for control students (effect size = 0.43). Experimental students also developed more positive attitudes toward reading than control students did (effect size = 0.22).
McMillan (1996) failed to find a significant AR effect on reading in a study of fourth graders in an urban school district in Texas. The investigator used a quasi-experimental pretest-posttest design in her study. Subjects in the study were 214 students from three elementary schools with similar demographic characteristics. The 67 students in the experimental group participated in the AR program; the 147 students in the control group did not. In all other respects, however, the two groups followed the district’s reading program. McMillan measured reading comprehension on the Texas Assessment of Academic Skills and gauged reading motivation from school library records. The analyses showed that AR did not significantly improve reading comprehension skills (effect size = -0.02).
Summary The success of Accelerated Reader in the marketplace is unquestionable. Its popularity
with teachers and librarians also seems clear. What is not clear at this point is whether AR’s popular success is matched by its success in improving children’s reading skills. Three statewide correlational studies have shown that reading scores are higher at schools that own AR and lower at schools that do not own the program. However, mathematics and science scores are also higher at the AR-owning schools. It is possible that a third factor produces the correlation between AR ownership and achievement scores. A promising picture also emerges from controlled studies of AR effects, but the experimental literature is very slim. Two studies found positive results from AR, but the other study found no AR effect. Median effect size in the three studies was 0.43. Clearly, more evaluation studies of AR are needed.
39
Word Processing and Computer Enrichment
Originally developed as a writing tool for business and professional writers, word processing programs are now widely used by students. According to the U.S. Department of Education’s National Center for Education Statistics (1998), 79% of fourth graders, 91% of eighth graders, and 96% of eleventh graders in 1996 reported using a computer at home or at school to write stories or papers. According to a 1999 survey, word processing software is the type of software used most often in elementary, middle, and high schools (Becker et al., 1999).
Educators began speculating about possible effects of word processing on student writing soon after the first word processing software became available. Some thought that word processors would make the mechanics of writing simpler for beginning writers. Word processors would make it easier for students to outline their ideas before starting to write and to revise and refine their drafts. With word processors, students would be able to manipulate text without laboriously copying and recopying it. Word processors might thus help young writers to produce better compositions and develop better writing habits. Studies that examined such possible word processing effects on writing dominated the literature of the 1980s and early 1990s.
In the late 1980s, researchers began wondering whether word processors would be more helpful to students if they provided writing prompts while students composed. Researchers wrote programs that provided prompts to help students with both mechanics and idea generation. By the end of the 1980s, evaluators were carrying out a new type of evaluation study. This type of study examined the effects of intelligent word processors that provided such writing prompts to beginning writers.
In recent years, student access to computers has increased dramatically, and writing experts have taken a new look at computer effects on writing. Instead of focusing exclusively on the mechanical benefits of computers, writing experts are now looking at the degree to which written communication increases in quantity and quality in computer-rich classrooms. This new perspective is a constructivist one, and it stresses the importance of students engaging in authentic writing for a variety of audiences. Some constructivists think that in a computer-rich environment, students have more opportunities for authentic writing. They communicate more in writing with peers and teachers at their schools, and they may even communicate more in writing with those outside their schools. Some constructivists believe that the ultimate payoff from this enhanced experience of writing in the real world will be an improvement in the quality of student writing.
The most widely publicized program of computer enrichment in operation today is the Anytime Anywhere Learning (AAL) program of the Microsoft Corporation and Toshiba (Microsoft Corporation, 2000a). This program supports schools in their efforts to provide students and teachers with laptop computers that they can use at any location and at any hour of the day. Inspired by an Australian program in which many schools provided laptops for teachers and students, the AAL program was set up with 52 schools in 1996. Within three years, the program grew to include more than 800 schools with 125,000 students in the United States (Microsoft Corporation, 2000b). Advocates hope that AAL and similar programs will increase the amount of authentic writing in schools and thus increase the quality of student writing.
This chapter reviews the studies that examine effects of instructional technology on student writing skills. First examined are effects of word processor use alone. Next examined is
40
effectiveness of word processors that provide prompts while students are composing. Finally, the effects of programs of computer enrichment are considered.
Word Processing Effects Studies of word processing effects compare writing skills of two groups of students.
During the experimental period one group writes their compositions using word processors. The second group writes compositions with paper and pencil. At the end of the experimental period, both groups write compositions, and an evaluator examines the quality of these end-of-instruction compositions.
Early Studies of Effectiveness
Bangert-Drowns (1993) carried out a meta-analysis of studies that looked at word processing effects on the quality of student writing. These were studies in which one group of students wrote compositions with word processors, and a second group of students wrote compositions with paper and pencil. Bangert-Drowns located 32 studies of this type. Twenty of the studies contained quantitative information on word processing effects on overall quality of student writing. These studies were conducted in elementary and secondary schools as well as in postsecondary institutions. In 13 of the studies, the students who wrote with word processors produced higher-quality compositions, but in 7 studies, the students who wrote with paper and pencil produced the better compositions. Median effect size in the 20 studies was 0.21. Bangert-Drowns reported that this effect size was significantly different from zero, but it is nevertheless a small effect. Bangert-Drowns was also unable to find any study characteristics that distinguished reliably between studies with positive effects and those with negative ones.
Bangert-Drowns’s collection of 32 studies included five studies with quantitative data on word processing effects on composition length. These five studies provided clear evidence that compositions were longer when students composed on word processors. In each of the five studies, compositions written on word processors were longer than compositions written with paper and pencil. Median effect size in the five studies was 0.36. Seven of the studies in Bangert-Drowns’s collection examined effects of word processors on student attitudes toward writing, and seven examined effects on students’ ability to write according to conventions of standard written English (e.g., using correct punctuation, capitalizing the beginning of sentences, attending to subject-predicate agreement). Bangert-Drowns found no consistent effects of word processing on these two outcome measures. Median effect size in the seven studies of attitudes was near zero, and median effect size in the seven studies of writing conventions was zero. About half of the studies in Bangert-Drowns’s collection examined effects in elementary and secondary settings and half examined effects in colleges. Analyses restricted to the elementary and secondary studies produced results that were similar to those in Bangert-Drowns’s combined analysis of precollege and college data. For example, the median effect size was 0.28 in 10 precollege studies of word processing effects on writing quality. This effect size is very similar to the median effect size of 0.21 in Bangert-Drowns’s combined analysis of precollege and college study results.
41
Recent Studies
Table 9 presents results of four recent studies of word processing effects. Two of the studies (Grejda & Hannafin, 1992; Li, 1990) found statistically significant and educationally meaningful effects of word processing on the quality of student writing. One study found a statistically significant but small effect from word processing (Beyer, 1992). The final study reported a clear negative effect of word processing on student writing (Dybdahl, Shaw, & Blahous, 1997).
Grejda and Hannafin’s study (1992) found the clearest word processing effects. The investigators randomly assigned 66 sixth graders to three groups. An experimental group of 22 students used word processors to write and revise their compositions during 10 daily lessons. A control group of 22 students used paper and pencil during this period. A third group worked with both word processors and paper and pencil. As outcome measures, the investigators measured mechanical and organizational revisions to both standard and original compositions. They found significant differences for both mechanical and organization revisions in favor of the students who used word processors. Overall, word processing effect size for the study was 0.54.
Li’s study (1990) also found significant word processing effects on the quantity and quality of student writing. Subjects were 40 students from a single eighth grade class in an Anglo-Chinese school in Hong Kong. The investigator randomly assigned 20 of the students to the experimental group and 20 to the control group for the five-month study. The two groups met together for 30 minutes of each 80-minute writing session. During these 30 minutes, the investigator discussed issues in writing essays. For the remaining 50 minutes, the experimental group worked on word processors in a computer lab while the control group worked with paper and pencil in the classroom. Analyses showed that students using computers wrote better and longer essays. Effect size on the measure of writing quality was 0.46.
Beyer’s study (1992) found effects that were statistically significant but not large enough to be considered educationally meaningful. Beyer evaluated a program in which students used computers in the classroom for writing assignments. One middle school from each of Delaware’s 16 districts participated in the program. Eleven of these schools served as experimental schools; five of the schools served as control schools. All students provided a writing sample at the beginning of the year as a pretest. At the end of the year, the students provided another writing sample, which served as the posttest. An independent third party rated all pre- and postwriting assessments (a total of 5,887 papers) on writing quality. Analysis showed that student writing skills improved with the use of computers, although effect size was low (less than 0.15).
The remaining study in this group (Dybdahl, Shaw, & Blahous, 1997) found a significant negative effect of word processing on writing quality. Participants in this study were fifth grade students in two classrooms in a single school located in an urban, northern school district. One classroom functioned as the experimental group and the other as the control group. The experimental group of 24 students used a word processing program in a computer lab for all writing assignments for the seven-month experimental period. The 17 control students did their writing by hand in the regular classroom. The two teachers involved in the study coordinated their work closely and essentially taught the same curriculum through similar learning activities. The quality of writing improved for the control group during the seven-month experimental period, but writing quality did not improve for the experimental group (effect size = -0.42).
Overall, the results of the four studies support the picture presented by Bangert-Drowns in 1993. Bangert-Drowns found that 7 out of 10 studies of word processing in K-12 schools produced positive results. The median effect size in these 10 studies was 0.28. The four word processing studies from the 1990s are consistent with Bangert-Drowns’s results. Three of the
42
four studies produced positive results. The median effect size in the four studies was 0.30. Bangert-Drowns’s conclusions about word processing and student writing, therefore, still seem to hold.
Effects of Writing Prompts Can word processing software be enhanced to make it more effective? According to
Bangert-Drowns (1993), word processing programs that provide writing prompts may produce better results than ordinary word processing programs do. Bangert-Drowns cited the Writing Partner developed by Salomon and his associates as an especially promising example of these “word processors plus.” According to Bangert-Drowns, three studies published during the 1980s showed the effectiveness of this type of software. This project’s search of the literature of the 1990s yielded two additional studies of writing prompts. These studies also produced suggestive results on the effectiveness of word processing with writing prompts, but the results are far from conclusive.
Zellermayer, Salomon, Globerson, and Givon (1991) studied three groups of 20 students in Grades 6 and 9 in a kibbutz school near Tel Aviv. Students in each of the groups wrote their essays using a word processing program. Students in the first group wrote five essays while receiving unsolicited guidance from Writing Partner; students in the second group had access to the same guidance, but they received guidance only when they asked for it; students in the third group, the control group, received no guidance. On a paper-and-pencil assignment given two weeks after termination of training, the unsolicited guidance group did significantly better than the control group (effect size = 1.34). Students in the solicited guidance group seldom asked for computer help, and their performance was like that of the control group.
Bonk and Reynolds (1992) investigated the effects of writing prompts in a sample of 164 children in the sixth, seventh, and eighth grades in a rural midwestern school. The investigators assigned the children randomly to two groups: a control group and an experimental group that received writing prompts from a word processing program. The students received the prompts when they asked for them, and the students were encouraged to ask for these prompts 8 to 12 times per hour. All students wrote pre- and post-compositions without receiving writing prompts. Results from dimensional and holistic assessments of written products indicated that students did not improve their writing performance as a result of exposure to prompts over a 6-week period. It is impossible to calculate effect sizes from the results presented by Bonk and Reynolds. In another analysis of their data, Bonk and Reynolds showed students in elementary school tend to ask for generative prompts rather than evaluative ones and that generative prompts may be less useful than evaluative ones.
Research carried out during the 1990s has advanced our knowledge of computer writing prompts. Nearly 10 years ago, Bangert-Drowns (1993) suggested that processing-plus-prompting programs might be a real boon to student writers. The sketchy data now available suggest that the effectiveness of these programs may depend on how the writing prompts are presented. Prompting appears to be effective when the computer provides them without being asked; prompting seems to have little value when students must ask the computer for help. But more research is needed to confirm this finding.
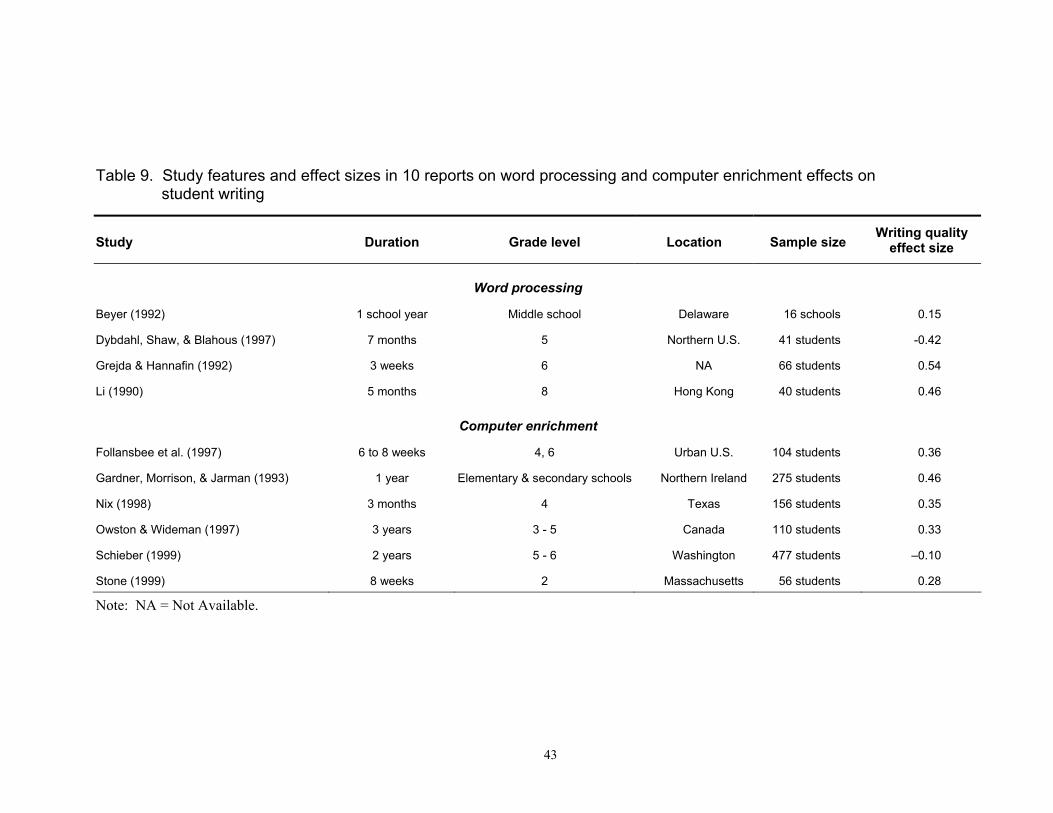
43
Table 9. Study features and effect sizes in 10 reports on word processing and computer enrichment effects on student writing
Study Duration Grade level Location Sample size Writing quality
effect size
Word processing
Beyer (1992) 1 school year Middle school Delaware 16 schools 0.15
Dybdahl, Shaw, & Blahous (1997) 7 months 5 Northern U.S. 41 students -0.42
Grejda & Hannafin (1992) 3 weeks 6 NA 66 students 0.54
Li (1990) 5 months 8 Hong Kong 40 students 0.46
Computer enrichment
Follansbee et al. (1997) 6 to 8 weeks 4, 6 Urban U.S. 104 students 0.36
Gardner, Morrison, & Jarman (1993) 1 year Elementary & secondary schools Northern Ireland 275 students 0.46
Nix (1998) 3 months 4 Texas 156 students 0.35
Owston & Wideman (1997) 3 years 3 - 5 Canada 110 students 0.33
Schieber (1999) 2 years 5 - 6 Washington 477 students –0.10
Stone (1999) 8 weeks 2 Massachusetts 56 students 0.28
Note: NA = Not Available.
44
Effects of Computer Enrichment Evaluators seldom examined the effectiveness of programs of computer enrichment
during the 1970s and 1980s. James A. Kulik’s comprehensive meta-analytic review of instructional technology studies from the 1970s and 1980s cited only five studies of computer enrichment—out of a total of 96 evaluation studies at the elementary and secondary school level (J. Kulik, 1994). The enrichment programs of this period provided students with relatively unstructured exercises of various types, including games, simulations, tutoring, and so on. The purpose of the exercises was to enrich the classroom experience and stimulate and motivate students.
The studies measured the effect of enrichment on tests of reading or mathematics or both. In three of the five studies, student test scores were lower in the group that worked in the enriched environment. The median effect of computer enrichment in the five studies was to decrease posttest scores by 0.14 standard deviations. An effect size of –0.14 is equivalent to a drop in test scores from the 50th to the 44th percentile. These results may be of limited relevance to today’s programs of computer enrichment, however, because the computer-rich environments of the 1970s and 1980s did not include many of the resources available today, including World Wide Web resources, e-mail, and laptop computers.
During the 1990s investigators turned their attention to effects of computer enrichment on student writing. Results of six studies of enrichment and writing appear in Table 9. In five of the six studies, the effect of computer enrichment on the quality of student writing was positive. In the remaining study, computer enrichment had a small but statistically significant negative effect on student writing.
Gardner, Morrison, and Jarman’s study (1993) reported the clearest positive effects of computer enrichment on student writing. Their study assessed the effects of laptop use on student writing, as well as on mathematics and science, in elementary and secondary schools in Northern Ireland. Experimental subjects were 145 students from five classes in five schools, four secondary-level schools and one primary school. Each of the students in these classes received a personal portable computer for a whole school year. These five classes were matched to five similar classes in which pupils did not have laptop access. The 130 students in these classes served as the control subjects. The investigators measured the writing performance of the experimental and control groups both before and after the treatment period by providing students with the opening sentences of a story and asking them to complete the story in up to 50 minutes. The investigators used both atomistic and holistic scales to rate writing quality. The experimental group received the higher ratings. On the average comparison, the effect size was 0.66 for the secondary-level students and 0.27 for the primary students.
Another study with clear positive results is Follansbee et al’s (1997) investigation of effects of Internet assignments on student learning. The experimental and control populations were fourth and sixth grade classes in seven urban school districts across the United States. Students in the 14 experimental classes had on-line access to the Internet. Students in the 14 control classes used traditional methods including computers but had no access to on-line resources. All students worked for 6 to 8 weeks on a project-based unit on civil rights. When the student projects were complete, the investigators asked an independent evaluator to rate a sample of the projects completed by the students receiving the experiment and control treatments. The evaluator rated 66 experimental and 38 control projects on nine factors (e.g., effectiveness of the presentation, completeness, organization). Experimental projects received the better ratings. Median effect size was 0.36.
45
Nix’s study (1998) also reported clear positive results. Nix investigated effects of regular use of an e-mail system on the writing skills of fourth graders. Subjects for the study came from two Texas schools that were similar in demographic and academic characteristics. Students in the experimental school exchanged e-mail with students at another school for the last three months of the school year. Students in the comparison school did not engage in e-mail exchanges. Nix compared improvement in handwritten essays from the two schools during the three-month treatment period. She found greater overall improvement in writing in the experimental group. This improvement was clear both with holistic scoring of essays (effect size = 0.40) and with scoring of essays using prespecified rating categories (effect size = 0.30).
Owston and Wideman’s study (1997) is important because it is a long-term study. Owston and Wideman examined student writing during a three-year period, beginning in Grade 3, at a school where students had routine daily access to word processors. They compared writing of the 52 third graders at this school with writing of 58 third graders at a nearby comparison school that had only a few, infrequently used computers in its classrooms. Both schools were located in a suburban area on the outskirts of a major Canadian city. Analyses revealed that writing quality improved significantly more in the high-computer-access school during the three years of the study. The improvement in writing quality was clear on holistic measures of content and meaning (effect size = 0.33) and on measures of technical skill in communication (effect size = 0.33).
Although positive, the results of Stone’s study (1999) are weaker than the results of other studies with favorable findings. Stone investigated the effect of using guided Internet writing activities upon the writing of second grade children. Fifty-six students from two elementary schools in Massachusetts were the subjects in the study. The 28 students in the experimental group followed a step-by-step guide with a parent at home. The guide presented Internet-based writing activities. The students completed two activities per week for eight weeks; each activity required 25 minutes or more for completion. The 28 students in the control group did not use the guide. The study coordinator administered a pretest writing activity at the start of the investigation and a postwriting activity at the conclusion of eight weeks. Although the difference in writing improvement for experimental and control groups was not statistically significant, gains were somewhat greater for the experimental group (effect size = 0.28).
Schieber’s study (1999) found that computer enrichment had a small negative effect on the quality of student writing. Twenty-four classrooms in Washington State were involved in the study. Students in nine of the classrooms (199 students) used laptop computers in instruction and homework for the school year. Students in the other 15 classrooms (278 students) were taught the same curriculum, but the students did not own laptops or use them regularly for their schoolwork. Scheiber compared writing samples from laptop and nonlaptop classrooms after two years of laptop instruction. The writing scores were similar in the two groups (effect size = -0.10).
Overall, these six studies represent a variety of approaches to computer enrichment. The six studies include investigations of both anytime-anywhere laptop programs and programs of extended Internet access. The common denominator of the six studies was their shared goal of improving writing skills by increasing student access to computer resources. The results of the six studies suggest that computer enrichment programs have the desired effect. In five of the six studies, computer enrichment had small positive effects on student writing. Effect sizes in the five studies were between 0.28 and 0.46. In the remaining study, computer enrichment had a small and statistically significant negative effect on student writing. Effect size in this study was –0.10. The median effect size of computer enrichment programs in the six studies was 0.34.
46
Summary Experts have revised their views on computers and writing over the years. During the
1980s and early 1990s, writing experts emphasized the mechanical benefits that word processors provided. They hoped that these mechanical features would make it easier for students to write easily and well. More recently, experts have focused on the amount of student writing in computer-enriched environments. Some experts believe that students with easy access to computers and computer networks attend more to written communication. This increased attention to written communications, they suggest, will translate in the long run into increased writing skill.
Evaluation studies from the 1980s found that the use of word processors had small but significant effects on student writing skills. Seven out of ten studies of word processing in K-12 schools produced positive results, and the median effect size in these ten studies was 0.28. The results of four recent studies support this positive picture of word processing effects. Three of the four recent studies produced positive results, and the median effect size in the four studies was 0.30.
Two studies from the 1980s suggested that word processing programs that contain writing prompts produce better results than ordinary word processing programs do. This project’s search of the literature of the 1990s yielded two additional studies of writing prompts. These studies suggest that effectiveness depends on how the word processors present the writing prompts. Unsolicited writing prompts seem to help students develop better writing skills, but prompts seem to be less effective when students must ask the computer for the prompts. But more research is needed on the topic of writing prompts.
The six studies of computer enrichment reviewed in this section differed among themselves in important respects. The group included both investigations of the effectiveness of anytime-anywhere laptop programs and programs of extended Internet access. The common denominator of the six studies was their shared goal of improving writing skills by increasing student access to computer resources. The results of the six studies suggest that computer enrichment programs have the desired effect. In five of the studies, computer enrichment had small positive effects on student writing. In the remaining study, computer enrichment had a small but statistically significant negative effect on student writing. Median effect size for computer enrichment programs in the six studies was 0.34.
47
Microcomputer-based Laboratories
The microcomputer-based laboratory (MBL) has long been a showpiece in discussions of computer applications in science teaching. The Office of Technology Assessment’s Power On! New Tools for Teaching and Learning called MBL instruction one of the more promising uses of computers as a tool in the science laboratory and singled out an MBL application in Walnut Creek, California, as an example of positive uses of technology in the schools. In a review of technology applications in science teaching, Weller (1996) also called attention to MBL instruction. He called MBL perhaps the most promising of all educational computing tools for providing a learner with opportunities to conduct science.
MBLs use electronic sensors to collect data on physical systems, immediately convert the analog data into digital input, and concurrently transform the digital data to a graphical system (Nakhleh, 1994; Weller, 1996). As a result, learners in MBLs are able to witness a phenomenon in the laboratory at the same time as they see a graphical representation of the phenomenon. During the late 1970s and early 1980s, Tinker and his colleagues at the Technology Education Research Center in Cambridge, Massachusetts, laid the groundwork for today’s MBL programs by developing the analog-to-digital circuits and probes that make MBLs possible. Today, MBL software is available to measure and present data on such variables as temperature, heat, light, pH, force, pressure, and motion.
Mokros and Tinker (1987) suggested that four factors contribute to the power of MBL instruction. According to these investigators, MBLs do the following:
• They represent data in different ways.
• They graph data representing physical events concurrently with the events, thus helping learners to link the two representations mentally.
• They give students a genuine scientific experience.
• They eliminate the drudgery of graph production so that students can concentrate instead on the interpretation of graphs.
MBL designers and evaluators have especially emphasized the importance of the second point of Mokros and Tinker’s list. Some MBL evaluators think of MBLs as simultaneous-time graphing laboratories.
Narrative Reviews Nakhleh (1994) reviewed studies from the 1980s and early 1990s on MBL effects on
students’ graphing skills and understanding of scientific concepts. Only a handful of the studies reviewed by Nakhleh, however, were controlled studies that compared performance of students taught in MBLs and traditional laboratories. According to Nakhleh, two controlled studies found evidence of positive MBL effects on graphing skills, but another controlled study found only mixed evidence of MBL effectiveness in teaching graphing. In addition, Nakhleh found one study with mixed evidence on the effectiveness of MBL in promoting student understanding of chemistry concepts. With such limited evidence, Nakhleh’s conclusions were cautious. She concluded that MBL study results are consistent on two points: (a) MBL is motivating and
48
satisfying to students; and (b) appropriate instruction and good curricular design greatly enhance MBL effectiveness.
Weller (1996) reported on results from six studies of MBLs. Four of these were controlled studies. Two of the controlled studies found no significant difference in results from MBLs and conventional laboratories. Two other studies found mixed results, in which the MBL group showed significant superiority over the conventional laboratory group on one test and significant inferiority on another. Weller concluded that MBL instruction held out great promise “although the evaluation results were definitely mixed” (p. 142).
Evaluation Studies of the 1990s The eight studies of MBL effects located for this review provide a better basis for
conclusions (Table 10). The studies fall into three categories: (a) two studies with significant positive effects; (b) one study with mixed effects; and (c) five studies with nonsignificant effects.
Significant effects. Occhuizzo (1993) and Chiu (1990) carried out the two studies that found significant effects. The effect sizes in the two reports were very different in size. Although both investigators found statistically significant effects, the effect size in Occhuizzo’s study was very large, and the effect size in Chiu’s study was very modest.
Occhuizzo (1993) investigated MBL effects on student achievement in a physics laboratory. Subjects in the experiment were twelfth grade students enrolled in an advanced general physics class. Fifteen students from this class who were also enrolled in a computer science class served as the experimental group; 17 students who were not enrolled in the computer science class served as the control group. The experimental group performed experiments in an MBL while the control group performed experiments in the traditional manner. Data for this study came from one of the laboratory exercises completed during the course. All students in the study were pretested on their knowledge of simple harmonic motion and their competence in performing simple pendulum experiments. Following the treatments, students were posttested on the same instrument. Analysis showed that students taught with MBL outperformed students taught in the traditional manner. The average effect size was 1.60. This is an unusually strong effect. Because the students in the experimental and control groups differed systematically in an important respect—their enrollment in a course in computer science—the anomalous findings in this study should be considered suggestive at best.
Chiu (1990) examined the effects of MBL instruction on students’ graphing skills and understanding of scientific concepts. Subjects were 72 students in four seventh grade classrooms in a school in a middle-class area in Massachusetts. Students were assigned randomly to two groups: an MBL group and a control group. For the MBL group, a microcomputer collected measurements of a student’s body position as the student performed a specific act in a short period of time, and the computer immediately graphed the resulting data. In the traditional laboratory, students took measurements of body movements, performed calculations, and manually constructed tables and graphs. Analysis showed that with pretest scores and level of ability controlled, students in the treatment group had higher posttest scores than students in the control group did. MBL effect size was 0.29.
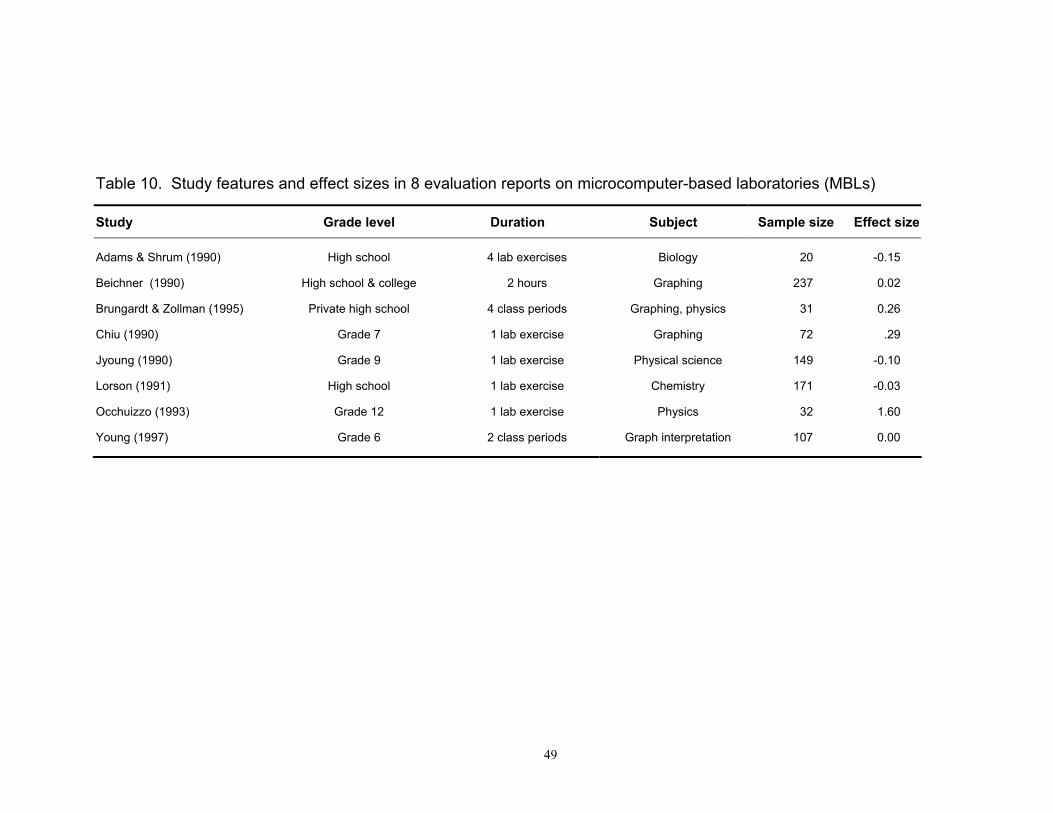
49
Table 10. Study features and effect sizes in 8 evaluation reports on microcomputer-based laboratories (MBLs)
Study Grade level Duration Subject Sample size Effect size
Adams & Shrum (1990) High school 4 lab exercises Biology 20 -0.15
Beichner (1990) High school & college 2 hours Graphing 237 0.02
Brungardt & Zollman (1995) Private high school 4 class periods Graphing, physics 31 0.26
Chiu (1990) Grade 7 1 lab exercise Graphing 72 .29
Jyoung (1990) Grade 9 1 lab exercise Physical science 149 -0.10
Lorson (1991) High school 1 lab exercise Chemistry 171 -0.03
Occhuizzo (1993) Grade 12 1 lab exercise Physics 32 1.60
Young (1997) Grade 6 2 class periods Graph interpretation 107 0.00
50
Mixed effects. Adams and Shrum (1990) found mixed MBL effects in a study of graphing skills of high school biology students. Twenty students enrolled in general biology classes at a rural high school participated in the study. The students were randomly assigned to experimental and control conditions for four laboratory exercises. The ten experimental students used a microcomputer to gather, display, and graph experimental data; the ten control students used conventional laboratory equipment and produced line graphs by hand. Analysis showed that MBL experience affected the students' graph construction and interpretation abilities. MBL students outperformed the control students on graph interpretation tasks (effect size = 0.49), but the control students outperformed the MBL group on graph construction tasks (effect size = -0.79). The average of these two effect sizes (-0.15) gives the size of the overall MBL effect on graphing skills.
Nonsignificant effects. Five studies found effects that were too small to be considered statistically significant or educationally meaningful. These were studies by Beichner (1990), Brungardt and Zollman (1995), Jyoung (1990), Lorson (1991), and Young (1997).
Beichner (1990) examined MBL graphing skills of students who carried out an exercise on motion of a projectile. He compared the graphing performance of students completing the exercise in MBL and conventional laboratories. A special characteristic of both the MBL and conventional laboratory was the elimination of student control over the projectile’s motions. Students in the MBL experiment viewed videotaped images of a moving projectile synchronized with the drawing of a graph of the projectile motion. Students in the conventional laboratory performed the laboratory exercises in a more conventional way, measuring distances on stroboscopic photographs of the moving projectile. Subjects in this study were entire physics classes from three high schools, one two-year college, and one four-year college. Beichner found that two hours of the MBL exercises in projectile motion were no more effective than conventional laboratory instruction was. The performance of the two groups on a test of graph interpretation was nearly identical (effect size = 0.02).
Brungardt and Zollman (1995), like Beichner, eliminated student control over a projectile’s motion in a study of kinematic graphing. Subjects in this study were 31 physics students at a private high school. These students were randomly assigned to two groups: a simultaneous-time MBL group and a delayed-time control group. The MBL group viewed a video showing a moving object and at the same time viewed a kinematic graph of the object’s motion. The control group saw the graph produced on the screen several minutes after viewing the video of the object in motion. After these exercises, students completed a test on graph construction and interpretation. On the posttest, the simultaneous-time group scored higher than the delayed-time group did (effect size = 0.26). The difference between groups on the posttest was not statistically significant, however. Brungardt and Zollman concluded that the simultaneous-time effect is not a critical factor in improving student learning of kinematic graphing skills.
Jyoung (1990) studied MBL effects on science learning and attitudes of physical science students. Subjects were 149 ninth grade physical science students taught by eight different teachers in five urban schools in Philadelphia. The classes were assigned to two experimental and two control treatments. One experimental group of 36 students studied Boyle’s law using computer simulations, and one control group of 40 students covered the same material in a conventional, hands-on laboratory. A second experimental group of 38 students studied the cooling curve in a MBL, whereas a second control group of 35 students covered the same material in a hands-on laboratory. Students in the four groups completed tests of knowledge of relevant science concepts, both before and after the exercises. Analysis showed that learning results were similar for the four groups. The control students carrying out the hands-on investigation of the cooling curve outperformed the MBL by a trivial amount. The difference in
51
test scores for the two groups was not statistically significant, and the effect size was very small (-0.10).
Lorson (1991) investigated the effects of MBL instruction on science understanding, graphing skills, and science attitudes of chemistry students in a suburban high school in the midwest. The investigator assigned 171 students to four treatment groups and one control group. Each of the groups performed three laboratory activities during a three-week period. Each treatment group used MBL methods for one laboratory activity and traditional methods for the remaining activities. The control group used traditional hand-collection methods. After each laboratory activity, the students took a test on the science concepts related to the activity. At the end of the five-week experimental period, students took a test on graphing skills and filled out an attitude questionnaire. Differences between experimental and control groups on all measures were very small. On the tests of laboratory concepts, average MBL effect size for the three activities was –0.03. On the test of graph interpretation, the MBL effect size was also –0.03. On attitudes toward computers, graphing, and laboratory experiments, the groups were also very similar. Average MBL effect size on attitudes was 0.01.
Young (1997) investigated effects of four instructional methods on the test performance of sixth graders who were learning to interpret graphs of displacement and velocity. Subjects were 107 sixth graders in a middle school in northwest Georgia. Young assigned these students to four treatment groups, two of which are relevant to the purposes of this review: the MBL group (N = 28), and the direct-instruction group (N = 26). Students in these groups filled out pretests and then received instruction for two class periods by the appropriate treatment method. Immediately following treatment, the students completed posttests and then two weeks later completed another set of posttests. Students in both the MBL and direct-instruction groups raised their scores from pretest to posttest. There was no significant difference in the posttest scores of the two groups, however. Average MBL effect size for the first posttest was –0.06. Average MBL effect size for the second posttest was 0.05.
Summary MBLs have long been viewed as the most promising of all computer applications in
science. MBLs appeal to science educators because they synchronize the occurrence of scientific events with the symbolic representation of these events in graphs. MBLs thus give students simultaneous concrete and abstract views of scientific phenomena. They also eliminate the drudgery of graph production so that students can concentrate instead on interpretation and understanding. Reviewers who examined the early literature on MBL effectiveness, however, had a hard time finding studies that showed learning benefits from MBL instruction. The few studies with positive results seemed to be balanced by studies with mixed and negative MBL results.
This review also failed to come up with strong evidence for MBL effectiveness. The literature search yielded eight studies of MBL effectiveness carried out during the 1990s. One of the studies found a very strong MBL effect, an improvement of 1.6 standard deviations on a criterion test, but strong uncontrolled factors seem to be present. The other seven studies found MBL effect sizes between –0.14 and 0.30. The median of the eight effect sizes was a trivial 0.01. In the typical study, students learned just as much without MBL as with MBL.
52
Tutorials and Simulations
Teachers have long been concerned about the difficulties that students have with basic concepts in the natural and social sciences. Researchers have carefully studied misconceptions in such fields as physics, chemistry, and biology, and they have found that the misconceptions are stubbornly resistant to change. Some educators believe that schools need to invent new ways to teach concepts to clear up student misconceptions. Two promising alternative approaches that involve computers are computer tutoring programs and computer simulation programs.
Computer tutoring programs use a familiar educational format. They present instructional material to a learner, require the learner to respond to the material, evaluate the response, and then on the basis of this evaluation determine what to present next. B. F. Skinner used the same blueprint for his programmed teaching machines during the 1950s. But computer programs can do much more than mechanical teaching machines ever did. They can store vast amounts of instructional material, and they can present it with sophisticated graphics, animations, and audio help. The programs can collect information on student responses and then use this information to guide students through the material on individualized paths. Computer tutoring programs are so named because they are meant to do the same things that individual tutors do. Computer tutoring is sometimes considered to be synonymous with computer-assisted instruction (CAI). Computer tutoring is a broad category of instructional applications. Included in this category are the ILS programs described in an earlier section of this report. ILSs, however, have several special characteristics. ILSs span several grade levels in one or more curriculum areas, and they are usually used for instruction in the basic skills areas of reading and mathematics. Computer tutorials used in the natural and social sciences, on the other hand, have a more specific focus. They usually provide in-depth instruction on a concept or on a single area within a specific course. They seldom extend over several grade levels, and computer networks are seldom an important part of computer tutorials.
Computer simulations provide science students with theoretical or simplified models of real-word phenomena—for example, a frictionless world where the laws of Newtonian physics are more apparent—and they invite students to change features of the models so that they can observe the results. Science teachers can use simulations in a variety of ways. They can use them to prepare students for future learning, or they can use them to supplement or replace other expositions on a topic. For example, a teacher might use a simulated frog dissection as a preparation for an actual dissection or as a substitute for a laboratory dissection. Science teachers can also use simulations to help students integrate facts, concepts, and principles that they learned separately. For example, students might play the role of world leaders or citizens in other countries in a simulation designed to help them apply their learning to realistic problems.
Early Studies of Effectiveness James A. Kulik’s 1994 review examined 97 separate evaluations of computer
applications to teaching in elementary and secondary schools (J. Kulik, 1994). Included in the group of 97 studies were 58 studies of tutoring programs and 6 studies of simulations carried out during the 1970s and 1980s. The results from the two types of studies were very different.
Results in the 58 studies of computer tutoring were favorable to technology-based teaching approaches. In 55 of the 58 studies, the test scores of the computer tutorial group were
53
higher than the control group’s scores; in the remaining studies, the control group’s scores were higher. The effect sizes in the 58 studies were between –0.42 and 1.44. The median effect size was 0.36. This effect is large enough to be considered educationally meaningful. It suggests that computer-tutored students would perform at the 64th percentile on relevant achievement tests, whereas conventionally taught students would perform at the 50th percentile.
The six simulation studies told a different story. All of these studies were carried out as dissertation research, and all but one of the studies was carried out in high school science courses. In three of the studies, the conventionally taught students outscored the computer-taught group on achievement tests. In one study, results were mixed. In this study, the control group’s scores were higher than the computer group’s scores on one test but lower on another test. In the two remaining studies, the achievement scores for the computer simulation group were higher than the for the control group. The differences between groups in the six studies were generally small, however. The effect sizes in these studies were between –0.18 and 0.69. Median effect size in the six studies was –0.06.
More Recent Studies of Effectiveness This project’s review of the literature on instructional technology yielded six controlled
studies of computer tutorials and six controlled studies of computer simulations in science.
Computer Tutorials
The studies of computer tutorials examined two kinds of instructional outcomes: student achievement and student attitudes (Table 11). Effects of computer tutorials on both outcomes were positive. In five of the six studies of achievement effects, the computer-tutorial group outscored the control group by an amount that was large enough to be considered both statistically significant and educationally meaningful. The remaining study of achievement effects found that computer tutorials had no effect on student learning. In addition, five studies examined attitudinal effects of computer tutoring programs. Each of these studies found a significant tutoring effect on student attitudes, and in three of the five cases, the tutoring effect on attitudes was very large.
Adonri and Gittman’s investigation (1998) was one of the studies in which tutoring had large effects on both achievement and attitudinal outcomes. The investigators studied a tenth grade global studies course in a public high school in Brooklyn, New York. They selected and assigned 70 students to experimental and control groups using random selection and assignment techniques. The experimental group received CAI in a computer laboratory for 40 minutes a day for two days per week for six weeks. The CAI software used in the study was a computer-controlled videodisc program entitled Communism and the Cold War. The control group received traditional instruction. A pretest confirmed the equivalence of the two groups. At the end of the experimental period, the groups completed a posttest on global studies. Analysis showed that students using CAI achieved significantly higher scores than did students taught by traditional methods (effect size = 1.48). An attitude survey showed an increase in interest in the subject for students who were taught with CAI (effect size = 3.09). These are extraordinarily large effect sizes, but they are not anomalous in this group of studies.
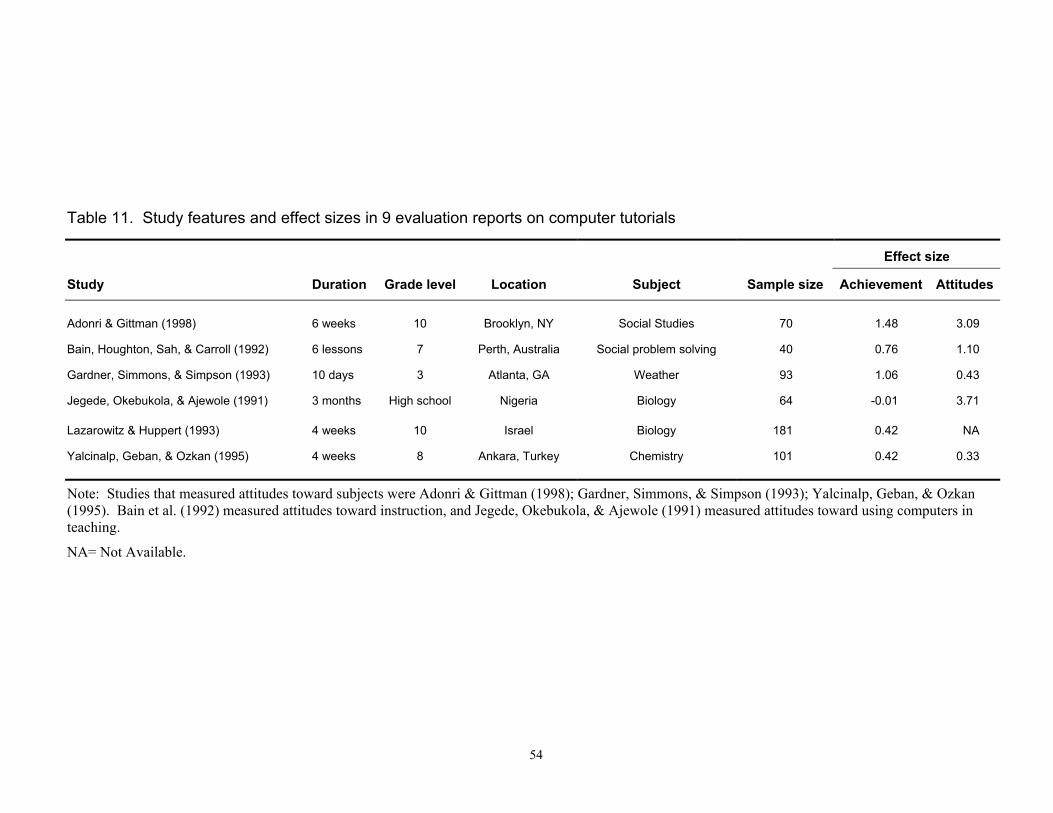
54
Table 11. Study features and effect sizes in 9 evaluation reports on computer tutorials
Effect size
Study Duration Grade level Location Subject Sample size Achievement Attitudes
Adonri & Gittman (1998) 6 weeks 10 Brooklyn, NY Social Studies 70 1.48 3.09
Bain, Houghton, Sah, & Carroll (1992) 6 lessons 7 Perth, Australia Social problem solving 40 0.76 1.10
Gardner, Simmons, & Simpson (1993) 10 days 3 Atlanta, GA Weather 93 1.06 0.43
Jegede, Okebukola, & Ajewole (1991) 3 months High school Nigeria Biology 64 -0.01 3.71
Lazarowitz & Huppert (1993) 4 weeks 10 Israel Biology 181 0.42 NA
Yalcinalp, Geban, & Ozkan (1995) 4 weeks 8 Ankara, Turkey Chemistry 101 0.42 0.33
Note: Studies that measured attitudes toward subjects were Adonri & Gittman (1998); Gardner, Simmons, & Simpson (1993); Yalcinalp, Geban, & Ozkan (1995). Bain et al. (1992) measured attitudes toward instruction, and Jegede, Okebukola, & Ajewole (1991) measured attitudes toward using computers in teaching.
NA= Not Available.
55
Bain, Houghton, Sah, and Carroll (1992) also found large tutorial effects on both achievement and attitude measures. These investigators studied the effectiveness of an interactive video program used to teach social problem solving to early adolescents. Subjects were 40 elementary school students in two Grade 7 classes in Perth, Australia. Students were randomly assigned to three groups. One experimental group (N = 13) received interactive video instruction only; a second group (N = 14) received teacher-led instruction with linear video; a third group (N = 13) received teacher-led instruction with no video support. At the completion of the six lessons, students in the three groups completed a criterion-referenced achievement test and a measure of attitudes toward instruction. Analyses found statistically significant differences among groups in achievement and attitude. The interactive video condition proved superior to the control group in achievement (effect size = 0.76) and in attitudes toward instruction (effect size = 1.10).
Gardner, Simmons, and Simpson’s investigation (1993) is the third study in this group to find very large tutoring effects on student achievement. The investigators carried out their study in an elementary school in Atlanta, Georgia. They assigned five intact third grade classes from this school to experimental and control treatment groups. An experimental group of 46 students carried out hands-on activities in meteorology while working on the CAI program Weatherschool. A control group of 47 students worked on the same activities without CAI help. Both before and after the 10 days of hands-on activities, the two groups took a test on meteorology knowledge and filled out a questionnaire on attitudes toward science and computers. Analyses showed that pre-post gains for the experimental group were higher than control gains on both learning and attitude measures. Size of effect was 1.06 on the meteorology test and 0.43 on attitudes toward science and computers.
Yalcinalp, Geban, and Ozkan (1995) found tutoring effects of moderate size on both student achievement and attitudes in a study carried out in a secondary school in Ankara, Turkey. Subjects in the study were 101 eighth grade students enrolled in two classes of a general science course. The investigators randomly assigned the students to two groups: an experimental group of 51 students and a control group of 50 students. Those in the experimental group received instruction for two hours per week for four weeks from a researcher-developed tutorial program on mole-number-mass interrelations in elements and compounds. Students in the control group attended recitation sections during the same period. At the end of the four-week study, the experimental group students outscored the control group on both achievement tests and attitude scales. Effect size on a test of chemistry concepts was 0.42. Effect size on the scale of attitudes toward chemistry as a school subject was 0.33.
Lazarowitz and Huppert (1993) also found moderate-size effects from computer tutoring in a high school biology class in Israel. The investigators assigned two classes to an experimental treatment and three classes to a control treatment for the four-week study. The experimental group students (N = 82) received a combination of classroom laboratory instruction and CAI during this period. CAI software used in the study was The Growth Curve of Microorganisms, a researcher-developed program. The control group students (N = 99) received instruction in a traditional classroom laboratory. The two groups of students were similar in entry-level knowledge and behaviors. Analysis of covariance showed that the groups differed, however, on posttests measuring science knowledge and process skills. Effect size on the tests was 0.42.
Jegede, Okebukola, and Ajewole’s study (1991) was the only one in the group to find no computer tutoring effect on student achievement. Subjects were 64 students who were studying biology in a high school in Nigeria. The students were randomly assigned to three groups: (a) 10 students used a tutorial program individually for three months; (b) 30 students used the program in groups of three students; and (c) 24 control students received conventional lecture instruction. The tutorial program used in this study was School Software BIO 101. At the end of the three-
56
month experimental period, students completed an achievement test on relevant topics and also filled out a questionnaire measuring attitudes towards using computers in teaching. Control students and students who used the computer either individually or in groups did not differ in achievement test scores (effect size = -0.01). On attitudes toward using the computer in teaching, the tutorial students were very different from the controls. Attitudes in the tutorial group were far more favorable than control group attitudes (effect size = 3.71).
Overall, the results of these six studies suggest that computer tutoring can be a very effective aid when it is used in teaching concepts in elementary and secondary schools. For the six studies reviewed here, the median effect size was 0.59 for achievement measures. This suggests that students who received computer tutorials in these studies would perform at the 72nd percentile on their tests, whereas students receiving conventional instruction alone would perform at the 50th percentile. The median effect size was 1.10 for attitudinal outcomes. This means that computer tutoring also contributed to the development of favorable attitudes toward instruction and toward the subjects being taught in these studies.
Computer Simulations
Instructional developers and researchers have developed several taxonomies for classifying simulations. Some of their taxonomies are complex, but some are simple. Among the simplest and most attractive is Alessi and Trollip’s (2001) classification of simulations into two types: conceptual and procedural ones. The simulations evaluated in the controlled studies are mostly of the procedural type. The evaluation results for this type of simulation are not as impressive as tutorial results are (Table 12). Of the six studies of computer simulations, four produced positive effects and two produced negative effects. Kinzie, Strauss, and Foss’s study (1993) examined the use of an interactive video-based simulation of frog dissection in a biology laboratory. They found that this simulation produced a strong positive effect on student learning when viewed by students as preparation for laboratory dissection, but the simulation was only moderately effective when used as a substitute for laboratory dissection. Sixty-one high school students, who were enrolled in three high school biology classes, participated in this research over a four-day period. At the beginning and end of the experimental period, all students took an achievement test measuring knowledge of frog anatomy and dissection procedures. Students also completed a measure on attitudes toward dissection. When used as a substitute, the simulation was more effective than actual dissection in promoting student learning of frog anatomy and dissection procedures (effect size = 0.39), but it was not effective in changing student attitudes toward dissection (effect size = -0.12). When used as a preparation, the simulation proved to be more valuable. Students using the simulation as a preparation performed a subsequent dissection more effectively than did students who received no preparation. Students using the simulation as preparation also learned more about frog anatomy and dissection than those who dissected without preparation (effect size = 1.23). When used as a preparation device, the simulation also had a positive effect on student attitudes toward dissection (effect size =0.17).
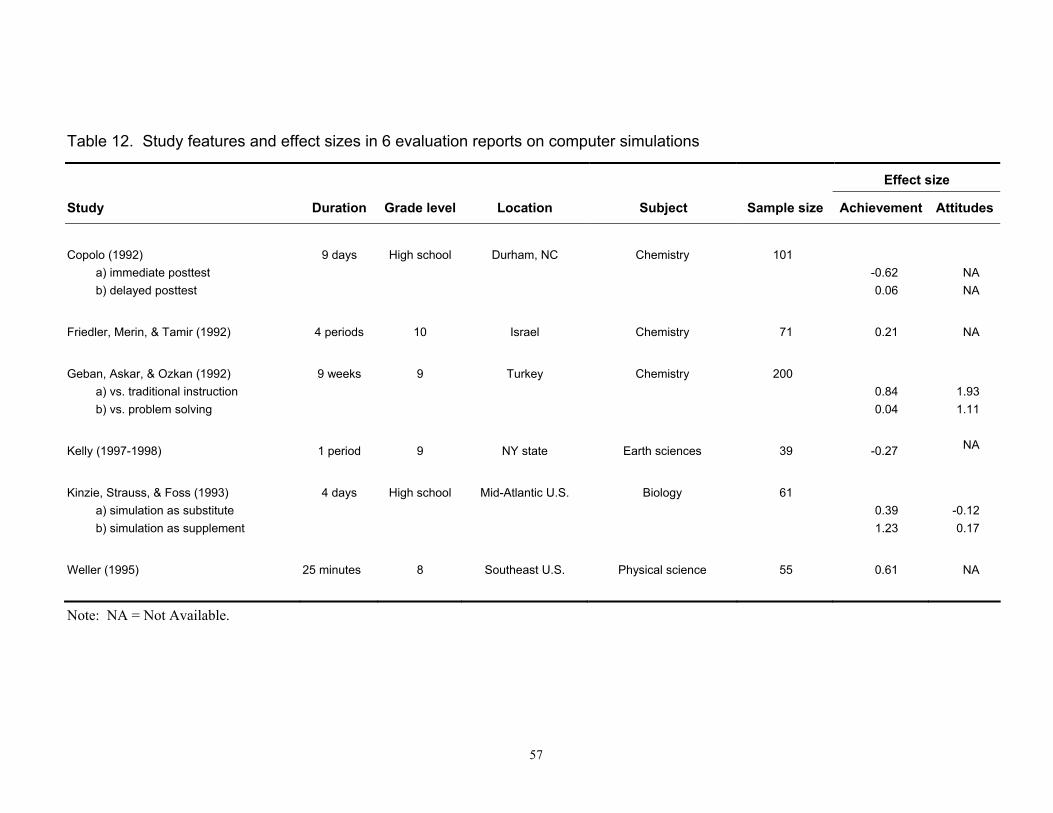
57
Table 12. Study features and effect sizes in 6 evaluation reports on computer simulations
Effect size
Study Duration Grade level Location Subject Sample size Achievement Attitudes
Copolo (1992) 9 days High school Durham, NC Chemistry 101 a) immediate posttest -0.62 NA b) delayed posttest 0.06 NA
Friedler, Merin, & Tamir (1992) 4 periods 10 Israel Chemistry 71 0.21 NA
Geban, Askar, & Ozkan (1992) 9 weeks 9 Turkey Chemistry 200 a) vs. traditional instruction 0.84 1.93 b) vs. problem solving 0.04 1.11
Kelly (1997-1998) 1 period 9 NY state Earth sciences 39 -0.27
NA
Kinzie, Strauss, & Foss (1993) 4 days High school Mid-Atlantic U.S. Biology 61 a) simulation as substitute 0.39 -0.12 b) simulation as supplement 1.23 0.17
Weller (1995) 25 minutes 8 Southeast U.S. Physical science 55 0.61 NA
Note: NA = Not Available.
58
Weller (1995) also found that computer simulations were moderately to strongly effective. Weller studied the misconceptions of force and motion of eighth grade physical science students. Subjects in the study were 55 students in schools in the southeastern United States. Weller assigned the students randomly to two groups: an experimental group of 27 students who worked on two remediation simulations for about 25 minutes and a control group of 28 students who studied only in regular classroom settings. At the completion of the experimental period, students in both groups completed a posttest. Weller reported that experimental and control students showed very different patterns of nonscientific answers on this test. Students who worked with the computer simulations showed fewer misconceptions than did the control students (effect size = 0.61).
Geban, Askar, and Ozkan (1992) found computer-simulated experiments (CSE) to be moderately effective in increasing the achievement of high school chemistry students but very powerful in developing favorable student attitudes toward chemistry. These investigators assigned six ninth grade chemistry classes in a high school in Turkey to three treatments: an experimental group of 60 students who worked on CSE during the nine-week study; a control group of 70 students who studied with a conventional approach; and a third group of 70 students who used a problem-solving approach. At the completion of the nine-week study, students completed a test of chemistry knowledge, a test of scientific process skills, and a scale of attitudes toward chemistry. The CSE group outperformed the control group on tests of chemistry knowledge and scientific process skills. The effect size was 0.91 for chemistry knowledge and 0.77 of scientific process skills. The effect size was 1.93 on attitudes toward chemistry. The CSE group’s test performance, however, was very similar to the problem-solving group’s performance (effect sizes were 0.06 for chemistry knowledge and 0.02 for scientific process skills). Attitudes toward chemistry were more favorable for the CSE group than for the problem-solving group (effect size = 1.11).
Friedler, Merin, and Tamir (1992) found that computer simulations had a significant but small effect on student achievement. These investigators carried out their study in six high schools in Israel. Included among the students in these schools were two groups of tenth graders who completed pretests and posttests. The experimental group of 41 students devoted four double periods to work with a simulation on enzyme reactions. The control group of 30 students carried out their laboratory experiments without using the computerized simulations. After the laboratory investigations, students in both groups completed essay and multiple-choice tests on enzymatic reactions. Analysis of covariance showed that the group using computer simulation outperformed the students in the conventional laboratory (effect size = 0.21).
Copolo’s investigation (1992) was one of the two studies in this group in which computer simulations failed to have positive effects. This study investigated the use of three-dimensional computer-simulated models of molecular structure in a high school in Durham, North Carolina. Subjects were 101 eleventh graders in four chemistry classes. Copolo assigned the classes to four treatment groups, including an experimental group of 26 students who used computer representations to study molecular structure and a control group of 26 students who studied molecular structures from textbook representations. The computer software used in the study was Molecular Editor. After nine days of instruction, students took three posttests on molecular structures; 40 days later, they took a delayed retention test on the same topic. Analysis showed that students who learned from paper and pencil representations outperformed the computer simulation group on the immediate posttest (effect size = -0.62) but not on the delayed retention measure (effect size = 0.06).
Kelly’s investigation (1997-98) was the other study in which computers did not have a positive effect on student learning. Kelly’s study focused on a computer simulation of mineral identification. Subjects in the study were 39 students who were enrolled in an earth science
59
course in a New York high school. Students in the control group examined actual mineral samples during one laboratory class period. Students in the experimental group were shown only scanned pictures of mineral samples on the computer screen. They were not allowed to handle real samples of their minerals. On the mineral identification portion of the New York State Regents Examination, there was no statistically significant difference in test scores of the group using real minerals and the group using a computer simulation. The group using real minerals outperformed the group using computer simulations (effect size = -0.27), but the difference in scores of the two groups was not statistically significant.
Overall, the results of these six studies suggest that computer simulations can sometimes be used to improve the effectiveness of science teaching, but the effectiveness of computer simulations cannot be taken for granted. The median effect size in the six studies was 0.32 for achievement outcomes. This suggests that students who worked on simulations in their classes performed at the 63rd percentile, while students learning without simulations performed at the 50th percentile. But the results of the six studies were variable, and two out of the six studies had negative effect sizes. This means that the success of computer simulations is far from guaranteed.
Summary For more than three decades, evaluators have been documenting the positive effects of
technology-based tutorial instruction. Evaluation studies of the 1970s and 1980s usually found that students learned more in K-12 classes that included computer tutorial components. Six evaluation studies released during the past decade found similar results. In all but one of the six studies, the effect of computer tutoring was large enough to be considered statistically significant and educationally meaningful. In the remaining study, the boost from computer tutoring was near zero. In the median case, the effect of computer tutorials was to raise student achievement scores by 0.59 standard deviations, or from the 50th to the 72nd percentile.
Science educators often think of simulation programs as an advance over tutorial programs. That is because simulation programs are designed to help students achieve higher-order instructional objectives, whereas tutorial programs seem to focus on more mundane objectives. Results from evaluations of simulations, however, are weaker and less consistent than are results from studies of tutorials. Although simulation programs sometimes improve the effectiveness of science teaching, some studies conducted during the 1980s and 1990s found negative effects from simulations. Teachers therefore may need to use some care in deciding when to use simulations, which simulations to use, and how to use them.
60
Conclusion
It is not yet clear how much computer-based programs can contribute to the improvement of instruction in American schools. Although many researchers have carried out controlled evaluations of technology effects during the last three decades, the evaluation literature still seems patchy. For most technologies, results are available only at selected grade levels, in selected subjects, and on selected instructional outcomes. The literature is too uneven for sweeping conclusions about the effectiveness of instructional technology. Nonetheless, results are consistent enough for some tentative conclusions in some areas.
Evaluation studies of the past decade have consistently found, for example, that integrated learning systems (ILSs) make little or no contribution to the improvement of reading programs, but other research suggests that ILSs are usually incompletely implemented. The job for future evaluators is to determine whether fully implemented ILSs will make more of a contribution. Questions also surround IBM’s Writing to Read (WTR). WTR has a good record of effectiveness in evaluation studies carried out during the past decade, but WTR had a rather poor record in earlier evaluation studies. Researchers and analysts still have to find an explanation for the difference in results of early and later evaluations of WTR. Finally, several studies found that the reading management program Accelerated Reader may be very helpful to students in both elementary and secondary schools. However, too few experimental studies are available at this point for firm conclusions.
It has become clear during the past decade that computers can be valuable tools in improving writing skills. Evaluation studies from the 1980s usually found that students who were required to compose on word processors improved in writing skills more than control students did, and evaluation studies from the last decade found similar results. Although effects in most studies of word processing were only moderate in size, the effects were nonetheless large enough to be considered educationally meaningful. In addition, a few studies have found that word processing programs would have greater instructional effects if they could provide writing tips for the students who were using them. Studies from the last decade also show that simply giving students greater access to computers and Internet resources often results in gains in writing skill. Evaluators during the 1980s often reported that such computer enrichment produced only indifferent results. The failure to find positive effects may have been due to the limited amount of enrichment in the programs of the 1980s or to weaknesses in the evaluation designs in these early studies. Whatever the reason for the poor findings in earlier studies, the picture changed during the last decade. Most studies carried out during the last decade found that enrichment programs have positive effects on student writing skills.
It is also clear that instructional technology often improves teaching programs in mathematics and in the natural and social sciences. ILS programs, which usually rely heavily on tutorial instruction, have been producing positive results in mathematics programs for decades. Computer tutorials in natural and social science classes also have had an almost uniformly positive record of effectiveness in the1970s, 1980s, and 1990s. Science educators often think of simulation programs and microcomputer-based laboratories (MBLs) as advances over tutorial programs. Evaluation results from simulations and MBLs, however, are weaker and less consistent than are the results from tutorial programs. Although simulation programs sometimes improve the effectiveness of science teaching, some studies conducted during the 1980s and
61
1990s found negative effects from simulations. Teachers therefore may need to use some care in deciding when to use simulations, which simulations to use, and how to use them. Results from MBLs are usually small, and they are negative as often as positive.
Overall, however, evaluation studies suggest that instructional technology is growing increasingly effective in elementary and secondary school applications. This growing effectiveness should not come as a great surprise. Computers have improved dramatically during the last three decades. Today’s computers are faster, friendlier, and more visually and aurally sophisticated than yesterday’s models. In addition, students are more computer-literate today than they were in years past, and many teachers have become sophisticated users and designers of instructional software in recent years. Recent evaluation studies suggest that instructional technology is thriving in this climate and that computers—which have transformed society in so many ways—can also make teaching more effective in elementary and secondary schools.
62
References
Adams, D. D. and John W. Shrum. 1988, April. The Effects of Microcomputer-Based Laboratory Exercises on the Acquisition of Line Graph Construction and Interpretation Skills by High School Biology Students. Paper presented at the 61st Annual Meeting of the National Association for Research in Science Teaching, Lake of the Ozarks, MO. (ERIC Document Reproduction Service No. ED 292 652).
Adonri, Osa E. and Elizabeth Gittman. 1998, October. Effect of Computer Assisted Instruction on Students' Achievement in Global Studies. Paper presented at the Annual Meeting of the Northeastern Educational Research Association, Ellenville, NY. (ERIC Document Reproduction Service No. ED 429 912).
Alessi, Stephen M. and Stanley R. Trollip. 2001. Multimedia for Learning: Methods and Development. Boston: Allyn and Bacon.
Bailey, Gerald. D. 1992. "Wanted: A Road Map for Understanding Integrated Learning Systems." Educational Technology 32(9):3-5.
Bain, Alan, Stephen Houghton, Foo B. Sah, and Annemaree Carroll. 1992. "An Evaluation of the Application of Interactive Video for Teaching Social Problem-Solving to Early Adolescents." Journal of Computer-Based Instruction 19(3):92-99.
Bangert-Drowns, Robert L. 1993. "The Word Processor As an Instructional Tool: A Meta-Analysis of Word Processing in Writing Instruction." Review of Educational Research 63(1):69-93.
Bangert-Drowns, Robert L., James A. Kulik, and Chen-Lin C. Kulik. 1985. "Effectiveness of Computer-Based Education in Secondary Schools." Journal of Computer-Based Instruction 12(3):59-68.
Becker, Henry J. 1991. "How Computers Are Used in United States Schools: Basic Data From the 1989 I.E.A. Computers in Education Survey." Journal of Educational Computing Research 7 (4):385-406.
Becker, Henry J. 1992. "Computer-Based Integrated Learning Systems in the Elementary and Middle Grades: A Critical Review and Synthesis of Evaluation Reports." Journal of Educational Computing Research 8(1):1-41.
Becker, Henry J. 1994. "Mindless or Mindful Use of Integrated Learning Systems." International Journal of Educational Research 21(1):65-79.
Becker, Henry J. and Nira Hativa. 1994. "History, Theory and Research Concerning Integrated Learning Systems." International Journal of Educational Research 21(1):5-12.
63
Becker, Henry J., Jason L. Ravitz, and Wong Yan-Tien. 1999. Teacher and Teacher-Directed Student Use of Computers and Software. Report #3. Irvine, CA: University of California, Center for Research on Information Technology and Organizations.
Beyer, Francine S. 1992, April. Impact of Computers on Middle-Level Student Writing Skills. Paper presented at the Annual Meeting of the American Educational Research Association at San Francisco, CA. (ERIC Document Reproduction Service No. ED 345 297).
Bonk, Curtis J. and Thomas H. Reynolds. 1992. "Early Adolescent Composing Within a Generative-Evaluative Computerized Prompting Framework." Computers in Human Behavior 8(1):39-62.
Brungardt, John B. and Dean Zollman. 1995. "Influence of Interactive Videodisc Instruction Using Simultaneous-Time Analysis on Kinematics Graphing Skills of High School Physics Students." Journal of Research in Science Teaching 32(8):855-69.
Brush, Thomas A. 1997. "The Effects on Student Achievement and Attitudes When Using Integrated Learning Systems With Cooperative Pairs." Educational Technology Research and Development 45(1):51-54.
Burns, Patricia K. and William C. Bozeman. 1981. "Computer-Assisted Instruction and Mathematics Achievement: Is There a Relationship?" Educational Technology 21:32-39.
Carter, Betty. 1996. "Hold the Applause!: Do Accelerated Reader and Electronic Bookshelf Send the Right Message?" School Library Journal 42(10):22-25.
Chiu, Mei-Hung. 1990. "The Effectiveness Of Microcomputer-Based Laboratories In Teaching Scientific Skills And Concepts: A Comparative Study." Doctoral dissertation, Harvard University. Dissertation Abstracts International, 51, no. 06A (1990): 1974. (UMI Number: AAG 9032415).
Chomsky, Carol. 1971. "Write First, Read Later." Childhood Education 47(6):296-99.
Christopher, Martha W. 1991. "The Writing Approach To Literacy: A Comparison Of Writing Influences On Reading In Six Elementary Schools." Doctoral dissertation, The University of New Mexico. Dissertation Abstracts International, 52, no. 08A, (1991): 2871. (UMI Number: AAG 9201043).
Clariana, Roy B. 1994. The Effects of an Integrated Learning System on Third Graders' Mathematics and Reading Achievement. San Diego, CA: Jostens Learning Corporation. (ERIC Document Reproduction Service No. ED 409 181).
Clariana, Roy B. 1996. "Differential Achievement Gains for Mathematics Computation, Concepts, and Applications With an Integrated Learning System." Journal of Computers in Mathematics and Science Teaching 15(3):203-15.
64
Cohen, Jacob. 1977. Statistical Power Analysis for the Behavioral Sciences (Revised Edition). New York: Academic Press.
Coley, Richard, John Cradler, and Penelope K. Engel. 1997. Computers and Classrooms: The Status of Technology in U.S. Schools. Policy Information Report. Princeton, NJ: Policy Information Center, Educational Testing Service.
Collis, Betty, Lloyd Ollila, and Kathleen Ollila. 1990. "'Writing to Read': An Evaluation of a Canadian Installation of a Computer-Supported Initial Language Environment." Journal of Educational Computing Research 6(4):411-27.
Copolo, Cynthia F. 1992. "Using Hand-Held and Computer Models As Manipulatives to Teach Organic Isomers in Three Dimensions." Doctoral dissertation, University of North Carolina. Dissertation Abstracts International, 53, no 11A (1992): 3860. (UMI Number: AAG 9309858).
Dybdahl, Claudia S., Donna G. Shaw, and Emily Blahous. 1997. "The Impact of the Computer on Writing: No Simple Answers." Computers in the Schools 13(3-4):41-53.
Fletcher, J. D., David E. Hawley, and Philip K. Piele. 1990. "Costs, Effects, and Utility of Microcomputer-Assisted Instruction in the Classroom." American Educational Research Journal 27(4):783-806.
Follansbee, Sari, Bob Hughes, Bart Pisha, and Skip Stahl. 1997. "Can Online Communications Improve Student Performance? Results of a Controlled Study." ERS Spectrum 15(1):15-26.
Freyd, Pamela and James H. Lytle. 1990. "A Corporate Approach to the Two R's: A Critique of IBM's Writing to Read Program." Educational Leadership 47(6):83-89.
Friedler, Yael, Ora Merin, and Pinchas Tamir. 1992. "Problem-Solving Inquiry-Oriented Biology Tasks Integrating Practical Laboratory and Computer." Journal of Computers in Mathematics and Science Teaching 11(3-4):347-57.
Gardner, J., H. Morrison, and R. Jarman. 1993. "The Impact of High Access to Computers on Learning." Journal of Computer Assisted Learning 9(1):2-16.
Gardner, Catherine M., Patricia E. Simmons, and Ronald D. Simpson. 1992. "The Effects of CAI and Hands-On Activities on Elementary Students' Attitudes and Weather Knowledge." School Science and Mathematics 92(6):334-36.
Geban, Omer, Petek Askar, and Ilker Ozkan. 1992. "Effects of Computer Simulations and Problem-Solving Approaches on High School Students." Journal of Educational Research 86(1):5-10.
Glass, Gene V. 1976. "Primary, Secondary, and Meta-Analysis of Research." Educational Researcher 5(10 ):3-8.
65
Glass, Gene V., Barry McGaw, and Mary L. Smith. 1981. Meta-Analysis in Social Research. Beverly Hills: Sage Publications.
Grejda, Gail F. and Michael J. Hannafin. 1992. "Effects of Word Processing on Sixth Graders' Holistic Writing and Revisions." Journal of Educational Research 85(3):144-49.
Hartley, Susan S. 1977. "Meta-Analysis of the Effects of Individually Paced Instruction in Mathematics." Doctoral dissertation, University of Colorado at Boulder. Dissertation Abstracts International, 38, no. 07A (1977): 4003. (UMI Number: AAG 7729926).
Howard, Katrena C. and Ganga Persaud. 1992. Writing Express: An Evaluation of a Follow-Up Program to Writing To Read. Paper presented to the American Educational Research Association Annual Meeting on April 22, 1992, San Francisco, CA. (ERIC Document Reproduction Service No. ED 345 252).
Howell, Connie A. 1996. "A Comparison of Chapter One Middle School Students Who Received Jostens Integrated Learning Instruction and Those Who Received Chapter One Services Only." Doctoral dissertation, University of Georgia. Dissertation Abstracts International, 58, no. 03A (1996): 0670. (UMI Number: AAG 726930).
Jegede, Olugbemiro J., Peter A. Okebukola, and Gabriel A. Ajewole. 1991. "Computers and the Learning of Biological Concepts: Attitudes and Achievement of Nigerian Students." Science Education 75(6):701-06.
Jones, Helen J. 1991. "The Effects of the Writing To Read Computer Program on Reading Achievement and Attitudes of Second-Grade Children." Doctoral dissertation, Texas Woman's University. Dissertation Abstracts International, 53, no. 06A (1991): 1788. (UMI Number: AAG 9227086).
Jones, Zipporah. 1993. Writing to Read: Computer-Assisted Instruction and Reading Achievement. Chicago, IL. (ERIC Document Reproduction Service No ED 365 980).
Jyoung, Hong-Kee. 1990. "The Use Of Integrated Curriculum Materials, Hands-On Investigations In Cooperative Group Activities And Computer-Based Alternatives In Science And Basic Skills Instruction: A Prototype For Further Study And For Integrated Curriculum Development (Science Curriculum)." Doctoral dissertation, Temple University. Dissertation Abstracts International, 51, no. 08A (1990): 2697. (UMI Number: AAG 9100293).
Karweit, Nancy L. 1989. "Effective Kindergarten Programs and Practices for Students at Risk." In Robert E. Slavin, Nancy L. Karweit, and N. A. Madden, eds., Effective Programs for Students at Risk, pp. 103-42. Boston: Allyn and Bacon.
Kelly, Paul R. 1997-1998. "Transfer of Learning From a Computer Simulation As Compared to a Laboratory Activity." Journal of Educational Technology Systems 26(4):345-51.
Kinzie, Mable B., Richard Strauss, and Jean Foss. 1993. "The Effects of Interactive Dissection Simulation on the Performance and Achievement of High School Biology Students." Journal of Research in Science Teaching 30(8):989-1000.
66
Kulik, Chen-Lin C. and James A. Kulik. 1991. "Effectiveness of Computer-Based Instruction: An Updated Analysis." Computers in Human Behavior 7:75-94.
Kulik, James A. 1994. "Meta-Analytic Studies of Findings on Computer-Based Instruction." In Eva L. Baker and Harold F. O'Neil, Jr., eds., Technology Assessment in Education and Training, pp. 9-33. Hillsdale, NJ: Lawrence Erlbaum Associates.
Kulik, James A., Chen-Lin C. Kulik, and Robert L. Bangert-Drowns. 1985. "Effectiveness of Computer-Based Education in Elementary Schools." Computers in Human Behavior 1(1):59-74.
Kunz, Janice R. R. 1999. "Does the Accelerated Reader Program Have an Impact on the Improvement of Children's Reading Scores in Illinois?" Doctoral dissertation, Saint Louis University. Dissertation Abstracts International, 60, no. 08A (1999): 2839. (UMI Number: AAG 9942795).
Laub, Cheryl M. 1995. "Computer-Integrated Learning System and Elementary Student Achievement in Mathematics: An Evaluation Study." Doctoral dissertation, Temple University. Dissertation Abstracts International, 56, no. 06A (1995): 2110. (UMI Number: AAI 9535758).
Lazarowitz, Reuven and Jehuda Huppert. 1993. "Science Process Skills of 10th-Grade Biology Students in a Computer-Assisted Learning Setting." Journal of Research on Computing in Education 25(3):366-82.
Leahy, Peggy E. 1991. Results of a Multi-Year Formative Evaluation for the 'Writing to Read' Program in a Mid-Size Suburban School District Revised. Dayton, OH: University of Dayton. (ERIC Document Reproduction Service No. ED 330 721).
Leiker, Virginia C. 1993. "The Relationship Between an Integrated Learning System, Reading and Mathematics Achievement, Higher-Order Thinking Skills and Certain Demographic Variables: A Study Conducted in Two School Districts." Doctoral dissertation, Baylor University. Dissertation Abstracts International, 54, no. 11A (1993): 4067. (UMI Number: AAG 9411538).
Li, Nim-Yu K. 1990, July. Writing With Pen or Computer? A Study on ESL Secondary School Learners. Paper presented at the Fifth Annual World Conference on Computers in Education in Sydney, New South Wales, Australia. (ERIC Document Reproduction Service No. ED 322 720).
Lorson, Mark V. 1991. "A Comparison of Microcomputer-Based Laboratories and Traditional Laboratory Methods in the High School Chemistry Laboratory." Doctoral dissertation, The Ohio State University. Dissertation Abstracts International, 52, no. 03A (1991): 0870. (UMI Number: AAG9120688).
Market Data Retrieval. 1999. Technology in Education 1999: A Comprehensive Report on the State of Technology in the K-12 Market. Shelton, CT: Market Data Retrieval.
67
McCart, Constance L. 1996. "Use of an Integrated Learning System in Improving Achievement for At-Risk Students on the New Jersey Early Warning Test." Doctoral dissertation, Temple University. Dissertation Abstracts International, 57, no. 05A (1996): 2011. (UMI Number: AAG 9632076).
McMillan, Mary K. 1996. "The Effect of the Accelerated Reader Program on the Reading Comprehension and the Reading Motivation of Fourth-Grade Students." Doctoral dissertation, University of Houston. Dissertation Abstracts International, 57, no. 04A (1996): 1542. (UMI Number: AAG 9626750).
Mevarech, Zemira R. 1994. "The Effectiveness of Individualized Versus Cooperative Computer-Based Integrated Learning Systems." International Journal of Educational Research 27(2):39-52.
Microsoft Corporation. 2000a. "Laptop Learning: Anywhere Anytime Learning." Web page accessed 2 Jan 2001. Available at <http://www.microsoft.com/education/aal/>.
Microsoft Corporation. 2000b. "Research on Laptop Learning." Web page accessed 2 Jan 2001. Available at <http://www.microsoft.com/education/aal/research.asp>.
Miller, Harold L., Jr. 1994. "Quantitative Analyses of Student Outcome Measures." International Journal of Educational Research 27(2):119-36.
Mokros, Janice R. and Robert F. Tinker. 1987. "The Impact of Microcomputer-Based Labs on Children's Ability to Interpret Graphs." Journal of Research in Science Teaching 24(4):369-83.
Nakhleh, Mary B. 1994. “A Review of Microcomputer-Based Labs: How Have They Affected Science Learning?” Journal of Computers in Mathematics and Science Teaching 13(4):368-81.
National Telecommunication and Information Administration (NTIA). 1995, July. "Falling Through the Net." Web page accessed 31 Dec 2000. Available at <http://www.ntia.doc.gov/ntiahome/fallingthru.html>.
National Telecommunications and Information Administration (NTIA). 1998, July. "Falling Through the Net II: New Data on the Digital Divide." Web page accessed 31 Dec 2000. Available at <http://www.ntia.doc.gov/ntiahome/net2/>.
National Telecommunications and Information Administration (NTIA). 1999, July. "Falling through the Net: Defining the Digital Divide." Web page accessed 31 Dec 2000. Available at <http://www.ntia.doc.gov/ntiahome/digitaldivide/>.
National Telecommunication and Information Administration (NTIA). 2000, October. "Falling Through the Net: Toward Digital Inclusion." Web page accessed 1 Jan 2001. Available at <http://www.ntia.doc.gov/ntiahome/fttn00/contents00.html>.
68
New York City Public Schools, Office of Research, Evaluation, and Assessment. 1990. Writing To Read 1988-89 Evaluation Section Report. New York: New York City Public Schools. (ERIC Document Reproduction Service No ED 319 050).
Niemiec, Richard and Herbert J. Walberg. 1987. "The Effects of Computer Based Instruction in Elementary Schools: A Quantitative Synthesis." Journal of Research on Computing in Education 20(2):85-103.
Nix, Carole A. G. 1998. "The Impact of E-Mail Use on Fourth Graders' Writing Skills." Doctoral dissertation, University of Texas at Arlington. Dissertation Abstracts International, 60, no. 03A (1998): 0726. (UMI Number: AAG 9921889).
Occhuizzo, John. 1993. "A Comparison of Traditional Experimental Technique Versus Microcomputer Multitasking Platform in Competency Development and Concept Enhancement in the Constructivist High School Physics Lab." Doctoral dissertation, University of Pittsburgh. Dissertation Abstracts International, 54, no. 09A (1993): 3391. (UMI Number: AAG9406344).
Office of Technology Assessment. 1988. "Power On! New Tools for Teaching and Learning." Washington, DC: Government Printing Office. (ERIC Document Reproduction Service Number ED 295 677).
Owston, Ronald D. and Herbert H. Wideman. 1997. "Word Processors and Children's Writing in a High-Computer-Access Setting." Journal of Research on Computing in Education 30(2):202-20.
Paul, Terrance, Scott Swanson, Wenyuan Zhang, and Lance Hehenberger. 1997. Learning Information System Effects on Reading, Language Arts, Math, Science, and Social Studies. Madison, WI: The Institute for Academic Excellence. (ERIC Document Reproduction Service No. ED 421 686).
Paul, Terrance, Darrel VanderZee, Tom Rue, and Scott Swanson. 1996. Impact of the Accelerated Reader Technology-Based Literacy Program on Overall Academic Achievement and School Attendance. Paper presented at the National Reading Research Center Conference "Literacy and Technology for the 21st Century" at Atlanta, GA, October 4, 1996. (ERIC Document Reproduction Service No. ED 421 684).
Peak, Janie and Mark W. Dewalt. 1993. Effects of the Computerized Accelerated Reader Program on Reading Achievement. Paper presented at the Annual Meeting of the Eastern Educational Research Association at Clearwater Beach, FL, February 17-22, 1993. (ERIC Document Reproduction Service No. ED 363 269).
Poock, Melanie M. 1998. "The Accelerated Reader: An Analysis of the Software's Strengths and Weaknesses and How It Can Be Used to Its Best Potential." School Library Media Activities Monthly 14(9):32-35.
Quality Education Data. 1998. Technology in Public Schools, 16th Edition. Denver, CO: Quality Education Data.
69
Renaissance Learning. 2003. "Renaissance Learning. About Us." Web page accessed 22 May 2003. Available at <http://www.renlearn.com/aboutus.htm>.
Renaissance Learning and School Renaissance Institute. 17 Jan 2001. "Renaissance Learning Research Center." Available at <http://research.renlearn.com/>.
Roblyer, M. D., W. H. Castine, and F. J. King. 1988. "Assessing the Impact of Computer-Based Instruction: A Review of Recent Research." Computers in the Schools 5(3-4):1-149.
Rogier, Lana L., James L. Owens, and Del L. Patty. 1999. "Writing to Read: A Valuable Program for First Grade?" Reading Improvement 36(1):24-34.
Roy, Jerry W. 1993. "An Investigation of the Efficacy of Computer-Assisted Mathematics, Reading, and Language Arts Instruction." Doctoral dissertation, Baylor University. Dissertation Abstracts International, 54, no. 04A (1993): 1188. (UMI Number: AAG 9323305).
Sarangarm, Isara L. 1992. "The Relationship Between Writing and Reading Achievement: The Effectiveness of the Writing To Read Program." Doctoral dissertation, New Mexico State University. Dissertation Abstracts International, 53, no. 04A (1992): 1042. (UMI Number: AAG 9224080).
Schieber, Craig E. 1999. "Information Technology and Education: An Evaluation of a School Laptop Computer Program." Doctoral dissertation, Seattle Pacific University. Dissertation Abstracts International, 60, no. 03A (1999). (UMI Number: AAG 9923680).
Schmidt, Mary, Tom Weinstein, Richard Niemiec, and Herbert J. Walberg. 1985. "Computer-Assisted Instruction With Exceptional Children." Journal of Special Education 19(4):493-501.
Schmidt, Susan C. 1991. "Technology for the 21st Century: The Effects of an Integrated Distributive Computer Network System on Student Achievement." Doctoral dissertation, University of La Verne. Dissertation Abstracts International, 52, no. 07A (1991): 2513. (UMI Number: AAG 9201940).
Shaver, Judy C. and Beth S. Wise. 1990. Literacy: The Impact of Technology on Early Reading. Paper presented at the Annual Meeting of the American Reading Forum in Sarasota, FL, December 1990. (ERIC Document Reproduction Service No. ED 327 832).
Sinkis, Deborah M. 1993. "A Comparison of Chapter One Student Achievement With and Without Computer-Assisted Instruction." Doctoral dissertation, University of Massachusetts. Dissertation Abstracts International, 54, no. 02A (1993): 0422. (UMI Number: AAG 9316716).
Slavin, Robert E. 1990a. "IBM's Writing to Read: Is It Right for Reading?" Phi Delta Kappan 72(3):214-16.
70
Slavin, Robert E. 1990b. "On Making a Difference." Educational Researcher 19(3):30-34,44.
Spencer, Theresa M. 1999. "The Systemic Impact of Integrated Learning Systems on Mathematics Achievement of Elementary Students: A Six-Year Longitudinal Study." Doctoral dissertation, Eastern Michigan University. Dissertation Abstracts International, 60, no. 11A (1999): 3977. (UMI Number: AAI 9946070).
Stevens, Judy W. 1991. "Impact of an Integrated Learning System On Third-, Fourth-, and Fifth-Grade Mathematics Achievement." Doctoral dissertation, Baylor University. Dissertation Abstracts International, 52, no. 06A (1991): 2058. (UMI Number: AAG 9132228).
Stone, Randi. 1999. "The Effect of Using Guided Internet Writing Activities on Students' Writing." Doctoral dissertation, University of Massachusetts Lowell. Dissertation Abstracts International, 60, no. 05A (1999): 1524. (UMI Number: AAG 9932815).
Underwood, J., S. Cavendish, S. Dowling, K. Fogelman, and T. Lawson. 1996. "Are Integrated Learning Systems Effective Learning Support Tools?" Computers & Education 26(1-3):33-40.
U.S. Department of Education, National Center for Education Statistics. 1998. The Condition of Education 1998. NCES 98-013. Washington, DC: U.S. Government Printing Office.
U.S. Department of Education, National Center for Education Statistics. 2002. Digest of Education Statistics: 2001. NCES 2002-130. Washington, DC: National Center for Education Statistics.
Van Dusen, Lani M. and Blaine R. Worthen. 1995. "Can Integrated Instructional Technology Transform the Classroom?" Educational Leadership 53(2):28-33.
Varner-Quick, Wilhelmina S. 1994. "The Effects of Computer-Assisted Instruction on Reading Abilities: A Comparison of Fourth Grade Reading Programs With and Without Computer Technology." Doctoral dissertation, Wayne State University. Dissertation Abstracts International, 55, no. 04A (1994): 0828. (UMI Number: AAG 9423764).
Vetcher, Johanna H. 1990. "The Utilization of Writing To Read and Its Effects on the Reading and Writing Skills of Kindergarten and First-Grade Students." Doctoral dissertation, Pepperdine University. Dissertation Abstracts International, 51, no. 08A (1990): 2693. (UMI Number: AAG 9102002).
Vollands, Stacy R., K. J. Topping, and H. M. Evans. 1996. Experimental Evaluation of Computer Assisted Self-Assessment of Reading Comprehension: Effects on Reading Achievement and Attitude. Dundee, Scotland: University of Dundee, Department of Psychology. (ERIC Document Reproduction Service No. ED 408 567).
Weller, Herman G. 1996. "Assessing the Impact of Computer-Based Learning in Science." Journal of Research on Computing in Education 28(4):461-85.
71
Weller, Herman G. 1995. "Diagnosing and Altering Three Aristotelian Alternative Conceptions in Dynamics: Microcomputer Simulations of Scientific Models." Journal of Research in Science Teaching 32(3):271-90.
Wenglinsky, Harold. 1998. Does It Compute? The Relationship Between Educational Technology and Student Achievement in Mathematics. Policy Information Report. Princeton, NJ: Educational Testing Service.
White, Mary-Alice. 1992. "Are ILSs Good Education?" Educational Technology 32(9):49-50.
Willett, John B., J. J. Yamashita, and R. D. Anderson. 1983. "A Meta-Analysis of Instructional Systems Applied in Science Teaching." Journal of Research in Science Teaching 20(5):405-17.
Wilson, J. 1992. "Integrated Learning Systems: A Primer." Classroom Computer Learning 10(5):22-23,27-30,34,36.
Yalcinalp, Serpil, Omer Geban, and Ilker Ozkan. 1995. "Effectiveness of Using Computer-Assisted Supplementary Instruction for Teaching the Mole Concept." Journal of Research in Science Teaching 32(10):1083-95.
Young, Jerry W. 1997. "The Effect Of Four Instructional Methods, Gender, And Time Of Testing On The Achievement Of Sixth Graders Learning To Interpret Graphs (Direct Instruction, Computer Aided Instruction, Video Observation, Computer Lab Activities)." Doctoral dissertation, The University of Alabama. Dissertation Abstracts International, 57, no. 12A (1997): 5125. (UMI Number: AAG9714291).
Zellermayer, Michal, Gavriel Salomon, Tamar Globerson, and Hanna Givon. 1991. "Enhancing Writing-Related Metacognitions Through a Computerized Writing Partner." American Educational Research Journal 28(2):373-91.