Embed Size (px)
Citation preview
EFFECTS OF TRUCK TIRE PRESSURES ON PAVEMENTS'
Research Study 372/386
by
H. H. Chen R. B. Connell
W. R. Hudson R. 'L. Lytton R. M. Marshek D. Middleton F. L. Roberts
C. L. Sarak J. T. Tie 1 king
Sponsored by
Texas State Department of Highways and Public Transportation In cooperation with
U. S. Department of Transportation, Federal Highway Administration Center for Transportation Rese~rch, University of Texas at Austin
April 1987
TEXAS TRANSPORTATION INSTITUTE The Texas A&M University System
College Station, Texas

EXECUTIVE SUMMARY REPORT
On
EFFECTS OF TIRE PRESSURES ON PAVEMENTS
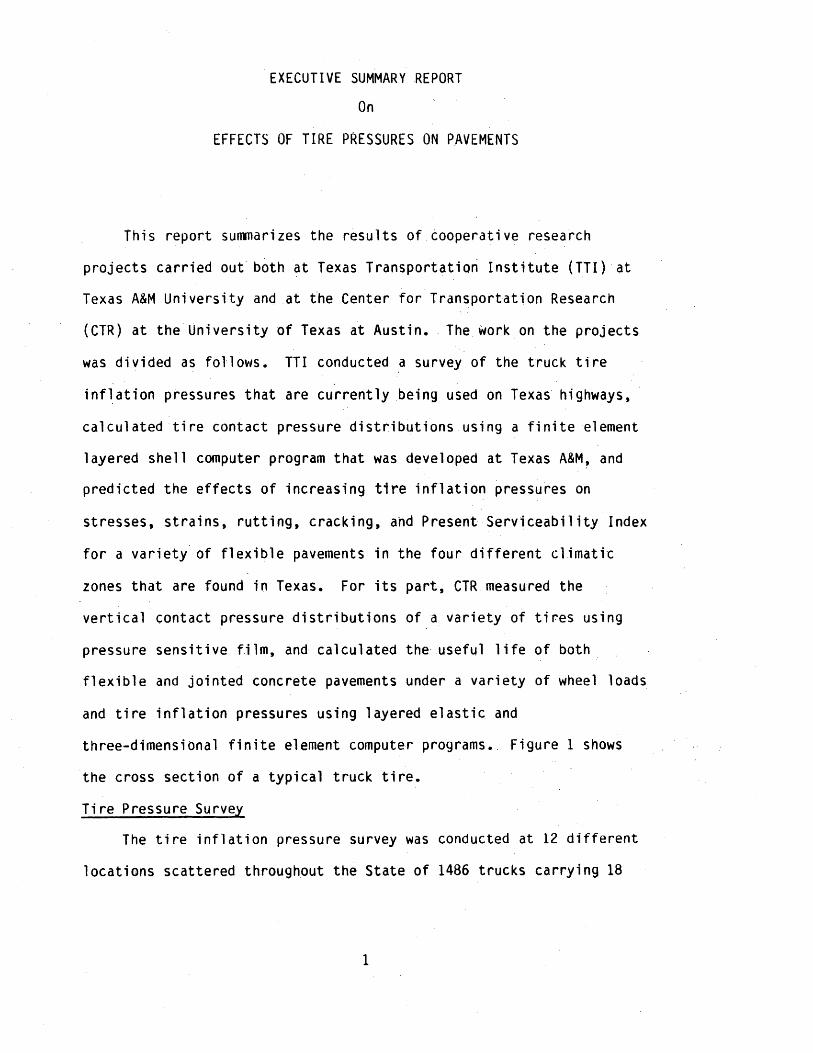
fhis report summarizes the results of cooperativ~ research
projects carried out both at Texas Transportatiori Institute (TTl) at
Texas A&M University and at the Center for Transportation Research
(CTR) at the University of Texas at Austin •. The ~ork on the projects
was divided as follows. TTl conducted ~ survey of the truck tire
inf~ation pressures that are currently being used on Texas highways,
calculated tire contact pressure distributions using a finite element
layered shell computer program that was developed at Texas A&M, and
predicted the effects of increaiing tire inflation pressures on
stresses, strains, rutting, cracking, and Present Serviceability Index
for a variety· of flexible pavements in the four different climatic
zones that are found in Texas. For its part, CTR measured the
vertical contact pressure distributions of a variety of tires using
pressure sensitive film, and calculated the· useful life of both
flexible and jointed concrete pavements under a variety of wheel loads
and tire inflation pressures using layered elastic and
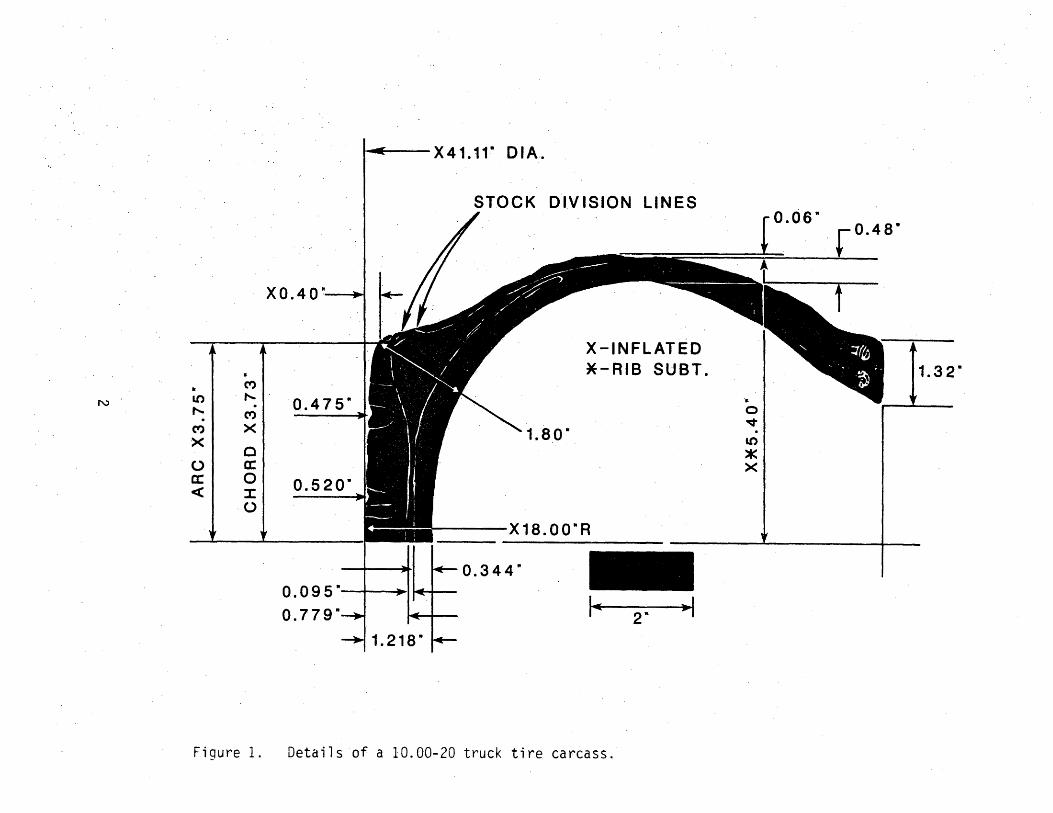
three-dimensional finite element computer programs •. Figure 1 shows
the cross section of a typical truck tire.
Tire Pressure Survey
The tire inflation pressure survey was conducted at 12 different
locations scattered throughout the State of 1486 trucks carrying 18
1
........ ---- X41.11" D IA.
STOCK DIVISION LINES 0.06"
XO.40"
X-INFLATED a *-RIB SUBT. 1.32" . (f)
Lt) ...... 0.475" '. N .
0 ...... C") . .q-('t) X . 'X Lt)
C * 0 a: X a: 0 0.520" c( J:
0
0.09 5 "-~""'II4-+-
0.779"
Figure 1. Details of a 10.00-20 truck tire carcass.
different·comrnodities. About 70 percent of the trucks were of the 352
AA5HTO class. All inflation pressures were measured on tires that had
been running and were therefore heated. Inflation pressures on bias
ply tires ranged between 10 and 130 psi whereas radial tires were
inflated to between 28 and 153 psi. The mean pressures varied with
the commodity carried: between 95 and 106 psi .for radial tires to
between 79 and 90 psi for bias ply tires with the difference between
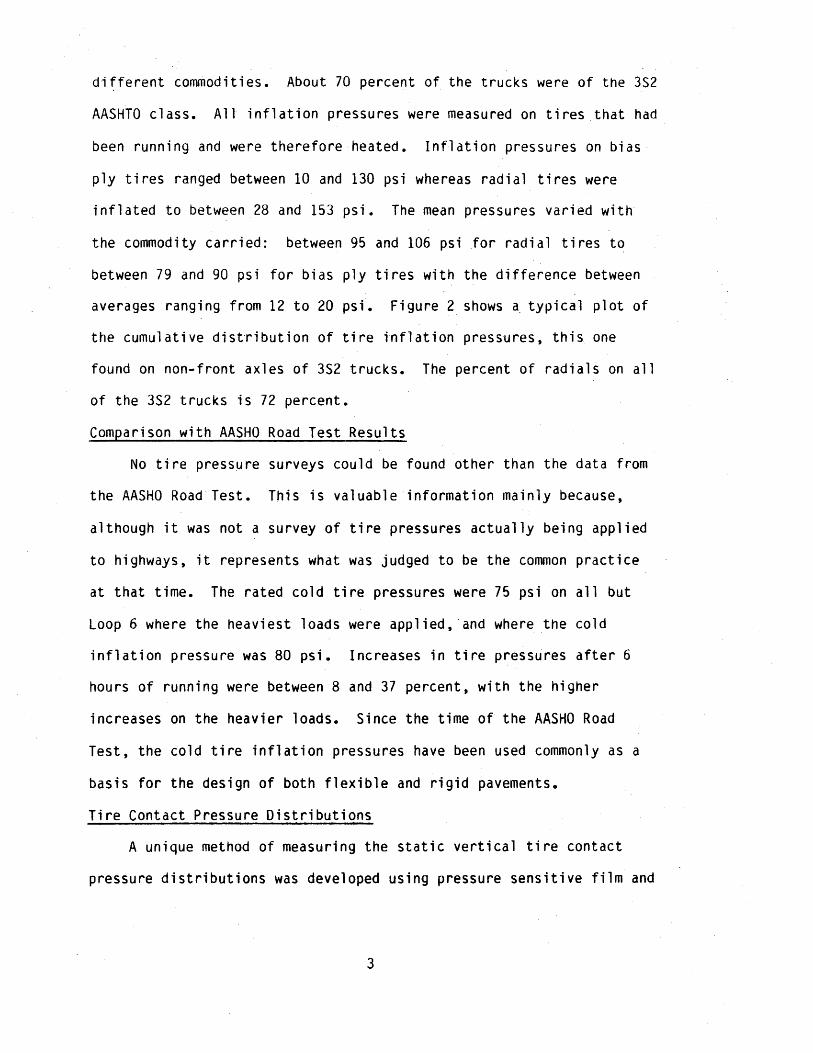
averages ranging from 12 to 20 psi. Figure 2 shows a typical plot of
the cumulative distribution of tire inflation pressures, this one
found on non-front axles of 352 trucks. The percent of radials on all
of the 352 trucks is 72 percent.
Comparison with AASHO Road Test Results
No tire pressure surveys could be found other than the data from
the AA5HO Road Test. This is valuable information mainly because,
although it was not a survey of tire pressures actually being applied
to highways, it represents what was judged to be the common practice
at that time. The rated cold tire pressures were 75 psi on all but
Loop 6 where the heaviest loads were applied, ·and where the cold
inflation pressure was 80 psi. Increases in tire pressures after 6
hours of running were between 8 and 37 percent, with the higher
increases on the heavier loads. Since the time of the AASHO Road
Test, the cold tire inflation pressures have been used commonly as a
basis for the design of both flexible and rigid pavements.
Tire Contact Pressure Distributions
A unique method of measuring the static vertical tire contact
pressure distributions was developed using pressure sensitive film and
3
100
90
80
70
~ 60 z w (.) 50 a: w Q.
30
20
10
0
30 60 90 .120 150
TIRE PRESSURE, psi
Figure 2. Cumulative distribution of tire pressures farnan-front axles of 3-25 trucks.
a IIdensitometer ll, an optical device which is capable of distinguishing
between fine gradations of color intensity and thus to convert the
shades of color on the pressure sensitive film to units of pressure.
Experiments were made with bias ply tires, with and without tread, and
at different levels of load and tire inflation pressure, all of which
were found to produce different tire contact pressure distributions.
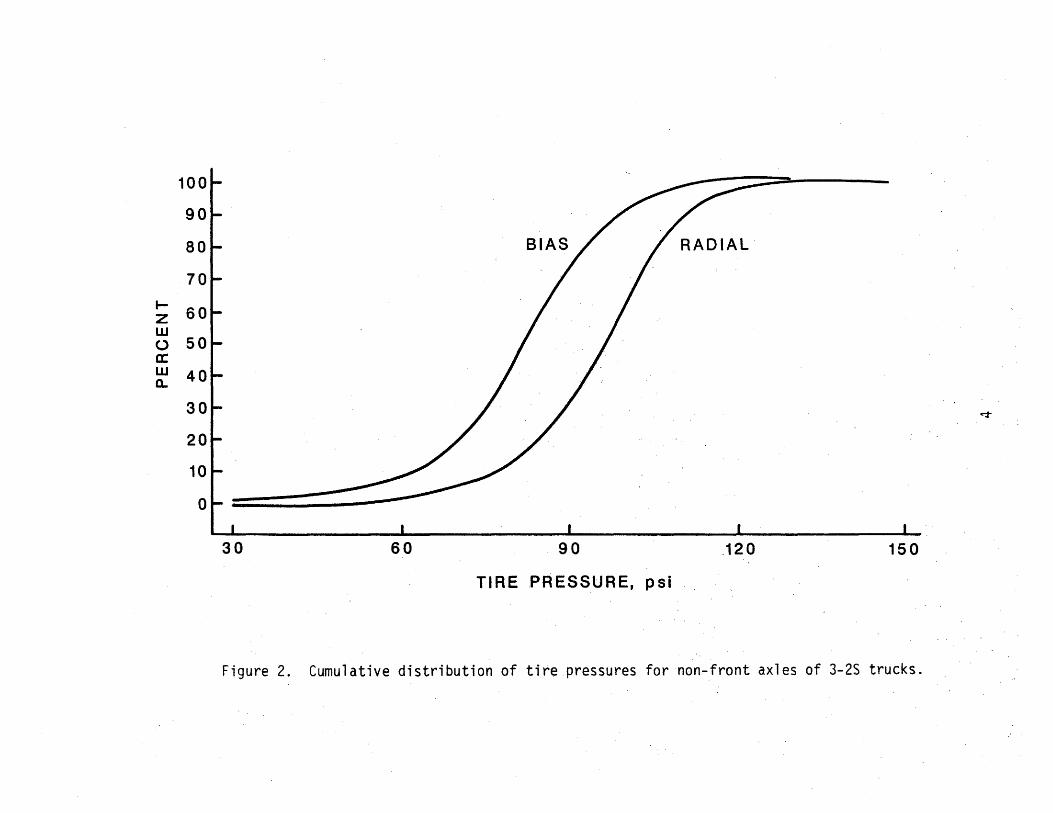
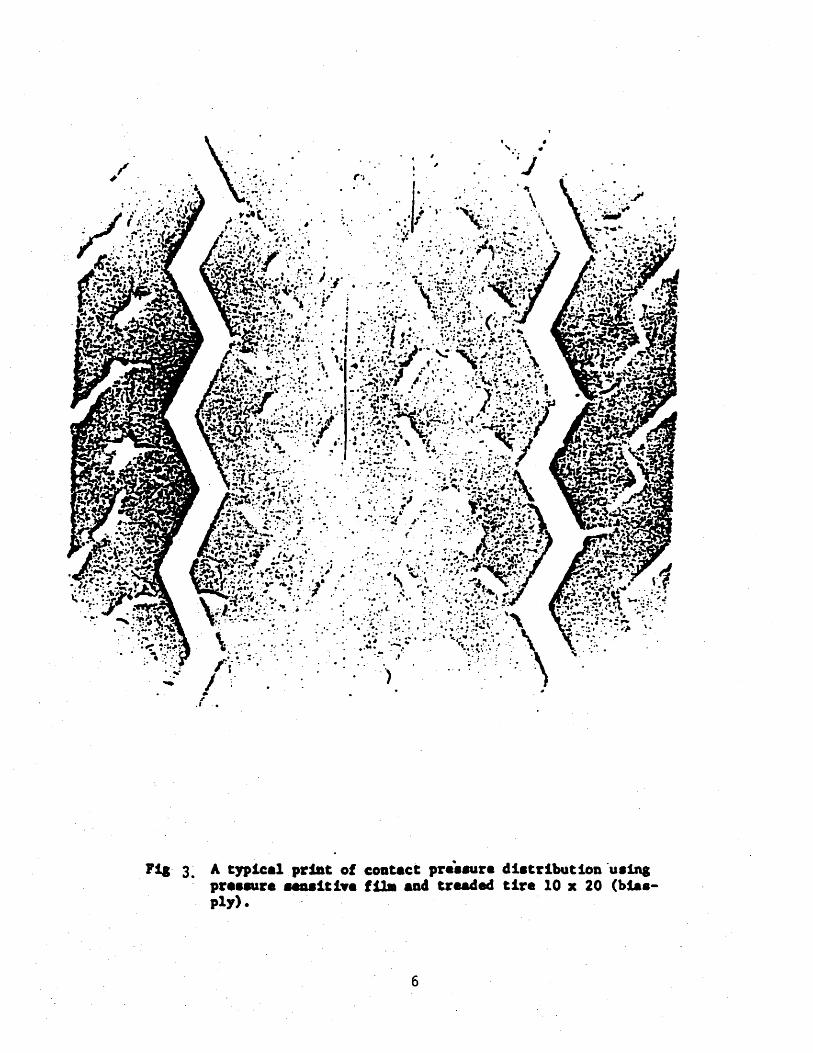
Figure 3 shows a typical result of these measur.ements. The tread
separates areas of distinct~vely different tire pressures, and a ridge
of high pressure is f6und beneath the tire shoulders.
Tire pressures were also calculated using a finite-element
layered toroidal shell ,computer program. The program computed both
vertical and horizontal contact stress distributions, but could not
account for the effect of the tread. However, because the calculated
horizontal stresses could not be measured with the pressure sensitive
film, the use of the program was the only way to determine what they
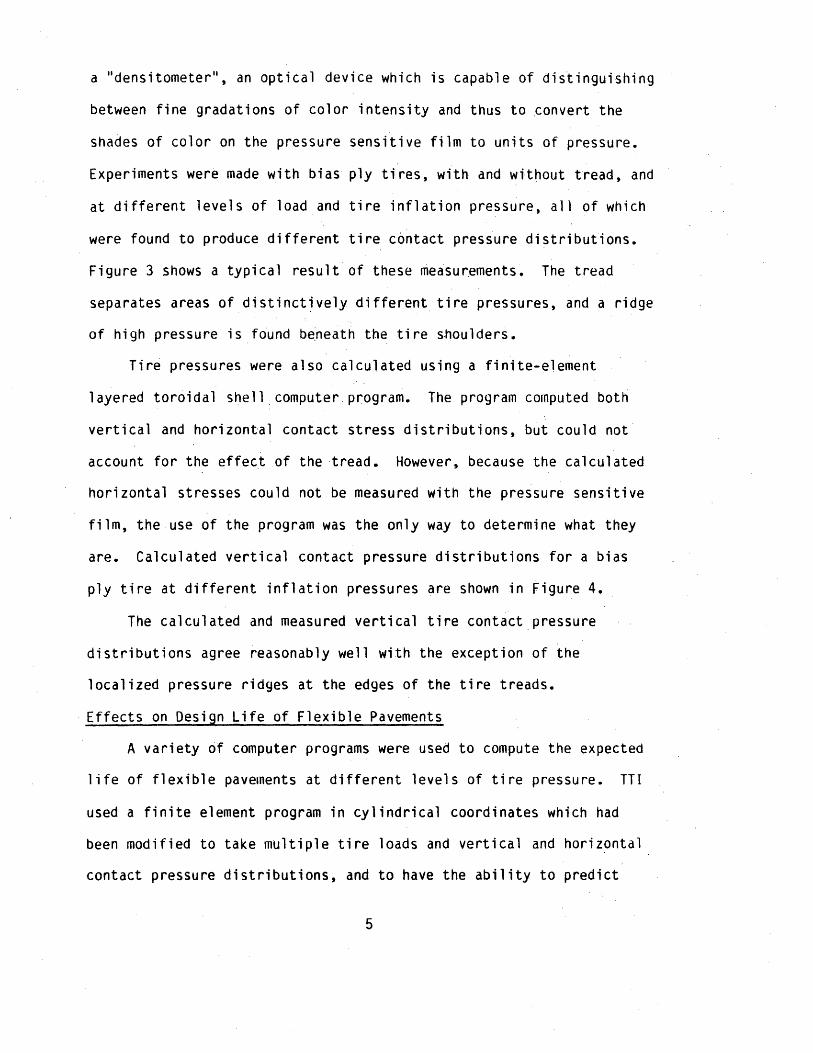
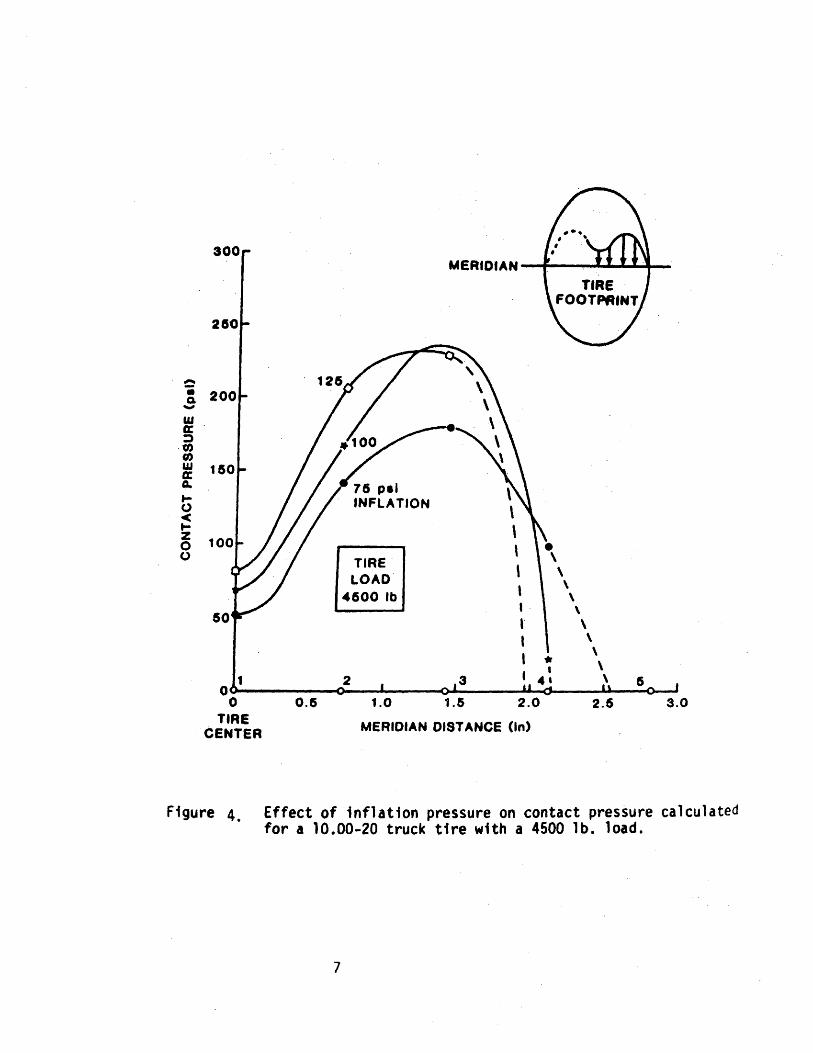
are. Calculated vertical contact pressure distributions for a bias
ply tire at different inflation pressures are shown in Figure 4.
The calculated and measured vertical tire contact pressure
distributions agree reasonably well with the exception of the
localized pressure ridges at the edges of the tire treads.
Effects on Design Life of Flexible Pavements
A variety of computer programs were used to compute the expected
life of flexible pavements at different levels of tire pressure. TTl
used a finite element program in cylindrical coordinates which had
been modified to take multiple tire loads and vertical and horizontal
contact pressure distributions, and to have the ability to predict
5
r';
.... /;
.', .. ,', ;~
.'
'"
',~' .-.
, ,
)'
, ,.
.'
• OJ
\ .
Pta 3.' A typical priDt of cODtact pr .... aur. di.tr:ibutioft 'U811\a
pr •• aura .... it1 •• f~ a.4 treaded tire 10 x 20 (biaaply).
6
300 MERIDIAN -+--~ ........... ~-
280
" .. 200 Q -W a: :l
,to (I) W 150 a: a. ~ 0 .c ~ z 0 • 0 TIRE' \
LOAD \ \
4500 Ib \ I \
50 , \ , \ , \ \
1 2 \ 0
0 0.5 1.0 1.5 2.0 2.5 3.0 TIRE MERIDIAN DISTANCE (In) CENTER
Figure 4. Effect of inflation pressure on contact pressure calculated for a 10.00-20 truck tire with a 4500 lb. load.
7
rutting, fatigue cracking, and Present Serviceability Index. CTR
compared the calculated results of three programs: the layered
elastic programs BISAR and ELSYM5 and the three-dimensional finite
element program TEXGAP-3D. The first two of these programs apply a
circular uniform load to the pavement, and BISAR can apply annular
regions of uniform vertical pressure on multiple tires and thus can
represent vertical tire pressure distributions. The TEXGAP-3D program
~p~lies rectangular patches of uniform vertical pressure within a
rectangular pattern which is closer to the actual shape of the tire
footprint than the circular loaded areas.
Increasing tire pressures while holding the load the same in all
studie~ showed more strain in critical locations and a lower service
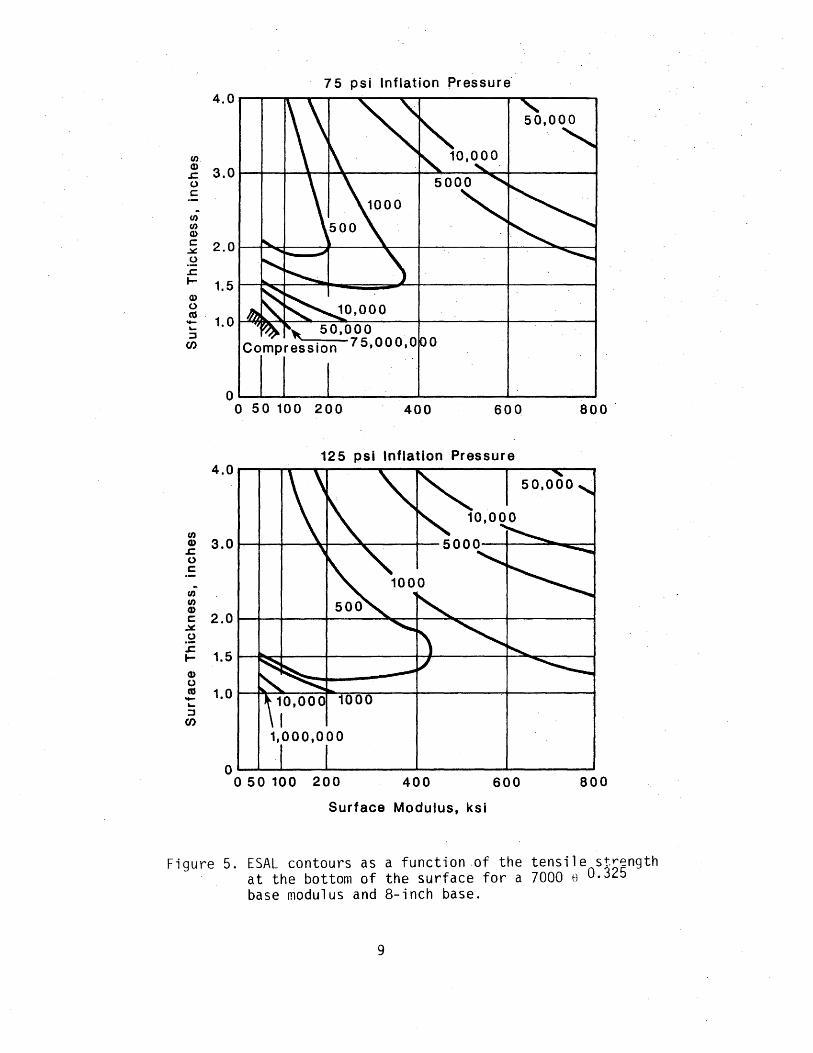
life in fatigue, rutting, and serviceability index. A typical result
comparing 75 psi and 125 psi inflation pressures is illustrated in
Figure 5, which shows the "numbers of IS-kip single axle loads that are
required to fatigue flexible pavements with diff~rent surface
thicknesses and moduli resting a moderately stiff 8-inch thick base
course layer. All of the studies showed that increasing the tire
inflation pressure while holding the load the same produces more rapid
fatigue cracking particularly when the surface course thickness is
between 1 and 3 inches thick. The rate of increase of rutting is
doubled when the tire inflation pressure is increased from 75 to 125
psi. The time required to reduce the Present Serviceability Index to
an unacceptable level is reduced by a factor of three or more in
pavements with a surface thickness between 1 and 3 inches but
pavements more than"4 inches thick are affected much less markedly
when the tir"e pressure is increased from 75 to 125 psi.
8
(/) (/) Q)
75 psi Inflation Pressure-4.0r-~-r-'~~-T--~~-------------------
50,000
~ 2.0r-~~--~~----~--+---------+---~--~ .2 .s:::. ~ 1. 5 r-~~---.-;;=-t-"""iiiiiiiiiiiiiiiiiiiiiiiil,.l'--+-------t-----4 Q) o m~ 1.0~~~~~~~~----+---------+-------~ ::l ~ 50,000 _
(J) Compression 75-,000,0 0
o~--~----~--------~--------~------~ o 50 100 200 400 600 800
125 psi Inflation Pressure 4.0~~,,--~-----,---,~------~----~--~
UJ 0> 3.0 .s:::. 0 c:
UJ U) G)
c: 2.0 .lI&::
.2
.s:::. 1.5 t-
O> 0 to 1.0 -~ ::l (J)
O~~~----~--------~--------~------~ o 50 100 200 400 600 BOO
Surface Modulus, ksi
Figure 5. ESAL contours as a function ,of the tensile str~ngth at the bottom of the surface for a 7000 H 0.325 base modulus and 8-inch base.
9
Effects on the Design Life of Concrete Pavements
The computer prqgram used by CTR to study the effect of tire
pressures on the design life of jointed concrete pavements was JSLAB
which represents a jointed slab on a base course layer resting on a
subgrade. It was found that an increase of tire inflation pressure
while holding the load the same does not increase the tensile stress
at the bottom of the slab. Calculations also showed that there was
virtually no difference between the results with a uniform vertical
pressure and a realistic distribution of vertical pressure. Thus, it
is expected that increasing tire pressures will have little effect on
reducing the service life of concrete pavements.
Conclusions
The following conclusions came from the two studies:
1. There is a need for a periodic survey of truck tire
pressures and tire construction to monitor how they are
. changi ng.
2. Increasing tire pressures will reduce the useful life of
flexible pavements; increasing load will reduce the life of
both flexible and rigid pavements.
3. There is a need to incorporate actual tire contact pressures
in the design of flexible pavements and no such need in·
rigid pavements.
4. There is a need to study the effect of radial tires to
compare with the results of the bias ply tires used in the
two studies.
10
5. There is a need to study the implications on load
equivalence factors of changes in tire pressures and tire
construction.
6. There is a need to determine the benefits and costs which
are related to changes in tire pressures and tire
construction.
References
"Effect of Tire Pressure on Flexible Pavements" t F.L. Roberts t
I
J.T. Tielking t D. Middleton t R. L. Lytton t and K. H. Tseng. t TTl
Research Report 372-1F.
"Experimental Investigation of Truck Tire Inflation Pressure on
Pavement-Tire Contact Area and Pressure Distribution ll, K. M. Marshek,
w. R. Hudson, R. B. Connell, H. H. Chen, and C. L. Saraf. t UT Research
Report 386-1.
"Effect of Truck Tire Inflation Pressure and Axle Load on
Pavement Performance", K. M. Marshek, W. R. Hudson, H. H. Chen,
C. L. Saraf, R. B. Connell. CTR Research Report 386-2F
11