Embed Size (px)
Citation preview
Transportation Research Record 1070 1
Measurement and Analysis of Truck Tire Pressures on
Texas Highways DAN R. MIDDLETON, FREDDY L. ROBERTS, and T. CHIRA-CHAVALA
ABSTRACT
Field data indicate that truck tire pressures on Texas highways are increasing . Implications of this increase are important in terms of increasing damage to roadway pavements, particularly flexible pavements. The methodology used in field data collection is described, along with data analysis by variables such as vehicle classification, axle load, commodity being hauled, and tire construction.
Preliminary evidence from the field indicates that truck tire pressures on Texas highways have increased in the past few years. The effect of such an increase on pavements would be an accelerated rate of pavement deterioration. On asphaltic concrete pavements, increases in truck tire inflation pressures would result in more rapid appearance of alligator cracking and rutting, and probably an increase in the rate of occurrence of reflection cracking in overlays. One result of increased deterioration will be an accelerated schedule on planned programs of major maintenance and rehabilitation.
Before this study, a need existed to determine the distribution of tire pressures on Texas highways and to identify the magnitude of the effects of increased tire pressures on individual asphaltic concrete pavements and flexible pavement networks. None of the previous studies evaluating the effects of truck traffic and changing legal load limits has included tire pressures as an explicit variable, although inflation pressures were assumed to increase somewhat with increasing legal load limit.
The objectives of this part of the study were twofold:
1. To determine by actual measurement the distribution of tire pressures and areas of tire footprint on Texas pavements, and
2. To determine by computation the effect of these tire pressures on the life and cost of typical flexible pavements.
The measurement of the tire footprint in the field data collection was not accomplished. Several methods were considered and some were actually tested in the field: however, none proved to be feasible for field measurement. Using the measurement systems investigated would have significantly reduced the amount of tire pressure data collected because of the time intensity of the measurement process. It should be noted that in a companion study entitled Experimental Investigation of Truck Tire Inflation Pressure on Pavement--Tire Contact Area and Pressure Dis tr ibution, contact areas of tires under various loads were measured in a laboratory setting <1>· The study was conducted by the Center for Transportation Research (CTR) at the University of Texas in Austin, and the findings are being used to supplement the results of this study.
D.R. Middleton and T. Chira-Chavala, Texas Transportation Institute, Texas A&M University, College Station, Tex. 77843-3135. F.L. Roberts, Civil Engineering Department, Auburn University, Ala. 36849.
DATA TO BE COLLECTED
First, a standard form was developed for recording survey information. Table 1 gives a list of the desired survey data by the categories of tire, vehicle, site, and other. Because of various constraints, the other data were not collected. Information on vehicle length, width, and headlight height was originally selected in an attempt to camouflage the tire pressure data collection. However, these superfluous measurements were not taken because time was not available. Again, information on the tire contact area was not gathered because of the lack of a practical and accurate means of making the measurement as well as the time constraint.
TABLE 1 Desired Survey Information
Category
Tire
Vehicle
Site
Other
Desired Information
Manufacturer Construction (radial, bias) Size Inflation pressure I and 2 Tread depth Test number AASHTO classification Commodity License number Weight Air temperature Pavement temperature Date of survey Location Weather Length of vehicle Width of vehicle Headlight height Tire contact area
Site information such as date, location, and weather was recorded once a day, and air and pavement temperatures were recorded approximately hourly. Other information was recorded with each available truck. For each vehicle, a test number and the AASHTO class were recorded, and, if time and personnel were available, the vehicle license number and weight were recorded.
As a minimum, the following tire information was gathered on each vehicle: inflation pressure, manufacturer, construction (radial, bias), size, and tread depth. A second pressure (Pressure 2) was also taken on a few trucks in an attempt to determine change in tire inflation pressure after cool down.
In many cases, the tread depth varied across the
2
width of the tire. The reading was taken fairly consistently at a distance of 2 in. from the outside edge of the tire.
The weight in pounds of each axle group was recorded by project personnel as the vehicle was weighed by the Texas Department of Public Safety (DPS) • Because weights and tire information were in most cases recorded separately by two different people, a system was needed to combine the two sets of data for each truck. This was done by using the truck license plate numbers.
METHODOLOGY USED FOR SITE SELECTION
Coordination with the License and Weight Division of the DPS was necessary for all data collection. The DPS was already involved in an ongoing enforcement program in which trucks were stopped at various locations throughout t he state to check weights, vehicle registration, and so forth. Therefore , the logical means of collecting tire pressure information was in conjunction with the DPS operations.
Three primary factors were considered in making site selection:
• Availability of DPS personnel and equipment, • Roadside safety considerations at the site,
and • Commodities being hauled through the area.
The normal procedure used by project staff to schedule field data collection with the DPS was as follows. First, a geographic area in the state was identified where certain commodity movements were known to occur. Seasonal fluctuations in commodity movement were also important, with the best survey conditions occurring during the peak season. Next, a DPS captain in Austin designated the proper person to contact in the vicinity of the site selected. This contact person had authority in the desired area to make the necessary commitments for DPS personnel to meet project staff at a selected site.
The limitation on DPS equipment often meant scheduling difficulties. Only a limited number of semiportable platform scales were available to the many DPS offices. The typical weighing system used a
Transportation Research Record 1070
van towing a trailer to haul the scales. These were rotated to the various DPS offices in a given region on a scheduled basis. Therefore, DPS assistance for data collection depended not only on the availability of their personnel but also on the location of the semiportable scales.
The second important factor in choosing data collection sites was traffic safety around the site. Only a relatively few sites existed where several trucks could be stopped at one time without forming a queue that extended into the through-traffic lanes. Even some weigh strips were of insufficient length to accommodate stopped vehicles.
The commodities of particular interest were those chosen in another project entitled Identification of Special-Use Truck Traffic. They were aggregated into three industries: timber, agriculture, and surface mining. Specific commodities for each are as follows:
1. Timber: Raw timber Wood products
2 . Agriculture: Grain Beef cattle Produce Cotton
3. Surface mining: Sand and gravel Limestone
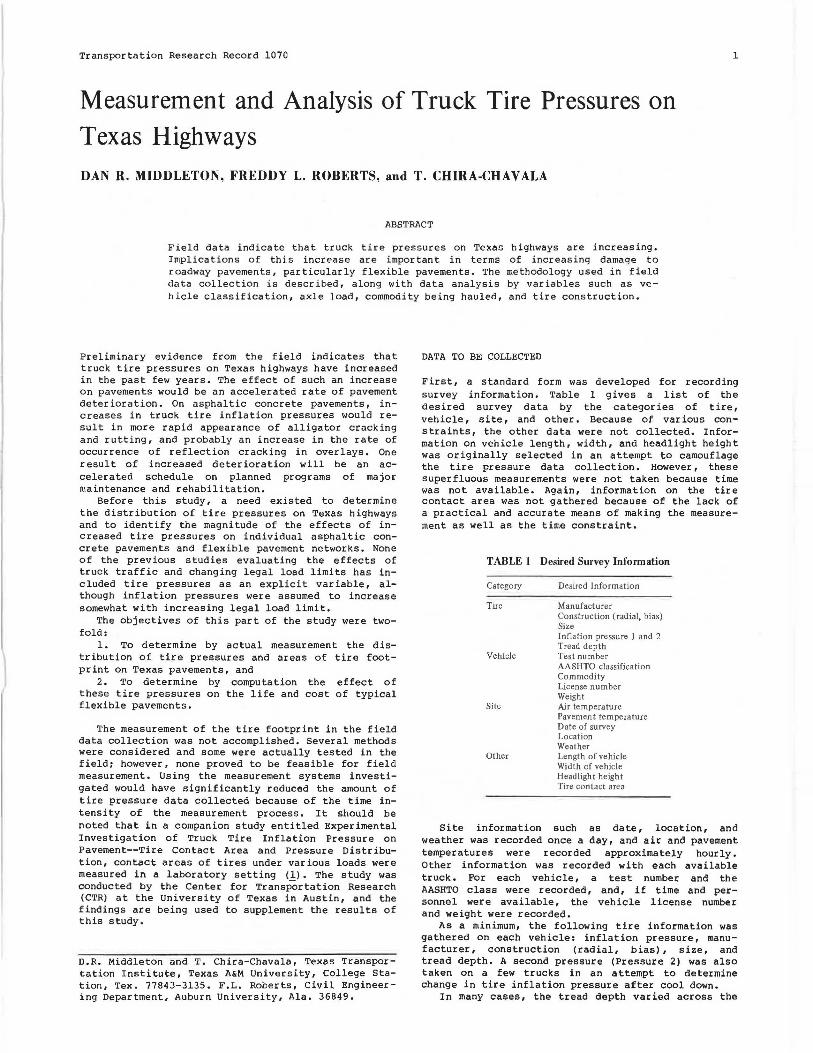
Figure 1 is a state map showing the locations of data collection. These sites were selected partly because of the commodities that flowed through them. Other reasons for their selection were availability of DPS enforcement personnel and proximity to project staff headquarters.
Of these sites, the primary timber products were found in a 40-county area in east Texas. Agricultural produce was found near the Rio Grande Valley and beef cattle were found in the panhandle area of the state. The primary surface mining products, such as crushed stone and sand and gravel, were hauled on a multitude of roads throughout the statei the sites selected for the survey were in the Dallas-Fort Worth area. Few, if any, ideal sites existed for collecting truck tire and weight data. Even where weigh strips were
LOCATIONS
1 - NACOGDOCHES 511204 I: US259
2 - TAYLOR SH79
3 - SEGUIN 110
4 - WESLACO E US83
5 - DAU.AS BO.TUNE a: US175
6 - DAU.AS Fll1389
7 - WElJ.S SH69
8 - HUNTSVIU£ 145
9 - WISE COUNTY SH 114
10 - TENDIA US59
11 - RIVIERA US77
12 - AMAJllUD N US77
13 - VEGA US285
14 - SAN MARCOS 135
15 - Wfl(IN E SH103
FIGURE I Locations of tire pressure data collection.
Middleton et al.
available for stopping trucks, there were almost always parallel roads available for bypassing the enforcement activities. However, the survey results are not necessarily biased because of this potential for avoidance.
PROCEDURE AT THE SITE
At each data collection site, at least two project persons were required to collect tire pressure information and two DPS officers were required to check and/or weigh trucks. All trucks, whether loaded or empty, were required to stop at these sites. Empty vehicles were often waved on by DPS officers, but at other times a vehicle registration and/or operator's license check was performed.
Project personnel activities were as follows:
• Surveyor No. 1 physically measured tire inflation pressures and tread depths.
• Surveyor No. 2, working alongside Surveyor No. 1, recorded the following information: tire inflation pressure, tread depth, tire manufacturer, tire construction (radial, bias), AASHTO vehicle classification, commodity, truck license number, and information about the site.
• Surveyor No. 3 recorded axle weights and truck license number; this person was not always used.
Tire pressure study information could not be collected as fast as DPS officers could weigh trucks. Therefore, at busy locations, tire pressures could not be measured simultaneously with the weighing because of the excessive queue of trucks that resulted. The more desirable simultaneous operation was modified in those cases to check as many trucks as possible either before being weighed or after, if a
TABLE 2 Number of Trucks in Sample
AASHTO Classification No. of Vehicles Percent
3-S2 1,033 69.5 2-S2 52 3.5 SU-2 90 6.1 SU-I 86 5.8 Double (3-2) II 0.7 Double (2-Sl-2) 6 0.4 2Sl 13 0.9 Missing or unknown -1ll _!11. Total 1,486 100.0
3
violation was detected by DPS. Checking only trucks with violations could introduce bias to the results if there is a correlation between weight and tire pressure (see the section on Analysis of Tire Pressure Data that follows).
The typical data collection procedure involved measuring and recording data on the outside tire along one side of the truck only, beginning at either the front or the rear. The inside tire of the dual was measured only if some problem occurred on the outside tire. Securing information such as brand name on the inside tire was considerably more difficult than doing so for the outside tire.
In most cases, t r uck drivers were cooperative in allowing their tire pressures to be checked . Because data collection always i nvolved the DPS officers, their presence may have been a factor in the level of cooperation experienced. Several drivers did express concern about the valve stems leaking air after the pressure had been checked. This concern was valid because some valve stems did stick partially open after the pressure was measured. However, the problem could usually be corrected relatively quickly.
ANALYSIS OF TIRE PRESSURE DATA
The objectives of analyses of tire measurement were to identify significant factors affecting tire pressure and to develop tire pressure distributions. The data were divided into sets basically by AASHTO truck class. Analysis of tire pressure measurements was carried out separately for each of four AASHTO classifications: 3-S2, 2-S2, SU-2, and SU-1.
Preliminary Analysis
The sample included measurements on a total of 1,486 trucks. As indicated by the data in Table 2, 70 percent were 3-S2, 6 percent SU-2, 6 percent SU-1, 4 percent 2-S2, 2 percent other truck types, and 13 percent unknown truck types.
Table 3 gives the distribution of truck types at each of the 12 survey locations. At the majority of these locations, virtually all trucks passing the survey station were stopped for tire measurements. These locations were Nacogdoches, Weslaco, Dallas, Wells, Teneha, and Lufkin. At Huntsville, only those trucks stopped by the DPS officers for violations were surveyed for tire pressures.
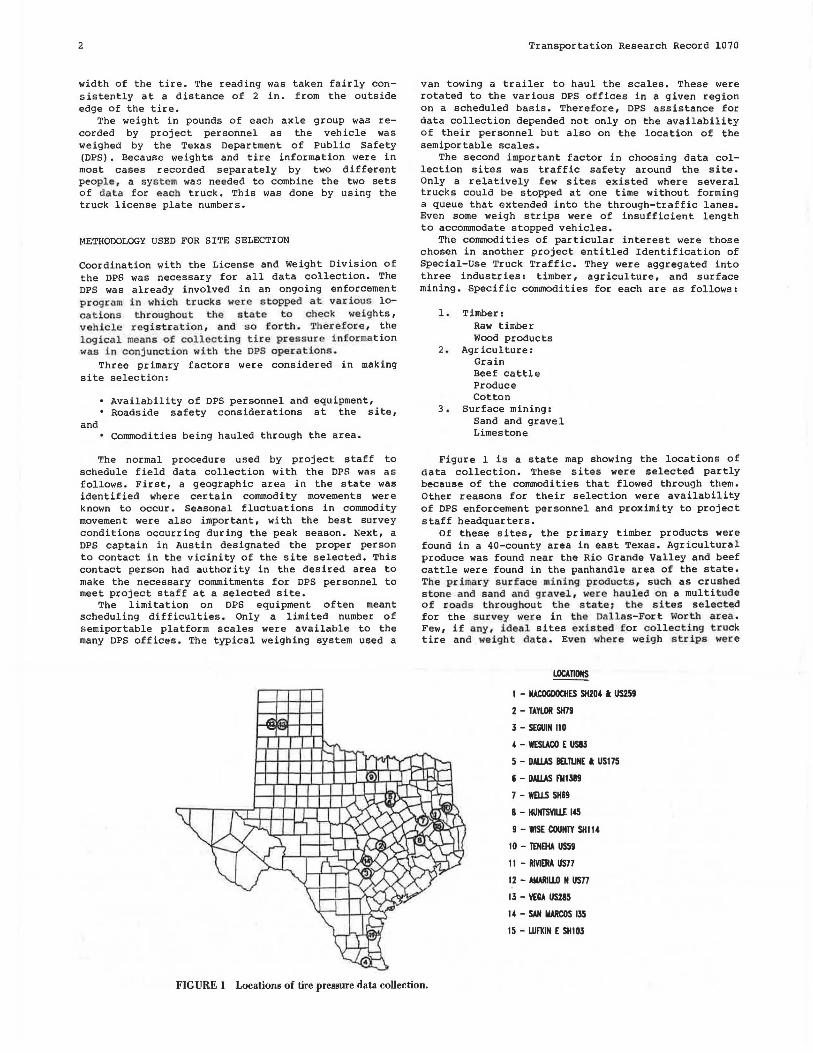
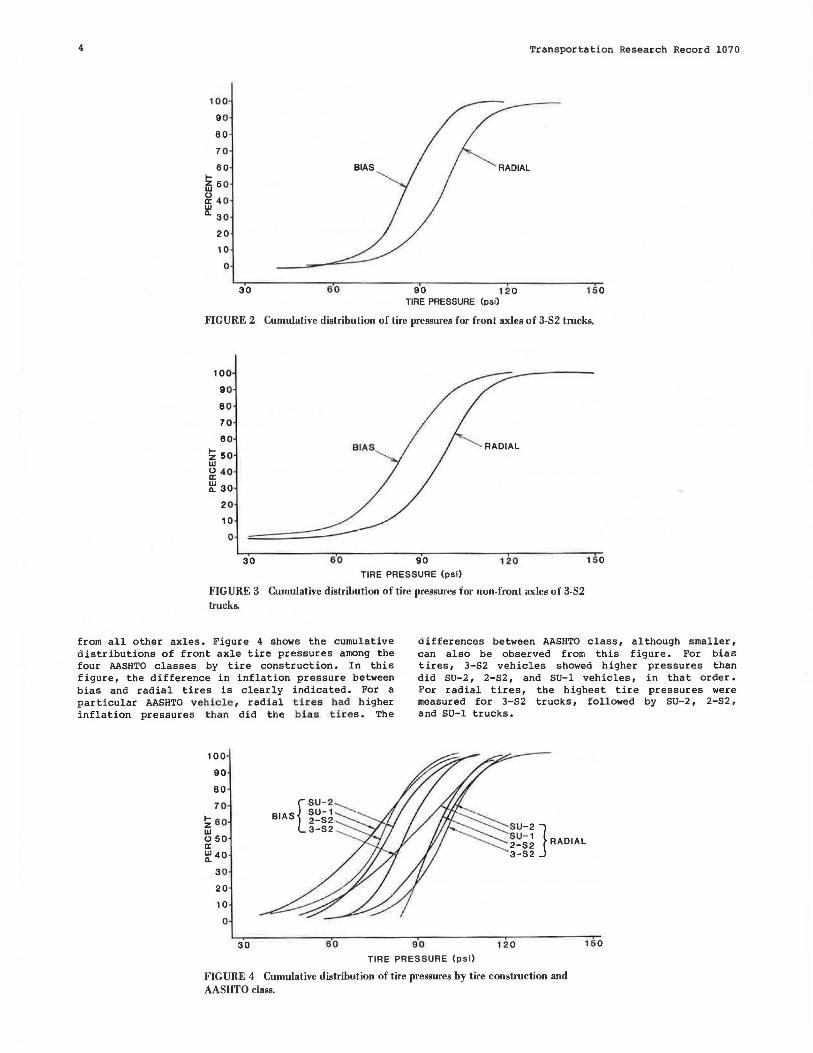
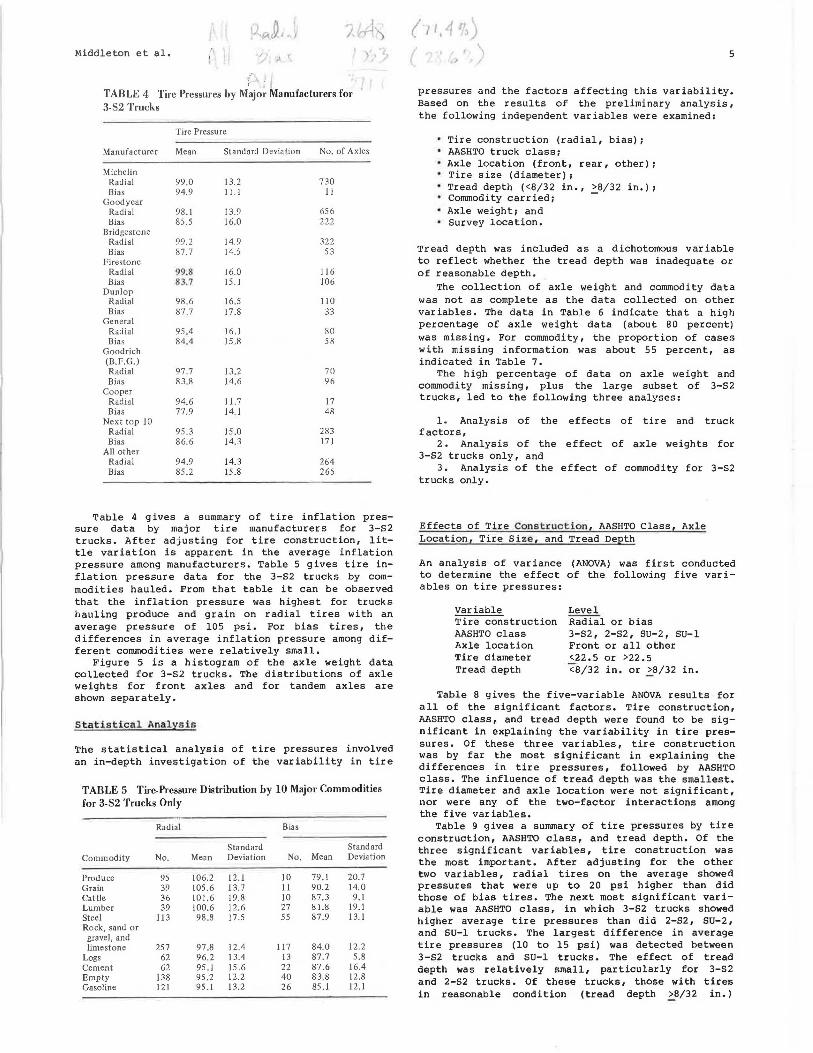
Figures 2 and 3 show cumulative distribution plots of tire pressures for trucks by tire construction (radial, bias), and with the front axle separated
TABLE 3 Survey Locations and Percent Truck Type at Each Location
Percent Truck Type Highway Total No. of
Location Classification 3-S2 2-S2 SU-2 SU-I Other Trucks
Nacogdoches, U.S. 259 U.S. 259, two-a and S.H. 204 lane, rural 86.0 3.0 7.0 4.0 - 29
Taylor, U.S. 79 Two-lane, rural 81.0 2.0 7.0 7.0 3.0 85 Seguin, 1-10 Interstate, rural 72 .0 8.0 8.0 10.0 2.0 245 Weslaco, U.S. 8 3 Four-lane divided,
rural 61.0 5.0 11.0 17 .0 7.0 127 Dallas F.M. 1389 Two-lane , rural 78.0 a 16.0 3.0 3.0 64 Wells, U.S. 69 Two-lane, rural 96.0 4.0 -a - a 22 Huntsville, 1-45 Interstate, rural 78.0 6.0 7.0 6.0 3.0 167 Teneha, U.S . 59 Two-Jane, rural 90 ,0 a 2.0 8.0 -a 39 U.S. 77 Riviera Four-lane divided,
rural 86.0 2.0 5.0 3.0 4.0 205 Amarillo, U.S. 287 Four-lane divided ,
rural 86.0 2.0 1.0 3.0 8.0 80 Vega, U.S. 385 Two-Jane, rural 94.0 - a 3.0 a 3.0 34 Lufkin, S.H. l 03 Four-lane divided 91.0 2.0 3.0 4.0 - a 128
aNone observed during survey.
4
100
90
80
70
60
ffi 50
~ 40
le 30
20
10
0
30
Transportation Research Record 1070
90 120 150 TIRE PRESSURE (psi)
FIGURE 2 Cumulative distribution of tire pressures for front axles of 3-S2 trucks.
100
90
80
70
80
~ 50 w ~ 40
~ 30
20
10
0
30 90 120 150 TIRE PRESSURE (psi)
FIGURE 3 Cumulative distribution of tire pressures for non-front axles of 3-S2 trucks.
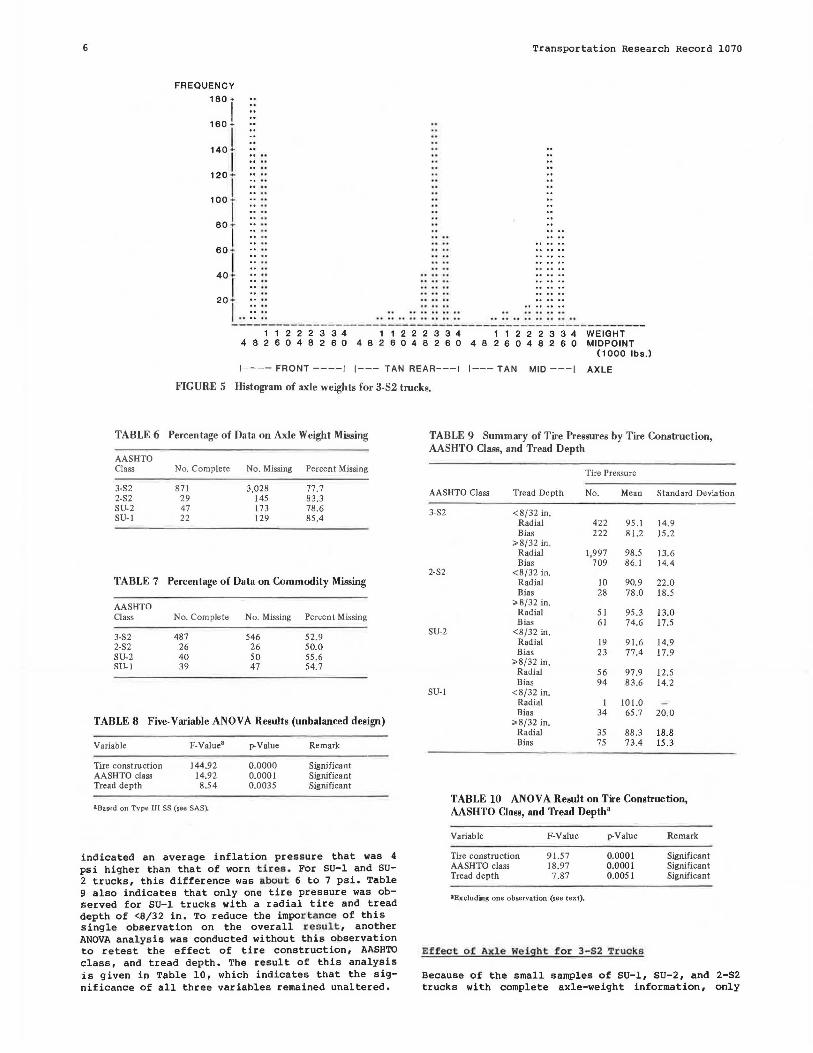
from all other axles. Figure 4 shows the cumulative distributions of front axle tire pressures among the four AASHTO classes by tire construction. In this figure, the difference in inflation pressure between bias and radial tires is clearly indicated. For a particular AASHTO vehicle, radial tires bad higher inflation pressures than did the bias tires. The
100
90
80
70
~ 60 w u 50 a: ~40
30
20
10
0
30 60
differences between AASHTO class, al though smaller, can also be observed from this figure. For bias tires, 3-S2 vehicles showed higher pressures than did SU-2, 2-52, and SU-1 vehicles, in that order. For radial tires, the highest tire pressures were measured for 3-52 trucks, followed by SU-2, 2-S2, and SU-1 trucks.
90 120 150
TIRE PRESSURE (psi)
FIG URE 4 Cumulative distribution of tire pressures by tire construction and AASHTO class.
Middleton et al.
. I
TABLE 4 Tire Pressures by Majo~ Manufacturers for 3-S2 Trucks
Tire Pressure
Manufacturer Mean Standard Deviation No. of Axles
Michelin Radial 99.0 13.2 730 Bias 94.9 I I.I II
Goodyear Radial 98.J 13.9 656 Bias 85.5 16.0 222
Bridgestone Radial 99.2 14.9 322 Bias 87.7 14.5 53
Firestone Radial 99.8 16.0 116 Bias 83.7 15.1 106
Dunlop Radial 98.6 16.5 110 Bias 87.7 17.8 33
General Radial 95.4 16.J 80 Bias 84.4 15.8 58
Goodrich (B.F.G. ) Radial 97.7 13.2 70 Bias 83.8 14.6 96
Cooper Radial 94.6 11.7 17 Bias 77 .9 14.1 48
Next top 10 Radial 95.3 15.0 283 Bias 86.6 14.3 171
All other Radial 94.9 14.3 264 Bias 85.2 15 .8 265
Table 4 gives a summary of tire inflation pressure data by major tire manufacturers for 3-S2 trucks. After adjusting for tire construction, little variation is apparent in the average inflation pressure among manufacturers. Table 5 gives tire inflation pressure data for the 3-S2 trucks by commodities hauled. From that table it can be observed that the inflation pressure was highest for trucks hauling produce and grain on radial tires with an average pressure of 105 psi. For bias tires, the differences in average inflation pressure among different commodities were relatively small.
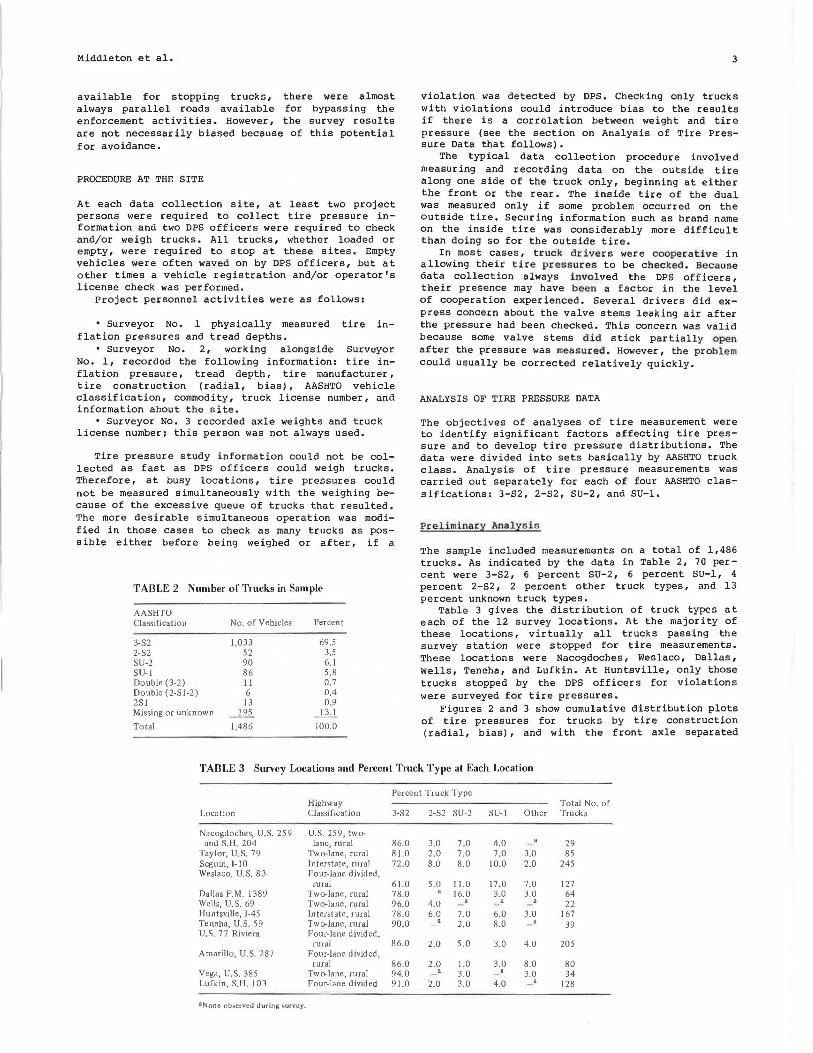
Figure 5 is a histogram of the axle weight data collected for 3-S2 trucks. The distributions of axle weights for front axles and for tandem axles are shown separately.
st.atistica l An·alysis
The statistical analysis of tire pressures involved an in-depth investigation of the variability in tire
TABLE 5 Tire-Pressure Distribution by IO Major Commodities for 3-S2 Trucks Only
Radial Bias
Standard Standard Commodity No. Mean Deviation No. Mean Deviation
Produce 95 106.2 12.l JO 79.1 20.7 Grain 39 105.6 13.7 II 90.2 14.0 Cattle 36 101.6 19.8 10 87.3 9.1 Lumber 39 100.6 12.6 27 81.8 19.J Steel 113 98.8 17 .5 55 87.9 13. l Rock, sand or
gravel, and limestone 257 97.8 12.4 117 84.0 12.2
Logs 62 96.2 13.4 13 87.7 5.8 Cement 62 95.J 15.6 22 87.6 16.4 Empty 138 95.2 12.2 40 83.8 12.8 Gasoline 121 95.l 13.2 26 85.l 12.l
(11,1 1 _)
( 5
pressures and the factors affecting this variability. Based on the results of the preliminary analysis, the following independent variables were examined:
•Tire construction (radial, bias); • AASHTO truck class; • Axle location (front, rear, other); • Tire size (diameter); •Tread depth (<8/ 32 in., .:::_8/ 32 in.); • Commodity car r ied; • Axle weight; and • Survey location.
Tread depth was included as a dichotomous variable to reflect whether the tread depth was inadequate or of reasonable depth.
The collection of axle weight and commodity data was not as complete as the data collected on other variables. The data in Table 6 indicate that a high percentage of axle weight data (about 80 percent) was missing. For commodity, the proportion of cases with missing information was about 55 percent, as indicated in Table 7.
The high percentage of data on axle weight and commodity missing, plus the large subset of 3-52 trucks, led to the following three analyses:
1. Analysis of the effects of tire and truck factors,
2. Analysis of the effect of axle weights for 3-52 trucks only, and
3. Analysis of the effect of commodity for 3-52 trucks only.
Effects of Ti.re Const.ruction , AASHTO Class, Axle Location, Tire Size , and Tread Depth
An analysis of variance (ANOVA) was first conducted to determine the effect of the following five variables on tire pressures:
Variable Tire construction AASHTO class Axle location Tire diameter Tread depth
Level Radial or bias 3-S2, 2-52, SU-2, SU-1 Front or all other <22.5 or >22.5 <"8/32 in. or .:::_B/32 in.
Table 8 gives the five-variable ANOVA results for all of the significant factors. Tire construction, AASHTO class, and tread depth were found to be significant in explaining the variability in tire pressures. Of these three variables, tire construction was by far the most significant in explaining the differences in tire pressures, followed by AASHTO class. The influence of tread depth was the smallest. Tire diameter and axle location were not significant, nor were any of the two-factor interactions among the five variables.
Table 9 gives a summary of tire pressures by tire construction, AASHTO class, and tread depth. Of the three significant variables, tire construction was the most important. After adjusting for the other two variables, radi al tires on the average showed pressures that were up to 20 psi higher than did those of bias tires. The next most significant variable was AASHTO class, in which 3-52 trucks showed higher average tire pressures than did 2-52, SU-2, and SU-1 trucks. The largest difference in average tire pressures (10 to 15 psi) was detected between 3-52 trucks and SU-1 trucks. The effect of tread depth was relatively small, particularly for 3-52 and 2-52 trucks. Of these trucks, those with tires in reasonable condition (tread depth .:::_B/32 in.)
6
FREQUENCY
180 +
160 ! I
140 ..
I 120 +
100 I 6J
I ::i 2al
I
Transportation Research Record 1070
1 1 2 2 2 3 3 4 1 1 2 2 2 3 3 4 1 1 2 2 2 3 3 4 WEIGHT 4 8 2 6 0 4 8 2 6 0 4 8 2 6 0 4 8 2 6 0 4 8 2 6 O 4 8 2 6 O MIDPOINT
( 1000 lbs.)
1---- FRONT ----1 1--- TAN REAR---1 1--- TAN MID ---1 AXLE
FIGURE 5 Histogram of axle weights for 3-S2 trucks.
TABLE 6 Percentage of Data on Axle Weight Missing
AASHTO Class
3-S2 2-S2 SU-2 SU-I
TABLE 7
AASHTO Class
3-S2 2-S2 SU-2 Sll-1
No. Complete No. Missing Percent Missing
871 29 47 22
3,028 145 173 129
77.7 83,3 78.6 85.4
Percentage of Data on Commodity Missing
No. Complete No. Missing Percent Missing
487 546 52,9 26 26 50.0 40 50 55.6 39 47 54.7
TABLE 8 Five-Variable ANOVA Results (unbalanced design)
Variable
Tire construction AASHTO class Tread depth
F-Value•
144.92 14.92 8.54
•Based on Type III SS (see SAS).
p-Value
0.0000 0.0001 0.0035
Remark
Significant Significant Significant
indicated an average inflation pressure that was 4 psi higher than that of worn tires . For SU-1 and su-2 trucks, this difference was abou t 6 to 7 psi. Table 9 also indicates that only one tire pressure was observed for SU-1 trucks with a radial tire and tread depth of <8/32 in. To reduce the impor t ance of this single observation on the overall result, another ANOVA analysis was conducted without this observation to retest the effect of tire construction, AASHTO class, and tread depth. The result of this analysis is given in Table 10, which indicates that the significance of all three variables remained unaltered.
TABLE 9 Summary of Tire Pressures by Tire Construction, AASHTO Class, and Tread Depth
Tire Pressure
AASHTO Class Tread Depth No. Mean Standard Deviation
3-S2 <8/32 in. Radial 422 95.l 14.9 Bias 222 81.2 15.2
>8/32 in. Radial 1,997 98.5 13.6 Bias 709 86.1 14.4
2-S2 <8/32 in, Radial IO 90,9 22.0 Bias 28 78.0 18.5
> 8/32 in. Radial 51 95.3 13.0 Bias 61 74.6 17.5
SU-2 <8/32 in. Radial 19 91.6 14.9 Bias 23 77.4 17.9
>8/32 in. Rauial 56 97.9 12.5 Bias 94 83.6 14.2
SU-I <8/32 in. Radial I 101.0 Bias 34 65.7 20.0
>8/32 in. Radial 35 88.3 18.8 Bias 75 73.4 15.3
TABLE 10 ANOVA Result on Tire Construction, AASHTO Closs, and Tread Depth'
Variable
Tire construction AASHTO class Tread depth
F-Value
91.57 18.97 7.87
&Excluding one observation (see text).
p-Value
0.0001 0,000 1 0.005 I
Effect o f Axle Weigh t f or 3- 52 Tr ucks
Remark
Significant Significant Significant
Because of the small samples of SU-1, SU-2, and 2-S2 trucks with complete axle-weight information, only
Middleton et al.
160t I t I
140 t !
~ 120! ., c. ..... I w + a: I :::> 100 + (/) (/)
w a: BO a.
60
Cl Diii
CCl&CI & . .. •t &A.I.& &D&D&IC&&U .. . ... .. ... & & & .l.&C&HI .... ...........
I U I U II llU I
LEGEND:
..
A• 1 OBS, B • 2 OBS, ETC.
7
0 4loo-+0o'oo-+12t0()+1et0()+2Q60()+24600
AXLE WEIGHT (lb.)
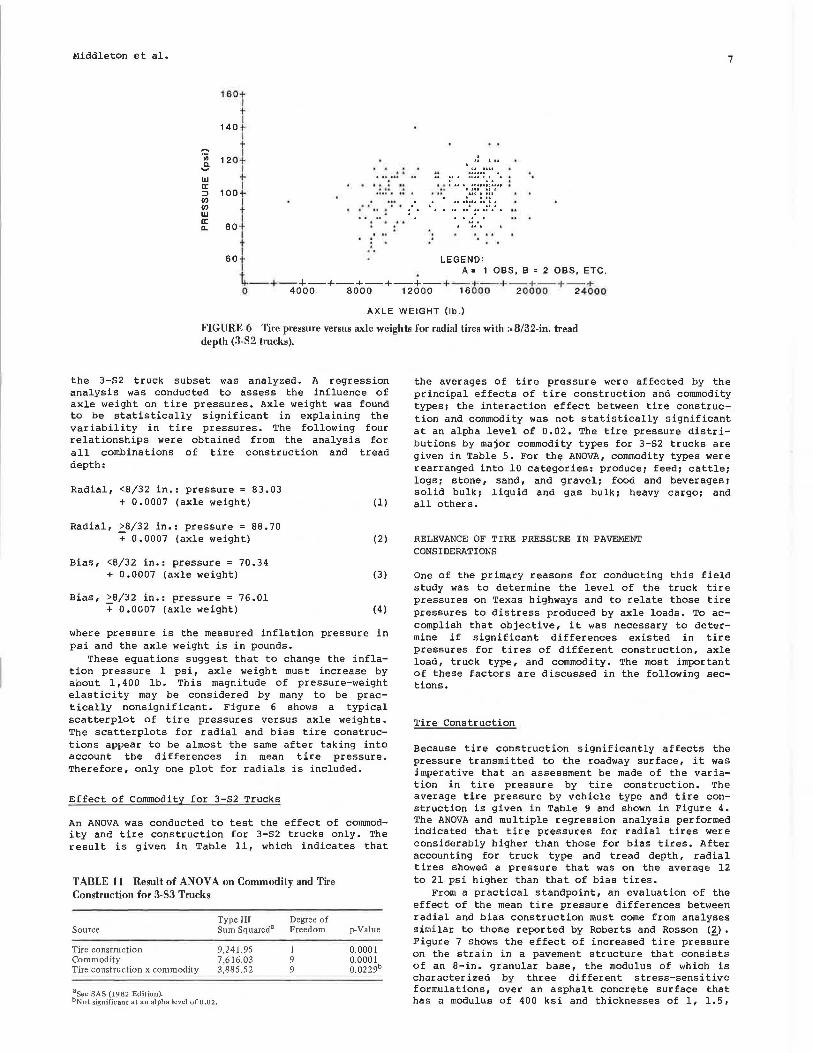
FIGURE 6 Tire pressure versus axle weights for radial tires with ;;.8/32-in. tread depth (3-S2 trucks).
the 3-S2 truck subset was analyzed. A regression analysis was conducted to assess the influence of axle weight on tire pressures. Axle weight was found to be statistically significant in explaining the variability in tire pressures. The following four relationships were obtained from the analysis for all combinations of tire construction and tread depth:
Radial, <8/32 in.: pressure= 83.03 + 0.0007 (axle weight)
Radial, >8/32 in.: pressure= 88.70 + 0.0007 (axle weight)
Bias, <8/32 in.: pressure= 70.34 + 0.0007 (axle weight)
Bias, >8/32 in.: pressure= 76.01 + 0.0007 (axle weight)
(1)
(2)
(3)
(4)
where pressure is the measured inflation pressure in psi and the axle weight is in pounds.
These equations suggest that to change the inflation pressure l psi, axle weight must increase by about l, 400 lb. This magnitude of pressure-weight elasticity may be considered by many to be practically nonsignificant. Figure 6 shows a typical scatterplot of tire pressures versus axle weights. The scatterplots for radial and bias tire constructions appear to be almost the same after taking into account the differences in mean tire pressure. Therefore, only one plot for radials is included.
Effect of Commodity for 3-S2 Trucks
An ANOVA was conducted to test the effect of commodity and tire construction for 3-S2 trucks only. The result is given in Table 11, which indicates that
TABLE 11 Result of ANOVA on Commodity and Tire Construction for 3-S3 Trucks
Source
Tire construction Commodity Tire construction x commodity
8See SAS (1982 Edition). bNot significant at an aJpha leve1 of0.02.
Type III Degree of Sum Squared3 Freedom
9,241.95 1 7,616.03 9 3,885.52 9
p-Value
0.0001 0.0001 o.0229b
the averages of tire pressure were affected by the principal effects of tire construction and commodity types; the interaction effect between tire construction and commodity was not statistically significant at an alpha level of 0.02. The tire pressure distributions by major commodity types for 3-S2 trucks are given in Table 5. For the ANOVA, commodity types were rearranged into 10 categories: produce; feed; cattle; logs; stone, sand, and gravel; food and beverages; solid bulk; liquid and gas bulk; heavy cargo; and all others.
RELEVANCE OF TIRE PRESSURE IN PAVEMENT CONSIDERATIONS
One of the primary reasons for conducting this field study was to determine the level of the truck tire pressures on Texas highways and to relate those tire pressures to distress produced by axle loads. To accomplish that objective, it was necessary to determine if significant differences existed in tire pressures for tires of different construction, axle load, truck type, and commodity. The most important of these factors are discussed in the following sections.
Tire Construction
Because tire construction significantly affects the pressure transmitted to the roadway surface, it was imperative that an assessment be made of the variation in tire pressure by tire construction. The average tire pressure by vehicle type and tire construction is given in Table 9 and shown in Figure 4. The ANOVA and multiple regression analysis performed indicated that tire pressures for radial tires were considerably higher than those for bias tires. After accounting for truck type and tread depth, radial tires showed a pressure that was on the average 12 to 21 psi higher than that of bias tires.
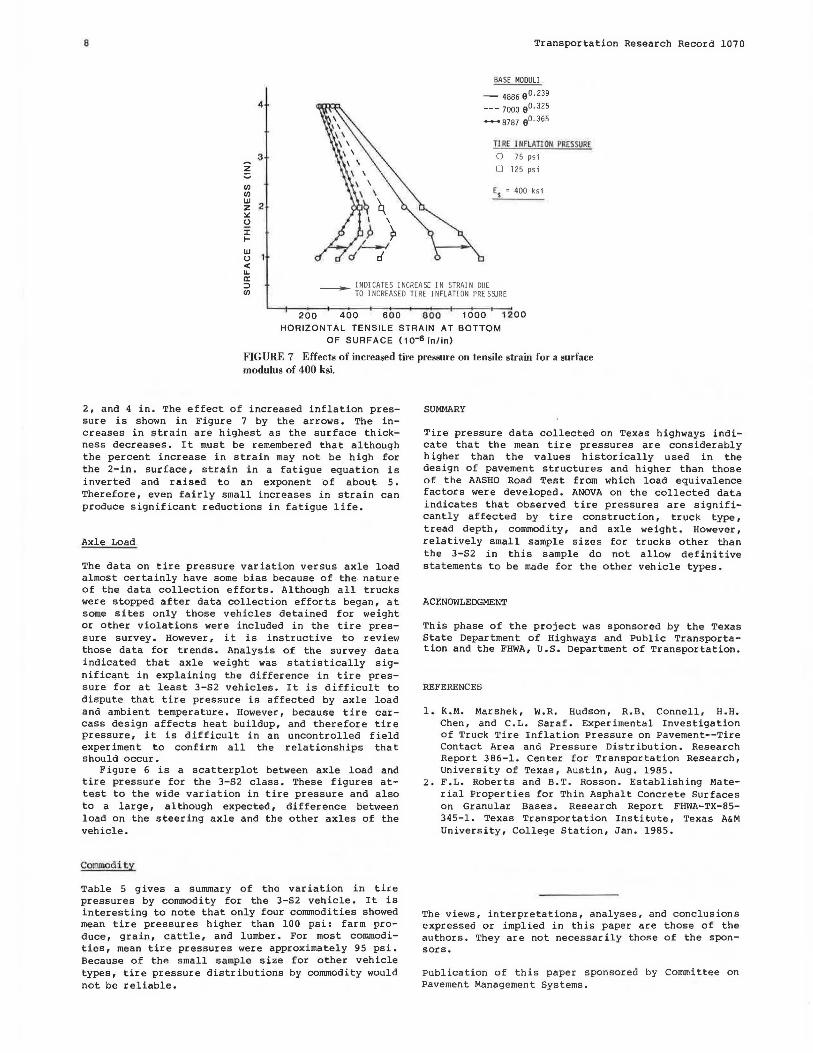
From a practical standpoint, an evaluation of the effect of the mean tire pressure differences between radial and bias construction must come from analyses similar to those reported by Roberts and Rosson (~) • Figure 7 shows the effect of increased tire pressure on the strain in a pavement structure that consists of an 8-in. granular base, the modulus of which is characterized by three different stress-sensitive formulations, over an asphalt concrete surface that has a modulus of 400 ksi and thicknesses of l, 1.5,
8
4
3 z ~
VJ VJ w
2 z :.: ~ :r I-
w u < Li. a:
Transportation Research Record 1070
BASE MODULI
- 4886 g0 .239
--- 7000 90. 325
~ 8787 90 .365
Tl RE I fl fLATI ON PRESSUR£
0 75 psi
0 125 psi
Es , 400 ksi
:::) VJ
--- INDlCATES INCREASE IN STRAIN DUE TO INCREASED TIRE INFLATION PRE S9JRE
200 400 600 800 1000 1200 HORIZONTAL TENSILE STRAIN AT BOTTOM
OF SURFACE (10-6 in/in)
FIG URE 7 Effects of increased tire pressure on tensile strain for a surface modulus of 400 ksi.
2, and 4 in. The effect of increased inflation pressure is shown in Figure 7 by the arrows. The increases in strain are highest as the surface thickness decreases. It must be remembered that although the percent increase in strain may not be high for the 2-in. surface, strain in a fatigue equation is inverted and raised to an exponent ·of about 5. Therefore, even fairly small increases in strain can produce significant reductions in fatigue life.
Axle Load
The data on tire pressure variation versus axle load almost certainly have some bias because of the nature of the data collection efforts. Although all trucks were stopped after data collection efforts began, at some sites only those vehicles detained for weight or other violations were included in the tire pressure survey. However, it is instructive to review those data for trends. Analysis of the survey data indicated that axle weight was statistically significant in explaining the difference in tire pressure for at least 3-S2 vehicles. It is difficult to dispute that tire pressure is affected by axle load and ambient temperature. However, because tire carcass design affects heat buildup, and therefore tire pressure, it is difficult in an uncontrolled field experiment to confirm all the relationships that should occur.
Figure 6 is a scatterplot between axle load and tire pressure for the 3-S2 class. These figures attest to the wide variation in tire pressure and also to a large, al though expected, difference between load on the steering axle and the other axles of the vehicle.
Commodity
Table 5 gives a summary of the variation in tire pressures by commodity for the 3-S2 vehicle. It is interesting to note that only four commodities showed mean tire pressures higher than 100 psi: farm produce, grain, cattle, and lumber. For most commodities, mean tire pressures were approximately 95 psi. Because of the small sample size for other vehicle types, tire pressure distributions by commodity would not be reliable.
SUMMARY
Tire pressure data collected on Texas highways indicate that the mean tire pressures are considerably higher than the values historically used in the design of pavement structures and higher than those of the AASHO Road Test from which load equivalence factors were developed. ANOVA on the collected data indicates that observed tire pressures are significantly affected by tire construction, truck type, tread depth, commodity, and axle weight. However, relatively small sample sizes for trucks other than the 3-S2 in this sample do not allow definitive statements to be made for the other vehicle types.
ACY.NOWLEDGMENT
This phase of the project was sponsored by the Texas State Department of Highways and Public Transportation and the FHWA, U.S. Department of Transportation.
REFERENCES
1. K.M. Marshek, W.R. Hudson, R.B. Connell, R.H. Chen, and C.L. Saraf. Experimental Investigation of Truck Tire Inflation Pressure on Pavement--Tire Contact Area and Pressure Distribution. Research Report 386-1. Center for Transportation Research, University of Texas, Austin, Aug. 1985.
2. F.L. Roberts and B.T. Rosson. Establishing Material Properties for Thin Asphalt Concrete Surfaces on Granular Bases. Research Report FHWA-TX-85-345-1. Texas Transportation Institute, Texas A&M University, College Station, Jan. 1985.
The views, interpretations, analyses, and conclusions expressed or implied in this paper are those of the authors. They are not necessarily those of the sponsors.
Publication of this paper sponsored by Committee on Pavement Management Systems.