Embed Size (px)
Citation preview
Aliso: A Journal of Systematic and Evolutionary Botany
Volume 11 | Issue 4 Article 15
1987
Effects of Mineral Nutrition on Components ofReproduction in Clarkia ungucilataFrank C. VasekUniversity of California, Riverside
Vincent WengUniversity of California, Riverside
Robert J. BeaverUniversity of California, Riverside
Charles K. HuszarUniversity of California, Riverside
Follow this and additional works at: http://scholarship.claremont.edu/aliso
Part of the Botany Commons
Recommended CitationVasek, Frank C.; Weng, Vincent; Beaver, Robert J.; and Huszar, Charles K. (1987) "Effects of Mineral Nutrition on Components ofReproduction in Clarkia ungucilata," Aliso: A Journal of Systematic and Evolutionary Botany: Vol. 11: Iss. 4, Article 15.Available at: http://scholarship.claremont.edu/aliso/vol11/iss4/15
ALISO 11(4),1987, pp. 599-618
EFFECTS OF MINERAL NUTRITION ON COMPONENTS OF REPRODUCTION IN CLARKIA UNGUICULATA
FRANK C. VASEK AND VINCENT WENG
Department of Botany/Plant Sciences
AND
ROBERT J. BEAVER AND CHARLES K. HUSZAR
Department of Statistics University of California, Riverside, California 92521
ABSTRACT
An experiment was conducted to determine the effects of nutritional level and flower location on factors related to flower, pollen, and ovule production, and to determine what developmental patterns would be modified to mediate any observed changes. Plants subjected to high nutrient levels developed larger leaves, more branches, more flowers on both the main stem and the branches, and opened their first flowers 6 days sooner than plants at lower levels of nutrients. Total flower number increased from 72.2 to 626 .8 per plant, with most of the increase produced on the primary branches. The number of pollen grains in the entire androecium averaged 14,685, but significantly increased with higher nutrient levels and decreased with the stage of plant maturity (nodal position on the plant). The number of ovules also increased with nutrient level and decreased with maturity stage. Average ovule number decreased from about 129 in flowers at nodes produced early in the growth cycle to about 100 in flowers produced at later nodes. Despite highly significant plasticity in numbers of both pollen and ovules, the Pollen/ Ovule Ratio (average 132.7) did not vary significantly with either nutrient level or plant maturity stage. Path analysis, which decomposes correlation coefficients into direct and indirect effects of factors influencing development, indicated that nutrient level had a very strong direct effect on the number of primary branches and on the number of primary-branch flowers, as well as very strong indirect effects on the latter. The primary-branch flowers directly determined over 67% of the total flower number, and indirectly determined about 24%jointly with secondary-branch flowers, and over 3% jointly with main-stem flowers. The direct effects of secondary-branch flowers and mainstem flowers were 3.8% and 0.3%, respectively. The relationship among components of yield is slightly additive. Direct determination of yield was 74.6% by the number of flowers per plant, 0.6% by the number of ovules per flower, 3.8% by the number of seeds per ovule, and 1.1 % by the weight per seed. The proportion of yield jointly determined by flower number and the developed seeds per ovule was 15.3%. It was concluded that allocation of resources increases to both male and female functions under conditions of high nutrient levels, and pollen/ ovule ratios are consistent within a plant despite significant plasticity in numbers of pollen grains and ovules.
Key words: Clarkia, mineral nutrition, reproductive components, developmental patterns, flower production, pollen production , ovule and seed production, pollen/ ovule ratio, sex allocation, paternal fitness.
INTRODUCTION
Energy allocation patterns of plant species to activities such as growth, maintenance, and reproduction have been the subject of many studies (Kawano and Masuda 1980; Charlesworth and Charlesworth 1981; Goldman and Willson 1986). Reproduction is seen as the character of greatest importance (Thompson and Stewart 1981), presumably because of overwhelming reliance on sexual reproduction for both agricultural and wild plants.
600 ALISO
Reproductive effort in plants is commonly defined in terms of seed production and is described by components of yield, i.e., the mass of seeds produced can be determined by multiplying together the numbers of inflorescences per plant, fruits per inflorescence, seeds per fruit , and the weight per seed (Primack 1978; Adams 1967; and others). Seed yield is regulated by the resource base (Willson and Burley 1983; etc.), and can be increased or decreased by manipulating factors such as water supply, leaf number, and especially nutrient level (Willson and Price 1980; Lee and Bazazz 1980, 1982; Marshall, Levin, and Fowler 1986).
Response to nutrient level is most noticeable in plants with little or no response to vernalization or photoperiod, such as tomato, eggplant, and pepper (Eguchi, Matsumura, and Ashizawa 1958; Maynard, Lachman, Check, and Vernell 1962), Arabidopsis (Myerscough and Marshall 1973), and some cultivars of snapdragon (Arthur and Hedley 1976; Hedley, Arthur, and Rabinowitch 1977). Response to nutrient level also occurs in strawberry (Abbott 1968; Breen and Martin 1981), barley (Aspinall 1961), Senecio and Chamaenerion (Van Andel and Vera 1977), and Papaver (Costes, Milhet, Candillon, and Magnier 1976). However, increased production of flowers or fruit, etc., may be inhibited or even reversed at some high or moderately high level of nutrients, depending on the species or cultivar (Flint and Asen 1953; Arthur and Hedley 1976; Breen and Martin 1981; Maynard et al. 1962).
Increased production of reproductive components with increased nutrient levels represents an important emphasis on maternal components of yield. However, seed production reflects only half the reproductive success of hermaphroditic plants. The success of plants as pollen parents has often been ignored (but see Mazer 1987, and included references). Generally, seed production is assumed to be limited by resources, not by the lack of male gametes to fertilize them. In that case, male reproductive success depends upon pollen reaching con specific stigmas and fertilizing egg cells (Charnov 1979, 1984). Paternal fitness, then, is a function of pollen production, pollen transport, and fertilization success (Lloyd 1984; Charnov 1979, 1984). Sometimes the proportion of flowers setting fruit, and the proportion of ovules developing into seeds may be limited by the pollen supply or the availability of effective pollinators (Bierzychudek 1981 ; Willson and Burley 1983). Whatever the limiting factors, pollen production is an important feature of paternal fitness. But, there have been few studies of pollen production, few studies of the relationship between seed and pollen production, and few studies of the production of pollen and ovules and seeds on a per flower basis (Devlin, unpubl. ms.). Thus, there is a real need for studies that examine the effect of various factors, such as nutrient levels, on both seed and pollen production.
Clarkia unguiculata Lindl. (Onagraceae) has been the subject of extensive study regarding its evolution, breeding system, and components of reproduction (Lewis and Lewis 1955; Vasek 1964, 1965, 1977, 1986; Vasek and Sauer 1971 ; SmithHuerta and Vasek 1984, 1987; and others). Clarkia plants are day neutral, hence, we would expect them to respond to supplemental nutrients by increasing at least some components of reproduction. Since the entire plant functions as one inflorescence, flower number, rather than inflorescence number, should be the critical yield component. An increase in the number of flowers would be expected with an increase in nutrients. However, the probable effects on other components of reproduction, such as the number of pollen grains and ovules, are not easily predicted, nor are the changes in developmental patterns.
VOLUME II, NUMBER 4 601
Consequently, we conducted a nutritional experiment with several main goals. Our first objective is to document and quantify the expected increase in flower number, and other components of growth and reproduction, with increasing nutrient levels; a second objective is to determine how developmental patterns would be modified to mediate any changes observed in components of reproduction; a third objective is to determine the effects of nutritional level and relative flower location on the pattern of pollen and ovule production in individual flowers; and fourth, to determine how variation in pollen and ovule production might affect consistency of the pollen/ovule ratio.
MATERIALS AND METHODS
Experimental plants of Clarkia unguiculata were grown in a University of California greenhouse in Riverside, California, from seeds collected in the Caliente Hills, Kern County, California. Seeds were sown on vermiculite in December, 1984. In January, 1985, the resulting seedlings were transplanted individually to one-gallon pots containing standard UC soil mix (16 Oakley fine sand: 12 Canadian peat moss, plus standard nutrients). Five vigorous seedlings were assigned to each of four treatment groups. Treatments 1, 2, 3, and 4 consisted of irrigation with dilutions of Hoagland's solution (Machlis and Torrey 1956) at the rate of 118 Weekly, 112 Weekly, 118 Daily, and 112 Daily, which represent, respectively, relative total nutrient levels of I, 4, 7, and 28. Additional irrigation with tap water was done as needed to maintain plant turgor. Treatment 2 corresponds with our standard growing conditions. Treatment continued through the vegetative, flowering, and fruit development phases of the growth cycle.
Growth Pattern
Plants of Clarkia unguiculata sequentially develop three different morphogenetic regions: a vegetative region with leaves and no branches or flowers; a branch region with primary branches in the axils of the leaves; and a flower region with individual flowers in the axils of main-stem leaves (bracts). Thus, the total number of nodes produced from bottom to top on the main stem is the sum ofthe numbers of nodes with leaves, with branches, and with flowers. Primary branches usually produce their own leaves, secondary branches, and flowers.
Plant Attributes
We scored, measured, or calculated 21 plant characteristics as listed in Table 1.
Leaf area (#J).-Laminar area of mature leaves collected from five successive vegetative nodes (numbered 8-12) was estimated with an area meter (LI COR Model 3100). Leaf or leafy bract area was similarly determined in samples from nodes 16 to 20 and 30 to 34 of two representative plants to document a continued decrease in leaf size with plant maturity.
Branch andj/ower production. -As plants developed, the main-stem nodes were numbered for identification, and scored for the production ofleaves (#2), branches (#3), and flowers (#4). By summation, the total number of nodes (#18) gives an indication of plant size. The occurrence and number of secondary branches (#5) was recorded for each plant, as was the number of flowers on each secondary
602
Table I. List of characters studied.
I. Leaf Area-laminar area of leaves at vegetative nodes 8-12 2. Leaves-number of leaves in vegetative region 3. Branches-number of primary branches in branch region 4. Main Flowers-number of flowers in main stem flower region 5. Secondary Branches-number of secondary branches 6. Secondary Flowers-number of flowers on secondary branches 7. Primary Flowers-number of flowers on primary branches 8. Growth Rate-number of days from planting to first flower 9. Total Flowers per Plant-sum of traits 4, 6, and 7
10. Flowering Rate-number of flowers opening in 12 days II. Ovules per Flower-ovule number in self pollinated flowers 12. Seeds per Ovule-proportion of ovules developing into seeds 13. Seeds per Fruit-number of seeds in self pollinated flowers 14. Seed Weight-in mg per 100 seeds IS. Pollen Grains-number per flower 16. Ovules per Flower-number of ovules in flower bud samples 17 . PIO Ratio-ratio of 15/ 16 18. Total Nodes-sum of traits 2, 3, and 4 19. Flowers Displayed-number of open flowers with immature stigmas 20. Nutrient Treatment-relative amount of nutrients received 21. Yield-seed mass per plant: 21 = 9 x II x 12 x 14
ALISO
branch (#6) and on each primary branch (#7). The numbers of flowers counted in each category were added together to yield the total number of flowers per plant (#9).
Flower display. - The flowers of Clarkia unguiculata are markedly protandrous, and, hence, are open for several days before the stigma becomes receptive. Consequently, a number of open but unreceptive flowers are displayed between a receptive flower and the oldest unopened flower bud. The number of open flowers was used as an index of 'flower display' (#19).
Location offlower samples. -Five open flowers, with expanded, receptive stigmas, were marked and self-pollinated on each plant on different dates. These five selfpollinated flowers were located approximately at flowering nodes numbered 7, 14, 21, 26, and 31, respectively, on the main stem of each plant. At the same time these flowers were self-pollinated, the largest, unopened flower bud, some 8 to 12 nodes more distal, was also harvested. The flower buds were located approximately at flowering nodes numbered 19, 26, 33, 37, and 40. The two sets of samples overlap, and together represent stages in a continuous developmental sequence. These stages were produced at different times, and, hence, at different degrees of plant maturity; they are, therefore, called maturity stages. Based on relative position in the developmental sequence, the maturity stages of self-pollinated flowers are labeled I, 2, 4, 5, and 7 whereas the maturity stages of flower buds are labeled 3, 6, 8, 9, and 10. Stages 5 and 6 both occur, on average, at node 26, but in fact sample different near-by flowers. The fruits from self-pollinated flowers were later harvested to estimate ovule number per flower (#11) and seed number per fruit (# 13), and to calculate the proportion of developed seeds per ovule (#12). The flower bud samples were fixed in 95% ethanol and later used to estimate the number of ovules (# 16) and pollen grains (# 15) per flower.
VOLUME II , NUMBER 4 603
Pollen and ovule production. - Clarkia flowers have four large anthers, four small anthers, and an inferior ovary of four carpels, each with one row of ovules. All the pollen from one entire anther sac of a large anther was scraped onto a standard glass slide in a drop of cotton blue in lactophenol (Sass 1951), covered with a cover slip and counted directly with the aid of a compound microscope equipped with a mechanical stage. Grains that stain with cotton blue were well-formed and presumably viable. Nonstaining grains were shrunken and deformed, and therefore inviable. The proportion of apparently viable pollen ranged from about 84 to 98%, averaging about 94%. Differences in apparent viability among treatments and maturity stages were not significant. We counted the total number of grains in the anther sac, and multiplied by 8 to estimate the total number of pollen grains in the four large anthers. The process was repeated for the small anthers. The total for the large anthers and the total for the small anthers were added to give the total number of pollen grains per flower (# 15). Experimental error was estimated by counting all the grains in all the anthers for one flower in each treatment, and comparing that total with the estimated total for that flower. For the four treatments, the estimated total number of pollen grains was respectively 9.2% less, 2.8% more, 5.9% more, and 3.6% less than the total number of grains actually counted for the same flowers.
The ovary wall was dissected away from one side of the ovary, exposing the ovules lined up in two of the four carpels. The ovules were counted with the aid ofa dissecting microscope and the resulting number doubled to estimate the ovule number (# 16) in the entire ovary. Experimental error, determined by occasionally counting the ovules in all four carpels, was less than one ovule per fruit.
Another estimate of ovule number was obtained from the self-pollinated flowers. Upon maturity, each resulting fruit was harvested and kept individually in small, labeled envelopes. Later, each capsule was stripped and all the developed seeds and all the undeveloped, chaffy ovules were counted and scored separately, giving a direct estimate of both the number of seeds per fruit (#13) and the number of unfilled ovules. Secondarily, the total number of ovules (#11) in the fruit, and the proportion of developed seeds per ovule (# 12), were derived by simple calculation. Seed size (#14) was estimated by weighing 20 normal seeds from each fruit, and expressed as weight in milligrams per 100 seeds.
Developmental rates. - The date the first flower opened was recorded for each plant. The number of days elapsed between planting and first flowering was used as an indication of general growth rate (#8). By this scheme, a low number of days indicates rapid growth, and a high number of days reflects slow growth.
Developmental rate of flowers (#10) was determined by counting the number of flowers opening between two recorded dates. Plants in the several treatments did not all flower synchronously, thus the actual sampling dates were not the same for all treatments. However, all plants were sampled on May 5 and May 17. The number of flowers opening during that common 12-day period was counted and recorded for all plants.
Data Analysis
Most characteristics relating to the growth pattern were tested for significant differences among nutrient treatments by one-way analysis of variance. Characteristics relating to sequential growth or production were analyzed by two-way
604 ALISO
analysis of variance to test for significance of differences among nutrient level treatments and maturity levels, and for interaction between them (Steel and Torrie 1980). Significant differences among means were identified with Duncan's Multiple Range Test or the Student-Newman-Keul (SNK) test (Steel and Torrie 1980; SAS 1985).
Two diagrams of plant development (leading to Figs. 1 and 2) were constructed on the basis of the sequence of events observed during the plant growth cycle. First, developmental events leading to the production of flowers were diagrammed and analyzed by assuming an additive model, since the total number of flowers is the sum of flowers on the main stem, the primary branches, and the secondary branches. This diagram was quite complex, and was simplified (Fig. 1) by limiting the number of traits included to the fewest traits required to reconstruct the correlation matrix from the path coefficients (see below). Second, the components of yield were diagrammed (Fig. 2) and analyzed by assuming a multiplicative model, since yield is the product of the several yield components.
Plant characteristics associated with growth and flower production, and with yield, were analyzed by correlation coefficients and by path analysis (Li 1986). A path coefficient is a standardized partial regression coefficient which measures the linear relationship between two variables. Path analysis permits partitioning of correlation coefficients into "direct" and "indirect" effects (Pritts and Hancock 1985; Bhatt 1973; Dewey and Lu 1959; Duarte and Adams 1972). In a selfcontained path diagram describing a causal system in which the path coefficients all lie in the interval (- 1, 1), the proportion of the variation in a resultant trait "directly" attributable to a contributory trait is given by the square of the path coefficient (i.e., by the square of the standardized regression coefficient). The proportion of variation attributable to a contributory trait "indirectly" through its correlation with other contributing traits is determined by mUltiplying the several path or correlation coefficients along each indirect path through other contributing traits to the resultant trait. The coefficient of determination, and hence its decomposition, is given as the sum of the contributions from all possible direct and indirect paths in the path diagram. When the value of one or more path coefficients in a self-contained path diagram lies outside the interval (- I, 1), the decomposition of a correlation coefficient and a coefficient of determination remain mathematically valid. However, it is no longer useful to discuss the decomposition of a coefficient of determination in terms of the proportion of variation attributable to direct and indirect effects. In any self-contained path diagram, the coefficients of determination and nondetermination add to unity, and, hence, each can readily be expressed as a percentage.
Path coefficients were calculated from standardized data over all nutrient treatments, as five replicates were too few for path analysis within each treatment. Consequently, the nutrient treatment was incorporated as an9ther variable (trait #20) by entering the relative amount of nutrients per week received by each plant, i.e., 1, 4, 7, or 28 for plants in Treatments 1, 2, 3, and 4, respectively.
In addition, a coefficient of interdependence, W, (Hardwick and Andrews 1980) can be calculated to evaluate the overall relationship among the components of yield. The fundamental equation for yield analysis is multiplicative, but can be transformed to an additive one by taking natural logarithms (Wahua and Miller 1978; Driscoll and Abel 1976). Wis a function of the variance oflog yield to the

VOLUME II , NUMBER 4
Table 2. Leaf area (trait number I) at different levels and maturity stages.t
Stage Treatment (node
#)
8 8.80 10.84 11.19 13.70 9 6.99 9.89 9.94 13.51
10 6.52 10.05 10.20 14.04 II 6.22 8.69 7.91 12.88 12 5.34 8.83 8.07 10.48 Mean 6.77 9.66 9.46 12.92 CV 24.25 12.13 17.95 21.79 SD 1.64 1.17 1.70 2.82
ANOVA: T***; S***; T x S NS SNK: T: A, B, B, C; S: A, A, A, B, B.
Mean
11.13 10.08 10.20 8.92 8.18 9.70
29.89 2.90
605
t Treatments I to 4 respectively received the following relative strengths of Hoagland's solution: I , 4, 7, and 28 . Maturity stages are successive vegetative nodes numbered 8 to 12. Table entries are mean values (cm' ) for five replicate plants. Variation among replicates was not significant. CV =
coefficient of variation; SD = standard deviation; ANOV A = two-way analysis of variance for treatments (T) and stages (S) , and their interaction (T x S). SNK = significance groups, read sequentially from left to right for the four treatment means and from top to bottom for the five maturity stage means, based on the Student-Newman-Keul test; means designated by the same letter are not significantly different. For all tables: NS = not significant; *, **, and *** indicate significance respectively at the levels of P = 0.05 , 0.0 I, and 0.00 I.
squared sum of the standard deviations of the log yield components. Values close to 0.0, 0.5 and 1.0, respectively, give a qualitative estimate of whether yield components are compensatory, independent or additive (Hardwick and Andrews 1980).
RESULTS
Leaf Area
Mean leaf surface area increased with increasing nutrient level and decreased with increasing nodal position (Table 2). Differences among treatments and among stages were both highly significant, but the interaction was not. However, the changes were slightly irregular, and the difference between treatments 2 and 3 is not significant. Leaves at nodes 11 and 12 are significantly smaller than those at the preceding three nodes. Leaves and leafy bracts continue to decrease in size at later nodes until eventual plant senescence occurs. For example, average leaf area (cm2) in two representative plants (unpubl. data) was 11.95 at nodes 8-12, but 5.99 at nodes 16-20, and 2.38 at nodes 30-34.
Growth and Flower Production
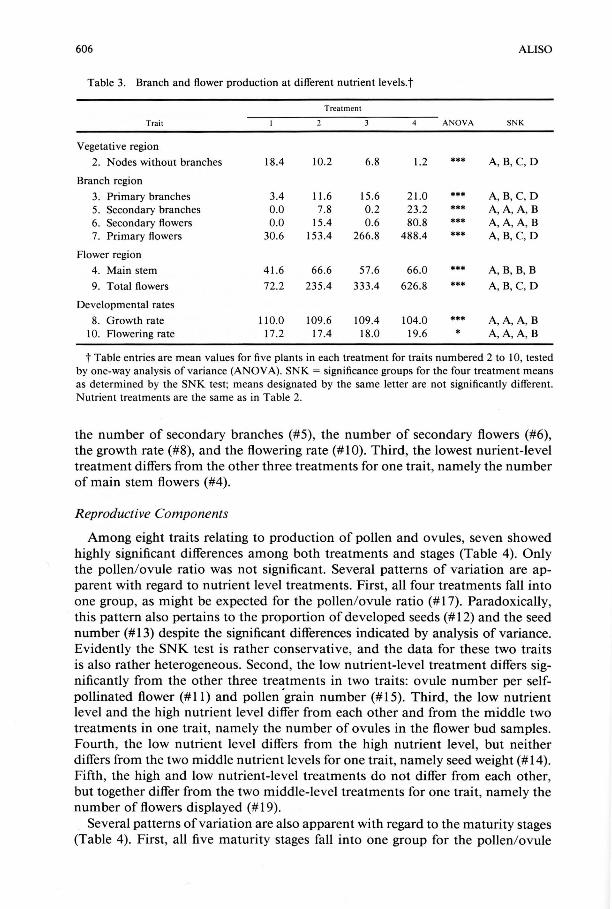
All traits relating to growth and flower production showed highly significant differences among treatments (Table 3). Three patterns of variation are apparent. First, all four treatment means are significantly different for four traits: the number ofleaves (#2), the number of primary branches (#3), the number of primary flowers (#7), and the total number of flowers (#9). Second, the highest nutrient-level treatment differs significantly from the other three treatments in four other traits:
606 ALISO
Table 3. Branch and flower production at different nutrient levels.t
Treatment
Trait 4 ANOVA SNK
Vegetative region
2. Nodes without branches 18.4 10.2 6.8 1.2 *** A,B,C, D
Branch region
3. Primary branches 3.4 11.6 15.6 21.0 *** A,B, C,D 5. Secondary branches 0.0 7.8 0.2 23.2 *** A, A, A, B 6. Secondary flowers 0.0 15.4 0.6 80.8 *** A, A, A, B 7. Primary flowers 30.6 153.4 266.8 488.4 *** A,B, C,D
Flower region
4. Main stem 41.6 66 .6 57.6 66.0 *** A, B, B, B
9. Total flowers 72.2 235.4 333.4 626.8 *** A, B, C, D
Developmental rates
8. Growth rate 110.0 109.6 109.4 104.0 *** A, A, A,B 10. Flowering rate 17.2 17.4 18.0 19.6 * A, A, A, B
t Table entries are mean values for five plants in each treatment for traits numbered 2 to 10, tested by one-way analysis of variance (ANOV A). SNK = significance groups for the four treatment means as determined by the SNK test; means designated by the same letter are not significantly different. Nutrient treatments are the same as in Table 2.
the number of secondary branches (#5), the number of secondary flowers (#6), the growth rate (#8), and the flowering rate (# 1 0). Third, the lowest nurient-level treatment differs from the other three treatments for one trait, namely the number of main stem flowers (#4).
Reproductive Components
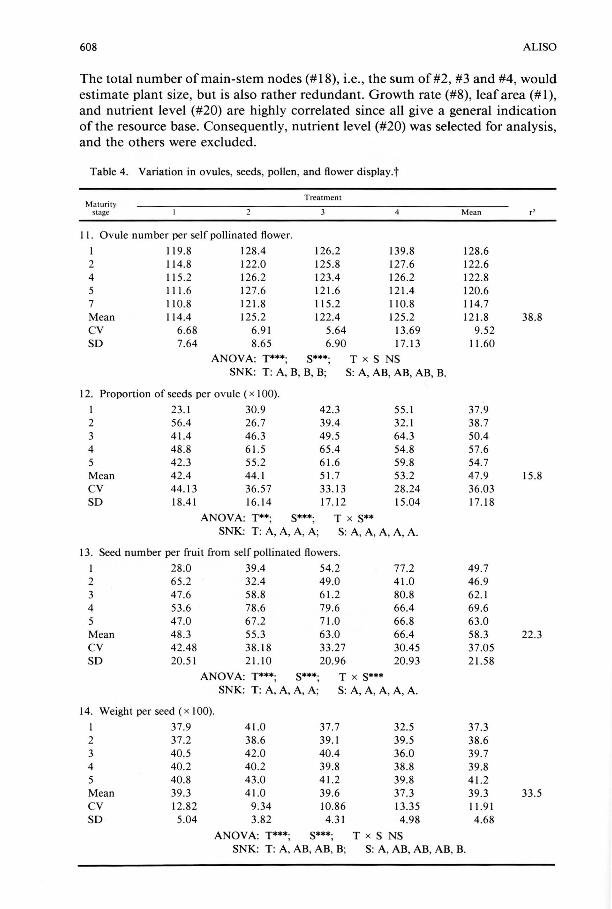
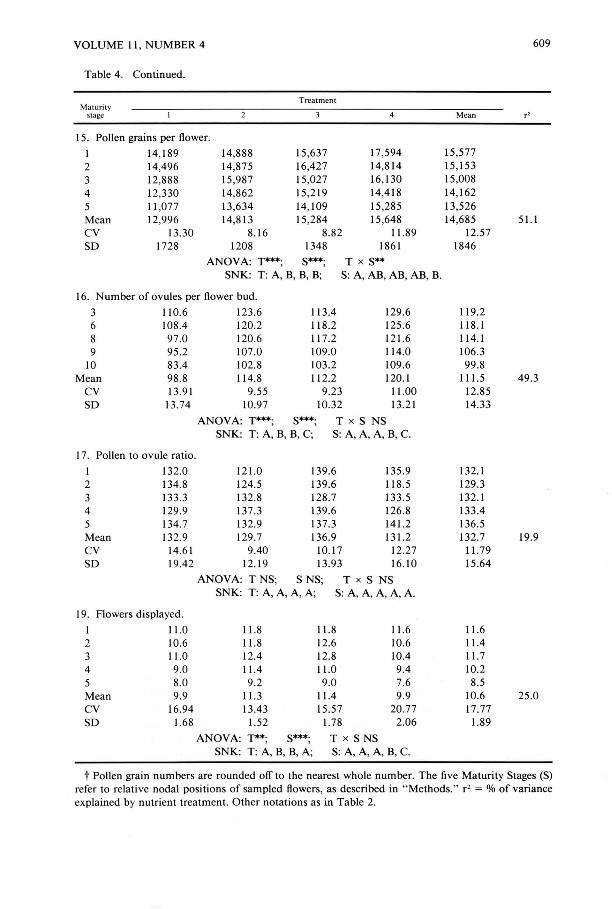
Among eight traits relating to production of pollen and ovules, seven showed highly significant differences among both treatments and stages (Table 4). Only the pollen/ovule ratio was not significant. Several patterns of variation are apparent with regard to nutrient level treatments. First, all four treatments fall into one group, as might be expected for the pollen/ovule ratio (# 17). Paradoxically, this pattern also pertains to the proportion of developed seeds (# 12) and the seed number (#13) despite the significant differences indicated by analysis of variance. Evidently the SNK test is rather conservative, and the data for these two traits is also rather heterogeneous. Second, the low nutrient-level treatment differs significantly from the other three treatments in two traits: ovule number per selfpollinated flower (#11) and pollen 'grain number (#15). Third, the low nutrient level and the high nutrient level differ from each other and from the middle two treatments in one trait, namely the number of ovules in the flower bud samples. Fourth, the low nutrient level differs from the high nutrient level, but neither differs from the two middle nutrient levels for one trait, namely seed weight (#14). Fifth, the high and low nutrient-level treatments do not differ from each other, but together differ from the two middle-level treatments for one trait, namely the number of flowers displayed (# 19).
Several patterns of variation are also apparent with regard to the maturity stages (Table 4). First, all five maturity stages fall into one group for the pollen/ovule
VOLUME 11, NUMBER 4 607
ratio (# 17), as might be expected. However, and again paradoxically, the proportion of developed seeds per ovule (# 12), and seed number per fruit (#13), also fall into this category despite significant differences indicated by analysis of variance. This paradox is probably accounted for by the heterogeneity of the data for these two traits and by the conservatism ofthe SNK test. Second, the earliest and latest maturity stages are significantly different from each other, but not from the three middle stages, in three traits: ovule number per self-pollinated flower (#11), seed weight (#14), and pollen grain number (#15). Third, the last and second last stages are significantly different from each other, and from a group comprised of the first three stages, in two traits: the number of ovules per flower bud (# 16), and the number of flowers displayed (# 19).
Mean ovule number in self-pollinated flowers (#11) was significantly higher (Table 4) than mean ovule number in flower buds (#16), even though the two are strongly correlated (Table 5B). For the two ovule number traits (# 11 and # 16) combined, the 10 maturity stages (Table 4) rank from high to low as follows: 1, 4, 2, 5, 3, 6, 7, 8, 9, and 10. These respectively fall into four overlapping groups, as determined by a Duncan's Multiple Range Test: A, AB, AB, BC, BC, BC, C, D, D (stages represented by the same letter are not significantly different). Consequently, the early stages are similar and variable, but ovule number decreases very strongly in the late maturity stages.
The pooled coefficients of variation (Tables 2 and 4) are very high for seed number (# 13), the proportion of developed seeds per ovule (# 12), and leaf area (#1), moderately high for flower display (#19), and moderately low for the remaining traits. For individual treatments, CV's decrease with nutrient level in seed number (# 13) and developed seeds per ovule (# 12); otherwise, the lowest nutrient treatment shows the greatest variation and the highest nutrient treatment shows the second greatest variation, or vice versa, except for ovule number (# 11) where the CV for treatments 1 and 2 are nearly the same.
Analysis of Development
Traits involved in plant growth and the production of flowers may be arranged in a scheme (Fig. 1) by their relative developmental sequence. The nutrient level (#20), a resource in place through all developmental stages, influences leaf number (#2), leaf area (# 1) and the growth rate (#8). The plants then develop some number of primary branches (#3), and, later, some number of main-stem flowers (#4). The primary branches may produce some number of primary-branch flowers (#7), secondary branches (#5), and secondary-branch flowers (#6). The summation of main (#4), primary (#7) and secondary (#6) flowers would give the total number of flowers (#9) produced by the plant, which is one of the first components of yield.
The initial scheme was quite complex, and some of the measured traits were excluded from consideration to simplify the analysis. The number of leafy nodes (#2) in the vegetative region was excluded because it is almost perfectly, but negatively, correlated (Table 5A) with the number of primary branches (#3), and, hence, gives no additional useful information. The rate of flower opening (#10) and the amount of flower display (# 19) have more to do with the pollination syndrome than with development. The second set of ovule number estimates (# 16) are redundant and were used only to estimate pollen/ovule ratios (# 17).
608 ALISO
The total number of main-stem nodes (#18), i.e., the sum of#2, #3 and #4, would estimate plant size, but is also rather redundant. Growth rate (#8), leaf area (# 1), and nutrient level (#20) are highly correlated since all give a general indication of the resource base. Consequently, nutrient level (#20) was selected for analysis, and the others were excluded.
Table 4. Variation in ovules, seeds, pollen, and flower display.t
Treatment Maturity
stage Mean r'
II. Ovule number per self pollinated flower.
I 11 9.8 128.4 126.2 139.8 128.6 2 114.8 122.0 125.8 127.6 122.6 4 115 .2 126.2 123.4 126.2 122.8 5 111.6 127 .6 121 .6 121.4 120.6 7 110.8 121.8 115.2 110.8 114.7 Mean 114.4 125.2 122.4 125.2 121.8 38.8 CV 6.68 6.91 5.64 13.69 9.52 SO 7.64 8.65 6.90 17.13 11.60
ANOV A: T***; S***; T x S NS SNK: T: A, B, B, B; S: A, AB, AB, AB, B.
12. Proportion of seeds per ovule ( x 100).
1 23 .1 30.9 42.3 55.1 37.9 2 56.4 26 .7 39.4 32.1 38.7 3 41.4 46 .3 49.5 64.3 50.4 4 48.8 61.5 65.4 54.8 57.6 5 42.3 55 .2 61.6 59.8 54.7 Mean 42.4 44. 1 51.7 53.2 47.9 15.8 CV 44. 13 36.57 33.13 28.24 36.03 SO 18.41 16. 14 17.12 15 .04 17. 18
ANOVA: T**; S***; T x S** SNK: T: A, A, A, A; S: A, A, A, A, A.
13. Seed number per fruit from self pollinated flowers:
1 28.0 39.4 54.2 77.2 49.7 2 65 .2 32.4 49.0 41.0 46.9 3 47.6 58.8 61.2 80.8 62.1 4 53 .6 78.6 79.6 66.4 69 .6 5 47.0 67.2 71.0 66.8 63.0 Mean 48 .3 55.3 63.0 66.4 58.3 22.3 CV 42.48 38.18 33.27 30.45 37.05 SO 20.51 21.10 20.96 20.93 21.58
ANOV A: T***; S***; T x S*** SNK: T: A, A, A, A; S: A, A, A, A, A.
14. Weight per seed ( x 100).
1 37.9 41.0 37.7 32.5 37.3 2 37 .2 38.6 39.1 39.5 38.6 3 40.5 42.0 40.4 36.0 39.7 4 40.2 40.2 39.8 38.8 39.8 5 40.8 43.0 41.2 39.8 41.2 Mean 39.3 41.0 39.6 37.3 39.3 33.5 CV 12.82 9.34 10.86 13.35 11.91 SO 5.04 3.82 4.31 4.98 4.68
ANOVA: T***; S***; T x S NS SNK: T: A, AB, AB, B; S: A, AB, AB, AB, B.
VOLUME II , NUMBER 4
Table 4. Continued.
Maturity stage
Treatment
15. Pollen grains per flower.
I 14,189 14,888 15,637 17,594 2 14,496 14,S75 16,427 14,S14 3 12,888 15,987 15,027 16,130 4 12,330 14,862 15,2 19 14,41S 5 11 ,077 13,634 14, 109 15,285 Mean 12,996 14,813 15,284 15,648 CV 13.30 8.16 8.82 11.89 SO 1728 1208 1348 1861
ANOVA: T***; S***; T x S** SNK: T: A, B, B, B; S: A, AB, AB, AB, B.
16. Number of ovules per flower bud .
3 110.6 123.6 113.4 129.6 6 108.4 120.2 118.2 125.6 S 97.0 120.6 117.2 121.6 9 95.2 107.0 109.0 114.0
10 83.4 102.8 103.2 109.6 Mean 98 .8 114.8 11 2.2 120.1
CV 13.9 1 9.55 9.23 11.00 SO 13.74 10.97 10.32 13.21
ANOVA: T***; S***; T x S NS SNK: T: A, B, B, C; S: A, A, A, B, C.
17. Pollen to ovule ratio.
I 132.0 121.0 139.6 135.9 2 134.8 124.5 139.6 118.5 3 133.3 132.8 128.7 133.5 4 129.9 137.3 139.6 126.8 5 134.7 132.9 137.3 141.2 Mean 132.9 129.7 136.9 13 1.2 CV 14.61 9.40 10.17 12.27 SO 19.42 12.19 13.93 16.10
ANOVA: TNS; S NS; T x S NS SNK: T: A, A, A, A; S: A, A, A, A, A.
19. Flowers displayed.
I 11.0 11.8 11.8 11.6 2 10.6 11.8 12.6 10.6 3 11.0 12.4 12.8 10.4 4 9.0 11.4 11.0 9.4 5 8.0 9.2 9.0 7.6 Mean 9.9 11.3 11.4 9.9 CV 16.94 13.43 15.57 20.77 SO 1.68 1.52 1.78 2.06
ANOVA: T**; S***; T x S NS SNK: T: A, B, B, A; S: A, A, A, B, C.
609
Mean r'
15,577 15,153 15,008 14,162 13,526 14,685 51.1
12.57 1846
119.2 IIS . I 114.1 106.3 99.8
111.5 49.3 12.85 14.33
132.1 129.3 132.1 133.4 136.5 132.7 19.9
11.79 15.64
11.6 11.4 11.7 10.2 8.5
10.6 25 .0 17.77 1.89
t Pollen grain numbers are rounded off to the nearest whole number. The five Maturity Stages (S) refer to relative nodal positions of sampled flowers, as described in " Methods." r2 = % of variance explained by nutrient treatment. Other notations as in Table 2.
610 ALISO
Table 5A-C. Correlation coefficients. (Numbered traits are listed in Table I.)
A. Trai ts used for path analys is in Figure 1.
Trait 4 20
3 0.539 0.595 0.589 0.937 0.914 0.837 4 0.232 0.144 0.390 OA03 0.135 5 0.967 0.772 0.835 0.782 6 0.773 0.837 0.792 7 0.993 0.935 9 0.929 I 0.826 0.513 0.826 0.772 0.885 0.905 0.813 2 - 0.989 - 0.549 - 0.598 - 0.586 - 0.925 -0.903 - 0.839 8 0.937 -0.099 - 0.731 - 0.736 - 0.825 - 0.826 - 0.939
10 0.586 0.0 13 0.389 OA32 0.617 0.592 0.669 II OA59 OAIO 0.321 0.277 0.386 0.393 0.295 12 0.573 0. 156 0.275 0.271 0.542 0.506 OA83 13 0.599 0.241 0.333 0.313 0.556 0.530 OA85 14 - 0.243 0.087 - 0.061 - 0.072 0.304 -0.177 - 0.302 15 0.794 0.648 0.552 0.504 0.754 0.753 0.574 16 0.79 1 0.654 0.587 0.534 0.738 0.746 0.639 17 0.029 - 0.045 - 0.051 - 0.027 0.040 0.025 - 0.087 19 0.086 0.589 - 0.098 - 0.140 - 0.043 - 0.030 -0.260
13. Trai ts associated with the po llen/ov ule ratio.
Trait 11 15 16 17
II 0.663 0.709 - 0.015 15 0.827 0.306 16 - 0.272
c. Traits used for determining yield components in Figure 2.t Trait 11 12 13 14 2 1
9 0.393 OA66 0.530 - 0.177 0.956 II OA7 1 0.346 0.630 -0.103 0.528 12 OA57 0.331 0.946 - 0.064 0.579 13 0.539 - 0.108 0.670 14 - 0.1 39 - 0.070 0.Q35 0.006 -0.092 2 1 0.973 0.539 0.618 0.697 -0.0 13
t Trait #21 (yield in mg of seeds per plant) was calculated from: Y = 9 x II x 12 x 14. Coefficients in upper right were calculated from raw data, those in lower left from log data.
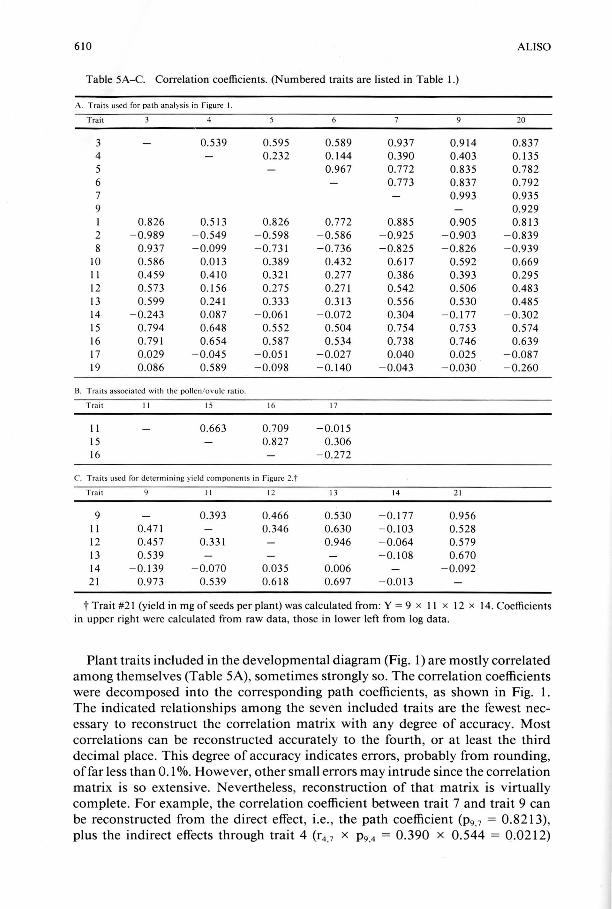
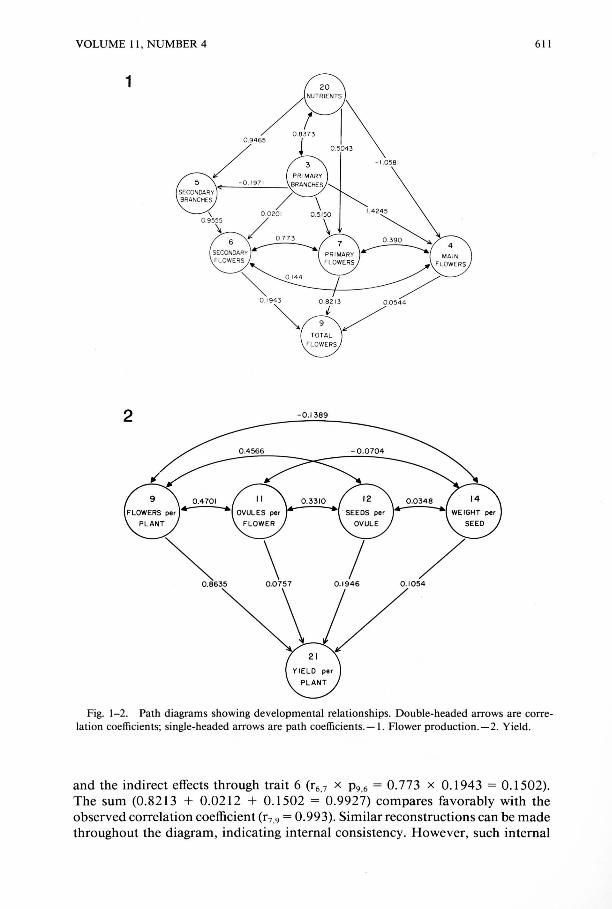
Plant traits included in the developmental diagram (Fig. 1) are mostly correlated among themselves (Table 5A), sometimes strongly so. The correlation coefficients were decomposed into the corresponding path coefficients, as shown in Fig. 1. The indicated relationships among the seven included traits are the fewest necessary to reconstruct the correlation matrix with any degree of accuracy. Most correlations can be reconstructed accurately to the fourth , or at least the third decimal place. This degree of accuracy indicates errors, probably from rounding, of far less than 0.1 %. However, other small errors may intrude since the correlation matrix is so extensive. Nevertheless, reconstruction of that matrix is virtually complete. For example, the correlation coefficient between trait 7 and trait 9 can be reconstructed from the direct effect, i.e. , the path coefficient (P9.7 = 0.8213), plus the indirect effects through trait 4 (r4 ,7 x P9,4 = 0,390 x 0.544 = 0,0212)
VOLUME II , NUMBER 4
1
FLOWERS
0 .144
~ 019~
/ :t213/ 0544 TOTAL
FLOWERS
-0.1389
611
Fig. 1-2. Path diagrams showing developmental relationships. Double-headed arrows are correlation coefficients; single-headed arrows are path coefficients. - I . Flower production. - 2. Yield.
and the indirect effects through trait 6 (r6,7 x P 9 .6 = 0.773 x 0.1943 = 0.1502). The sum (0.8213 + 0.0212 + 0.1502 = 0.9927) compares favorably with the observed correlation coefficient (r 7.9 = 0.993). Similar reconstructions can be made throughout the diagram, indicating internal consistency. However, such internal
612 ALISO
consistency was not possible before the inclusion of trait #3 (the number of primary branches) as a causal variable for traits 4, 5, 6, and 7.
Identification of direct and indirect effects can readily be made by comparison of path coefficients (Fig. I) and correlation coefficients (Table 5A). Nutrient level (#20) has strong direct effects on primary-branch flowers (#7) and also fairly strong indirect effects through primary branches (#3). Nutrient level has rather weak indirect effects on secondary-branch flowers (#6), as mediated through the number of primary branches (#3), and sequentially through primary (#3) and secondary (#5) branches, but rather strong indirect effects as mediated through only the secondary branches (#5). The number of primary branches (#3) obviously and strongly affects the number of primary-branch flowers (#7), since the direct effects constitute about 55% of a very strong correlation. That very strong increase in primary-branch flowers (#7) also has the effect of decreasing the relative number of main-stem flowers (#4) (Table 3).
The relative contribution of each group of flowers to the total flower number may be more precisely quantified by a coefficient of determination (Li 1986). For example, the percentage of the total flower number directly determined by the number of primary-branch flowers (#7), the number of secondary-branch flowers (#6), and the number of main-stem flowers (#4) is 67.45%, 3.78%, and 0.3%, respectively (Table 6A). The indirect effectsjointly determined by primary-branch flowers (#7) and secondary-branch flowers (#6) is 24.68%. The indirect effects jointly determined by the primary-branch flowers (#7) and the main-stem flowers (#4) are 3.48%, and jointly by secondary-branch flowers (#6) and main-stem flowers (#4) are 0.3% (Table 6A).
Therefore, the developmental pattern leading to the production of primary branches has the greatest proportional effect in the determination of flower number (Fig. I). The developmental pathway leading to secondary branch production has a relatively modest role in determining flower number, and the main-stem flower path is almost insignificant.
Components of Yield
Total yield (#21), in seed mass per plant, is calculated to be the product of flower number per plant, number of ovules per flower, proportion of seeds developed per ovule, and weight per seed: #21 = #9 x #11 x #12 x #14 (Fig. 2). (For this purpose, # 14 is restated in units of weight per seed.) Other plant traits associated with yield were initially included. However, the number of pollen grains produced (# 15) was omitted from this analysis because the experimental plants were regularly hand pollinated and not subject to any pollen limitation. In addition, the number of seeds per flower (# 13) simply condenses two traits, number of ovules per flower (# 11) and the proportion of developed seeds per ovule (# 12), and hence was used only in the calculation of the developed seed proportion.
The coefficient of interdependence gives a qualitative estimate of the overall relationship among the several components of yield (Hardwick and Andrews 1980). Values close to 0.5 indicate independence among components, whereas values close to 0.0 indicate compensation and values near 1.0 indicate additivity. We calculated the coefficient of interdependence to be W = 0.6337. The 90% confidence interval about W = 0.5 ranges from 0.37 to 0.62 (Hardwick and
VOLUME II , NUMBER 4 613
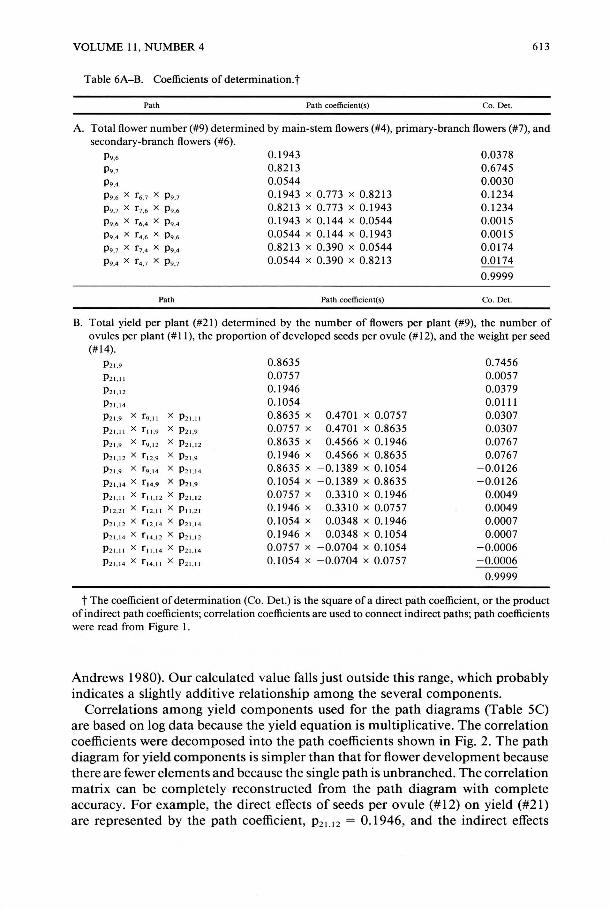
Table 6A-B. Coefficients of determination.t
Path Path coefficient(s) Co. Det.
A. Total flower number (#9) determined by main-stem flowers (#4), primary-branch flowers (#7), and secondary-branch flowers (#6).
P9,. 0,1943 0.0378 P9.7 0,8213 0.6745 P9.4 0.0544 0.0030 P9,. X r • .7 x P9.7 0.1943 x 0.773 x 0.8213 0.1234 P9,' X r". x P9,. 0.8213 x 0.773 x 0.1943 0.1234 P9,. X r ... x P9.4 0.1943 x 0.144 x 0.0544 0.0015 P9.4 X r4,. x P9,. 0.0544 x 0.144 x 0.1943 0.0015 P9,' X r, .4 x P9,4 0.8213 x 0.390 x 0.0544 0.0174 P9.4 X r4,' x P9,' 0.0544 x 0.390 x 0.8213 0.0174
0.9999
Path Path coefficient(s) Co, Det.
B. Total yield per plant (#21) determined by the number of flowers per plant (#9), the number of ovules per plant (# II), the proportion of developed seeds per ovule (# 12), and the weight per seed (#14).
P21,9 0.8635 0.7456 P ZLII 0.0757 0.0057 P21 . 12 0.1946 0.0379 P 2 1,14 0.1054 0.0111 P2I.9 X T9, 11 X PlI , ] I 0.8635 x 0.4701 x 0.0757 0.0307 P l I,!l X T 11 ,9 X P21,9 0.0757 x 0.4701 x 0.8635 0.0307
P" ,9 X T 9 . 12 X P21.1 2 0.8635 x 0.4566 x 0.1946 0.0767 P 2 1, 12 X T 12.9 X P2I ,9 0.1946 x 0.4566 x 0.8635 0.0767 P21,9 X f 9 , 14 X P21 , 14 0.8635 x - 0.1389 x 0.1054 - 0.0126 P21 , 14 X T 14•9 X P21.9 0.1054 x - 0.1389 x 0.8635 - 0.0126 P l l,]1 X f'l.1 2 X P 2 1, 12 0.0757 x 0.3310 x 0.1946 0.0049 P1 2.2 1 X TU,!l X Pll ,2 1 0.1946 x 0.3310 x 0.0757 0.0049 P21 , 12 X T' 2, 14 X P 2 1, 14 0.1054 x 0.0348 x 0.1946 0.0007 P 2 1, 14 X T I4 , 12 X P2I , 12 0.1946 x 0.0348 x 0.1054 0.0007 P Z L11 x f 11 , 14 X P 2 1, 14 0.0757 x - 0.0704 x 0.1054 - 0.0006 P21 , 14 X T'4 , 11 X P l l , ll 0.1054 x - 0.0704 x 0.0757 -0.0006
0.9999
t The coefficient of determination (Co. Det.) is the square of a direct path coefficient, or the product of indirect path coefficients; correlation coefficients are used to connect indirect paths; path coefficients were read from Figure I .
Andrews 1980). Our calculated value falls just outside this range, which probably indicates a slightly additive relationship among the several components.
Correlations among yield components used for the path diagrams (Table 5C) are based on log data because the yield equation is multiplicative. The correlation coefficients were decomposed into the path coefficients shown in Fig. 2. The path diagram for yield components is simpler than that for flower development because there are fewer elements and because the single path is unbranched. The correlation matrix can be completely reconstructed from the path diagram with complete accuracy. For example, the direct effects of seeds per ovule (#12) on yield (#21) are represented by the path coefficient, P21.12 = 0.1946, and the indirect effects
614 ALISO
through flower number (#9), ovules per flower (#11), and weight per seed (#14) are represented by r9 , 12 x P 2 1,9 = 0.4566 x 0.8635 = 0.3943, r ll , 12 x P 2 1, ll = 0.3310 x 0.0757 = 0.0251, and r 14 , 12 x P 2 1, 14 = 0.0348 x 0.1054 = 0.0037 , respectively. Their sum, 0.1946 + 0.3943 + 0.0251 + 0.0037 = 0.6177 , exactly reconstructs the observed correlation coefficient. The other two correlation coefficients can similarly be completely reconstructed. Comparison of path coefficients (Fig. 2) and correlation coefficients (Table 5C) immediately identifies the proportion of effects directly attributable to a given component.
When one uses coefficients of determination (Li 1986), most ofthe yield, about 74.6%, is directly determined by the number of flowers per plant (#9), and a small amount, about 3.8%, by the number of seeds per ovule (#12), whereas the number of ovules per flower (#11) and the weight per seed (#14) contribute relatively little (Table 6B). The indirect effects, that is, the proportion of yield jointly determined by two traits, are moderately high for flower number (#9) in combination with ovule number (# 11) and with seeds per ovule (# 12), but slightly negative with seed weight (#14).
DISCUSSION
Our four objectives were to determine whether flower number and other components of growth and reproduction increased with nutrient level, what developmental patterns would be modified to accomodate observed increases, what effects nutritional level and flower location have on pollen and ovule production in individual flowers, and whether consistency of the pollen/ovule ratio might be affected by variation in the production of pollen and ovules. These objectives were met with the results that growth rate, leaf size, branch number, and flower number increased with nutrient level; the increase in flower number was effected largely through an increase in primary branch production; the number of ovules and the number of pollen grains increased with nutrient level, but decreased with stage of plant maturity; and despite significant variation in pollen and ovule production, the pollen/ovule ratio did not vary significantly.
Increase in plant size, leaf number, and other indicators of the resource base commonly occur with increased nutrients (Breen and Martin 1981 ; Parrish and Bazzaz 1982; Dale and Wilson 1978; Van Andel and Vera 1977; Bramlett and Belanger 1976; Abbott 1968; Aspinall 1961 ; Steinbrenner, Duffield, and Campbell 1960; Mergen and Voigt 1960). The number of flowers also commonly increases with nutrient level (Breen and Martin 1981; Bramlett and Belanger 1976; Steinbrenner et al. 1960; Hoekstra and Mergen 1957). Thus, the increases observed in Clarkia were consistent with those reported in other species. However, the amount of increase in flower number per plant, from 72 to 627 , was quite impressive and serves to emphasize the strength and regularity of response to higher nutrient levels.
The developmental pathway leading to the marked increase in primary branches is clearly shown by path analysis and the coefficient of determination to be the main developmental modification leading to the dramatic increase in flower number. Most studies only report numbers of flowers and do not consider the developmental modifications involved in flower number increase. An exception occurs in strawberry where Abbott (1968) indicates flower number increases only as a consequence of plant crown increase, which would be comparable to branch
VOLUME II , NUMBER 4 615
number increase in an erect plant like Clarkia. However, Breen and Martin (1981) find a significant nitrogen effect on flowers per inflorescence and inflorescences per crown, as well as crowns per plant.
The number of ovules per Clarkia flower increased with nutrient level and decreased with plant maturity state (Table 4). Evidently the developmental factor, i.e. , plant maturity stage or the position on the plant, is important in determining a representative ovule number. Studies which incorporate ovule number into their data usually do not discuss intraplant variation (e.g. , Cruden 1976, 1977), but rather assume that one value holds for an entire plant, an entire population, or even for an entire species.
The number of pollen grains produced per Clarkia flower also increased with nutrient level and decreased with plant age. Therefore, pollen grain number is rather strongly correlated with ovule number (Table 5B). Models of sex allocation assume that resource allocation to reproduction in hermaphroditic plants must be divided equally or, perhaps, unequally between male and female functions, but that an increased allocation to one necessitates a decreased allocation to the other (Charlesworth and Charlesworth 1981 ; Charnov 1982, 1979; also see Goldman and Willson 1986; and Cruden and Lyon 1985). To the contrary, in Clarkia, ovule and pollen numbers both increased with increased nutrient resources, at least under the experimental conditions of the present study, and both decreased with plant age (Table 4).
Following Bell (1985), we interpret pollen grain number (#15) and attracting features such as flower display (#19) to be male functions, whereas ovule number (# 11 , # 16) and seed weight (# 14) are female functions. The proportion of developed seeds per ovule (#12) and the number of seeds per fruit (#13) may partly be a consequence of the cryptic self-incompatibility recently demonstrated for Clarkia unguiculata by Bowman (1987). Even so, they appear to be resource limited and are probably also female functions. Allocation to female functions with increased nutrients increased from about 10% in ovule number of selfpollinated flowers (#11) to about 37% in number of seeds per fruit (#13). Allocation to male functions with increased nutrient resources increased about 20% in pollen grain number (# 15). Therefore, female functions seem to respond more strongly to increased nutrient resources, but the pattern is not conclusive.
Sexual selection theory predicts that the variance in male reproductive success is greater than the variance in female reproductive success, and that selection acts in proportion to the additive genetic variance (Stephenson and Bertin 1983; Mazer 1987). Consequently, we might also expect the variance in male components of reproduction to be greater than the variance in female components of reproduction. In ClarkFa, the variance explained by nutrient treatment (r2 in Table 4) is highest for pollen grain number (#15) but almost as high for ovule number in flower buds (# 16). The other male component ranks near the middle of the female components. Consequently, one male component does have the highest variance, but the general pattern is not altogether consistent or conclusive.
Developmental plasticity, as estimated by the coefficient of variation (Table 4) is quite low for three main female components, but the pollen grain number (# 15) is a fairly close fourth . The seeds per ovule (# 12) and seeds per fruit (# 13) are the most plastic. Again, the pattern does not clearly establish either male or female function as clearly higher or lower than the other.
The pollen to ovule ratio (P/O) varied somewhat between 118 and 141 in the
616 ALISO
present study. However, trends are not apparent, and the differences among treatments and among stages are not significant. Pollen grain number is weakly correlated with the PIO ratio, and ovule number is weakly and negatively so (Table 5B). Thus trends in their ratio are not expected. Consequently, PIO is fairly consistent within statistical limits, and the mean for each treatment is close to the grand mean (132.7). In other species, observed values for PIO range from 2.7 in some cleistogamous flowers to over 1,000,000 in some wind pollinated flowers (Cruden 1976). Within this range autogamous species generally occur well below a value of 200 and xenogamous species (outcrossers) generally have values well above 500, ranging to around 8000 (Cruden 1976). On this scale, Clarkia unguiculata might be interpreted as a seIfer on the basis of the observed PIO of about 132. In reality, it is a strong, protandrous outcrosser (Vasek 1965). Outcrossing species in several other genera of Onagraceae also have rather low PIO ratios, probably as a consequence oftheir highly efficient pollination mediated by viscin threads and large stigmatic surfaces (Cruden and Jensen 1979).
We conclude that PIO ratios are consistent despite significant differences in pollen grain and ovule production with nutrient treatment and position on the plant. These results are important confirmation that reported PIO ratios (e.g., Cruden 1977, 1976) are probably valid despite the absence of information about variation pattern.
ACKNOWLEDGMENTS
We are grateful to the University of California Agricultural Experiment Station for support, and to B. Devlin, N. Ellstrand, and two anonymous reviewers for valulable comments on the manuscript.
LITERATURE CITED
Adams, M. W. 1967. Basis of yield component compensation in crop plants with special reference to the field bean, Phaseolus vulgaris. Crop Sci. 7:505-510.
Abbott, A. J. 1968. Growth of the strawberry plant in relation to nitrogen and phosphorus nutrition. J. Hort. Sci. 43:491-504.
Arthur, A. E. , and C. L. Hedley. 1976. The effects of nitrogen on five varieties of Antirrhinum majus. Ann. Bot. 41 :627-636.
Aspinall, D. 1961. The control of tillering in the barley plant. Austral. J. BioI. Sci. 14:493-505. Bell, G. 1985. On the function of flowers. Proc. Roy. Soc. London B224:223-265. Bhatt, G. M. 1973. Significance of path coefficient analysis in determining the nature of character
association. Euphytica 22:338-343. Bierzychudek, Paulette. 1981. Pollinator limitation of plant reproductive effort. Amer. Nat. 117:
838-840. Bowman, R. N. 1987. Cryptic self-incompatibility and the breeding system of Clarkia unguiculata.
Amer. J. Bot. 74:471-476. Bramlett, D. L. , and R. P. Belanger. 1976. Fertilizer and phenotypic selection increase growth and
flowering of young Virginia pine. Forest Sci. 22:461-467. Breen, P. J., and L. W. Martin. 1981 . Vegetative and reproductive growth responses of three straw
berry cultivars to nitrogen. J. Amer. Soc. Hort. Sci. 106:266-272. Charlesworth, D., and B. Charlesworth . 1981 . Allocation of resources to male and female functions
in hermaphrodites. BioI. J. Linn. Soc. 15:57-74. Chamov, E. L. 1984. Behavioural ecology of plants, pp. 362-379. In J. R. Krebs and N. B. Davies
[eds.], Behavioural ecology: an evolutionary approach. Second edition. Sinauer Associates, Sunderland, Mass.
--. 1982. The theory of sex allocation. Princeton Univ. Press, Princeton.
VOLUME II , NUMBER 4 617
1979. Simultaneous hermaphroditism and sexual selection. Proc. Nat. Acad. Sci. USA 76: 2480-2484.
Costes, c., Y. Milhet, C. Candillon, and G. Magnier. 1976. Mineral nutrition and morphine production in Papaver somniferum. Physio!. Plant. 36:201-207.
Cruden, R. W. 1976. Intraspecific variation in pollen ovule ratios and nectar secretion-preliminary evidence of ecotypic differentiation. Ann. Missouri Bot. Gard. 63:277-289.
---. 1977. Pollen-ovule ratios: a conservative indicator of breeding systems in flowering plants. Evolution 31 :32-46.
---, and K. G. Jensen. 1979. Viscin threads, pollination efficiency and low pollen-ovule ratios. Amer. J. Bot. 66:875-879 .
---, and D. L. Lyon. 1985. Patterns of biomass allocation to male and female functions in plants with different mating systems. Oecologia 66:299-306.
Dale, J . E., and R. G . Wilson . 1978. A comparison of leaf and ear development in barley cultivars as affected by nitrogen supply. J. Agric. Sci. 90:503-508.
Dewey, D. R. , and K. H. Lu. 1959. A correlation and path coefficient analysis of components of crested wheatgrass seed production. Agronomy J. 51 :515-518.
Driscoll , M. F., and G. H. Abe!. 1976. A correct logarithmic transformation for standardizing multiplicative trait variables. Crop Sci. 16:301-303.
Duarte, R. A. , and M. W. Adams. 1972. A path coefficient analysis of some yield component interactions in field beans (Phaseolus vulgaris L.). Crop Sci. 12:579-582.
Eguchi, T., T. Matsumura, and M. Ashizawa. 1958. The effect of nutrition on flower formation in vegetable crops. Proc. Amer. Soc. Hort. Sci. 72:343-352.
Flint, H. L. , and S. Asen. 1953. The effects of various nutrient intensities on growth and development of snapdragons (Antirrhinum majus L.). Proc. Amer. Soc. Hort. Sci. 62:481-486.
Goldman, D. A. , and M. F. Willson. 1986. Sex allocation in functionally hermaphroditic plants: a review and critique. Bot. Rev. 52: 157-194.
Hardwick, R. C., and D. J. Andrews. 1980. Genotypic and environmental variation in crop yield. A method of estimating the interdependence of the components of yield. Euphytica 29: 177-188.
Hedley, C. L. , A. E. Arthur, and H. D. Rabinowitch . 1977. The effects of nitrogen level on the performance of Antirrhinum cultivars grown in greenhouse conditions. Euphytica 26:755-760.
Hoekstra, P. E., and F. Mergen. 1957. Experimental induction of female flowers on young slash pine. J. Forestry 55:827-831.
Kawano, S., and J . Masuda. 1980. The productive and reproductive biology of flowering plants. VII . Resource allocation and reproductive capacity in wild populations of Heloniopsis orientalis (Thunb.) C. Tanaka (Liliaceae). Oecologia 45:307-317 .
Lee, T. D., and F. A. Bazzaz. 1980. Effects of defoliation and competition on growth and reproduction in the annual plant Abutilon theophrasti. J. Ecology 68:813-821.
---, and ---. 1982. Regulation offruit and seed action in an annual legume, Cassiafasciculata. Ecology 63:1363-1373.
Lewis, H., and M. E. Lewis. 1955. The genus Clarkia. Univ. Calif. Pub!. Bot. 20:241-392. Li, C. C. 1986. Path analysis-a primer. Boxwood Press. Pacific Grove, Ca. (Fourth Printing) 347 p. Lloyd, D. G. 1984. Gender allocations in outcrossing co sexual plants, pp. 277-300. In R. Dirzo and
J. Sarukhan [eds.], Perspectives on plant population ecology. Sinauer Associates, Inc. Sunderland, Mass.
Machlis, L., and J. B. Torrey. 1956. Plants in action: A laboratory manual of plant physiology. W. H. Freeman Co., San Francisco.
Marshall, D. L., D. A. Levin, and N. L. Fowler. 1986. Plasticity of yield components in response to stress in Sesbania macrocarpa and Sesbania vesica ria (Leguminosae). Amer. Naturalist 127: 508-521.
Maynard, D. N. , W. H. Lachman, R. M. Check, and H. F. Vernel!. 1962. The influence of nitrogen levels on flowering and frui! set of peppers. Proc. Amer. Soc. Hort. Sci. 81 :385-389.
Mazer, Susan J . 1987. Parental effects on seed development and seed yield in Raphanus raphanistrum: implications for natural and sexual selection. Evolution 41 :355-371.
Mergen, F. , and G. K. Voigt. 1960. Effects offertilizer applications on two generations of slash pine. Proc. Soil Sci. Soc. Amer. 24:407-409.
Myerscough, P. J ., and J . K. Marshall . 1973. Population dynamics of Arabidopsis thaliana (L.) Heynh. strain 'estland' at different densities and nutrient levels. New Phyto!. 72:595-617.

618 ALISO
Parrish, J. A. D., and. F. A. Bazzaz. 1982. Responses of plants from three successional communities to a nutrient gradient. J. Ecology 70:233-248.
Primack, R. B. 1978. Regulation of seed yield in Plantago. J. Ecology 66:835-847. Pritts, M. P. , and J. F. Hancock. 1985. Lifetime biomass partitioning and yield component rela
tionships in the highbush blueberry, Vaccinium corymbosum L. (Ericaceae). Amer. 1. Bot. 72: 446-452.
SAS. 1985. User's guide: statistics version 5 edition. SAS Institute Inc., Cary, N.C 950 p. Sass, J. E. 1951. Botanical microtechnique. Iowa State College Press, Ames. Smith-Huerta, Nancy L. , and F. C Vasek. 1984. Pollen longevity and stigma pre-emption in Clarkia.
Amer. J. Bot. 71: 1183-1191. ---, and ---. 1987. Effects of environmental stress on components of reproduction in Clarkia
unguiculata. Amer. J. Bot. 74: 1-8. Steel, R . G. D., and J. H. Torrie. 1980. Principles and practices of statistics. 2nd ed. McGraw-Hili
Book Co., New York. 633 p. Steinbrenner, E. C , J. W. Duffield, and R. K. Campbell. 1960. Increased cone production of young
Douglas-fir following nitrogen and phosphorus fertilization. J. Forestry 58:105-110. Stephenson, A. G., and R. I. Bertin . 1983. Male competition, female choice, and sexual selection in
plants, pp. 109-149. In L. Real [ed.], Pollination biology. Academic Press, Orlando, Fla. Thompson, K., and A. J. A. Stewart. 1981. The measurement and meaning of reproductive effort
in plants. Amer. Naturalist 117:205-21 t. Van Andel, J., and F. Vera. 1977. Reproductive allocation in Senecio sylvaticus and Chamaenerion
angustifolium in relation to mineral nutrition. J. Ecol. 65:747-758. Vasek, F. C 1964. The evolution of Clarkia unguiculata derivatives adapted to relatively xeric
environments. Evolution 18:26-42. ---. 1965. Outcrossing in natural populations. II. Clarkia unguiculata. Evolution 19: 152-156. ---. 1977. Phenotypic variation and adaptation in Clarkia, section Phaeostoma. Syst. Bot. 2:
251-279. ---. 1986. Evolutionary modification in Clarkia. 1. Selection for hairlessness. Amer. J. Bot. 73:
517-523. --, and R. H. Sauer. 1971. Seasonal progression of flowering in Clarkia. Ecology 52: 1038-1045. Wahua, T. A. T., and D. A. Miller. 1978. Relative yield totals and yield components of inter cropped
sorghum and soybeans. Agron. J. 70:287-291. Willson, M. F., and N. Burley. 1983. Mate choice in plants. Princeton University Press, Princeton,
N.J. 251 p. ---, and P. W. Price. 1980. Resource limitation of fruit and seed predation in some Asclepias
species. Can. J. Bot. 58:2229-2233.