Embed Size (px)
Citation preview

EFFECTS OF IMPURITIES ON GEOLOGICAL STORAGE OF CO2 Report: 2011/04
June 2011

INTERNATIONAL ENERGY AGENCY
The International Energy Agency (IEA) was established in 1974 within the framework of the Organisation for Economic Co-operation and Development (OECD) to implement an international energy programme. The IEA fosters co-operation amongst its 28 member countries and the European Commission, and with the other countries, in order to increase energy security by improved efficiency of energy use, development of alternative energy sources and research, development and demonstration on matters of energy supply and use. This is achieved through a series of collaborative activities, organised under more than 40 Implementing Agreements. These agreements cover more than 200 individual items of research, development and demonstration. IEAGHG is one of these Implementing Agreements.
DISCLAIMER
This report was prepared as an account of the work sponsored by IEAGHG. This report was wholly funded by the Global CCS Institute. The views and opinions of the authors expressed herein do not necessarily reflect those of the IEAGHG, its members, the International Energy Agency, the organisations listed below, nor any employee or persons acting on behalf of any of them. In addition, none of these make any warranty, express or implied, assumes any liability or responsibility for the accuracy, completeness or usefulness of any information, apparatus, product of process disclosed or represents that its use would not infringe privately owned rights, including any parties intellectual property rights. Reference herein to any commercial product, process, service or trade name, trade mark or manufacturer does not necessarily constitute or imply any endorsement, recommendation or any favouring of such products. This document is also published on the Global CCS Institute's website in the interest of information exchange. The Global CCS Institute does not give any representation or warranty as to the reliability, accuracy or completeness of the information, nor does it accept any responsibility arising in any way (including by negligence) for errors in, or omissions from, the information. Any express or implied views contained in this document do not necessarily reflect the views of the Global CCS Institute nor indicate a commitment to a particular course of action.
COPYRIGHT
Copyright © IEA Environmental Projects Ltd. (IEAGHG) 2011. All rights reserved.

ACKNOWLEDGEMENTS AND CITATIONS This report describes research sponsored by IEAGHG and wholly funded by the Global CCS Institute. This report was prepared by: • CanmetENERGY, Natural Resources Canada The principal researchers were:
• Jinsheng Wang • David Ryan • Edward J. Anthony • Andrew Wigston
To ensure the quality and technical integrity of the research undertaken by IEAGHG each study is managed by an appointed IEAGHG manager. The report is also reviewed by a panel of independent technical experts before its release. The IEAGHG manager for this report was:
• Neil Wildgust The expert reviewers for this report were:
• Dr Todd Schaef, PNNL • Brian Moffatt, BG Group • Marc Parmentier, BRGM • Stanley Santos, IEAGHG • Ziqiu Xue, RITE • Yann Le Gallo, Geogreen • Franz May, BGR • Linda Stalker, CSIRO • Lingli Wei, Shell • Malcolm Wilson, PTRC
The report should be cited in literature as follows: ‘IEAGHG, “Effects of Impurities on Geological Storage of CO2”, 2011/04, June, 2011.’ Further information or copies of the report can be obtained by contacting IEAGHG at: IEAGHG, Orchard Business Centre, Stoke Orchard, Cheltenham, GLOS., GL52 7RZ, UK Tel: +44 (0)1242 680753 Fax: +44 (0)1242 680758 E-mail: @ieaghg.org Internet: .ieaghg.org

EFFECTS OF IMPURITIES ON GEOLOGICAL STORAGE OF CARBON DIOXIDE
Background to the Study
Geological storage of CO2 as a means to mitigate global warming would entail capture of CO2 from a range of point source industrial emissions. Capture technology represents the major cost element of the CCS chain and the required purity of CO2 can have a major bearing on actual capture costs. Impurities in the CO2 stream have the potential to affect the efficiency and safety of transport and storage systems, for example through increased risks associated with corrosion, or changes in the phase behaviour of the CO2 stream.
The presence of impurities is likely to have a significant effect on the phase behaviour or CO2 streams, with implications for the design and operation of pipelines and injection wells. The presence of impurities could also pose a significant threat of increased corrosion of pipeline and well materials.
The presence of impurities in the CO2 stream may have an effect on all types of geological storage scenarios, especially in terms of changes in storage capacity and injectivity due to changes in phase behaviour with respect to pure CO2. In addition, impurities could have a significant effect on injectivity through geochemical reactions in the vicinity of injection wells. Geochemical effects such as dissolution of CO2 and reactions with minerals may determine the long term fate of injected CO2, especially CO2 injected into deep saline formations; and thus the effects of impurities on geochemistry may affect the risk profile of storage sites, as geochemical reactions are widely seen as a key mechanism for the stabilisation of pressure and brine displacement. Geochemical reactions also have the potential to affect the integrity of caprock sequences above storage complexes.
IEA GHG Report PH/4-32 (2004) looked at the maximum level of impurities which might be expected in captured CO2 from a wide range of fuels and from a selection of the contending capture processes; there has been a considerable advance since in the understanding of purity in CO2 captured using oxy-combustion processes. It is now unlikely that SO2 and NOx would be co-captured with CO2 for transport and storage at the levels previously suggested of 0.5 – 3%.
Natural Resources Canada, were commissioned by IEAGHG and GCCSI in 2009 to undertake a study, aiming to provide an overview of the effects of impurities on storage, with key issues and limiting factors highlighted. The study will also aim to identify the current state of knowledge and/or gaps and recommend further research priorities on these topics.
Scope of Work
This study provides a review of existing information and published research on the potential impact of CO2 waste stream purity on storage engineering and associated costs. A range of

storage scenarios are considered including deep saline formations (DSF), depleted gas fields and CO2-EOR schemes, although the study focuses primarily on DSF since this scenario has the largest theoretical storage capacity and the most significant potential for complex geochemical reactions.
Other geological storage scenarios, such as coal beds and basalts are not considered by this study.
Particular aspects considered include:
• The potential effects of impurities on phase behaviour and storage capacity calculations,
• Effects on the rates of geochemical reactions with both formation and caprock and associated buoyant forces and trapping mechanisms,
• Potential effects on injectivity, reservoir permeability and caprock integrity both near well-bore and deeper in the formation,
• Potential for corrosion of well components and estimated impact on system reliability if not mitigated.
The findings of the literature and research review, combined with use of engineering judgement, are used to identify key issues, uncertainties and knowledge gaps. The results of the study may contribute to development of risk assessment methodologies for CO2 storage and relevant sections of ‘best practice’ manuals.
NRCan was asked to refer to the following recent or ongoing IEAGHG reports/studies relevant to this study, to avoid obvious duplication of effort and to ensure that the reports issued by the programme provide a reasonably coherent output:
• Development Issues for Saline Aquifer Storage, CO2CRC, Report 2008/12. • Storage Capacity Coefficients, EERC, 2009/13. • Safety in CO2 Capture Transport and Storage, UK HSL Laboratory, 2009/06 • Well Abandonment Practices, TNO, final report due July 2009/08 • Impact of impurities on CO2 capture, transport and storage Ph4-32 Aug 2004 • Injection Strategies for Storage Sites, CO2CRC, 2010/04. • Pressurisation and Brine Displacement issues for Deep Saline Formation CO2
Storage, Permedia, 2010/15 • Potential Impacts on Groundwater Resources, CO2GeoNet, project commenced
March 2010
Findings of the Study
Data from the COORETEC study (Kather et al, 2009) was used to define expected impurities from each combustion process (Table 1)
Impurities from an oxyfuel combustion power plant could be subdivided into three classes namely: bulk or major non-CO2 components which consisting of (numbers are usually greater

than 0.5%):- N2, Ar, O2, H2O, and may be further classified as condensable and non-condensable components; minor impurities consisting of (numbers are usually in ppm level but less than 0.5%): SO2, SO3, NO, NO2, N2O (usually from oxy-CFB boiler), CO, and particulate matters; and micro-impurities which consists of the HCl, HF, Hg and other heavy metals.
For any oxyfuel combustion power plant with CO2 capture, there are three possible scenarios with regard to the level of CO2 purity namely:
• Scenario 01 – low purity option (CO2 purity between 85% - 90%) • Scenario 02 – medium purity option (CO2 purity between 95% - 97%) • Scenario 03 – high purity option (CO2 purity greater than 99%).
Table 1 Composition of CO2 Streams
Component Pre-combustion Post-combustion Oxyfuel
Selexol Rectisol Comp.1 Comp.2 Comp.3 Comp.1 Comp.2 Comp.3
CO2 (vol %) 97.95 99.7 99.93 99.92 99.81 85.0 98.0 99.94
O2 (vol %) - - 0.015 0.015 0.03 4.70 0.67 0.01
N2 (vol %) 0.9 0.21 0.045* 0.045* 0.09* 5.80 0.71 0.01
Ar (vol %) 0.03 0.15 4.47 0.59 0.01
H2O (ppm) 600 10 100 100 600 100 100 100
NOx (ppm) - - 20 20 20 100 100 100
SO2 (ppm) - - 10† 10† 20† 50 50 50
SO3 (ppm) - - 20 20 20
CO (ppm) 400 400 10 10 20 50 50 50
H2S+COS (ppm) 100 100 - - - - - -
H2 1 vol% 20 ppm - - - - - -
CH4 (ppm) 100 100 - - - - - -
NH3 (ppm) - - - 50 - - - -
CH3OH (ppm) - 200 - - - - - -
*Total concentration of N2 + Ar †Total concentration of SO2 + SO3
Potential effects of impurities on geological storage of CO2 can be divided into chemical and physical processes.

Physical Effects
Physical effects are those caused by the changes in physical properties with respect to pure CO2, such as changes in phase and density. Density changes, mostly due to the presence of non-condensable impurities which cannot be liquefied at ambient temperature such as N2, O2 and Ar, can affect storage capacity, injectivity and buoyancy.
Phase Behaviour
To determine the phase behaviour of various mixtures of impurities compared to pure CO2, the Peng-Robinson equation of state was used. The non-condensable impurities have the effect of increasing the bubble-point pressure and decreasing the critical temperature, due to their low critical temperatures. The stream with the greatest effect compared to pure CO2 is the high impurity oxyfuel stream, as can be seen in figure 1. The horizontal line at 10MPa shows the minimum pressure needed to avoid two phase flow at all temperatures.
Figure 1 Calculated Phase diagram comparing pure CO2 and Oxyfuel composition 1
0
2
4
6
8
10
12
275 280 285 290 295 300 305
T, K
p, M
Pa
Oxyfuel 1
The impacts of changed phase behaviour on pipeline transport for transportation in the supercritical phase are that a higher pressure would be needed to avoid two phase flow. If transportation is in the liquid phase then the lower critical temperature would require a lower pipeline temperature, which could necessitate better insulation or cooling. Also note there are no experimental data using impure mixtures of CO2 to calibrate parameter values for the equations of state. Effects on Storage Capacity
Non-condensable impurities may potentially cause reduction of capacity firstly by replacement of CO2, but also by reducing the density as they do not compress to as great a degree as CO2. This study proposes that the storage capacity can be quantified by the following equation:

)/1( 200 COi
i mmMM
∑+=ρ
ρ
where M and M0 denote the mass of CO2 in the mixture and in the pure stream respectively, which occupy the same volume. ρ and 0ρ are the density of the mixture and the pure stream, and mi/mCO2 is the ratio of the mass of impurity i to the mass of CO2 in the mixture. The ratio M /M0 on the left hand side of this relation can also be viewed as the ratio of the mass of CO2 per unit volume in the mixture to that in the pure state and represents a normalised storage capacity for CO2 in its supercritical phase, i.e. the capacity for structural trapping of CO2.
Therefore the high impurity streams can expect to reduce the storage capacity by a greater amount, though the degree to which the capacity differs compared to pure CO2 is dependent on pressure and temperature. The effect of pressure at a constant temperature of 330K (58˚C) can be seen in Figure 2. The largest effect is when the high impurity oxyfuel stream is used. The results for this are similar to those of 15% Ar, i.e. when all light impurities are represented by Ar and calculations show that when assessing the physical effects Ar can be used to represent all light impurities.
Figure 2 Normalised capacity for various impurity streams
0
0.2
0.4
0.6
0.8
1
1.2
0 5 10 15 20 25 30
Pressure, MPa
Nor
mal
ized
cap
acity
, -
1%H2+0.9%N2+others
2%N2+3%O2
5% Ar
5.8N2/4.7O2/4.47Ar+others
15% Ar
Pure CO2
For all mixtures of supercritical CO2 and non-condensable gases, there is a maximum decrease of the storage capacity at a certain pressure under a given temperature. An increasing temperature will shift this maximum decrease to a higher pressure and its magnitude decreases. A range of storage conditions were considered to assess the potential impacts of a high impurity stream (15% non-condensables) on the storage capacity (Table 2). This range of

representative cases was taken from a previous IEAGHG study on establishing storage coefficients for DSF (2009/13).
The storage coefficient is defined as
22
2
COCO
CO
VG
Eρ
=
where GCO2 is the estimate of storage capacity in terms of CO2 mass and VCO2 is the total pore space available for CO2 storage. An impurity factor F is introduced for estimation of the storage capacity for impure CO2:
EFVG COCOCO 222 ρ=
Numerically F is equal to the normalised storage capacity defined earlier.
Table 2 Effect of impurities on CO2 storage capacity
Cases Depth (m)
P (MPa)
T
(°C)
T grad
(°C/m)
Ea
(-)
Storage Capacity
Fb
(-) Pure Impure
Shallow-Low Temp 895 9.2 33 0.020 0.07 647.68 253.96 0.392
Shallow-Mid Temp 895 9.2 38 0.025 0.10 540.97 231.20 0.427
Shallow-High Temp 895 9.2 45 0.033 0.09 364.48 208.72 0.573
Median-Low Temp 2338 24 62 0.020 0.12 750.04 550.35 0.734
Median-Mid Temp 2338 24 75 0.025 0.13 675.00 493.67 0.731
Median-High Temp 2338 24 92 0.033 0.13 584.92 432.23 0.739
Deep-Low Temp 3802 38.8 92 0.020 0.15 777.66 611.13 0.786
Deep-Mid Temp 3802 38.8 113 0.025 0.16 700.29 551.25 0.787
Deep-High Temp 3802 38.8 141 0.033 0.17 611.35 485.19 0.794 a Storage coefficient. b Capacity factor given as the ratio of the CO2 storage capacity in the presence of impurities to that in the absence of impurities.
This shows the greatest effect from a high impurity stream of 15% non-condensables could potentially be a reduced capacity of around 40% at pressures and temperatures found in relatively shallow, low temperature CO2 storage reservoirs. As the depth of the formations increase, the effect of impurities on CO2 storage capacity decreases; at a depth of 3800 m, the capacity approaches 80% of that for pure CO2.

Effects on Injectivity
The presence of these impurities have a potential effect on injectivity, as a decrease in density will decrease mass flux over the same pressure drop, however, the addition of impurities will also cause a decrease in viscosity, which would increase the mass flux. A normalised permeation flux can be demonstrated by the following equation:
)/1()/(
00
0
0
2
mmM
M
ii
CO
∑+=•
•
ρµµρ
Where •
M CO2 and •
M are the mass flow per unit area for CO2 in the mixture and in its pure state, ρ ρ 0 are the densities of the injected stream and that of pure CO2 and µ and µ 0 are the viscosities of the injected fluid and that of pure CO2.
Both viscosity and density will be determined by the temperature and pressure, though it should be noted that there is not experimental data to validate the viscosity calculations. With 15% impurities, the injectivity could be reduced by 15% at lower pressures (50-70 bar), but is likely to increase to the same as pure CO2 as the pressure increases to around 20MPa. Table 3 shows, the effect of injectivity over the same range of scenarios used to examine storage capacity. It is clear the effect on injectivity is much less, though has the potential to be significant under certain circumstances
Table 3 Effect of impurities on CO2 injectivity
Cases Depth (m)
P (MPa)
T
(°C)
T grad
(°C/m)
Viscositya
(-)
Injectivityb
(-)
Shallow-Low Temp 895 9.2 33 0.020 0.38 1.0
Shallow-Mid Temp 895 9.2 38 0.025 0.45 0.94
Shallow-High Temp 895 9.2 45 0.033 0.77 0.74
Median-Low Temp 2338 24 62 0.020 0.72 1.0
Median-Mid Temp 2338 24 75 0.025 0.75 0.98
Median-High Temp 2338 24 92 0.033 0.79 0.93
Deep-Low Temp 3802 38.8 92 0.020 0.81 0.97
Deep-Mid Temp 3802 38.8 113 0.025 0.83 0.95
Deep-High Temp 3802 38.8 141 0.033 0.87 0.91 a Relative viscosity given as the ratio of the viscosity in the presence of impurities to that in the absence of impurities. b Relative injectivity given as the ratio of the injectivity in the presence of impurities to that in the absence of impurities.

Effects on Buoyancy
Decreased density is also likely to cause an increase in buoyancy of the plume. If changes in relative permeability and capillary pressure are neglected, normalised buoyancy can be given as:
22
2
0 COOH
mOH
FF
ρρρρ
−−
=
where F and F0 are buoyancy forces for the CO2 mixture and pure CO2 respectively, ρH20, ρm, and ρCO2 are the densities of the formation water, plume and pure CO2 respectively.
The greater density difference, the greater buoyancy and consequently rising velocity, which can be given as:
)/()/(
0000 µρρµ
FF
vv=
For the case of 15% light impurities, buoyancy can be increased by up to 50%, depending on the temperature and pressure, which could in turn increase the rising velocity of an injected CO2 plume in the reservoir by up to three times. This would have the potential to reduce residual trapping and increase lateral spreading of the plume at the caprock, though this is subject to reservoir heterogeneity as this effect might be more pronounced in relatively uniform formations.
Chemical Effects
When looking at the chemical effects on rocks and wellbore cements, the most significant species are SOx, NOx and H2S.
Effects on capacity and injectivity
NOx catalyses the oxidation of SO2 to form sulphuric acid, which lowers the pH and may then cause mineral dissolution and precipitation of sulphates. With fast dissolving and precipitating species, such as calcite and calcium sulphate, porosity can be affected and a decrease in porosity could potentially affect the capacity and injectivity. The rate of precipitation of CaSO4 is quantified based on the concentration of calcium and sulphate ions, though also to be taken into account is the dry-out zone. Previous simulations have assumed that SO2 is injected as an aqueous solution or that the injection zone is wet. When supercritical CO2 is injected into the formation it displaces in-situ waters creating a dry-out zone and any dissolution and precipitation is assumed to take place at the front of the plume and a two phase flow region, but ceases once the dry-out front arrives. This decreases the impact on rock porosity and injectivity that could otherwise take place.
Simulations were carried out in the study for calcite dissolution and calcium sulphate precipitation and for an injection stream with 2.9% SO2; the maximum porosity decrease would be 0.44%, which is much less significant then when compared to the wet case.

Simulations were carried out for other minerals all with porosity decreases much lower than the equivalent wet cases, however, for alunite, the associated volume changes is 5.6%, which could be considered significant.
Injection of H2S has taken place during acid gas injection projects for many years with no serious effects, but there could be issues if it is injected in conjunction with SO2, which could result in deposition of elemental sulphur causing severe pore blocking. This could be an issue if streams from pre-combustion and post-combustion sources were to be injected at the same storage site.
Effects on Caprocks
Potential chemical effects on caprock integrity over the long term are dissolution of both carbonate and aluminosilicate rocks, due to the presence of SOx and NOx which can form sulphuric and nitric acid. Thermochemical evaluations show that for 1.5% concentration of SOx and NOx, dissolution can increase by 50%, however, for CO2 streams considered in this study SOx and NOx concentrations are within 200 ppm, for which the impact on the dissolution of the rocks is likely to be insignificant.
The effect of O2 is mainly related to oxidation of SOx and NOx, but can react with certain minerals on its own, for example it can react with pyrite to form iron sulphate which is soluble, resulting in acidic pockets which can cause dissolution of the rock. To have a significant effect this would require a relatively large amount of O2 which has not been consumed by oxidation of metallic minerals and/ or retained in the residual CO2 phase, which is likely due to its low solubility.
Effect on Well Materials
Well materials may be affected after injection is terminated as there would be a return of water containing acidic impurities. Results of thermochemical calculations suggest that the effect of acid impurities on dissolution of cement constituents may be more significant than on dissolution of rocks. If protection from the cement sheaths is lost, the steel casings could also be attacked. Appropriate measures may be required for countering adverse effects, such as improving cement and casing quality prior to sealing wells.
Expert Review Comments
Expert comments were received from 10 reviewers, representing industry (corporate sponsors of IEAGHG) and academia. The feedback was constructive and supportive of the work that had been carried out. There was comment that the paper adds importantly to the literature in presenting the issue of physical impacts of impurities on capacity.
Key technical suggestions made by reviewers included reviewing the effects impurities on interfacial tension and capillary pressures and the potential impact on caprocks of the water dissolution in supercritical CO2. These comments were addressed in the final report.

There were comments that current procedures for monitoring which include analyses of He, H and in others Ar is measured (e.g. Otway and Frio), were not referenced, but this topic will be covered fully in another IEAGHG Study – Feasibility of Monitoring techniques for substances mobilised by CO2. There was also a comment that there could be further work carried out analysing reaction rates and kinetics.
Conclusions
In the studied scenarios of impure CO2 streams where O2, N2 and Ar have the highest levels, the greatest impact of impurities is physical, i.e., reducing storage efficiency and injectivity.
The most significant effect is the reduction of storage capacity. It has been shown that the non-condensable impurities cause reduction of CO2 capacity by a degree greater than their molar fractions when the temperature is not high above the critical temperature of CO2. Particularly, there is a maximum reduction of the storage capacity in a certain pressure range, where the capacity can drop to below 40 % for the 15% light impurities case compared with that of pure CO2. The injectivity of impure CO2 streams reduces as a result of lower density. However, due to the compensation by increased viscosity the reduction of injectivity is smaller than that of storage capacity. In the studied scenarios using the 15% light impurities case, the average reduction of injectivity is 6%, with the largest reduction 26%. The higher buoyancy of impure CO2 streams will reduce the efficiency of CO2 dissolution in formation water and CO2 trapping in rock pores, and thus has the potential reduce the security of CO2 storage in the near to medium terms.
With regard to chemical effects on rocks, the most significant species are SOx, NOx and H2S. NOx can catalyze the oxidation of SO2 to sulphuric acid. The impact of SO2 on reduction of rock porosity and injectivity appears much smaller than previously thought, because its contact with water is limited with the development of the dry-out zone. NOx will also promote dissolution of minerals, but will not cause precipitation and therefore reduction of rock porosity. H2S on its own has not been found to reduce the injectivity in acid gas injection operations and computer simulations. However, if H2S and SO2 are co-injected, deposition of elemental sulphur, in the pores over the whole injection period can be a serious concern.
For evaluation of chemical effects on caprock integrity, thermochemical calculations show that SOx and NOx increase dissolution of carbonate rocks and aluminosilicate rocks. However, for CO2 streams considered in this study where SOx and NOx concentrations are within 200 ppm, the impact on the dissolution of the rocks is insignificant.
Corrosion of injection well materials may not be serious when the CO2 stream is dry, due to desiccation of the well zone in the injection period. However, after termination of injection and return of water, corrosion by the acidic impurities could be an issue of concern.
The results of the study have implications on site selection for different CO2 streams, i.e. a relatively shallow storage site may be appropriate for a low impurity stream, whereas a high impurity stream may reduce the storage capacity by a significant amount. There are also

implications for designing pipeline systems, for multiple CO2 streams and mixing of the streams.
Recommendations
The literature on the effects of impurities on the geological storage of CO2 is currently limited and the some of the theoretical effects examined in the study cannot yet be verified by experimental data. It is important that IEAGHG keeps updated on further experimental work which would be able to verify the effects.
The outcome of this study may have implications on site selection for different impure streams of CO2 and injection of different streams into the same storage site.
IEAGHG should ensure that adequate attention is paid to these topics through future storage network meetings and by the study programme.

1
Effects of Impurities on Geological Storage of Carbon Dioxide
Jinsheng Wang, David Ryan, Edward J. Anthony, Andrew Wigston
Final version
April 2011
CanmetENERGY, Natural Resources Canada 1 Haanel Drive,
Ottawa, Ontario, Canada K1A 1M1
Prepared for the IEA Greenhouse Gas R&D Programme
The Orchard Business Centre Stoke Orchard, Cheltenham
Gloucestershire, United Kingdom
under Contract IEA/CON/09/172

i
Executive Summary
Carbon capture and storage (CCS) is one of the major transformative technologies identified worldwide for reducing atmospheric CO2 emissions and this technology is particularly applicable where large CO2 emitters are located and a large potential for CO2 storage exists. Since CO2 originates from a variety of sources, such as coal-fired power plants, refineries, bitumen upgraders, gas plants, steel and cement plants, the CO2 stream contains various impurities, such as N2, O2, Ar, SOx, NOx, H2S, H2, etc., in various concentrations. A requirement on purity of the effluent CO2 stream will greatly increase the cost of capture, and may eliminate from choice some of the more cost-effective capture processes that are not capable of achieving high purity. However, impurities in the injected CO2 may affect the efficiency and safety of CO2 storage in underground formations in various ways, such as decreasing storage capacity and CO2 injectivity, and reducing storage integrity through chemical reactions.
Natural Resources Canada (NRCan) has been leading Canada’s federal CCS programs. Along with a range of R&D projects for capturing CO2 from coal-fired power plants and other sources, NRCan has also conducted studies on the injection of CO2 in underground reservoirs, data and information acquisition, geological, geophysical and geochemical assessments, and reservoir model simulations. The effects of impurities on transport, injection and storage of captured CO2 are of vital importance to successful implementation of Canada’s CCS research strategies for now and in the future.
In this context we have undertaken a study on evaluation of the effects of impurities on CO2 transport, injection and storage, sponsored by the International Energy Agency Greenhouse Gas R&D Programme (IEA GHG). The IEA GHG’s objectives of this study are:
• To provide a review of existing information and published research on the potential impact of CO2 stream purity on storage reservoir and caprock performance and associated engineering costs;
• To provide a high level overview of available knowledge. The focus is on storage of impure CO2 in deep saline formations, since this scenario has the largest theoretical storage capacity and the most significant potential for complex geochemical reactions, although depleted gas fields and CO2-EOR are also relevant.
Particular aspects to be considered include:
• The potential effects of impurities on phase behaviour and storage capacity calculations;
• Effects on the rates of geochemical reactions with both formation and caprocks, and the impacts on injectivity, reservoir permeability and caprock integrity.

ii
• Effects on buoyancy forces and trapping mechanisms;
• Potential for corrosion of well components and estimated impact on system reliability if not mitigated.
The literature related to the effects of impurities is scarce, and mainly concerns transport of impure CO2 by pipeline. The rest of the literature reports limited simulation work on co-injection of H2S and SO2 with CO2, where the important desiccation effect near the injection zone is not taken into account, and the coexistence of NOx, which could significantly affect the behaviour of SO2, has not been considered. Accordingly, for the major part of the above issues there is little or no information available. Combined with NRCan’s own research efforts on CO2 capture and storage in Canada, we have carried out extensive investigations by ourselves. Through our work, all aspects specified by IEA GHG have been addressed. Significant achievements and findings are:
1. The measure of storage capacity for impure CO2 and the impact of the impurities have been established. With a simple formula proposed in this work, normalized CO2 storage capacity can be calculated for any CO2 mixtures, and the impact of the impurities can be clearly seen.
2. Non-condensable impurities which cannot be liquefied at ambient temperature, such as N2, O2 and Ar, result in significant decrease in CO2 storage capacity. The degree of decrease in the capacity is a function of pressure, temperature, and composition.
3. For all mixtures of supercritical CO2 and non-condensable gases, there is a maximum decrease of the storage capacity at given temperature. This pressure corresponding to the maximum decrease changes with temperature.
4. In contrast to non-condensable gases, impurities which are more easily condensable than CO2, such as SO2, could increase the storage capacity, and there is a maximum increase at a certain pressure.
5. For a supercritical CO2 stream with high levels of N2, O2 and Ar, which are common impurities from oxyfuel combustion, the volume and density may be determined by the use of Ar to represent all impurities, computationally and/or experimentally.
6. The change of density caused by non-condensable gas impurities results in lower injectivity of impure CO2 into geological formations. Above a threshold pressure range the injectivity could reach the level of pure CO2 due to lowered viscosity. However, more condensable impurities like SO2 may have an effect of increasing the injectivity, through increasing density of the CO2 stream.
7. Non-condensable gas impurities increase the buoyancy of the CO2 plume. This would decrease the sweep efficiency of injected CO2. As a result, the efficiency of solubility trapping and residual trapping of CO2 would decrease.
8. A formula has been developed to enable quick determination of the effect of SOx on CO2 injectivity through precipitation of sulphates, which reduces rock porosity, an issue of substantial concern. With this formula, the degree of the porosity reduction could be directly predicted from the SOx content of the injected CO2.

iii
9. Among reactive impurity species, SOx, H2S and NOx would have the greatest chemical effects on the rocks. Based on our analysis, the effect of SOx on reduction of rock porosity and injectivity would be much smaller than commonly thought. However, if H2S and SOx are co-injected, such as in the case where CO2 streams from pre-combustion capture and oxyfuel combustion are merged, deposition of elemental sulphur in the pore space could be a concern for pore plugging and hence injectivity reduction.
10. The potential of corrosion of injection well materials has been assessed. The corrosion would be lower if the CO2 stream is dry, due to desiccation of the well zone during the injection period. However, after termination of injection the acidic impurities would promote the corrosion of cements in the presence of water. CO2 containing SOx, NOx and O2 impurities would be more corrosive to cements and steels than pure CO2 or CO2/H2S mixtures.
In addition to the above, phase envelopes for various impure CO2 streams have been calculated, and issues related to calculations analyzed. The impacts of the impurities on pipelines and injection wells, due to changed critical temperature and liquefaction pressure, are discussed.
Moreover, the fate of hazardous impurities in the subsurface has been assessed. The impurities of major concern, including CO, SOx, H2S, NOx and Hg, would eventually form dissolved and/or precipitated species. In the event of CO2 leakage, these dissolved hazardous impurities may be released. The harmfulness of these impurities, however, will likely be overshadowed by that of the leaked CO2, which is hazardous by itself at high concentrations, if breathed in for prolonged periods.
It should be emphasized that the existing literature does not currently provide solutions to the problems that will be inevitably encountered in CO2 storage operations. None of the above issues have been addressed in the previous IEA GHG report (PH4/32) on impurity effects, and most of them have not been investigated elsewhere either. The results obtained from the present work are expected to have important applications or implications to all CO2 storage operations, as illustrated in discussions for selected scenarios.

iv
Contents Executive Summary............................................................................................................i
1. Background.....................................................................................................................1
1.1. Scope of the Current Study.....................................................................................1
1.2. Previous and Ongoing Studies................................................................................3
2. Physical Effects of the Impurities...................................................................................6
2.1. Phase Behaviour and the Impacts...........................................................................6
2.2. Storage Capacity...................................................................................................14
2.2.1. Density of Supercritical CO2 Stream with Impurities...................................14
2.2.2. Quantifying the Effect of Impurities on CO2 Storage Capacity....................15
2.2.3. The Minimum in the Storage Capacity of CO2 with Non-condensable
Impurities.......................................................................................................17
2.2.4. A Maximum of Storage Capacity for CO2 with SO2.....................................19
2.2.5. Impact of the Minimum CO2 storage Capacity..............................................20
2.2.6. Residual Trapping and Interfacial Tension....................................................22
2.2.7. Using Ar to Represent Non-condensable Impurities in Oxyfuel CO2
Streams...........................................................................................................25
2.3. Permeation Flux.....................................................................................................28
2.4. Buoyancy and Rising Velocity..............................................................................30
2.5. Dissolution of CO2 Mixtures in Formation Water.................................................32
3. Chemical Effects............................................................................................................33
3.1. Impact of Reactive Impurities on Injectivity of CO2.............................................33
3.1.1. Formation of Sulphuric Acid from SO2 and the Roles of O2 and NOx..........34
3.1.2. A Simple Model for Evaluation of the Effect of SOx on Reduction of Pore
Porosity..........................................................................................................35
3.1.3. Reaction of SOx with Rocks in the Dry-out Zone......................................... 39
3.1.4. The Possibility of Pore Plugging by Elemental Sulphur...............................40
3.2. Reactions with Caprocks and Mineral Sequestration of CO2................................41
3.3. Corrosion of Well Materials..................................................................................42
4. Fate of Hazardous Impurities.........................................................................................43
5. EOR and Depleted Gas Fields.......................................................................................44

v
6. Evaluation s of Selected Scenarios................................................................................45
6.1. Storage Capacity and Injectivity under Representative Reservoir Conditions......45
6.2. Storage Integrity.....................................................................................................47
7. Impact of the Impurities on the Cost of CO2 Storage....................................................49
8. Uncertainties and Recommended Studies......................................................................51
8.1. The Accuracy of Equations of State......................................................................51
8.2. Viscosity................................................................................................................51
8.3. Effects on the Reactivity of Supercritical CO2 Phase............................................52
8.4. Potentially Useful Properties of Impurities for Monitoring...................................52
9. Conclusions....................................................................................................................53
Acknowledgment...............................................................................................................55
Notations............................................................................................................................56
References..........................................................................................................................58
Appendix A – Properties of Components in CO2 Streams..............................................A-1
Appendix B – Binary Interaction Constants for Equations of State................................B-1

vi
Figures
Figure 2.1. Calculated phase diagrams for CO2 streams compositions given in Table 1.1. Figure 2.2. Calculated phase diagrams for CO2 mixtures. Figure 2.3. Calculated density for CO2 and CO2 mixtures as a function of pressure at 330 K. Figure 2.4. Normalized CO2 storage capacity at 330 K in terms of Equation 2.5. Figure 2.5. Verification of the existence of a minimum in the normalized density for impure CO2, hence in storage capacity, using literature data given in Table 2.1 Figure 2.6. Normalized storage capacity for CO2 with 2.9 vol % SO2 at 330 K. Figure 2.7. Normalized CO2 storage capacity at different temperatures in terms of Equation 2.5 for the high-impurity CO2 stream (5.8 vol % N2, 4.7 vol % O2, 4.47 vol % Ar and minor amounts of other impurities). Figure 2.8. Interfacial tension (IFT) of CO2 mixtures; a) CO2/N2, b) CO2/CH4. Figure 2.9. Comparison of the volumes of the high-impurity CO2 mixture (5.8% N2 + 4.7% O2 + 4.47% Ar) and the CO2 mixture with 15% Ar at 330 K. Figure 2.10. Calculated viscosity for 330 K. Figure 2.11. Normalized permeation flux for the high-impurity CO2 stream (5.8% N2 + 4.7% O2 + 4.47% Ar) from oxyfuel combustion at 330 K. Figure 2.12. Normalized buoyancy for the high-impurity CO2 stream (5.8% N2 + 4.7% O2 + 4.47% Ar) from oxyfuel combustion at 330 K. Figure 2.13. The effect of low-solubility impurities on CO2 solubility in brine at 330 K. Figure 3.1. Simplified sketch for the movement of injected CO2. Figure 3.2. Sketch for determination of SO2 conversion to CaSO4. Figure 7.1. Impact of impurities on storage cost curve for North America.

vii
Tables
Table 1.1 Composition of CO2 streams
Table 1.2 DYNAMIS recommendation for CO2 quality
Table 2.1 Literature data (Esper et al., 1989) for density of pure CO2 and a mixture of 44.696 mol % CO2 and 55.304 mol % N2 in the supercritical temperature range of CO2
Table 2.2 Normalized CO2 storage capacity for the high-impurity CO2 stream at several subsurface temperatures
Table 2.3 Critical properties of CO2, O2, N2 and Ar
Table 2.4 Comparison of reduced properties for two CO2 mixtures at 330 K
Table 4.1 Fate of reactive impurities according to thermochemical calculations
Table 6.1 Effect of impurities on CO2 storage capacity
Table 6.2 Effect of impurities on CO2 injectivity
Table 6.3 Dissolution of K feldspar and formation of secondary minerals
Table 6.4 Dissolution of calcite and precipitation of anhydrite
Table 6.5 Dissolution of Ca(OH)2 and Ca3Si2O7·3H2O and formation of gypsum

1
1. Background
Carbon capture and storage (CCS) has been identified as a key potential technology in reducing CO2 emissions. The capture process represents the major cost component of CCS. CO2 may be captured by different technologies from various sources, and various gaseous impurities exist in the CO2 stream, such as N2, O2, SOx and H2S. Separation of these impurities would drastically increase the cost of capture and it would be more cost effective to co-inject these impurities with CO2 for underground storage. Moreover, some technologies aim at co-capture and co-sequestration of multiple air pollutants together with CO2. For such technologies the feasibility of co-sequestration is a prerequisite.
However, there are concerns over negative effects of impurities in CO2 streams on the transport, injection and storage of CO2. For instance, non-condensable impurities such as N2 and O2 would increase the saturation pressure of liquid CO2 and decrease the critical temperature. As a result, lower temperature and additional overpressure is required to avoid two-phase flow in pipeline transport of CO2. Non-condensable impurities would also increase the pressure for injection and reduce the capacity of the storage sites by decreasing not only volume fraction but also density of CO2. Moreover, impurities like SOx and NOx will form acids in the presence of water, which may react with caprocks and well components and affect the storage integrity. The fate of hazardous impurities, in particular CO, H2S, SOx and Hg, in the subsurface is of special concern, as the impurities may escape the confinement in the event of CO2 leakage.
Natural Resources Canada (NRCan) has been leading Canada’s federal CCS programs. Along with a range of R&D projects for capturing CO2 from coal-fired power plants and other sources, NRCan is also involved in and collaborating in research endeavours for CO2 storage, including CO2 injection, monitoring, measurement and verification, storage integrity assessment, and capacity estimation. The effects of impurities on transport, injection and storage of captured CO2 are of vital importance to successful implementation of the CCS programs.
In this context NRCan has undertaken the study on evaluation of the effects of impurities on CO2 storage, sponsored by the International Energy Agency Greenhouse Gas R&D Programme (IEA GHG).
1.1 Scope of the Current Study
IEA GHG has sponsored investigations of impurities in CO2 streams. A previous report was issued in 2004 (PH/4-32), where the impacts on storage in saline aquifers were not a focus. The scope of the current study specified by IEA GHG is as follows:
“Review of existing information and published research on the potential impact of CO2 waste stream purity on storage engineering and associated costs; aiming to provide a ‘high level’ overview of available knowledge. A range of storage scenarios may be considered including deep saline formations, depleted gas fields and CO2-EOR schemes,

2
although the study should focus primarily on deep saline storage as this scenario has the largest theoretical storage capacity. Consideration of other geological storage scenarios, such as coal beds and basalts, is not required by this study.
Particular aspects that should be considered include:
• The potential effects of impurities on phase behaviour and storage capacity calculations
• Effects on the rates of geochemical reactions with both formation and caprock and associated buoyancy forces and trapping mechanisms
• Potential effects on injectivity, reservoir permeability and caprock integrity both near the well-bore and deeper in the formation
• Potential for corrosion of well components and estimated impact on system reliability if not mitigated
The findings of the literature and research review, combined with use of engineering judgment should identify key issues, uncertainties and knowledge gaps. The results of the study should be able to contribute to development of risk assessment methodologies for CO2 storage and relevant sections of ‘best practice’ manuals.”
In this study the data on impurity species and their concentration levels have been provided by IEA GHG, based on CO2 quality recommended for evaluation under the COORETEC study for fossil-fueled power plants (Kather, 2009), as shown in Table 1.1. It should be noted that the effects of impurities studied in this work are also expected to be applicable to other CCS scenarios, such as those for oil refineries, iron and steel making, and cement production. Whereas the composition spectra may vary, the types of impurities in the other scenarios would be largely the same, as long as the CO2 is from burning fossil fuels.
A number of relevant physical properties of the major impurities are given in Appendix A. From Table 1.1 it can be seen that the impurities vary with the sources of CO2 streams. Reductive impurities H2, H2S and CH4 are present in pre-combustion streams. Oxide impurities, including nitrogen oxides (NOx) and sulphur oxides (SOx), are present in oxyfuel and post-combustion streams. Hg is not shown in the table but is expected to be present in trace amounts in pre-combustion and post-combustion streams. Air-derived impurities N2, O2 and Ar exist in high levels in oxyfuel combustion streams, which have the highest total impurity levels among the three types of CO2 streams. IEA GHG has considered three scenarios for CO2 purity from oxyfuel combustion streams:
• Scenario 1 – low-purity (CO2 purity between 85 - 90%)
• Scenario 2 – medium-purity (CO2 purity between 95 - 97%)
• Scenario 3 – high-purity (CO2 purity greater than 99%)
where N2, O2 and Ar comprise the major part of the impurities. Clearly, increasing impurity concentrations will have more significant effects on storage, thus the oxyfuel

3
streams are most important for the current study because of their high impurity concentrations.
Table 1.1 Compositions of CO2 streams
Component Pre-combustion Post-combustion Oxyfuel Selexol Rectisol Comp.1 Comp.2 Comp.3 Comp.1 Comp.2 Comp.3
CO2 (vol %) 97.95 99.7 99.93 99.92 99.81 85.0 98.0 99.94 O2 (vol %) - - 0.015 0.015 0.03 4.70 0.67 0.01 N2 (vol %) 0.9 0.21 0.045* 0.045* 0.09* 5.80 0.71 0.01 Ar (vol %) 0.03 0.15 4.47 0.59 0.01 H2O (ppmv) 600 10 100 100 600 100 100 100 NOx (ppmv) - - 20 20 20 100 100 100 SO2 (ppmv) - - 10† 10† 20† 50 50 50 SO3 (ppmv) - - 20 20 20 CO (ppmv) 400 400 10 10 20 50 50 50 H2S+COS(ppmv) 100 100 - - - - - - H2 1 vol% 20 ppm - - - - - - CH4 (ppmv) 100 100 - - - - - - NH3 (ppmv) - - - 50 - - - - CH3OH (ppmv) - 200 - - - - - -
*Total concentration of N2 + Ar †Total concentration of SO2 + SO3
1.2 Previous and Ongoing Studies
Previous studies on the impurities are mostly related to pipeline transport. Seevam et al. (2007) discussed potential impacts of impurities on pipeline transport, focusing on recompression distance, flow assurance, and phase equilibrium. Oosterkamp and Ramsen (2008) gave an overview for offshore pipelines and summarized a number of uncertainties related to impurities, regarding corrosion, degrading of non-steel materials, lack of measurement data, water solubility, modeling, chemical reactions between impurities, and allowable impurity levels for pipeline transport. With respect to the allowable impurity levels, there have been recommendations by the European project DYNAMIS on CO2 quality for transporting of CO2 streams from pre-combustion and post-combustion processes (de Visser et al. 2008; 2009), as summarized in Table 1.2. In this table the considerations for setting the concentration limits are also given, which are based on both technical and safety perspectives from the transport point of view. By comparison with Table 1.1 it can be seen that the impurity levels considered by IEA GHG are within or lower than the limits recommended by DYNAMIS, except for the levels of O2, N2 and Ar from oxyfuel combustion. High levels of O2, N2 and Ar will result in higher energy consumption for compressing CO2 for pipeline transport. However, in most cases the injection pressure will be higher than the liquefaction pressure of impure

4
CO2, and thus the energy related to the additional compression work is not lost. This will be seen in the discussion of typical reservoir conditions.
Table 1.2. DYNAMIS recommendation for CO2 quality (de Visser et al. 2009)
* The concentration limit of all non-condensable gases taken together, including O2, CH4, N2, Ar and H2, should not exceed 4 vol %.
With regard to the subsurface side, acid gas injection, where H2S is injected together with CO2, has been successfully carried out for years (see, e.g., Bachu and Gunter, 2004; Bachu, 2008), and substantial knowledge has been acquired. However, H2S is less reactive than SOx and NOx under the considered conditions, because of its lower acidity
Component Concentration Limitation H2O 500 ppm Technical: below solubility
limit of H2O in CO2. No significant cross effect of H2O and H2S. Cross effect of H2O and CH4 is significant but within limits for water solubility.
H2S 200 ppm Health & safety considerations
CO 2000 ppm Health & safety considerations
O2* Aquifer < 4 vol%, EOR
100 – 1000 ppm Technical: range for EOR, because of lack of practical experiments on effects of O2 underground.
CH4* Aquifer < 4 vol%, EOR <
2 vol % Energy consumption for compression and miscibility pressure for EOR
N2* < 4 vol % (all non-
condensable gases) Energy consumption for compression
Ar* < 4 vol % (all non-condensable gases)
Energy consumption for compression
H2* < 4 vol % (all non-
condensable gases) Further reduction of H2 is recommended because of its energy content
SOx 100 ppm Health & safety considerations
NOx 100 ppm Health & safety considerations
CO2 >95.5% Balanced with other compounds in CO2

5
and low concentration level. Besides, H2S is not present in CO2 streams from oxyfuel combustion, which are most relevant to the present study. Brine acidification by SO2 in injected CO2 has been predicted based on model brine composition (Ellis et al., 2010), where 1% SO2 is predicted to decrease the pH of the brine from 4.6 in the case of CO2 alone to 1 – 2.5, depending on reaction and rate-limiting mechanism. However, the effect of mineral buffering is not included for the prediction. Palandri and Kharaka (2005) presented simulation results for the effect of H2S and SO2 on CO2 sequestration as siderite FeCO3(siderite), through reducing ferric iron in sediments. The conclusion is that, with an excess of sulphur relative to CO2, the iron can be transformed almost entirely into siderite thereby trapping CO2 whereas the sulphur is converted predominantly into H2SO4. The applicability of this study, however, depends on the ferric iron content in the formations. Studies on the effect of H2S and SO2 on CO2 injectivity have been performed by Knauss et al.(2005), Xu et al. (2007), and Bacon et al. (2009), which do not include the impact of desiccation due to injection of dry CO2, and thus are not considered applicable to the scenarios of the present study, as will be discussed later.
Bachu and coworkers (2009 a, b) investigated chromatographic partitioning of impurities under CO2 injection conditions. The results are interesting and have potential applications in monitoring of injected CO2. This will also be discussed later.
de Visser et al. (2009) pointed out that the presence of impurities in the CO2 lowers the density of the CO2 stream, and thus decreases the amount of CO2 stored per unit volume of storage space. As a consequence, the storage efficiency decreases. However, the effect of impurities on the reduction of storage space is not precisely known yet. Such comments arising from the large European program (DYNAMIS) provide evidence of the knowledge status in this field – no quantitative methods for the assessment have been developed yet.
Sass et al.(2009) discussed a number of issues concerning storage of flue gas from oxyfuel combustion, where CO2 content is below 80%, including reduction of storage capacity and permeability by non-condensable gases, increase of injection pressure, reduction of injection lifetime due to precipitation of solids such as calcium sulphate, etc. However, no qualitative results are presented. White and Johnson (2009) disclosed that, during the final phase (2007-2011) of the IEAGHG Weyburn-Midale CO2 monitoring and storage project, the consequences of injecting impure CO2 (with H2S and SO2 contaminants on reservoir and seal integrity at Weyburn (Saskatchewan, Canada) will be assessed experimentally using reservoir and caprock samples. Computer simulations will also be performed using lab-scale reactive transport modeling. It should be noted that in this project CO2 is also used for enhanced oil recovery, and the composition is dictated by a Rectisol purification system. The concentration level of non-condensable gases and SOx/NOx in such a CO2 stream is low and not comparable to that of oxyfuel CO2 streams.
Overall the literature concerning the impurity effects is scarce. For the majority of the questions raised by IEA GHG, very limited data and information are available. The

6
knowledge gaps are substantial and comprehensive investigations are required to fill the gaps.
Combining with NRCan’s own research programs on CCS, we have carried out extensive assessments for the effects of the impurities on CO2 injection and storage. We will discuss the findings for each specified issue, respectively. For the discussions we divide the effects into two types: physical effects and chemical effects, i.e. those that do not involve chemical reactions and those that do. Evaluations of selected scenarios concerning both types of effects will also be presented.
2. Physical Effects of the Impurities
2.1. Phase Behaviour and the Impacts
Changes in phase behaviour of CO2 due to the presence of impurities may be evaluated by equations of state. Cubic equations of state are often used to calculate phase diagrams of fluids owing to their relative simplicity. A very commonly used cubic equation of state is the Peng-Robinson equation (Peng and Robinson, 1976):
22 2 bbVVa
bVRTp
mmm −+−
−=
α (2.1)
where p is pressure, T is temperature, Vm is the molar volume, and R is the universal gas constant. The parameters a, b and α are related to the critical temperature Tc, the critical pressure pc, and the acentric factor ω in the following way:
c
c
pTR
a2245724.0
=
c
c
pRT
b07780.0
=
25.02 ))1)(26992.054226.137464.0(1( rT−−++= ωωα
cr T
TT =
This equation has also been used to calculate properties of supercritical CO2 (see, e.g., Clifford, 2007). Another commonly used equation of state is the Soave-Redlich-Kwong equation (Soave, 1972):

7
)( bVVa
bVRTp
mmm +−
−=
α (2.2)
where
c
c
pTR
a2242747.0
=
c
c
pRT
b08664.0
=
25.02 ))1)(17613.055171.148508.0(1( rT−−++= ωωα
cr T
TT =
In the present work the Peng-Robinson equation has been used for most calculations, because of its relatively simple form, whereas the Soave-Redlich-Kwong equation has been used redundantly in limited cases to verify calculated trends. For mixtures the following mixing rules are applied to the parameters:
∑∑ −=j
ijjjiijii
kaaxxa )1()()( 2/12/1 αα (2.3)
ii
ibxb ∑= (2.4)
where xi and xj denote mole fractions of mixture components; kij is the binary interaction constant for components i and j, whose values can be determined from fitting the equations to experimental pressure-volume-temperature (PVT) data. The kij values for CO2 with each individual impurity component can be found in the literature. For instance, Li and Yan (2009 a, b) have reported kij values for cubic equations of state, including the Peng-Robinson and Soave-Redlich-Kwong equations, for mixtures of CO2 with CH4, H2S, SO2, Ar, N2 and O2, respectively. Not all kij values are available, especially kij values for impurity pairs. However, the contribution of kij is negligible to the calculated properties of CO2 streams when the impurity fractions are low. This can be seen from the mixing rule (Equation 2.3): when the fraction xi or xj is small the resultant term will be small. Particularly, the product of xi and xj will be negligible for any impurity pair compared with the products for CO2 and high-concentration impurities. The kij values used in our calculations are given in Appendix B. For component pairs where the kij values are not available, zero values (corresponding to ideal mixing) have been assumed.

8
Figure 2.1 shows representative phase diagrams calculated with the Peng-Robinson equation for CO2 mixtures with compositions given in Table 1.1, in comparison with the saturated vapour-pressure curve of pure CO2.
Figure 2.1. Calculated phase diagrams for CO2 streams compositions given in Table 1.1., including: a) Selexol (pre-combustion) case; b) Rectisol (pre-combustion) case; c) Post-combustion case 1 (99.93 vol% CO2); d) Post-combustion case 2 (99.81 vol% CO2); e) Oxyfuel case 1 (85% CO2); f) Oxyfuel case 2 (98% CO2); g) Oxyfuel case 3 (99.94 vol% CO2). For each case the dash line represents the vapour-liquid saturation curve of pure CO2, and the solid horizontal line represents the pressure level required to avoid two-phase conditions.
0
2
4
6
8
10
275 280 285 290 295 300 305
T, K
p, M
Pa
Selexol a)

9
0
2
4
6
8
10
275 280 285 290 295 300 305
T, K
p, M
PaRectisol
b)
0
2
4
6
8
10
275 280 285 290 295 300 305
T, K
p, M
Pa
Postcombustion 1 c)

10
0
2
4
6
8
10
275 280 285 290 295 300 305
T, K
p, M
PaPostcombustion 3 d)
0
2
4
6
8
10
12
275 280 285 290 295 300 305
T, K
p, M
Pa
Oxyfuel 1 e)

11
0
2
4
6
8
10
275 280 285 290 295 300 305
T, K
p, M
PaOxyfuel 2
f)
0
2
4
6
8
10
275 280 285 290 295 300 305
T, K
p, M
Pa
Oxyfuel 3g)

12
As can be seen from the diagrams, impurities at high concentration levels affect the phase behaviour significantly. In addition to formation of two-phase regions, the critical temperature and pressure are altered. One extreme case is the high-impurity oxyfuel CO2 stream containing about 15% N2, O2 and Ar, where the critical temperature decreases by about 10°C and the bubble-point pressure increases by over 4 MPa, compared with pure CO2. Streams with lower impurity levels show smaller changes in the phase behaviour. Particularly, for the two post-combustion CO2 streams and the low-impurity oxyfuel CO2 stream (99.94% CO2), the phase envelopes are very narrow and overlap the vapour-liquid saturation curve of pure CO2.
Under the studied conditions, non-condensable impurities N2, O2 and Ar should have the greatest effect of increasing the vapour-liquid saturation pressures and decreasing the critical temperature, owing to their low critical temperatures. H2 has a still lower critical temperature, but its effect would be smaller because of its low concentration, as is evidenced in Figure 2.1. The effects of the specific impurity species can be understood from Figure 2.2, where phase diagrams for several CO2 streams are shown in comparison of the high-impurity oxyfuel CO2 stream of Table 1.1 (containing 5.8% N2, 4.7% O2, 4.47% Ar and other impurities at ppm levels), including
1. CO2 stream from a typical oxyfuel combustion process, containing 3 vol % O2, 2 vol % N2, and 1000 ppm SO2;
2. CO2 stream from oxyfuel combustion in a fluidized bed pilot plant combustor in CanmetENERGY, containing 5.2 vol % O2, 221 ppm CO, 1431 ppm SO2 and 243 ppm NO (Jia et al., 2007);
3. CO2 stream from a zero-emissions process proposed by CanmetENERGY, containing1.05 vol % CO, 1.7 vol % SO2, 0.32 vol % H2 and 690 ppm H2S (Wang and Anthony, 2008);
4. CO2 stream from Cansolv® absorption system containing 2.9 vol % SO2, studied in a previous IEA GHG report (IEA GHG, 2004).
Also shown in this figure are the diagrams for CO2 mixtures with 5 and 15 vol % Ar, respectively. The 5% Ar mixture is for comparing with cases 1 (3% O2 and 2 % N2) and 2 (5.2% O2), and the 15% Ar mixture is for comparing with the high-impurity oxyfuel CO2 (containing about 15% N2+O2+Ar), with regard to the effects of the three air-derived impurities.

13
2
3
4
5
6
7
8
9
10
11
12
275 280 285 290 295 300 305 310 315
Temperature, K
Pres
sure
, MPa
Pure CO2CANMET oxyfuel (5.2% O2 and others)Oxyfuel CO2 (2%N2+3%O2+1000ppm SO2)5%Ar5.8%N2,4.7%O2,4.47%Ar and others15%ArCANMET zero emissionCansolv® (2.9% SO2)
Figure 2.2. Calculated phase diagrams for CO2 mixtures.
From the phase diagrams it is clear that N2, O2 and Ar are responsible for the aforementioned increase in the saturation pressures and decrease in the critical temperature. It is interesting to note that the diagrams of the three cases with about the same content of the air-derived impurities (i.e., 5.2 O2, 3% O2 + 2% N2 and 5% Ar, respectively) practically coincide with each other, suggesting the effects of the three species on the phase behaviour are nearly identical at this concentration level. Even at up to 15% impurity concentration, the effects are quite close, as can be seen from comparison of the diagrams of the high-impurity oxyfuel CO2 (containing about 15% N2 + O2 + Ar) and the 15% Ar CO2 mixture.
On the other hand, SO2 results in a decrease in the vapour-liquid saturation pressure and an increase of the critical temperature, as could be expected from the high critical temperature of pure SO2 (157.6°C). It can also be seen that low-concentration impurities, such as CO and NOx would not significantly affect the phase behaviour of CO2.
The changed phase behaviour has significant impacts on pipeline transport of the CO2 stream. If the impure CO2 streams were to be transported in liquid phase, lower critical temperature would require lower pipeline temperature. When local temperatures may exceed the critical temperature, better insulation or cooling would be needed. Moreover, although the increased liquefaction pressure is still lower than the injection pressure, and hence the increased power consumption for compression of the stream is not lost in this sense, larger size and higher quality of the pipeline are required, because of lower density
14
of CO2 mixtures (and presence of corrosive impurities). Alternatively, if the CO2 streams were to be transported in supercritical phase, higher pressure would be required to avoid the formation of two phase flow. Furthermore, the size of the pipeline also needs to be larger compared to the case of pure CO2, due to lower density of the supercritical streams which will be discussed in the next section.
2.2 Storage Capacity
2.2.1 Density of Supercritical CO2 Stream with Impurities
After injection into underground formations, CO2 will be in the supercritical state and impurities will affect the volumetric properties of the CO2 plume. Figure 2.3 shows selected cases of calculated density for supercritical CO2 with impurities at 330 K, which is in the typical temperature range for CO2 storage evaluations in western Canada. Two CO2/Ar mixtures with 5 and 15% Ar, respectively, are included for comparison with the 2% N2+3% O2 case and the high-impurities oxyfuel CO2 case (about 15% N2 + O2 + Ar). It can be seen that non-condensable impurities such as O2, Ar, N2 and H2 significantly reduce the density of the supercritical CO2 stream. The reduced density is largely related to increased volume, except for H2, where the effect of smaller molecular weight is also significant. All these impurity components in CO2 would cause a volume increase greater than their molar or volume fractions at standard temperature and pressure (STP) For example, 5 vol %(STP) N2 + O2 will result in a volume increase greater than 5 percent in the supercritical CO2 stream. This can be understood from the fact that non-condensable impurities are less dense than CO2 and hence take greater volumes. If they have the same molar volume as CO2 there would be no volume increase, provided the interactions between unlike molecules are negligible.

15
0
100
200
300
400
500
600
700
800
900
1000
5 7 9 11 13 15 17 19 21 23 25
Pressure, MPa
Den
sity
, kg/
m3
Pure CO21%H2+0.9%N22%N2+3%O25% Ar5.8%N2+4.7%O2+4.47%Ar15% Ar
Figure 2.3. Calculated density for CO2 and CO2 mixtures as a function of pressure
at 330 K.
2.2.2 Quantifying the Effect of Impurities on CO2 Storage Capacity
The decrease of CO2 storage capacity due to the contained impurities is thus not only caused by the lower volume fraction of CO2, but also by the additional volume of less dense impurities. To produce a simple relation regarding the effect of the impurities on the storage capacity for CO2 for given storage volume, we propose the following expression for the storage capacity (expressed in mass) as a function of the density of the CO2 stream:
)/1( 200 COi
i mmMM
∑+=ρ
ρ (2.5)
where M and M0 denote the mass of CO2 in the mixture and in the pure stream, respectively, which occupy the same volume, ρ and 0ρ are the density of the mixture and the pure stream, and mi/mCO2 is the ratio of the mass of impurity i to the mass of CO2 in the mixture. The ratio M /M0 on the left-hand side of the equation, which can also be viewed as the ratio of the mass of CO2 per unit volume in the mixture to that in the pure state, represents a normalized storage capacity for CO2 in its supercritical phase, i.e., the

16
capacity for structural trapping of CO2. In the case of pure CO2 (zero impurity effect) the ratio equals unity. The right-hand side of the equation is a function of temperature, pressure and mixture composition and can be calculated from equations of state. Accordingly, the normalized storage capacity can be determined for given temperature and pressure conditions. Calculated results for the mixtures of Figure 2.3 using the Peng-Robinson equation are shown in Figure 2.4. As can be seen from the figure, in all cases the reduction of capacity is greater than the molar or STP volume fractions of the impurities. More importantly, in all cases there is a maximal reduction of the capacity at a certain pressure, as shown by a minimum in the capacity-pressure curves. With the purity levels considered by IEA GHG (Table 1.1), the maximum reduction is from 9% for the 97.95% CO2 to 40% for the 85% CO2 mixtures. The minimal reduction between 9 MPa (corresponding to a shallow storage depth of about 900 m) to 25MPa for the two mixtures is 4% and 25.5%, respectively, which is still about twice the STP volume fractions of the impurities. Whereas the accuracy of the numerical values is limited by the accuracy of the equation of state, the existence of a minimum in the storage capacity appears to be certain, as will be discussed in following sections.
0
0.2
0.4
0.6
0.8
1
1.2
0 5 10 15 20 25 30
Pressure, MPa
Nor
mal
ized
cap
acity
, -
1%H2+0.9%N2+others
2%N2+3%O2
5% Ar
5.8N2/4.7O2/4.47Ar+others
15% Ar
Pure CO2
Figure 2.4. Normalized CO2 storage capacity at 330 K in terms of Equation 2.5, where the densities are calculated with Peng-Robinson Equation.
2.2.3 The Minimum in the Storage Capacity of CO2 with Non-condensable Impurities

17
As has been seen, there is a maximum reduction of CO2 storage capacity, or a minimum capacity, for all cases shown in Figure 2.4. This minimum is revealed through our analysis. Comparison of Figures 2.3 and 2.4 shows that the minimum occurs in the pressure range where the density of CO2 increases most rapidly, and the pressure corresponding to the minimum increases slightly with increasing impurity concentration. To make sure this generalization is not affected by inadequate representation of the PVT relations by the Peng-Robinson equation, another equation of state (Soave-Redlich-Kwong equation) was used for the same calculations, and similar results were obtained. As this behaviour has important implications for CO2 storage, we have analyzed it further and concluded that the minimum is a physical reality. The analysis is given as follows.
From Figure 2.4 it can be seen that mathematically the minimum should correspond to
0)/( 0 =
dpMMd (2.6)
Using Equation 2.5 and noting that )/1( 2COi
i mm∑+ is constant for a given mixture, it
follows that
202
00
2
00
)/1()/1()/()/(
ρ
ρρ
ρρρρ
COi
iCOi
i mmdp
ddpd
dpmmd
dpMMd
∑∑ +
−=
+= (2.7)
Thus, Equation 2.6 is satisfied for
000 =− ρ
ρρρ
dpd
dpd (2.8)
A rearrangement of Equation 2.8 yields
dp
ddp
d
0
0
ρρ
ρρ
= or dp
ddp
d 0lnln ρρ= (2.9)
Moreover, when the pressure p is smaller or greater than the pressure corresponding to
the minimum, there should be dp
ddp
d 0lnln ρρ< and
dpd
dpd 0lnln ρρ
> , respectively, for
the minimum to occur. Since dp
ddp
d 0lnln ρρ> if
dpd
dpd 0ρρ
> and vice versa, we can
examine dpdρ and
dpd 0ρ only. At low pressure we can apply the ideal gas law for
simplicity:
pVm=RT (2.10)

18
Rewriting the ideal gas law into
RTwp
=ρ (2.11)
where ρ is density and w is the molar weight, we have
RTw
dpd
=ρ (2.12)
at constant temperature. Because the non-condensable impurities result in smaller molar
weight, i.e., 2COww < , there must be dp
ddpd 0ρρ
< according to Equation 2.12 for low
pressures. On the other hand, at very high pressures, the density of pure CO2 in its supercritical state would be close to liquid density and not change appreciably with pressure. By contrast, the density of the mixtures of CO2 and non-condensable impurities can still increase with pressure because they are farther away from a liquid state in
comparison with pure CO2, that is, dp
ddpd 0ρρ
> . Consequently, from low pressure to very
high pressure there must be a transition point, where dp
ddpd 0ρρ
= , which should
correspond to the minimum observed in Figure 2.4.
We have looked for reported experimental data to verify the existence of the minimum. Unfortunately, there are no readily applicable data, as no investigations similar to the present one have been undertaken before (at least not to our knowledge). The data we found which could most closely serve our purpose are shown in Table 2.1. The two sets of data were not obtained at the same temperature, but at very close temperatures. After application of Equation 2.5, the data are represented by the curve in Figure 2.5. Although the fraction of CO2 is much smaller than the cases we evaluated, a minimum is clearly seen at about 13 MPa. Since all CO2 mixtures with non-condensable impurities would show a minimum according to our analysis, the verification using this single case should suffice.
Table 2.1 Literature data for density of a mixture of 44.696 mol % CO2 and 55.304 mol % N2 (Esper et al., 1989) and pure CO2 (Klimeck et al., 2001) in the supercritical temperature range of CO2
44.696 % CO2 and 55. 304 % N2 at 320 K Pure CO2 at 323 K Pressure (MPa) Density (kg/m3)
21.6035 335.699 14.3676 222.941 9.868 148.051
Pressure (MPa) Density (kg/m3) 10.0471 389.902 12.031 586.718 14.0034 672.36

19
6.7848 98.311 4.6323 65.28
16.0213 722.504 18.0289 757.512 21.0388 796.328 24.0253 825.825
0
0.1
0.2
0.3
0.4
0.5
0.6
0 5 10 15 20 25 30
Pressure, MPa
M /
M0,
-
Figure 2.5. Verification of the existence of a minimum in the normalized density for impure CO2, hence in storage capacity, using literature data given in Table 2.1.
2.2.4 A Maximum of Storage Capacity for CO2 with SO2
For impurities which have higher critical temperature than that of CO2, no storage capacity minimum would occur in the corresponding CO2 mixture. Rather, a maximum can appear based on an analysis similar to that for the non-condensable impurities. This has been verified with calculated results for the CO2 mixture with 2.9 vol % SO2 (the Cansolv® absorption system case presented in the previous IEA GHG report PH4/32). As shown in Figure 2.6, a maximum is seen at about 11 MPa, where the storage capacity is increased by over 5%. It should be noted again that the storage capacity is based on pure CO2 (see discussion for Equation 2.5). It is, therefore, interesting to see that in this peak region, the CO2-based capacity is above that of pure CO2. In other words, SO2 does not take any but creates space for CO2. This can be rationalized from the consideration that SO2 decreases average distance between the molecules of the mixture – an opposite effect of that of the non-condensable gases. This can be taken as one positive effect of the presence of SO2 on CO2 storage. However, SO2 causes more concern with regard to its chemical effects on formation rocks. This will be discussed later.

20
It is worth mentioning that H2S would also exhibit a maximum in the storage capacity according to our calculations (see Figure 2.6). However, the maximum is below the capacity of pure CO2. That is to say, H2S decreases CO2 storage capacity. The analysis is more complex, as H2S has a lower molecular weight but higher critical temperature than CO2 due to its polar nature, and is not presented here.
0.94
0.96
0.98
1
1.02
1.04
1.06
0 5 10 15 20
Pressure, MPa
Nor
mal
ized
cap
acity
, -
2.9%SO25%H2S
Pure CO2
Figure 2.6. Normalized storage capacity for CO2 with 2.9 vol % SO2 at 330 K. The result for 5 vol % H2S is also shown.
2.2.5 Impact of the minimum CO2 storage capacity
The minimum in the CO2 storage capacity caused by non-condensable impurities is of practical concern, because these impurities are typical for CO2 streams from oxyfuel combustion, and the pressure for this minimum falls in the range for CO2 storage. Calculated pressure dependence of the normalized CO2 storage capacity at several temperatures for the high-impurity oxyfuel CO2 stream is shown in Figure 2.7. It can be clearly seen that with temperature increasing, the minimum shifts to higher pressure and the magnitude of the minimum decreases. As is suggested by Figure 2.4, for different impurity levels the pressure corresponding to the minimum storage capacity changes only slightly at constant temperature. Accordingly, similar pressure and temperature dependence behaviour of the minimum shown in Figure 2.7 is expected for CO2 streams with other impurity levels. In subsurface formations, the pressure and temperature are interrelated as both of them increase with the depth from the surface. At certain depths, the minimums which correspond to the largest decreases of storage capacities may occur

21
due to pressure and temperature conditions. By assuming a hydrostatic pressure gradient of 10 MPa/km, and geothermal gradients from 20 to 33°C/km for the subsurface and a ground temperature of 15°C (as has been assumed in a recent IEA GHG report, see Gorecki et al., 2009), the impact of the minimum on the CO2 storage capacity for the high-impurity CO2 stream is shown in Table 2.2. As can be understood, the storage capacity can decrease to as low as 54.3% at 320 K and 56.4% at 330 K in the case of 33°C/km geothermal gradient. At higher temperature, 350 K, the decrease in the storage capacity is smaller and at still higher temperatures the decrease would be smaller still.
0
0.1
0.2
0.3
0.4
0.5
0.6
0.7
0.8
0.9
1
5 10 15 20 25
Pressure, MPa
Nor
mal
ized
cap
acity
, -
320 K
330 K
350 K
Figure 2.7. Normalized CO2 storage capacity at different temperatures in terms of Equation 2.5 for the high-impurity CO2 stream (5.8 vol % N2, 4.7 vol % O2, 4.47 vol % Ar and minor amounts of other impurities).
Table 2.2 Normalized CO2 storage capacity for the high impurity CO2 stream at several subsurface temperatures*
T gradient 20°C/km 25°C/km 33°C/km
T (K) p (MPa) Capacity (-) p (MPa) Capacity
(-) p (MPa) Capacity (-)
320 16 0.653 13 0.574 10 0.543 330 21 0.723 17 0.672 13 0.564

22
350 31 0.755 25 0.734 19 0.698
*Hydrostatic pressure gradient of the subsurface is taken as 10 MPa/km.
As structural trapping is deemed the most important trapping mechanism for CO2 storage at least in the injection phase of a CCS operation, the pressure effect should be taken into account in estimation of the storage capacity for underground formations. Moreover, in storage operations, the minimum would cause reduced storage efficiency. At a given depth, increasing the storage pressure well beyond the level for the minimum would increase storage efficiency. This may be attained for closed formations within the allowable overpressure range. For open formations where higher pressure may not be attainable, one possibility to increase the storage efficiency is to increase the depth of injection and storage. With increasing depth the temperature and pressure will increase so that the capacity decrease can be alleviated, as can be understood from Figure 2.7 and Table 2.2.
2.2.6 Residual Trapping and Interfacial Tension
The discussion of the minimum CO2 storage capacity in structural trapping should also be applicable to the volume of CO2 retained in gas bubbles as an immobile phase by the residual trapping mechanism. That is, the decrease of the volume of trapped CO2 in the bubbles due to the impurities can be greater than the molar fractions or STP volume fractions of the impurities. Moreover, at lower temperatures a minimum may occur at a certain pressure, causing a greater drop in the volume of CO2. Furthermore, injection at deeper levels may increase the volume of CO2 in the bubbles because of higher pressure.
The impurities would also affect the efficiency of residual trapping through the interfacial tension (IFT) between the bubbles and water. Higher IFT leads to higher capillary pressure required to move the bubbles and increase residual trapping, and vice versa. Reported data for IFT between water and high-pressure mixtures of CO2/N2 (Yan et al., 2001) and CO2/CH4 (Ren et al., 2000), respectively, show that the IFT increases with increasing fraction of N2 or CH4. Based on these observations, we expect the IFT of the high-impurity oxyfuel CO2 to be higher than that of pure CO2. An evaluation of the data is given below.
The reported IFT data for CO2/N2 mixtures in the pressure range 10 – 20 MPa and temperature range 313.15 – 373.15 K are selected and plotted in Figure 2.8a, as a function of the mole fraction of N2. Since the IFT values at different temperatures and pressures fall within a relatively narrow range, it is not easy to see the temperature and pressure dependence from the plot. However, it is evident that the IFT increases with increasing fraction of N2. In Figure 2.8b, the IFT data for CO2/CH4 are plotted. Similarly to the case of CO2/CH4, the IFT increases with increasing fraction of CH4. Given that both N2 and CH4 are non-condensable and non-polar gases, and both have higher IFT with water than pure CO2, it would be reasonable to expect other similar gases, such as O2 and Ar, to have a similar effect of increasing the IFT of impure CO2.

23
The dash lines in Figure 2.8 represent linear interpolations based on IFT of pure CO2 and N2 or CH4, in terms of
)1( 222 COiCOCO xx −+= σσσ (2.13)
where σ is the IFT; 2COσ and iσ denote the IFT of CO2 and the other component, respectively. 2COx is the mole fraction of CO2. The maximum deviation between the linear predictions and measured data is less than 12% over the evaluated range. It is interesting to note that the IFT of a CO2 mixture with 30 mol% H2S has also been found to be close to the molar averages of the two components (Shah et al., 2008), although, unlike N2 and CH4, H2S is polar and its IFT with water is lower than that of CO2.
Based on the linear interpolations we estimate a moderate increase of the IFT – up to 15% - for the high-impurity oxyfuel CO2 (ca 15% of N2, O2 and Ar). This would have an effect of increasing the bubbles trapped in the pores after water imbibition, and offset the effect of decreasing CO2 volume in the individual bubbles by the impurities. Measurements should be conducted to determine the actual IFT of impure CO2 under storage conditions, however.

24
0
10
20
30
40
50
60
70
0 20 40 60 80 100
Mole fraction of N2, %
IFT,
mN
/m 313.15 K/10 MPa313.15 K/15 MPa313.15 K/20 MPa333.15 K/10 MPa333.15 K/15 MPa333.15 K/20 MPa373.15 K/10 MPa373.15 K/15 MPa373.15 K/20 MPa
a)
0
10
20
30
40
50
60
70
0 20 40 60 80 100
Mole fraction of CH4, %
IFT,
mN
/m
313.15 K/10 MPa313.15 K/15 MPa313.15 K/20 MPa333.15 K/10 MPa333.15 K/15 MPa333.15 K/20 MPa373.15 K/10 MPa373.15 K/15 MPa373.15 K/20 MPa
b)
Figure 2.8. Interfacial tension (IFT) of CO2 mixtures; a) CO2/N2, b) CO2/CH4. The lines represent interpolations based on Equation 2.13 for upper and lower bound data sets.

25
2.2.7 Using Ar to Represent Non-condensable Impurities in Oxyfuel CO2 Streams
CO2 streams from oxyfuel combustion contain high levels of O2, N2 and Ar. As have been discussed, these impurities result in substantial changes to the PVT properties of the CO2 streams, which impact significantly CO2 transport and storage. Given the importance of oxyfuel combustion in CO2 capture, we have further evaluated the PVT properties of CO2 streams with O2, N2 and Ar. The properties of the impure CO2 streams are dependent on their composition. Computation of these properties for various mixtures requires composition-dependent parameter values that are subject to experimental determination, and can be quite laborious. Measurements of these properties can be more difficult because of the risks of fire, explosion and corrosion of high-pressure oxygen, which demand special materials and extra caution. If the PVT properties of CO2 mixtures containing O2, N2 and Ar can be evaluated using only one impurity component, such as N2 or Ar, the modeling and laboratory work can be largely simplified. It is for this reason that we included single-impurity (Ar) cases in phase envelope and density calculations, in comparison with the results of multi-impurity (O2, N2 and Ar) mixtures at equivalent molar fractions. The concept is based on similar critical properties of the three species, which are shown in Table 2.3. Whereas these properties are common knowledge, the table will serve to show that they lead to similar PVT behaviours of the CO2 mixtures being discussed. Compared with CO2, the critical properties of the three gases are quite close. We have considered Ar regarding its representativeness for the other two species, because its critical temperature and pressure are in between the values for the other two, although closer to O2 than N2 (Table 2.3).
Table 2.3 Critical properties of CO2, O2, N2 and Ar
Species Tc (K) Pc (MPa) CO2 304.2 7.38 O2 155 5.05 Ar 151 4.87 N2 126 3.39
Comparison of the phase envelopes in Figure 2.2 shows that the calculated result for the 2% N2 + 3% O2 and 95% CO2 mixture is close to that of the 5% Ar and 95% CO2 mixture. For the high-impurity case with 15% impurities (5.8% N2, 4.7% O2, 4.47% Ar and others), the result for the 15% Ar CO2 mixture essentially coincides with the former over a large part of the dew-point portion. The bubble pressure of the 15% Ar mixture is slightly higher than that of the CO2 mixture with about 15% N2 + O2 + Ar, but the difference is within 2 percent. The difference in critical temperature is less than 1°C.
The results for the supercritical phase are more interesting. Calculated volumes for the CO2 mixtures with 15% Ar and 15% N2 + O2 + Ar, respectively, are practically identical (Figure 2.9), with the maximum discrepancy within 1 percent. An important point is that the density of mixtures can be readily calculated given the volume values. Although the density of the Ar-only mixture is different from the density of the corresponding mixture with multi-impurity components (Figure 2.3), the volumes are practically the same. Once

26
the volume of the Ar-only mixture is determined, the density of the multi-component mixture can be calculated using the exact mass, which is known for a given composition. As will be discussed, the density of CO2 mixtures affects not only CO2 storage capacity, but also permeation and buoyancy of the CO2 plume. The proposed approach has the potential to substantially simplify related calculations and programming for computer simulations. Moreover, it may largely simplify laboratory experiments for determination of the properties of oxyfuel CO2 streams, if only Ar is used to simulate the total air-derived gas impurities at various concentration levels. The advantage of avoiding using hazardous high-pressure O2 is particularly attractive.
0
0.05
0.1
0.15
0.2
0.25
0.3
0.35
0.4
0.45
0.5
5 10 15 20 25
Pressure, MPa
Volu
me,
m3 /k
mol
Pure CO2
Figure 2.9. Comparison of the volumes of the high-impurity CO2 mixture (5.8% N2 + 4.7% O2 + 4.47% Ar) and the CO2 mixture with 15% Ar at 330 K. The curves for the two mixtures essentially coincide.
We have not carried out calculations using Ar mixtures at other temperatures, because there is reason to believe that the results would be even better, at least for higher temperatures. This can be demonstrated by use of generalized charts for compressibility factor Z = pVm/RT. For gas mixtures, one can calculate their pseudo-critical temperature,
*cT , and pseudo-critical pressure, *
cp , using the Kay’s rule (Kay, 1936):
cii
ic TxT ∑=* (2.14)
and

27
cii
ic pxp ∑=* (2.15)
where ciT and cip are the critical temperature and pressure of the individual components. Then the compressibility factor of the mixture, Z, can be obtained from the generalized charts according to the reduced temperature, */ cr TTT = and reduced pressure,
*/ cr ppp = . The generalized Z charts can be found in handbooks such as the Chemical Engineer’s Handbook. Once the value of Z is determined, the volume can be calculated using the relation Vm = ZRT/p. As has been discussed earlier, the critical property values of Ar fall between the two other gases, and all these values are substantially lower than that of CO2. As a result, the rT and rp of the Ar-only mixture and the multi-impurity mixture are very close. A comparison is given in Table 2.4. With values of such small difference, the Z values and hence Vm values determined from the generalized compressibility charts will be the same. Since the accuracy of the charts is known to increase with increasing Z values, and given the fact that a higher temperature means higher rT which corresponds to greater Z, using Ar-only mixture to replace multi-impurity mixtures for higher temperatures is expected to achieve even higher accuracy than for lower temperatures.
In spite of the merit of not requiring sophisticated computations and information on the interaction factors, the use of compressibility factor charts is unlikely to be popular with the development of more efficient computer programs. Instead, the above discussion shows that the proposed approach of using Ar-only mixtures looks credible, and can be quite useful for quicker evaluation of the impacts of the impurities from oxyfuel combustion on CO2 storage.
Table 2.4 Comparison of reduced properties for two CO2 mixtures at 330 K
5.8% N2 + 4.7% O2 + 4.47% Ar 15% Ar Tr 1.178 1.173
Pressure (MPa) rp rp 5
1.385 1.401 10 0.6927 0.7004 15 0.4618 0.4669 20 0.3463 0.3502 25 0.2771 0.2801
2.3. Permeation Flux

28
The presence of impurities would also affect CO2 injection. Here we discuss their physical effects (no chemical reactions involved) on the injection first. We have discussed the IFT for CO2 mixtures earlier, which could affect the relative permeability of the CO2 in two-phase flow. In particular, the presence of N2, O2 and Ar in the high-impurity oxyfuel CO2 may increase the IFT and lead to a lower relative permeability. As two-phase flow also depends on a number of other factors, a quantitative evaluation of the effects of impurities requires additional information. However, for the single-phase flow of injected CO2, the effects may be analyzed in terms of an expression based on Darcy’s Law, for the permeation flux O2:
pkM ∇−
=•
µρ (2.16)
where •
M is the mass flow per unit area, ρ is the density of injected stream, k is rock permeability, ∇ is the gradient operator, p is the pressure, and µ is the viscosity of the fluid. As the impurities lower the density of the CO2 stream, the mass flux will decrease for the same pressure drop. However, the impurities also affect the viscosity of the injected fluid. When the viscosity of the impure CO2 stream is lower than the viscosity of pure CO2, the flux would increase, hence the decrease in density may be compensated by a corresponding decrease in viscosity. The density and viscosity are functions of temperature and pressure. The permeability and pressure gradient vary case by case. However, for an estimation of the impurity effects under the same permeability and pressure drop conditions, one may use the following relation which is a consequence of Equation 2.16:
)/1(
)/(
20
0
0
2
COi
i
CO
mmM
M∑+
=•
•
ρµµρ (2.17)
where 2COM•
and 0
•
M are the mass flow per unit area for CO2 in the mixture and in its pure state, respectively. 0ρ and 0µ are the density and viscosity of pure CO2, respectively. This expression represents a normalized permeation flux, and should be able to provide a measure of the relative injectivity of the impure CO2 stream. To evaluate the temperature and pressure dependence of this permeability, knowledge of the viscosity is needed. The calculation of viscosity for high-pressure gas mixtures is less certain, especially in the supercritical region. The viscosity can be quite sensitive to pressure at relatively low temperature. Various methods exist but we could not find reported data to verify calculated results for CO2 mixtures evaluated. Since the impurity effects are more important for high impurity levels, we only discuss the high-impurity case. The viscosities of pure CO2 and impure CO2 shown in Figure 2.10 are calculated using the TRAPP method (Huber and Hanley, 1996; Poling et al., 2001). Whereas the accuracy of the numerical values is not certain, the pattern of the predicted pressure dependence looks plausible. The mixture is seen to have considerably lower viscosity than pure CO2 at high pressures. At 5 MPa, the lowest pressure for the evaluation, the viscosity of the mixture is

29
slightly higher. This is not unreasonable given the fact that the viscosities of N2, O2 and Ar are all higher than the viscosity of CO2 at ambient pressure. The pressure dependence of the normalized permeation flux, based on the calculated viscosities, is shown in Figure 2.11. As a trend it can be seen that the injectivity of the impure CO2 with about 15% N2/O2/Ar is lower than that of pure CO2 by more than 15 percent at lower pressures, but reaches the same level as pure CO2 after a transition range of pressure. This pressure range is likely related to the minimum of the relative density of CO2. This will be discussed later on.
As has been discussed, the viscosity of supercritical CO2 is lowered by the impurities N2, O2 and Ar. Consequently, the effect of increased volume on the permeation flux is partly offset. Thus, the overall physical effect of the impurities on the permeation flux would be less important than on the storage capacity. When the impurity level is lower, the effect on CO2 permeation flux or injectivity would be smaller still.
0
1000
2000
3000
4000
5000
6000
7000
8000
9000
0 5 10 15 20 25 30
Pressure, MPa
Visc
osity
(Pa
sec)
x108
Pure CO2
CO2 with N2/O2/Ar
Figure 2.10. Calculated viscosity for 330 K. The symbols represent calculated values and the curves are trend lines.

30
0
0.2
0.4
0.6
0.8
1
1.2
5 7 9 11 13 15 17 19 21 23 25Pressure, MPa
Nor
mal
ized
per
mea
tion
flux,
-
Figure 2.11. Normalized permeation flux for the high-impurity CO2 stream (5.8% N2 + 4.7% O2 + 4.47% Ar) from oxyfuel combustion at 330 K.
2.4 Buoyancy and Rising Velocity
The light-impurity species would result in greater buoyancy for the CO2 plume, due to the lower plume density they bring about. When a mass of the plume in a unit volume is in contact with the formation water, the buoyancy force can be expressed as
gF mOH )( 2 ρρ −= (2.18)
where OH 2ρ and mρ are the density of the water and the plume, respectively, and g is the gravitational acceleration. When the changes in relative permeability and capillary pressure are neglected, the effect of impurities on this force with reference to pure CO2 may be given as
22
2
0 COOH
mOH
FF
ρρρρ
−−
= (2.19)
where F and F0 are the buoyancy force for the CO2 mixture and pure CO2, respectively. The greater the difference between the densities of the mixture and CO2, the greater the change in the buoyancy would be. The buoyancy also depends on the density of the formation water, assumed constant in these calculations. Figure 2.12 shows the calculated result for the highest impurity case where the density of the formation water (brine) is taken as 1,025 kg/m3.

31
0
0.2
0.4
0.6
0.8
1
1.2
1.4
1.6
1.8
5 7 9 11 13 15 17 19 21 23 25
Pressure, MPa
Nor
mal
ized
buo
yanc
y, -
Figure 2.12. Normalized buoyancy for the high-impurity CO2 stream (5.8% N2 + 4.7% O2 + 4.47% Ar) from oxyfuel combustion at 330 K.
As can be seen from this figure, with about 15 vol % non-condensable impurities the buoyancy of the CO2 plume can increase by over 50% for this high-impurity case. This would significantly increase the rising velocity of the plume. The relation of the velocity and the forces may be given as
fvFdtdv
−=ρ
(2.20)
where v is the velocity, t is time and f is a coefficient related to frictional resistance to the movement of the plume. As the velocity increases due to increased buoyancy, the resistance also increases. When the two forces are balanced the velocity becomes constant and there is
fvF=
ρ (2.21)
As f may be taken as being proportional to the viscosityµ , we have
)/()/(
0000 µρρµ
FF
vv= (2.22)

32
With the density, viscosity and buoyancy data in Figures 2.2, 2.9 and 2.11, the velocity of the high-impurity plume can reach nearly three times that of the pure CO2 plume. The high rising velocity would reduce the time for CO2 contact with water and formation of dissolved species. It would also reduce the formation of a residual phase, because it reduces the spreading of the plume laterally, leaving a smaller area of the aquifer affected by the plume, and hence a smaller area for trapping CO2 in the pores of rocks. When the plume reaches the caprock it will spread laterally, but the contact with water is only at the interface. Besides, near the caprock the pressure is lower than in the deeper region, and thus the efficiency of CO2 dissolution and trapping in the pores as a residual phase would be lower. As a result, the potential for CO2 leakage increases if pathways are available.
Another noteworthy point is that, for both pure CO2 and the CO2 mixtures, the buoyancy should decrease with increasing pressure, because of increased density. However, the relative buoyancy with reference to pure CO2 increases with increasing pressure, as seen in Figure 2.12. This can be understood from Equation 2.19 by rewriting it into
OHCO
OHm
FF
22
20 /1
/1ρρρρ
−−
= (2.19’)
As in the investigated range the density of pure CO2 increases more with pressure than the density of impure CO2, the ratio of the buoyancy increases with pressure.
Yet another noteworthy point is that from Figure 2.12 a threshold-like transition pressure range is clearly seen, where the buoyancy increases by about 40% from the pure CO2 level. This transition range is similar to that seen in Figure 2.11 for the normalized injectivity. This behaviour may be related to the pressure which corresponds to the minimum in the relative density of CO2 discussed earlier. Rearranging Equation 2.19 into
12
2
22
2
0
−
−=
CO
OH
CO
m
CO
OH
FF
ρρ
ρρ
ρρ
(2.19’’)
we recognize the term 2/ COm ρρ identified previously, whose pressure dependence shows a minimum, according to the discussions of Equations 2.5 through 2.12. This explains the transition pressure range.
2.5 Dissolution of CO2 Mixtures in Formation Water
Dissolution of CO2 into water, which is relevant to solubility trapping of CO2, increases with pressure but decreases with temperature, salinity and pH. As most high-concentration impurities under consideration have lower solubility in water than CO2, the presence of these impurities would reduce the partial pressure of CO2 and, therefore, reduce the dissolution of CO2 in formation water. Figure 2.13 illustrates the effect of the lowered partial pressure on CO2 solubility (according to Henry’s law) as a function of salinity, where the pure CO2 solubility is based on literature data (see, e.g., Duan and Sun,

33
2003). As can be seen, the pressure dependence of pure CO2 solubility decreases with increasing pressure under the studied conditions. As a consequence, the pressure dependence of impure CO2 solubility becomes weaker at high pressures. Moreover, the CO2 will eventually dissolve if the formation is open or the water-to-CO2 ratio is large, regardless of the presence of impurities. Compared with the other impacts of the impurities discussed earlier, the impact on dissolution appears insignificant.
Acid impurities, such as SOx and NOx, would decrease the solubility of CO2 by decreasing the pH of the formation water. However, dissolved rock minerals can serve as a pH buffer and weaken the effect of acid impurities on CO2 dissolution. Overall, the effect of impurities is less significant for CO2 dissolution.
0
0.2
0.4
0.6
0.8
1
1.2
5 10 15 20 25 30 35
Pressure, MPa
CO
2 sol
ubili
ty, m
ol/k
g br
ine
Pure CO2 at 58500 mg/L salinity
CO2 with 15% inert impurities at 58500 mg/L salinity
Pure CO2 at 234000 mg/L salinity
CO2 with 15% inert impurities at 234000 mg/L salinity
Figure 2.13. The effect of low-solubility impurities on CO2 solubility in brine at 330 K. The solubility of pure CO2 is based on literature data and the solubility of impure CO2 is calculated on account of reduced partial pressures.
3. Chemical Effects
3.1 Impact of Reactive Impurities on Injectivity of CO2
The most common reactive impurities are H2S, SO2, NOx, whose aqueous solutions are acidic, and CO, which is highly reductive and will be oxidized to CO2 by oxygen or mineral oxides. There have been several studies on co-injection of H2S and/or SO2 with CO2 (Talman and Perkins, 2009; Knauss et al., 2005; Xu et al., 2007; Bacon et al., 2009;

34
Jacquemet et al., 2009). The general view is that H2S is not an issue, and it has been co-injected with CO2 for 20 years in Canada in acid gas disposal. However, SO2 is believed to alter the geochemistry, causing increased dissolution and precipitation. SO2 can greatly lower the pH of the formation water and hence enhance the dissolution of rock minerals. When the species become oversaturated precipitation of sulphates would occur, and reduction of pore volume and hence the injectivity of CO2 is a concern. The effect of the impurities is difficult to quantify. Numerical simulation studies have been performed for one-dimensional cases (Knauss et al., 2005; Xu et al., 2007; Bacon et al., 2009; Jacquemet et al., 2009). Trough these studies SO2 is shown to result in dissolution of minerals in the injection zone and precipitation downstream, causing significant decrease of rock porosity and hence CO2 injectivity (Xu et al., 2007). Such information is valuable for CO2 injection operations. However, the simulations have either assumed that SO2 is injected as an aqueous solution or the water in the injection zone is never dry. This would be relevant for injection of CO2 with water or study of the effects of SO2 on caprock integrity, but the situation is different from the injection operations where SO2 migrates with CO2 in an immiscible plume which results in a desiccation or dry-out zone (see, e.g., Gaus et al., 2008; Pruess and Müller, 2009; Pruess, 2009). The important point is that SO2 is far less reactive when it is dry. Further, continuous dissolution of minerals as in the “wet cases” would not occur in the dry-out zone. The contact of SO2 with water only occurs on the front of the plume and the two-phase flow zone, and the time would be limited. Therefore, build-up and precipitation of minerals in the downstream which were dissolved in the upstream and carried by water flow would be much less, compared with the “wet cases”. In the following we give an analysis for the impact of SO2 on the injectivity of CO2.
3.1.1 Formation of Sulphuric Acid from SO2 and the Roles of O2 and NOx
The effect of SO2 depends on its state. If SO2 is dissolved and oxidized to form sulphuric acid, it will be highly reactive. The oxidation depends on the availability of O2. Although the formation of sulphuric acid through disproportionate reaction of SO2
4SO2 + 4H2O → 3H2SO4 + H2S. (3.1)
and oxidation of SO2 by mineral oxides such as hematite have been proposed, they are not considered to be important in the scenarios of the present study. In CO2 streams from oxyfuel combustion and post-combustion capture plants the concentration of O2 will be higher than SO2, according to the data provided by IEA GHG (Table 1.1). Moreover, in these streams NOx will also be present. NOx is known to catalyze SO2 oxidation and hence formation of sulphuric acid according to the lead chamber process for production of sulphuric acid:
2NO2 + H2O → HNO2 + HNO3 (3.2.1)
SO2 (dissolved) + HNO3 → NOHSO4 (3.2.2)
NOHSO4 + HNO2 → H2SO4 + NO2 + NO (3.2.3)
SO2 (dissolved) + 2HNO2 → H2SO4 + 2NO (3.2.4)

35
2NO + O2 → 2NO2 (3.2.5)
NO2 is soluble in water but NO is barely soluble. For the catalytic process to proceed, the oxidation of NO to NO2 is essential. The rate of the process depends on various factors such as concentrations of reactants and products, pressure and temperature. To carry out a simulation to evaluate the rate of SO2 conversion substantial information about the rate constants is required. Moreover, based on our past experience with NOx and SOx interactions, we believe these reactions are enhanced on surfaces (liquid and/or solid) (Preto et al., 2004). The surface effect is hard to quantify, but is likely important in rock pores where the ratio of available surface, be it solid or liquid, to the gas phase is high. As the maximum effect of NOx is to oxidize all SO2, we assume that all SO2 can be converted to sulphuric acid and the concentration of SO4
2- ions is equal to that of dissolved SO2, when NOx and O2 are present.
3.1.2 A Simple Model for Evaluation of the Effect of SO2 on Reduction of Pore Porosity
Here we consider a simple model for a quick estimate of the contribution of SO2 to the reduction of rock porosity. Because CO2 in its supercritical state does not mix with water, the water is displaced by injected CO2. This results in the development of a dry-out zone starting from the injection well (see, e.g., André et al., 2007; Burton et al., 2008; Gaus et al., 2008; Pruess and Müller, 2009; Pruess 2009). In the dry-out zone there may be some trapped water or residual water, but the water would remain immobile and evaporate into the CO2 phase. Therefore, in the dry-out zone there is no moving water phase. Between the dry-out zone and the front of the CO2 phase, there is a two-phase flow region where CO2 and water flow in separate phases. This picture is essentially the same as the one described by Pruess (2009) for injection of pure CO2, except that the precipitation of salt due to the dry-out is not included. A simplified sketch is shown in Figure 3.1 for a one-dimensional illustration (it will be understood that the concept should also be valid in 3-D cases). SO2 dissolves into water in the two-phase region and the front of the plume, lowering the pH of the water and causing dissolution of minerals. If the concentration of precipitate-forming positive ions is low, only dissolution will occur and the dissolved ions are carried by water which is pushed by the plume, building up the concentration. Once the concentration of the dissolved species reaches the level for sulphates to precipitate, the precipitation starts. From this point a quasi-steady state is established (the expression ‘quasi’ is used here because the velocity of the front would slow down with time under constant injection rate). The dissolution and precipitation of minerals occur simultaneously and the consumed SO4
2- ions are constantly made up by dissolution of SO2 from the plume. For a given location ahead of the plume, the dissolution and precipitation start with the arrival of the front of the two-phase zone, and cease once the front of the dry-out zone passes. The dissolvable minerals remaining in the dry-out zone will not contribute to the formation of sulphates, as there is no water and the dry SO2 passing by is much less reactive compared with the wet situation (we will establish that porosity change due to sulphation by dry SO2 is insignificant, at least in the injection period). Local dissolution and precipitation may still occur in immobile water left in the dry-out zone, but there is no migration of minerals, and the effect is far more limited

36
compared with the case where SO2 constantly passes with water. Thus, the reaction of SO2 is important only for a limited period of time.
Figure 3.1 Simplified sketch for the movement of injected CO2.
As can be understood from the above discussion, once the quasi-steady state is established, the rate of dissolution will be equal to the rate of precipitation, and there is no migration of dissolved minerals. These rates depend on mineral species and SO2 concentration. If the dissolution is very slow, the quasi-steady state will start late. In the extreme case, when the quasi-steady state starts after the injection period ends, there will be no decrease but only increase of porosity, because there is no precipitation. With faster dissolving species, the quasi-steady state starts earlier and more precipitation takes place. The decrease of porosity is of greater concern with fast-dissolving and precipitating species. As calcite and calcium sulphate are representative of such species, we discuss this pair first. The discussion would be relevant to carbonate formations. We will show later that our method also has application in sandstone formations.
Rate constants and equilibrium constants for the dissolution of calcite and precipitation of anhydrite can be found in the literature. Numerical simulations are possible in principle. However, the results would depend on many factors, such as pH, salinity, rock compositions, to mention a few. Such results would be difficult to generalize. As stated, we want a quick estimate of the porosity change for given SO2 impurity levels, and for this purpose a simple analytical relationship is desirable.
The rate of CaSO4 precipitation depends on the concentration of Ca2+ and SO42-, but it
will not exceed the rate of SO2 supply. As a limiting case, we consider that all SO2 passing the reaction zone, i.e., from the front of the two-phase zone to the front of the
Gas saturation
Direction of flow movement
Dry-out zone Two-phase zone

37
dry-out zone, is converted to a precipitate of CaSO4. Because under the quasi-steady state conditions the dissolution and precipitation occur at the same time, the effect on the pore volume is related to the volume change for dissolved CaCO3 to convert to CaSO4. The molar volume of CaSO4 and CaCO3 is 46 and 36.7 cm3/mol, respectively. The resultant volume increase due to the conversion is 9.1 cm3/mol.
As illustrated in Figure 3.2, under the quasi-steady state, when the front of the dry-out zone advances a distance dL, the front of the two-phase zone also advances dL. Since the advance is accompanied with CaSO4 precipitation in the incremental element 2 of the two-phase zone, the consumed SO4
2- is made up by SO2 from element 1. However, the change can also be viewed as moving element 1 to the position of element 3. After the front of the two-phase zone moves the full length of this zone L, the front of the dry-out zone will also advance the distance L. By denoting pdV the volume change due to precipitation of CaSO4 in the incremental element, and φdV the total pore volume of the incremental element, under conditions of the aforementioned quasi-steady state and total conversion of SO2 to sulphate there should be
AdLdtM
dVdV SOP
φργ
φ
)/( 2
•
= (3.3)
where •
M is the mass flow of the supercritical phase, 2SOγ is the volume fraction of SO2 in this flow, ρ is the density of the flow, dt is the time increment corresponding to the advance dL, φ is the porosity of the rock in the zones, and A is the cross section area.
As dtdL
AM
=
•
ρφ, we have
2SOP
dVdV
γφ
= (3.4)
That is, the precipitation is constant and equal to the fraction of SO2 in the plume, independent of the velocity of the plume and the porosity of the rock. In reality, the conversion of SO2 to CaSO4 would depend on the moving velocity of the plume: more CaSO4 would form when the plume moves more slowly. However, the maximum conversion limit is 2SOγ . With this relation we can estimate the effect of SO2 on the porosity. By considering that all SO2 which passes the two-phase zone is consumed by
precipitation, the porosity decrease due to SO2 is )/
1.9( 2
ργ
wSO , where w is the molar weight
(g/mol) of the flow of CO2 mixture. The estimate of the porosity change increases with pressure and SO2 fraction. For a high-end estimate we use the CO2 stream with 2.9 vol % SO2 (the stream considered in the previous IEA GHG report PH4/32) at 20 MPa and 330K. The resulted pore volume decrease due to SO2 is 0.44%. It should be emphasized

38
that this is for the extreme case where SO2 conversion to CaSO4 is 100 percent. In other words, the maximum effect of SO2 on the injectivity under the discussed conditions is to decrease the porosity by 0.44%, which is still much less significant compared with the wet cases.
Figure 3.2 Sketch for determination of SO2 conversion to CaSO4.
For precipitation of other sulphates, such as alunite in sandstone formations (Xu et al., 2007), similar analyses can be made to estimate the impact on the porosity. The key point is that in the two-phase zone, the reaction of SO2 is limited. Moreover, dissolution accompanies precipitation and the related pore volume decrease is much smaller than in the wet cases, where dissolved species migrate and precipitate in the downstream. With the dry-out effect, precipitation of alunite, which is shown to cause substantial porosity reduction by simulation studies for a “wet case” of sandstone formation (Xu et al., 2007), would not cause much decrease of pore volume. As an example we consider the following thermodynamically-plausible reaction for alunite formation, where the reactants (except dissolved gas species) and products are primary and secondary rock minerals, respectively, of the sandstone formation (Xu et al., 2007):
KAlSi3O8+Mg5Al2Si3O10(OH)8+2SO2+O2+5CO2 = KAl3(OH)6(SO4)2+5MgCO3+6SiO2 (K-feldspar) (chlorite) (alunite) (magnesite) ΔG=-546 kJ/mol (3.5)
Gas saturation Direction of flow movement
Dry-out zone Two-phase zone
dL dL
Element 1
Element 2 Element 3
L

39
where ΔG is the change of Gibbs free energy. With the 2.9% SO2 discussed earlier, the estimated volume decrease associated with the precipitation of alunite is 5.6%. This is a significant decrease, but the value is still less than a quarter of the value calculated from the result of Xu et al. (2007). This example again demonstrates that, when the precipitation and dissolution occur simultaneously, the volume effect would be much smaller in comparison with the “wet case”.
An important consideration of our model is that SO2 would not cause dissolution and precipitation of minerals without liquid water. Dry gas injection has been known to cause evaporation of water and precipitation of salts, resulting in reduced injectivity (see, e.g., Pruess and García, 2002; Giorgis et al., 2007; Motealleh and Bryant, 2007; Zuluaga and Lake, 2008), and injection of dry CO2 could cause the same phenomena (see, e.g., Giorgis et al., 2007; André et al., 2007; Burton et al., 2008; Gaus et al., 2008; Pruess and Müller, 2009; Pruess 2009). Our model does not include the reduction of injectivity due to the precipitated salts other than sulphates related to SO2. However, our results suggest that, compared with the predicted effect of the precipitated salts, where the resulted porosity reduction could be over 50% (see, e.g., Burton et al., 2008), the effect of SO2 is insignificant.
Bryant and Lake (2005) have discussed the effect of SOx and NOx on CO2 injectivity, and suggested that the net change in pore volume is likely to be small, and thus the effect on injectivity is likely to be insignificant. With our simple model such suggestions can be verified readily.
A recent study on dissolution of SO2 impurity from injected CO2 plume in formation water concludes that even after 1000 years, 65 to 75% of the SO2 will remain in the CO2 phase due to mass transfer limitation (Crandell et al., 2010). This slow release of SO2 would largely reduce its impact on brine pH. Although this work does not concern chemical reactions, according to its conclusion SO2 dissolution into the water will be slower than previously considered. Since low concentration leads to less dissolution and precipitation, the impact of the less than 100 ppmv SO2 in the present study (see Table 1.1) due to the dissolution/precipitation mechanism would be even less.
3.1.3 Reaction of SO2 with Rocks in the Dry-Out Zone
Having discussed the reactions of SO2 with the presence of water, now we consider the reactions of SO2 in the dry phase. Sulphation of CaCO3 according to
CaCO3 + SO2 + ½ O2 = CaSO4 + CO2 (3.6)
has been studied at high temperatures for the application of sulphur removal using limestone from pressurized combustors. At ambient temperature the reaction is thermodynamically favoured but likely too slow to be detected. Based on reported values of rate constants and activation energy determined at high temperatures (Hu et al., 2006), a calculation suggests that sulphation in the gas phase will be slower by some 5 orders of magnitude than in the water phase. It should be noted that in the dry-out zone there can

40
be some water vapour due to evaporation of immobile water, which would increase the reactivity of SO2. However, since there is no liquid phase, dissolution and migration of reaction products would not occur. Moreover, if the sulphation does take place, the rate would drop greatly once a layer of CaSO4 forms - because of the larger volume of CaSO4 it will form a dense surface layer and retard mass transfer. For the above reasons it does not appear that sulphation by dry SO2 will be important for the injectivity, as the injection period may end before the effect can be observed.
3.1.4 The Possibility of Pore Plugging by Elemental Sulphur
Co-injection of H2S, as mentioned earlier, has been practiced for 20 years in Canada. There were also occasions of injection with water. We have not found any reports of injectivity issues with the co-injection. There have been a number of incidents of acid gas breakthrough at neighbouring producing wells instead. In the absence of O2, formation of pore-plugging sulphates would be limited. However, if SO2 and H2S are co-injected, such as in the case where the same storage site receives CO2 streams from both pre-combustion removal plants and post-combustion capture plants, a concern has been raised over the possibility of the occurrence of the Claus reaction
2H2S + SO2 = 3S + 2H2O (3.7)
which would result in deposition of solid sulphur in the rock pores. This reaction can occur at temperatures close to that of CO2 storage operation: it has been reported that the reaction could take place at temperatures as low as 40-60°C (Ledoux et al., 2000). The reaction needs a catalyst, but it can be catalyzed by alumina on silica. Potential catalytic sites exist in formation rocks such as clay surfaces. Unlike the case of SO2 in the dry-out zone discussed earlier, the Claus reaction can take place in the gas phase, and produce water. Therefore, the dry-out zone does not exclude the possibility of this reaction occurring, and the reaction may last for the whole period of injection operation. It does not require minerals as reactants and the pore volume decrease due to formation of sulphur could be significant. However, without catalysts the rate of the reaction may become insignificantly low. Thus, in the case the reaction is catalyzed by minerals in the rock pores, after depositing a thin layer of sulphur the rate would drop because of reduced contact with catalysts. How low the rate of the reaction will be without catalysts is unclear. Another matter is that the formation of elemental sulphur will be reduced by H2, which co-exists with H2S in CO2 streams from pre-combustion capture. With the reaction
H2 + S = H2S (3.8)
the deposition of elemental sulphur should be alleviated. In this scenario the impurity H2 has a positive effect. Finally, O2, which co-exists with SO2, could play a positive role by:
3O2 + 2H2S = 2SO2 + 2H2O (3.9)
O2 + S = SO2 (3.10)
thus preventing or reducing sulphur deposition. On the other hand, potentially H2 and O2 may react to form water if catalyzed and be unavailable for the above reactions.

41
Unfortunately, there are many uncertainties in this reacting system. Given the potential of the Claus reaction to severely reduce the injectivity of CO2 over many years, we recommend investigating the envisaged reaction system experimentally under CO2 injection conditions, and we ourselves have plans to do this.
3.2 Reactions with Caprocks and Mineral Sequestration of CO2
Unlike the injectivity issue, which concerns only a relatively short period of time, the impacts of impurities on the integrity of caprocks need to be considered over the long term. Moreover, reactions in the presence of water need to be assessed, as the acid-forming impurities would dissolve in water eventually together with CO2, given a sufficiently long time. For carbonate rocks the effects of reactive impurities such as SO2 and NOx have already been discussed. In the presence of water they would form H2SO4 and HNO3 and promote dissolution of rocks. H2SO4 may also cause precipitation but HNO3 will not. Unless these impurities are all retained by formation water before they reach the caprock in the CO2 plume, they would negatively impact on caprock integrity.
Thermochemical evaluations are deemed useful for the study of the long-term effects, because the reactions with minerals can be very slow. We have made assessments for the reactions using thermochemical calculations. Regarding caprock integrity, we have used quartz, K-feldspar and limestone as model species, with the latter two representing reactive constituents for sandstone and carbonate caprocks, respectively, which are susceptible to acid attack. Quartz is used to represent pure sandstone. According to our results dissolution of quartz is not affected by SO2 and NOx thermochemically. In the case of K-feldspar, whose dissolution has been well studied in modeling of the impact of CO2 injection on caprocks (see, e.g., Johnson et al., 2002; Gaus et al., 2005), the dissolution increases slightly in the presence of SOx and NOx. The most pronounced effect of SOx and NOx is seen in limestone, where the dissolution increases by 50% with the presence of 1.5 vol % total concentration of SOx and NOx. However, the effect decreases with decreasing concentration. When the total concentration of SOx and NOx in the CO2 stream is reduced to below 200 ppm, as in the case considered by IEA GHG, the increase in the dissolution becomes negligible. The calculation results will be shown later in the section of evaluations for selected scenarios.
The effect of O2 would be mainly related to oxidation of SO2 to form H2SO4 and oxidation of NO to form NO2 and hence HNO3. By itself O2 can react with certain minerals. As an example, dissolved O2 can combine with minerals in rocks which contain reduced forms of iron, manganese, etc., causing decomposition of the rocks. If the only iron mineral is hematite, for instance in the case studied by Xu et al. (2007), O2 would have no impact. If dissolved ferrous ions are present in the water, however, O2 could react with them to form ferric oxide-hydrate or ferric hydroxide, which has the potential to block permeable formations even in small quantities (Zettlitzer et al., 2010). Oxidation of sulphides in rocks can produce sulphates. For example, oxygen can react with pyrite (FeS2) to form FeSO4. The sulphate, FeSO4, is soluble in water (ca. 260 g/L at 50°C). This would result in very acidic local pockets, facilitating dissolution of the rock. If the oxidized location is not in contact with bulk water, hydrates which are soluble would form. The resultant mechanical stress in the rock may lead to cracks. However, the above

42
reaction requires relatively large amounts of O2. In the case of low O2 levels, or where most O2 has been consumed by oxidation of metallic minerals and/or retained in the residual CO2 phase (unlike the acidic impurities, O2 has low solubility and would stay in the CO2 phase) before the plume reaches the top rock, the impact on caprock integrity would be limited. Alternatively, if the caprock has low sulphide content, the impact of O2 would also be expected to be small.
Concerns over the chemical effects of two other impurities CO and H2 have also been raised (Jacquemet et al., 2009). As has been discussed, CO is highly reductive and can be easily oxidized to CO2. Particularly, in water CO can be oxidized by the reaction
CO + H2O = CO2 + H2 (3.11)
As a result, the concentration of CO should be low. H2 is also reductive but not toxic nor corrosive. CO and H2 may react with certain minerals, e.g., CaSO4 and reduce it to CaS, but dissolution and precipitation will not be involved. With regard to chemical effects, CO and H2 are not expected to be as important as SO2, NOx and H2S.
As for other impurities shown in Table 1.1, COS exists in trace amounts in CO2 streams from pre-combustion capture. It can decompose to CO and H2S and its toxicity is lower than those two species. NH3 can exist in ppm levels in CO2 from post-combustion capture. In water it can form NH4OH which is weakly basic and can increases the pH; however, given the likely low concentration level such effects are expected to be limited.
3.3 Corrosion of Well Materials
Reactive impurities themselves will increase the corrosion potential. Dissolved oxygen is known to be a major source of corrosion by water. H2S, SO2, NO2 are all corrosive. In addition, chlorine is very corrosive for pipeline and concrete structures. In oxyfuel combustion, coal chlorine will be released to the gas phase as HCl. However, most of the chlorine can be removed together with condensed water. Under high-pressure conditions of transport and injection, the partial pressure of the low-concentration impurities could increase to significant levels, leading to increased corrosion potential. The impurity effects on steels have been addressed in a recent IEA GHG report (IEA GHG 2010).
Acid solutions are very corrosive for cements. The most corrosive acids in this regard are believed to be those that produce easily soluble calcium salts, such as nitric, hydrochloric or acetic acid (Pavlík, 2000). The acids react with hydrated cement compounds and unhydrated cement residues, leaching out the prevailing calcium ions into the solutions. A soft and porous layer of decalcified corrosion products remains on the surface, which has practically no binding and protective properties (Pavlík and Unčík, 1997).
NOx in CO2 streams would be very harmful to cements because of its relatively high concentration (from oxyfuel combustion) and the resultant HNO3, whose calcium salts are soluble. Moreover, sulphuric acid or sulphate attack on cements is well known (see, e.g., Gaus et al., 2008). Sulphates, HSO4
- and SO4-2, react with cements to produce
additional gypsum, CaSO4.2H2O, and ettringite, (CaO)3(Al2O3)(CaSO4)3·32H2O, which

43
could cause volume expansion and loss of cohesion of the cement matrix, leading to cracking, pitting and spalling. As SO2 in the CO2 streams has a high potential to form sulphates when NOx and O2 are present, the damaging effect of SO2 on cements is anticipated. Once the protection by cements is lost, the steel casings of the wells would be under attack by acids and O2. Through the damaged cements and/or damaged casings, leakage of injected CO2 with toxic impurities could occur.
In acid gas injection operations in western Canada, H2S and CO2 are co-injected into deep hydrocarbon reservoirs and saline aquifers, with the H2S content ranging from 2 to 83%. Bachu and Gunter (2004) pointed out that as H2S is more corrosive than CO2, the success of acid-gas injection operations indicates that the engineering technology for CO2 geological storage is in a mature stage. However, the acid gas does not contain SO2, NOx and O2. With these impurities CO2 would be more corrosive than with H2S alone. Small amounts of SO2, NOx and O2 have been injected with CO2 into oil reservoirs since at least the 1960s, according to a review by Taber (1985), but the concentration ranges are not known. Taber (1985) noted that operators of the injections normally insisted that the SO2 and NOx concentrations be reduced to minimize corrosion before the gas went through the high-pressure stages in the compressors. Corrosion of wells was not mentioned, and presumably was not a concern as long as the compressors do not fail. However, we have not found reports subsequent to Taber’s on injection of SO2, NOx and O2. Very recently a review on sulphur from oxyfuel combustion (Stanger and Wall, 2011) briefly discussed the effect of SO2 on CO2 storage, where only Taber’s work was cited, suggesting no other significant reports have been available.
As the impurities are much less reactive in the absence of water, during the injection period, corrosion may not be a severe issue owing to the desiccation of the well zone. However, after the injection period when water is once again present, the acidic impurities would increase the corrosion. In the case that the steel casings are taken out prior to well abandonment (IEA GHG, 2010), only corrosion of the cements needs be assessed. The corrosive effects of the impurities in the high-impurity oxyfuel CO2 stream are assessed in the section of evaluation for selected scenarios.
4. Fate of Hazardous Impurities
Table 4.1 shows the fate of several hazardous impurities according to thermochemical calculations using the software and database package FactSageTM for selected conditions. CO, SO2, H2S and NOx would form dissolved and/or precipitated species, although it can take a very long time for these species to form. Elemental mercury is volatile at combustion temperatures and present in CO2 streams from oxyfuel combustion. However, at lower temperature it can be adsorbed and oxidized, by coal chlorine, for example, on solid surfaces. The oxidized mercury species are soluble. Based on the calculated results of Table 4.1, the end products are all dissolved species. Therefore, as long as the brine does not contaminate fresh-water aquifers, the Hg would be retained in the aqueous phase.
In the event of CO2 leakage, the dissolved hazardous impurities could be released and enter the atmosphere together with CO2. However, since CO2 at high concentrations is

44
hazardous by itself if breathed in for prolonged periods, causing adverse health effects varying from headache to death (see, e.g., United States OHSA Regulated Hazardous Substances Vol. 1), the effects of the impurities may become a secondary issue. This will be assessed in another study.
Table 4.1 Fate of reactive impurities according to thermochemical calculations*.
Species End Product CO CaCO3, CO2(aqueous), HCO3
-, CO32-
SO2 CaSO4, SO42-, HSO4
- H2S H2S(aqueous), HS-, SO4
2-, HSO4-
NOx NO3-,NO2
-, HNO2 Hg HgCl+, HgCl2, HgCl3
-, HgCl42-
* Calculated using FactSageTM for the conditions of 330 K, 10-20 MPa, 1 molal CO2 and 50000 mg/L salinity. Another important point is that the recommended impurity limits for CO2 transport (Table 1.2) have taken into account short-term exposure limits for H2S, CO, SOx and NOx
in CO2. The limits give the maximum amount of a substance that one can be exposed to without adverse health effects for 15 minutes. As can be seen from Tables 1.1 and 1.2, in the CO2 streams considered by IEA GHG, the concentrations of H2S, CO, SOx are lower than the recommended levels and the concentration of NOx is the same as the recommended level. Therefore, at least for short-term exposures, the hazard of the impurities leaked from storage sites is less than that due to sudden leakages from pipelines.
5. EOR and Depleted Gas Fields
In the above discussions we have focused on CO2 storage in saline formations, which have the largest storage potential. For EOR and depleted gas fields, CO2 streams from oxyfuel combustion with high levels of O2 may be a concern. Pipitone and Bolland (2009) discussed O2 concentration requirement for EOR, and showed that O2 in three existing EOR projects is at ppm levels. Higher O2 concentration can cause:
1. Overheating at the injection point;
2. Oxidation in the reservoir with higher oil viscosity and increased extraction cost;
3. Increased biological growth with unknown effects on oil production.
They also recommended that due to the lack of fundamental research development and industrial experience, acceptable tolerance to O2 should be evaluated case by case.
High level of O2 would promote the growth of aerobic bacteria, which cause biodegradation of crude oil and adversely affect oil recovery and refining (see, e.g., Palmer, 1993; Jones et al., 2008). The bacteria, along with other types of bacteria which

45
do not require O2, would also cause corrosion and plugging of equipment and injection wells (see, e.g., Collins, 1977). Wilkinson et al.(2010) discussed the risk of formation of elemental sulphur when O2 contacts H2S. This is the same issue related to the Claus reaction discussed earlier. As has been mentioned earlier, small amounts of SO2, NOx and O2 have been injected with CO2 into oil reservoirs for more than 30 years (see, e.g., Taber, 1985). Although the concentrations were not reported, according to an IEA GHG expert’s information, in at least one instance, O2 at about 2% concentration level has not affected the EOR operation.
With the low-impurity oxyfuel stream (Case 3 in Figure 1.1) where O2 concentration is 100 ppm, no negative impacts are foreseen for either EOR or depleted gas field operations. Bryant and Lake (2005) have discussed the effect of SOx and NOx on EOR, with respect to the factors which affect the effectiveness of the operations such as minimum miscibility pressure, mobility ratio and gravity number. The conclusion is that the impurities at typical flue gas levels are unlikely to affect the recovery adversely. Regarding depleted gas fields, Nogueira and Mamora (2008) studied experimentally the effects of flue gas impurities, including N2, O2, H2O, SO2, NO2, and CO, with the conclusion that injection with less than 1 vol % impurities would have little effect on the volume of CO2 to be stored, but allow savings of separation cost.
6. Evaluations of Selected Scenarios
As the impact of impurities increase with their concentrations in the CO2 streams, and oxyfuel streams have the highest levels of both non-condensable impurities (ca. 15 vol % N2, O2 and Ar) and most acidic impurities (NOx and SOx) (Table 1.1), we use the high-impurity CO2 stream from oxyfuel combustion to assess significant impurity effects for selected cases in the following.
6.1 Storage Capacity and Injectivity under Representative Reservoir Conditions
The most significant impact is reduction of storage capacity. IEA GHG sponsored a study of storage coefficients for CO2 storage in deep saline formations and depleted hydrocarbon reservoirs (Gorecki et al., 2009), aiming at more accurate estimation of storage capacity of available resources. We have applied our findings to estimation of storage capacity for several representative cases evaluated in that IEA GHG study. In Table 6.1, storage conditions and storage coefficients for the representative cases are shown, where the storage coefficient is defined as
22
2
COCO
CO
VG
Eρ
= (6.1)

46
where GCO2 is the estimate of storage capacity in terms of CO2 mass, VCO2 is the total pore space available for CO2 storage and 2COρ is the density of CO2. As can be understood, the estimate of storage capacity is based on pure CO2. With non-condensable impurities in the CO2 stream the storage capacity will be smaller. Here we introduce an impurity factor F for estimation of the storage capacity for impure CO2:
EFVG COCOCO 222 ρ= (6.2)
where F is the ratio of the CO2 storage capacity in the presence of impurities to that in the absence of impurities. This ratio is numerically equal to the normalized storage capacity defined by Equation 2.5. The value of F is evaluated for each case in Table 6.1 and shown in the last column. As can be seen, in the shallow formation with a depth of 895 m the CO2 storage capacity drops to about 40% of that for pure CO2. In other words, more than double the number of storage resources will be required for storing the same quantity of CO2 in the high-impurity stream.
Table 6.1 Effect of impurities on CO2 storage capacity
Cases Depth (m)
P (MPa)
T (°C)
T grad (°C/m)
Ea
(-)
Storage Capacity (kg CO2/m3 pore) Fb
(-) Pure Impure
Shallow-Low Temp 895 9.2 33 0.020 0.07 647.68 253.96 0.392
Shallow-Mid Temp 895 9.2 38 0.025 0.10 540.97 231.20 0.427
Shallow-High Temp 895 9.2 45 0.033 0.09 364.48 208.72 0.573
Median-Low Temp 2338 24 62 0.020 0.12 750.04 550.35 0.734
Median-Mid Temp 2338 24 75 0.025 0.13 675.00 493.67 0.731
Median-High Temp 2338 24 92 0.033 0.13 584.92 432.23 0.739
Deep-Low Temp 3802 38.8 92 0.020 0.15 777.66 611.13 0.786
Deep-Mid Temp 3802 38.8 113 0.025 0.16 700.29 551.25 0.787
Deep-High Temp 3802 38.8 141 0.033 0.17 611.35 485.19 0.794 a Storage coefficient. b Capacity factor given as the ratio of the CO2 storage capacity in the presence of impurities to that in the absence of impurities.
However, as the depth of the formations increases, the effect of impurities on CO2 storage capacity decreases. As shown in Table 6.1, at a depth of 3802 m, the capacity approaches 80% of that for pure CO2.
The effects of the impurities on CO2 injectivity, based on Equation 2.17, are shown in Table 6.2. As has been discussed earlier, the injectivity is dependent on density and viscosity. As the impure CO2 stream has lower viscosity, the effect of lower density is

47
partly compensated and the injectivity reduces by a smaller degree compared with the storage capacity. Both the density and viscosity increase with pressure and decrease with temperature, and the resultant injectivity is relatively insensitive to the depth of injection. For the scenarios of Table 6.2: the relative injectivity at the median temperature changes little with increasing depth. It can also be seen that the relative injectivity is less sensitive to temperature at greater depths. This would be generally true, as the density difference of pure and impure CO2 decreases with increasing pressure, and the viscosity difference decreases with increasing temperature, which corresponds to increasing depth.
Table 6.2 Effect of impurities on CO2 injectivity
Cases Depth (m)
P (MPa)
T (°C)
T grad (°C/m)
Viscositya (-)
Injectivityb
(-)
Shallow-Low Temp 895 9.2 33 0.020 0.38 1.0
Shallow-Mid Temp 895 9.2 38 0.025 0.45 0.94
Shallow-High Temp 895 9.2 45 0.033 0.77 0.74
Median-Low Temp 2338 24 62 0.020 0.72 1.0
Median-Mid Temp 2338 24 75 0.025 0.75 0.98
Median-High Temp 2338 24 92 0.033 0.79 0.93
Deep-Low Temp 3802 38.8 92 0.020 0.81 0.97
Deep-Mid Temp 3802 38.8 113 0.025 0.83 0.95
Deep-High Temp 3802 38.8 141 0.033 0.87 0.91 a Relative viscosity given as the ratio of the viscosity in the presence of impurities to that in the absence of impurities. b Relative injectivity given as the ratio of the injectivity in the presence of impurities to that in the absence of impurities.
6.2 Storage Integrity
With regard to the chemical effects of impurities, dissolution of caprock, a major concern related to storage integrity has been evaluated by use of representative rock minerals. As has been mentioned earlier, dissolution of quartz is not affected thermodynamically by acid impurities. The results of thermochemical calculations (using the software and database package FactSageTM) for dissolution of K-feldspar and calcite and formation of secondary minerals are shown in Tables 6.3 and 6.4. As can be seen, the effect of SOx and NOx on K feldspar dissolution is small. With 5000 ppm SOx + 1 mol% NOx, the dissolution increases only by about 3.5%. When the total concentration of SOx and NOx is reduced to 150 ppm, the effect on dissolution is negligible. Moreover, potential secondary minerals dawsonite and muscovite would result in cementation of the surface layer of the rock and thus compensate for the effect of dissolution. In the case of calcite, the impurity effect is appreciable. With a total SOx and NOx concentration of 1.5 mol%

48
the dissolution of calcite increases by 50%. However, the effect decreases quickly with decreasing concentration of the acid impurities. When the total concentration of SOx and NOx is reduced to 150 ppm, the difference with the pure CO2 case is less than 0.4%. On the other hand, the precipitation of anhydrite is not significant and cementation of the rock would be limited.
Table 6.3 Dissolution of K-feldspar and formation of secondary minerals*
K-feldspar dissolution
(mol/L)
Dawsonite formation (mol/L)
Muscovite formation (mol/L)
CO2 alone 1.8706 0.7774 0.3644 Impure CO2 50 ppm SOx+100 ppm NOx 1.8709 0.7773 0.3645 500 ppm SOx+1000 ppm NOx 1.8742 0.7772 0.3657 5000 ppm SOx+1 mol% NOx 1.9403 0.7763 0.3779 *Conditions: 50°C; 20 MPa; 50000 mg/L salinity; 100 g CO2; 1 L H2O; 4000 cm3 KAlSi3O8; SOx and NOx are assumed to be fully oxidized to H2SO4 and HNO3. All possible compounds in the FactSageTM database are considered as potential products.
Table 6.4 Dissolution of calcite and precipitation of anhydrite*
Calcite dissolution (mol/L)
Anhydrite precipitation (mol/L)
CO2 alone 0.03734 - Impure CO2 50 ppm SOx+100 ppm NOx 0.03748 - 500 ppm SOx+1000 ppm NOx 0.03894 0.0001670 5000 ppm SOx+1 mol% NOx 0.05644 0.01052 *Conditions: 50°C; 20 MPa; 50000 mg/L salinity; 100 g CO2; 1 L H2O; 4000 cm3 CaCO3; SOx and NOx are assumed to be fully oxidized to H2SO4 and HNO3. All possible compounds in the FactSageTM database are considered as potential products. The impact of the acid impurities on injection wells is evaluated with regard to dissolution of Ca(OH)2 and CSH (calcium silicate hydrate), the major cement components. As has been discussed, the greatest concern is over the post-injection stage, where acids formed in water attack well cements. The results of thermodynamic calculations for dissolution of Ca(OH)2 and Ca3Si2O7·3H2O and formation of gypsum are shown in Table 6.5. With increasing concentration of SOx and NOx, calcium ion concentration in the solution increases and pH decreases consistently. The necessity of reducing the acid impurities is evident.
Table 6.5 Dissolution of Ca(OH)2 and Ca3Si2O7·3H2O and formation of gypsum*
Solid species Gas composition CaSO4·2H2O formation (mol/L)
Ca++ in water (mol/L)
pH of water

49
Ca(OH)2
CO2 alone - 0.00869 11.515 50 ppm SOx+100 ppm NOx - 0.00884 11.512 500 ppm SOx+1000 ppm NOx - 0.01026 11.479 5000 ppm SOx+1 mol% NOx 0.00094 0.01911 11.344
Ca3Si2O7·3H2O
CO2 alone - 0.4307 10.805 50 ppm SOx+100 ppm NOx - 0.4309 10.805 500 ppm SOx+1000 ppm NOx 0.00074 0.4322 10.804 5000 ppm SOx+1 mol% NOx 0.01096 0.4423 10.800
*Conditions: 50°C; 20 MPa; 50000 mg/L salinity; 100 g CO2; 1 L H2O; 4000 cm3 Ca(OH)2 or Ca3Si2O7·3H2O (approximate); SOx and NOx are assumed to be fully oxidized to H2SO4 and HNO3. All possible compounds in the FactSageTM database are considered as potential products. With 150 ppm total concentration of SOx and NOx, the Ca++ concentration in water increases by over 1.5% compared with the CO2 - alone case with Ca(OH)2, suggesting increased dissolution. By contrast, the Ca++ concentration with Ca3Si2O7·3H2O does not increase appreciably. The formation of gypsum is not predicted under this low acid- impurity level. The increase of calcium dissolution in Ca(OH)2 is more significant than that seen in dissolution of calcite and K-feldspar. With the loss of the protection by cements, the steel casings will also be attacked. Appropriate measures for countering the adverse impact, such as improving cement sheath and casing quality (if the casings are not taken out) prior to sealing the wells, may be required.
7. Impact of Impurities on the Cost of CO2 Storage
The most significant impact of impurities on the cost in the scope of the present study would arise from lower density of impure CO2, which results in lower mass flow rate of CO2 streams with given size of pipeline and lower injectivity. We have evaluated the impact of the impurities using a cost curve for CO2 storage in North America developed by Dahowski et al. (2004). The cost curve is based on available data for over 300 onshore candidate geological reservoirs, including deep saline aquifers and depleted oil and gas fields, in the United States and Canada with estimated storage capacities. The storage cost, which includes the cost of injection and any offsetting revenue related to resultant enhanced oil or gas recovery, is given as a function of cumulative CO2 to be stored. For deep saline aquifers it is assumed that the injection only requires injection wells. The cost curve shows that deep saline aquifers account for a majority of the storage capacity and the related storage cost is 12-15 USD per tonne CO2, with an average of $12.5/tonne CO2. In our estimation of the impact of the impurities on the cost, we consider that the lower injectivity of impure CO2 requires an increase of the number of injection wells, assuming the wells are standardized for pure CO2. From Table 6.2 we take an average value of injectivity 0.94 for impure CO2 stream. To inject the same amount of CO2 using the standardized wells, the number of the wells needs to increase to 1/0.94 = 1.06 times that for pure CO2, and hence the cost of injection increases by 6%. The resultant cost curve for impure CO2 is shown in Figure 7.1, along with the original cost curve for pure CO2. In this figure the predominant flat portion corresponds to the storage cost in deep saline
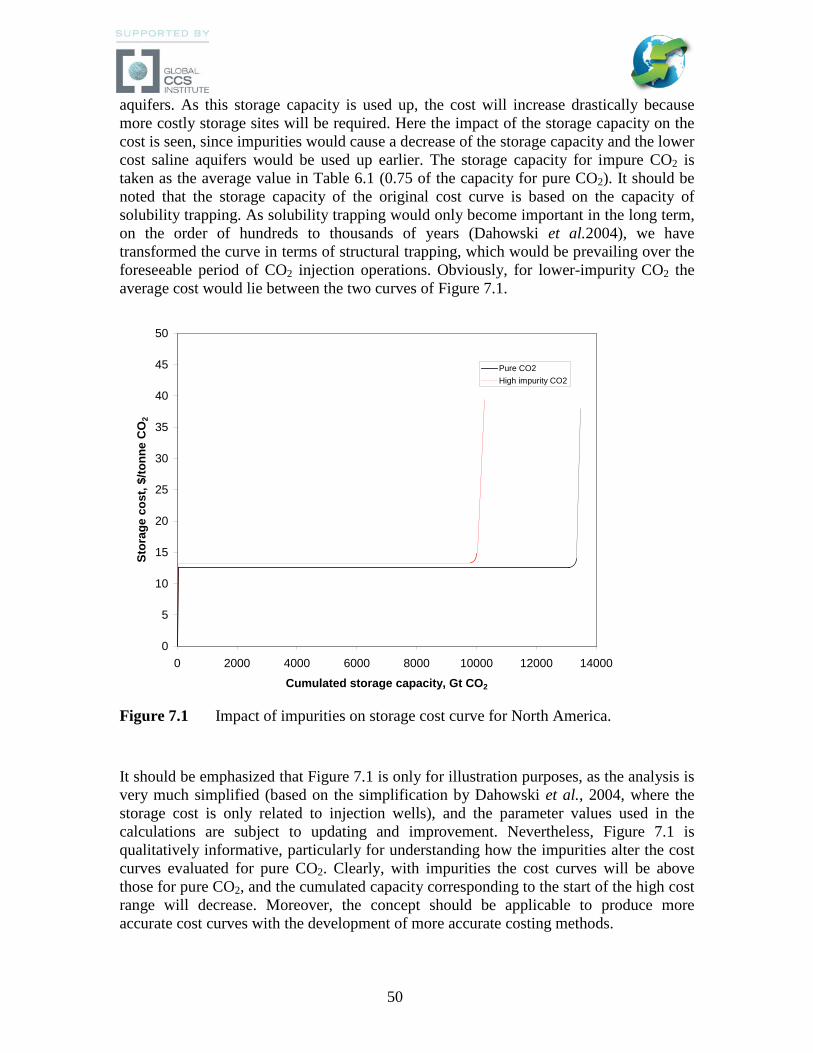
50
aquifers. As this storage capacity is used up, the cost will increase drastically because more costly storage sites will be required. Here the impact of the storage capacity on the cost is seen, since impurities would cause a decrease of the storage capacity and the lower cost saline aquifers would be used up earlier. The storage capacity for impure CO2 is taken as the average value in Table 6.1 (0.75 of the capacity for pure CO2). It should be noted that the storage capacity of the original cost curve is based on the capacity of solubility trapping. As solubility trapping would only become important in the long term, on the order of hundreds to thousands of years (Dahowski et al.2004), we have transformed the curve in terms of structural trapping, which would be prevailing over the foreseeable period of CO2 injection operations. Obviously, for lower-impurity CO2 the average cost would lie between the two curves of Figure 7.1.
0
5
10
15
20
25
30
35
40
45
50
0 2000 4000 6000 8000 10000 12000 14000
Cumulated storage capacity, Gt CO2
Stor
age
cost
, $/to
nne
CO
2
Pure CO2High impurity CO2
Figure 7.1 Impact of impurities on storage cost curve for North America.
It should be emphasized that Figure 7.1 is only for illustration purposes, as the analysis is very much simplified (based on the simplification by Dahowski et al., 2004, where the storage cost is only related to injection wells), and the parameter values used in the calculations are subject to updating and improvement. Nevertheless, Figure 7.1 is qualitatively informative, particularly for understanding how the impurities alter the cost curves evaluated for pure CO2. Clearly, with impurities the cost curves will be above those for pure CO2, and the cumulated capacity corresponding to the start of the high cost range will decrease. Moreover, the concept should be applicable to produce more accurate cost curves with the development of more accurate costing methods.

51
8. Uncertainties and Recommended Studies
We have already discussed uncertainties with respect to the occurrence of the Claus reaction, which may plug the pores of formation rocks and reduce the injectivity. Other uncertainties of importance are discussed in the following.
8.1 The Accuracy of Equations of State
For pure CO2 there are reported experimental P-V-T data and equations of states which are more accurate than cubic equations of state in the supercritical range. However, there are no data for CO2 mixtures under the studied conditions. Equations of state require experimental data to calibrate parameter values, and the predicted results are expected to be reliable only in the calibrated range. In this study we have mainly used the Peng-Robinson equation for both pure CO2 and the mixtures because of its relative simplicity. The results are not expected to be highly accurate. However, they are expected to be reasonable and show the correct trends. It is possible to use experimental data or more accurate equations of state for pure CO2, but for mixtures no results of other equations of state can be proved to be better than that from the Peng-Robinson equation, as there are no data for validation. For accurate quantification of the effects of impurities, experimental data under the conditions of CO2 storage operations are required both for calibration of the parameters of equations of state and validation of the predictions by the equations.
8.2 Viscosity
Viscosity affects injectivity and migration of the CO2 stream. Several methods exist which enable calculation of the viscosity of gas mixtures under high pressure (Poling et al., 2001). However, we have not found experimental data for gas mixtures under the conditions of the present study to validate the results.
Whereas the effect of impurities on the viscosity is not expected to impact CO2 storage operations as much as in other regards, such as density and buoyancy, for computer simulations the viscosity value is required as a function of composition, pressure and temperature. Accordingly, experimental data in the storage operation range are needed to verify calculated results, modify calculation methods, or establish empirical formulas.
8.3 Effects on the Reactivity of Supercritical CO2 Phase
In this study we have not considered the effects of impurities on the reactivity of supercritical CO2 phase, particularly water-saturated supercritical CO2 phase. Jacquemet et al. (2008) reported that a dry H2S-CO2 supercritical phase (66 mol % H2S) at 50 MPa and 120-200°C showed significant reactivity with crushed cement. With regard to water-saturated supercritical CO2, Choi et al. (2010) reported that addition of 4 mol % O2 and 1 mol % SO2 drastically increased the corrosion rate of a 13 Cr steel at 8 MPa and 50°C. Aqueous phase reactions have been the focus of the studies on the chemical reactions in CO2 storage, and the observations of reactions in the supercritical CO2 phases are new.

52
Given the low concentration levels in our studied CO2 streams, we do not expect the effects of the impurities on the supercritical phase reactivity to be significant. However, investigation of such effects is certainly desirable.
8.4 Potentially Useful Properties of Impurities for Monitoring
As has been mentioned earlier, Bachu and coworkers (2009 a, b) investigated partitioning of impurities. The partitioning may influence the flow characteristics such as the relative permeability, through the change of interfacial tension between water and the CO2 phase (Bachu and Bennion, 2009 a). We have discussed possible increase of the interfacial tension and decrease of the relative permeability due to the presence of N2, O2 and Ar. Although O2 and Ar have not been investigated with regard to the partitioning phenomenon, we expect them to be enriched together with N2 in the front of the CO2 flow as a result of partitioning, due to their similar properties to N2, and decrease the relative permeability. Here we consider another application of the partitioning effect: Ar impurity may serve as a trace species for monitoring CO2 leakage. Noble gases including Ar have long been used in volcanic gas monitoring (see, e.g., Magro and Pennisi, 1991). Ar has also been used as a tracer to monitor underground movement of injected CO2 (see, e.g., Bennaceur et al., 2004). Ar concentration in air is 0.934%, but in the CO2 stream from oxyfuel combustion, it can comprise over 4%. Considering the high pressure of the injected stream, Ar level may have a noticeable increase near the ground. The point is that Ar may reach the ground surface faster than CO2, due to chromatographic partitioning by soil (after the gas passes through the caprock) as well as by porous formation rocks. It would be of great interest if Ar can serve as an indicator of potential leakage. For instance, with monitoring Ar level at the ground surface, higher than normal Ar level at a local area could suggest that the CO2 is not far away from the surface. Emergency measures should then be taken for potential leakage, and this would leave more time than dealing with an eruption. Ar detectors can be maintained at locations with highest risks of leakage (abandoned injection wells, for instance), in addition to CO2 monitors. In this way, the Ar impurity could make a positive contribution.
Compared with N2, in the high-impurity case (5.8% N2, 4.7%O2 and 4.47% Ar) argon would give a more noticeable change of the ground air composition. Ar is concentrated to 4.8 times its level in air, but N2 is not concentrated. The partial pressure of Ar in CO2 is nearly 1 MPa if the total pressure is 20 MPa. The longer the storage, the higher the Ar concentration in CO2, as Ar dissolves less. Moreover, Ar has lower adsorption on certain inorganic sorbents than N2 and much lower than CO2, which would make the partition more effective. We also consider that Ar may serve as a tracer in fresh water aquifers which have higher risk of contamination by CO2 stored underneath, as Ar may emerge earlier than CO2.
H2 is the candidate for streams from pre-combustion capture when its concentration is appreciable. It has low solubility in water and low levels in air. In the high-H2 stream (1 vol % H2) studied in this work, it is concentrated 20,000 times its level in air. It also has high permeability (high diffusivity and low adsorption level) so that it would more readily get to the ground surface than CO2. However, its reactions with other impurities (O2, for example) and rock minerals are uncertain. If it is mostly consumed by reactions,

53
especially in the long term (this is thermodynamically favoured), its concentration in the gas phase may not be appreciable.
9. Conclusions
The effects of various impurities on CO2 may be generalized into two categories: physical and chemical. Physical effects are concerning phase behaviour, storage capacity, permeation flux, buoyancy, etc. Chemical effects are concerning rock-porosity related injectivity, caprock integrity, corrosion of well materials, hazardousness in the event of leakage, etc. Based on the results of the investigations the effects of non-condensable gas impurities, mainly N2, O2 and Ar, are considered physical, except for the enhancement of chemical effects by O2 through oxidation of SO2 to sulphuric acid and others.
In the studied scenarios of impure CO2 streams where O2, N2 and Ar have the highest levels, the greatest impact of the impurities is physical, i.e., reducing the storage efficiency and the injectivity.
The most significant effect under the studied conditions is the reduction of storage capacity. It has been shown that the non-condensable impurities can cause the reduction of the structural trapping capacity by a degree greater than their molar fractions in supercritical CO2 streams. Particularly, there is a maximum reduction of the storage capacity in a certain pressure range, where the capacity can drop to below 50% of the pure CO2 cases. Non-condensable impurities N2, O2 and Ar are also expected to cause an increase of the interfacial tension between the CO2 phase and water. This would lead to decreased relative permeability of the CO2 flow but increased residual trapping. The injectivity of impure CO2 streams reduces as a result of lower density. However, due to the compensation by increased viscosity the reduction of injectivity is smaller than that of storage capacity. The higher buoyancy of impure CO2 streams would reduce the efficiency of CO2 dissolution in formation water and CO2 trapping in rock pores, and thus reduce the security of CO2 storage in the near to medium terms. The adverse effects on storage efficiency and security may be alleviated by increasing the depth of injection and storage.
SO2 can increase CO2 storage capacity and there will be a maximum increase at a certain pressure. However, in the studied scenarios the concentration of SO2 is low and no appreciable increase of capacity can be expected.
Under the studied conditions, Ar has been shown to have the potential to represent total N2, O2 and Ar for CO2 streams from oxyfuel combustion with regard to the physical effects. The applicability for more general cases should be validated by experimental data. Once the validity is confirmed, the benefits of using Ar-only mixture for both computer simulations and experimental evaluations will be substantial.
With regard to chemical effects on the rocks, the most significant species are SOx, NOx and H2S. NOx can catalyze the oxidation of SO2 to sulphuric acid according to the lead chamber process. Although the effect of catalysis is hard to quantify, when NOx and O2

54
are present, SO2 could be taken as completely converted to sulphuric acid and would cause mineral dissolution and precipitation. However, the impact of SO2 on reduction of rock porosity and injectivity appears much smaller than previously thought, because its contact with water is limited with the development of the dry-out zone. NOx would also promote dissolution of minerals, but would not cause precipitations and reduction of rock porosity. H2S on its own has not been found to reduce the injectivity in acid gas injection operations and computer simulations. However, if H2S and SO2 are co-injected, deposition of elemental sulphur, as a result of the Claus reaction, in the pores over the whole injection period can be a serious concern. Experimental evaluation of this issue is recommended.
For evaluation of the chemical effects on caprock integrity, the presence of water has been taken into account to assess the worst-case scenario. Thermochemical calculations show that SOx and NOx increase dissolution of carbonate rocks and aluminosilicate rocks. However, for CO2 streams considered by IEA GHG in this study where SOx and NOx concentrations are within 100 ppm, the impact on the dissolution of the rocks would not be significant.
Corrosion of injection well materials may not be serious when the CO2 stream is dry, due to desiccation of the well zone in the injection period. However, after termination of injection and return of water, corrosion by the acidic impurities will be an issue of concern. Results of thermochemical calculation suggest that the effect of acid impurities on dissolution of cement constituents is more significant than on dissolution of rocks. When protection by the cement sheaths is lost, the steel casings will also be attacked. Appropriate measures for countering the adverse effects, such as improving cement and casing quality (if the casings are to not taken out) prior to sealing the wells may be required.
Hazardous impurities CO, SO2, H2S, NOx and Hg will form dissolved and/or precipitated species eventually. In the event of CO2 leakage, the dissolved hazardous impurities may be released. However, in the CO2 streams of the studied scenarios, the concentrations of the hazardous impurities are generally lower than the limits recommended for pipeline transport of CO2, where short-term exposure limits have been taken into account. Accordingly, at least for short-term exposures, the hazard of the impurities would be less than that due to sudden leakages of CO2 pipelines.
Concerning CO2 storage costs, we have shown that, based on an existing approach for cost estimation which only considers costs of injection wells, the impact of impurities looks modest. On the other hand, decreased CO2 storage capacity by the impurities can result in earlier reduction of the storage capacity, and increase the storage costs afterwards. We have also illustrated how impurities would impact cost curves evaluated on the basis of pure CO2. With the development of more accurate costing methods, the impact of impurities could be evaluated more accurately.
Acknowledgment

55
Drs. Stephan Bachu and Ernie Perkins of Alberta Innovates as well as Charles Gorecki and Jordan Bremer of the Energy and Environmental Research Centre reviewed the draft report. Their invaluable comments are greatly appreciated.

56
Notations A: cross section area (m2). a: parameter in equation of state (Pa m6mol-2) b: parameter in equation of state (m3mol-1). F : buoyancy force density (N m-3). F0 : buoyancy force density of pure CO2(N m-3). f : a coefficient related to frictional resistance (s-1). g: gravitational acceleration (9.8 m s-2). k : permeability of rock (m2). kij: binary interaction constant for components i and j (-). mi : mass of impurity species i (kg). mCO2 : mass of CO2 in mixture (kg). L : distance (m). M: mass of CO2 in mixtures stored in given volume (kg). M0: mass of CO2 in pure stream stored in given volume (kg). •
M : mass flux (kg s-1). p : pressure (Pa or MPa). pc : critical pressure (Pa or MPa).
*cp : pseudo-critical pressure (Pa or MPa).
R: universal gas constant (8.314 J mol-1 K-1). T : temperature (K). Tc, critical temperature (K).
*cT pseudo-critical temperature (K).
t : time (s). Vm: molar volume (m3).
pV : volume of sulphate precipitate (m3).
φV : pore volume (m3). v: velocity (m s-1). w: molar weight (g mol-1). Z: (= pVm/RT); compressibility factor (-). Greek symbols α : parameter in equation of state (-).
2SOγ : volume fraction of SO2 in CO2 stream (-). µ : viscosity (Pa s).
0µ : viscosity of pure CO2 (Pa s). ρ : density (kg m-3). ρ : density of impure CO2 stream (kg m-3).
0ρ : density of pure CO2 (kg m-3). σ : interfacial tension (N m-1)

57
φ : porosity of rock (-). ω: acentric factor (-).

58
References
André, L., Audigane, P., Azaroual, M., Menjoz, A.(2007). Numerical modeling of fluid-rock chemical interactions at the supercritical CO2-liquid interface during CO2 injection into a carbonate reservoir, the Dogger aquifer (Paris Basin, France). Energy Conversion and Management 48 (6), pp. 1782-1797. Bachu, S., Gunter, W.D. (2004). Overview of acid-gas injection operations in western Canada. In: Proceedings of the 7th International Conference on Greenhouse Gas Control Technologies. Volume 1: Peer-Reviewed Papers and Plenary Presentations, Vancouver, BC, September 5-9, 2004. Bachu, S. (2008). CO2 storage in geological media: Role, means, status and barriers to deployment. Progress in Energy and Combustion Science 34 (2), pp. 254-273. Bachu, S., Bennion, D.B. (2009 a). Chromatographic partitioning of impurities contained in a CO2 stream injected into a deep saline aquifer: Part 1. Effects of gas composition and in-situ conditions. International Journal of Greenhouse Gas Control 3 (4), pp. 464-473. Bachu, S., Pooladi-Darvish, M., Hong, H. (2009 b). Chromatographic partitioning of impurities (H2S) contained in a CO2 stream injected into a deep saline aquifer: Part 2. Effects of flow conditions. International Journal of Greenhouse Gas Control 3 (4), pp. 458-463. Bacon, D.H., Sass, B.M., Bhargava, M., Sminchak, J., Gupta, N. (2009). Reactive transport modeling of CO2 and SO2 injection into deep saline formations and their effect on the hydraulic properties of host rocks. Energy Procedia 1 (1), pp. 3283-3290. Bennaceur, K., Monea, M., Sakurai, S., Gupta, N., Ramakrishnan, T.S., Whittaker, S., Randen, T. (2004). CO2 Capture and Storage—A Solution Within. Oilfield Review 16 (3), pp. 44-61. Bryant, S., Lake, L. (2005). Effect of impurities on subsurface CO2 storage processes, Carbon Dioxide Capture for Storage in Deep Geologic Formations - Results from the CO2 Capture Project, v. 2: Geologic Storage of Carbon Dioxide with Monitoring and Verification, S.M. Benson (ed.), Elsevier, London. pp. 983-998. Burton, M., Kumar, N., Bryant, S.(2008). Time-dependent injectivity during CO2 storage in aquifers. In: SPE 113937, SPE/DOE IOR Symposium, Tulsa, OK, 19–23 April 2008. Choi, Y., Nesic, S., Young, D. (2010). Effect of impurities on the corrosion behavior of CO2 transmission pipeline steel in supercritical CO2-water environments. Environmental Science and Technology 44 (23), pp. 9233-9238.

59
Clifford, A.A. (2007). Calculation of Thermodynamic Properties of CO2 using Peng Robinson equation of state. Available at Critical Processes Ltd. site: http://www.criticalprocesses.com/index.htm. Collins, A.G. (1977). Enhanced oil injection waters. In: Oil Field Subsurface Injection of Water, ASTM STP 641 (Wright, C.C., Cross, D., Ostroff, A.G., Stanford A. G. eds), America Society for Testing and Materials, pp. 2-23. Crandell, L.E., Ellis, B.R., Peters, C.A. (2010). Dissolution potential of SO2 co-injected with CO2 in geologic sequestration. Environmental Science and Technology 44 (1), pp. 349-355. Dahowski, R.T., Dooley, J.J., Davidson, C.L., Bachu, S. Gupta, N. (2004). A CO2 cost supply curve for North America. Report for IEA GHG (Contract IEA/CON/02/82). de Visser, E., Hendriks, C., Barrio, M., Mølnvik, M.J., de Koeijer, G., Liljemark, S., Le Gallo, Y. (2008). Dynamis CO2 quality recommendations. International Journal of Greenhouse Gas Control 2 (4), pp. 478-484. de Visser, E., Hendriks, C., de Koeijer, G., Liljemark, S., Barrio, M., Austegard, A., Brown, A. (2009). CO2 quality recommendations. Dynamis-Hypogen project: Deliverable D 3.1.3. http://www.dynamis-hypogen.com/publications/public_reports.htm. Duan, Z., Sun, R.(2003). An improved model calculating CO2 solubility in pure water and aqueous NaCl solutions from 273 to 533 K and from 0 to 2000 bar. Chemical Geology 193 (3-4), pp. 257-271. Ellis, B.R., Crandell, L.E., Peters, C.A. (2010). Limitations for brine acidification due to SO2 co-injection in geologic carbon sequestration. International Journal of Greenhouse Gas Control 4 (3), pp. 575-582. Esper, G.J., Bailey, D.M., Holste, J.D., Hall, K.R. (1989). Volumetric behaviour of near-equimolar mixtures for CO2+CH4 and CO2+N2. Fluid Phase Equilibria, 49, pp. 35-47. Gaus, I., Azaroual, M., Czernichowski-Lauriol, I. (2005). Reactive transport modelling of the impact of CO2 injection on the clayey cap rock at Sleipner (North Sea). Chemical Geology 217 (3-4), pp. 319-337. Gaus, I., Audigane, P., André, L., Lions, J., Jacquemet, N., Durst, P., Czernichowski-Lauriol, I., Azaroual, M. (2008). Geochemical and solute transport modelling for CO2 storage, what to expect from it? International Journal of Greenhouse Gas Control 2 (4), pp. 605-625. Giorgis, T., Carpita M., Battistelli, A. (2007). 2D modeling of salt precipitation during the injection of dry CO2 in a depleted gas reservoir, Energy Conversion and Management 48(6), pp. 1816–1826.

60
Gorecki, C.D., Sorensen, J.A., Bremer, J.M., Ayash, S.C., Knudsen, D.J., Holubnyak, Y.I., Smith, S.A., Steadman, E.N., Harju, J.A. (2009) Development of storage coefficients for carbon dioxide storage in deep saline formations and depleted hydrocarbon reservoirs. Report for IEA GHG. Hu, G., Dam-Johansen, K., Wedel, S., Peter Hansen, J. (2006). Review of the direct sulfation reaction of limestone. Progress in Energy and Combustion Science 32 (4), pp. 386-407. Huber, M.L., Hanley, H.J.M. (1996). The Corresponding-States Principle: Dense fluids, In: Transport Properties of Fluids: Their Correlation, Prediction and Estimation. Millat, J., Dymond, J.H., Nieto de Castro, C.A. (eds), Cambridge University Press. p. 283. IEA GHG (2004). Impact of impurities on CO2 capture, transport and storage. Report No. PH4/32. IEA GHG (2010). Corrosion and materials selection in CCS systems. Report 2010/03. Jacquemet, N., Pironon, J., Saint-Marc, J.(2008). Mineralogical changes of a well cement in various H2S-CO 2(-brine) fluids at high pressure and temperature. Environmental Science and Technology 42 (1), pp. 282-288. Jacquemet, N., Le Gallo, Y., Estublier, A., Lachet, V., von Dalwigk, I., Yan, J., Azaroual, M., Audigane, P. (2009). CO2 streams containing associated components-A review of the thermodynamic and geochemical properties and assessment of some reactive transport codes. Energy Procedia 1 (1), pp. 3739-3746. Jia, L., Tan, Y., Wang, C., Anthony, E.J. (2007). Experimental study of oxy-fuel combustion and sulfur capture in mini-CFBC. Energy and Fuels 21 (6), pp. 3160-3164. Johnson, J.W., Naito, J.J. Steefel, C.I. (2002). Fundamental elements of geologic CO2 sequestration in saline aquifers. American Chemical Society Fuel Chemistry Division Preprints 47(1), pp.41-42. Jones, D.M., Head, I.M., Gray, N.D., Adams, J.J., Rowan, A.K., Aitken, C.M., Bennett, B., Huang, H., Brown, A., Bowler, B.F.J., Oldenburg, T., Erdmann, M. Larter, S.R. (2008). Crude-oil biodegradation via methanogenesis in subsurface petroleum reservoirs. Nature 451 (7175), pp. 176-180. Kather, A. (2009). Presented at 2nd Working Group Meeting on CO2 Quality and Other Relevant Issues (September 2009, Cottbus, Germany). Kay, W.B. (1936). Gases and vapors at high temperature and pressure - density of hydrocarbon. Industrial and Engineering Chemistry 28:pp.1014-1019.

61
Klimeck, J., Kleinrahm, R., Wagner, W. (2001). Measurements of the (p, ρ, T) relation of methane and carbon dioxide in the temperature range 240 K to 520 K at pressures up to 30 MPa using a new accurate single-sinker densimeter. Journal of Chemical Thermodynamics 33 (3), pp. 251-267. Knauss, K.G., Johnson, J.W., Steefel, C.I. (2005). Evaluation of the impact of CO2, co-contaminant gas, aqueous fluid and reservoir rock interactions on the geologic sequestration of CO2. Chemical Geology 217 (3-4 SPEC. ISS.), pp. 339-350. Ledoux, M.J., Pham-Huu, C., Keller, N., Nougayrède, J.-B., Savin-Poncet, S., Bousquet, J.(2000). Selective oxidation of H2S in Claus tail-gas over SiC supported NiS2 catalyst. Catalysis Today 61 (1), pp. 157-163. Li, H., Yan, J. (2009 a). Impacts of equations of state (EOS) and impurities on the volume calculation of CO2 mixtures in the applications of CO2 capture and storage (CCS) processes. Applied Energy 86 (12), pp. 2760-2770. Li, H., Yan, J. (2009 b). Evaluating cubic equations of state for calculation of vapor-liquid equilibrium of CO2 and CO2-mixtures for CO2 capture and storage processes. Applied Energy 86 (6), pp. 826-836. Magro, G, Pennisi, M. (1991). Light noble gases and nitrogen in the crater fluids at vulcano (Italy): special survey from June to September 1988. Acta Vulcanologica 1, pp. 215-218. Motealleh, S., Bryant, S.L.(2007). Predictive model for permeability reduction by small wetting phase saturations. Water Resources Research 43 (12), art. no. W12S07. Nogueira, M., Mamora, D.D. (2008). Effect of flue-gas impurities on the process of injection and storage of CO2 in depleted gas reservoirs. Journal of Energy Resources Technology, Transactions of the ASME 130 (1), pp. 0133011-0133015. Oosterkamp, A., Ramsen, J. (2008). State-of-the-art overview of CO2 pipeline transport with relevance to offshore pipelines. Polytech Report No: POL-O-2007-138-A. Palandri, J.L., Kharaka, Y.K. (2005). Ferric iron-bearing sediments as a mineral trap for CO2 sequestration: Iron reduction using sulfur-bearing waste gas. Chemical Geology 217 (3-4), pp. 351-364. Palmer, S. E. (1993). In: Organic Geochemistry (Macko, S. A., Engel, M. H. eds), pp. 511–534, Plenum Press, New York). Pavlík, V., Unlink, S. (1997).The rate of corrosion of hardened cement pastes and mortars with additive of silica fume in acids. Cement and Concrete Research 27 (11), pp. 1731-1745.

62
Pavlík, V. (2000). Effect of carbonates on the corrosion rate of cement mortars in nitric acid. Cement and Concrete Research 30 (3), pp. 481-489. Peng, D., Robinson, D.B. (1976). A New Two-Constant Equation of State. Industrial and Engineering Chemistry: Fundamentals 15, pp.59–64. Pipitone, G., Bolland, O. (2009). Power generation with CO2 capture: Technology for CO2 purification. International Journal of Greenhouse Gas Control 3 (5), pp. 528-534. Poling, B.E., Prausnitz, J.M., O'Connell, J. P. (2001). Properties of Gases and Liquids (5th Edition). McGraw-Hill. Preto, F., Wang, J., Jia, L., Anthony, E.J.(2004). A study on mechanisms of nitrous oxide formation in post-combustion flue gases. Atmospheric Environment 38(8), pp. 1123-1131. Pruess, K., García, J.(2002). Multiphase flow dynamics during CO2 injection into saline aquifers. Environmental Geology 42(2-3), pp. 282 - 295. Pruess, K., Müller, N. (2009). Formation dry-out from CO2 injection into saline aquifers: 1. effects of solids precipitation and their mitigation. Water Resources Research 45 (3), art. no. W03402. Pruess, K. (2009). Formation dry-out from CO2 injection into saline aquifers: 2. analytical model for salt precipitation. Water Resources Research 45 (3), art. no. W03403. Ren, Q., Chen, G., Yan, W., Guo, T. (2000). Interfacial tension of (CO2 + CH4) + water from 298 K to 373 K and pressures up to 30 MPa. Journal of Chemical and Engineering Data 45 (4), pp. 610-612. Sass, B.M., Farzan, H., Prabhakar, R., Gerst, J., Sminchak, J., Bhargava, M., Nestleroth, B., Figueroa, J. (2009). Considerations for treating impurities in oxy-combustion flue gas prior to sequestration. Energy Procedia 1 (1), pp. 535-542. Seevam, P.N., Race, J.M., Downie, M.J. (2007). Carbon dioxide pipelines for sequestration in the UK: An engineering gap analysis. Global Pipeline Monthly 3 (6). Shah, V., Broseta, D., Mouronval, G., Montel, F.(2008). Water/acid gas interfacial tensions and their impact on acid gas geological storage. International Journal of Greenhouse Gas Control 2 (4), pp. 594-604. Soave, G. (1972).Equilibrium constants from a modified Redlich-Kwong equation of state. Chemical Engineering Science, 27 (6), pp. 1197-1203. Stanger, R., Wall, T. (2011). Sulphur impacts during pulverised coal combustion in oxy-fuel technology for carbon capture and storage. Progress in Energy and Combustion Science 37(1) pp. 69-88.

63
Taber, J.J. (1985). Fate of small concentrations of SO2, NOx and O2 when injected with CO2 into oil reservoirs, Argonne National Laboratories. Talman, S.J., Perkins, E.H. (2009). Concentration gradients associated with acid gas injection. International Acid Gas Injection Symposium 2009, Calgary, AB, Canada. Wang J., Anthony, E.J. (2008). Clean combustion of solid fuels. Applied Energy 85 (2-3), pp. 73-79. White, D.J., Johnson, J.W. (2009). Integrated geophysical and geochemical research programs of the IEA GHG Weyburn-Midale CO2 monitoring and storage project. Energy Procedia 1 (1), pp. 2349-2356. Wilkinson, J.R., Leahy-Dios A., Teletzke, G. F., Dickson, J.L. (2010). Use of CO2 containing impurities for miscible enhanced oil recovery, presentation at CPS/SPE International Oil & Gas Conference and Exhibition Beijing, China, 8-10 June 2010. Xu, T., Apps, J.A., Pruess, K., Yamamoto, H. (2007). Numerical modeling of injection and mineral trapping of CO2 with H2S and SO2 in a sandstone formation. Chemical Geology 242 (3-4), pp. 319-346. Yan, W., Zhao, G. , Chen, G., Guo, T. (2001). Interfacial tension of (methane + nitrogen) + water and (carbon dioxide + nitrogen) + water systems. Journal of Chemical and Engineering Data 46 (6), pp. 1544-1548. Zettlitzer, M., Moeller, F., Morozova, D., Lokay, P., Würdemann, H. (2010). Re-establishment of the proper injectivity of the CO2-injection well Ktzi 201 in Ketzin, Germany. International Journal of Greenhouse Gas Control, in press. Zuluaga, E., Lake, L.W.(2008). Modeling of experiments on water vaporization for gas injection using travellng waves. SPE Journal 13 (2), pp. 248-256.

A- 1
Appendix A – Properties of Components in CO2 Streams
The following table contains physical properties of the components in CO2 streams that are discussed in this work. The data are compiled from a number of sources, including CRC Handbook of Chemistry and Physics, Gas Encyclopaedia (available at http://encyclopedia.airliquide.com/Encyclopedia.asp), and others which are indicated in the table).
Component WM Tc Pc ρ ω μ S (K) (MPa) (kg/m3) (-) (μPa·s) (mol/L) CO2 44.01 304.21 7.38 1.842 0.22362 14.73 0.039 O2 32 154.58 5.04 1.331 0.02218 20.34 0.0014 N2 28.02 126.20 3.4 1.165 0.03772 17.49 0.00068 Ar 39.95 150.86 4.9 1.661 0.00000 22.35 0.0015 SO2 64.06 430.75 7.88 2.279 0.24538 12.70 2.1 SO3 80.06 490.85 8.21 1.970 1) 0.42396 n/a reaction NO 30 180.15 6.48 1.249 0.58294 18.97 0.00033 3) NO2 46.01 431.15 10.13 3.400 2) 0.85109 13.2 reaction H2S 34.08 373.53 8.96 1.434 0.09417 12.42 0.11 CO 28.01 132.92 3.5 1.165 0.04816 17.45 0.001 H2 2.016 33.19 1.31 0.0893 -0.21599 8.88 0.0008 CH4 16.043 190.56 4.6 0.668 0.01155 11.03 0.0014 H2O 18.02 647.13 22.6 0.749 0.34486 n/a n/a where: WM - molecule weight Tc - critical temperature Pc - critical pressure ρ - density at NTP (normal temperature and pressure, defined as 20oC and 1 atm) ω - acentric factor (the values are from SIMSCI databank incorporated in process simulator PRO/II (http://iom.invensys.com/EN/Pages/SimSci-Esscor.aspx)) μ - viscosity at NTP S - solubility in water at NTP (data are from “Solubility of Gases in Water”, available at http://www.engineeringtoolbox.com/gases-solubility-water- d_1148.html) 1) vapor density at 25°C 2) vapor density at 22°C 3) at 0°C and 1 atm

B- 1
Appendix B – Binary Interaction Constants for Equations of State
The following table lists the values of binary interaction constants used in this study for calculations with the Peng-Robinson equation and Soave-Redlich-Kwong equation. The values are from SIMSCI databank incorporated in the process simulator PRO/II (http://iom.invensys.com/EN/Pages/SimSci-Esscor.aspx) unless indicated otherwise. Component pair kij Peng-Robinson Soave-Redlich-Kwong CO2/O2* 0.1140 0.1160 CO2/N2 -0.017 -0.0300 CO2/Ar* 0.1630 0.1800 CO2/SO2* 0.0460 0.0480 CO2/H2S 0.1000 0.1000 CO2/CO -0.0300 0.0500 CO2/H2 -0.1622 -0.3426 CO2/CH4 0.0919 0.0933 CO2/H2O 0.2100 0.2300 O2/N2 -0.0119 -0.0078 O2/Ar 0.0104 0.0178 O2/CH4 0.0500 0.0600 N2/SO2 0.0800 0.0578 N2/H2S 0.1800 0.1700 N2/CO 0.0120 0.0400 N2/H2 -0.0300 0.0233
N2/CH4 0.0350 0.0300 N2/H2O 0.5080 0.5300
Ar/CH4 0.0230 0.0252 SO2/CH4 0.1356 0.1279 H2S/CO 0.0544 0.0367 H2S/H2 0.1000 0.0830 H2S/CH4 0.0850 0.0900 H2S/H2O 0.1640 0.1350 CO/H2 0.0900 0.0400 CO/CH4 0.0300 0.0322 CO/H2O 0.2000 0.2000 H2/H2O 0.5630 0.4000 H2/CH4 0.0160 -0.0200 CH4/H2O 0.5000 0.5200
* from Li and Yan (2009 b)