Embed Size (px)
DESCRIPTION
Effective Water Supply
Citation preview
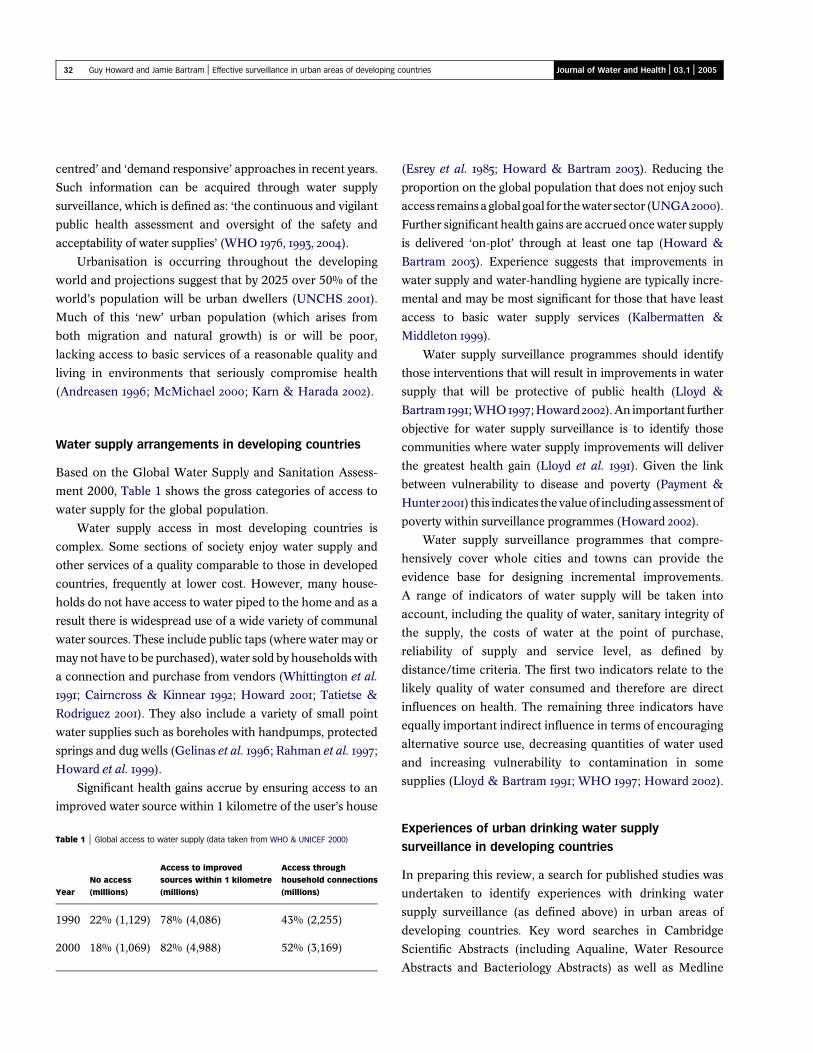
Effective water supply surveillance in urban areas
of developing countries
Guy Howard and Jamie Bartram
ABSTRACT
Guy Howard (corresponding author)
Department for International Development,
United House, 10 Gulshan Avenue, Gulshan 1,
Dhaka 1212,
Bangladesh
Email: [email protected]
Jamie Bartram
Water, Sanitation and Health Programme,
World Health Organization,
20 Avenue Appia 1211,
Geneva 27,
Switzerland
Water supply surveillance generates data on the safety and adequacy of drinking water supply in
order to contribute to the protection of human health. Most current models of water supply
surveillance for urban areas come from developed countries and have significant shortcomings if
directly applied elsewhere. There are differences not only in socio-economic conditions but also
in the nature of water supply services, which often comprise a complex mixture of formal and
informal services for both the ‘served’ and ‘unserved’. The development of approaches to water
supply surveillance that allow targeting of activities on priority groups is assessed based on case
studies from Peru and Uganda. The development of a zoning approach that incorporates indices
for vulnerability is shown to be a useful tool to assist surveillance in targeting data collection.
Zoning also assists in targeting subsequent interventions into communities and strategies where
public health gains are likely to be greatest. Two approaches to urban zoning are presented from
Peru and Uganda, both of which are effective.
Key words | drinking water, health, poverty, surveillance, urban, water quality
INTRODUCTION
The adverse impacts on public health from poor water supply
have long been recognised in both developing and developed
countries and take the form of outbreaks and contribution to
background rates of disease (Esrey et al. 1991; Ford 1999;
Payment & Hunter 2001). Nevertheless, reliable estimates of the
globalburdenofdisease related towater, sanitationandhygiene
areonlynowbecomingavailable (Prussetal. 2002).Waterborne
disease contributes a significant proportion of the total disease
burden associated with diarrhoea and other gastro-intestinal
diseases, estimated at 2.2 million deaths and over 72 million
disability adjusted life years (DALYs) (WHO 2002). Children in
developing countries bear the great majority of the burden of
water-related and diarrhoeal disease (Pruss et al. 2002).
Many millions of people, in particular throughout the
developing world, use unreliable water supplies of poor
quality, which are costly and are distant from their home
(WHO & UNICEF 2000). Diarrhoeal disease may be caused
by consumption of contaminated drinking water or through
poor personal, domestic or community hygiene; which may
in turn be driven by inadequate availability of water. Factors
such as poor reliability (continuity of supply), costs
(affordability) and distance between a water source and
the home may all lead households to depend on less safe
sources, to reduce the volume of water used for hygiene
purposes and to reduce spending on other essential
goods, such as food (Lloyd & Bartram 1991; Cairncross &
Kinnear 1992; Howard 2002).
The burden of waterborne disease is unequally spread
within and between countries and is often closely linked to
poverty (Fass 1993; Stephens et al. 1997). The poor tend to be
more vulnerable to disease and have least access to basic
services (WHO & UNICEF 2000). The evidence suggests that
interventions targeted at poor populations provide significant
health benefits and contribute to poverty alleviation (DFID
2001; WHO 2002). Information about the adequacy of water
supplies and the health risks faced by urban populations at
national or sub-national levels remains scarce in many
countries. This is despite significant advocacy of ‘people
31 Q IWA Publishing 2005 Journal of Water and Health | 03.1 | 2005
centred’ and ‘demand responsive’ approaches in recent years.
Such information can be acquired through water supply
surveillance, which is defined as: ‘the continuous and vigilant
public health assessment and oversight of the safety and
acceptability of water supplies’ (WHO 1976, 1993, 2004).
Urbanisation is occurring throughout the developing
world and projections suggest that by 2025 over 50% of the
world’s population will be urban dwellers (UNCHS 2001).
Much of this ‘new’ urban population (which arises from
both migration and natural growth) is or will be poor,
lacking access to basic services of a reasonable quality and
living in environments that seriously compromise health
(Andreasen 1996; McMichael 2000; Karn & Harada 2002).
Water supply arrangements in developing countries
Based on the Global Water Supply and Sanitation Assess-
ment 2000, Table 1 shows the gross categories of access to
water supply for the global population.
Water supply access in most developing countries is
complex. Some sections of society enjoy water supply and
other services of a quality comparable to those in developed
countries, frequently at lower cost. However, many house-
holds do not have access to water piped to the home and as a
result there is widespread use of a wide variety of communal
water sources. These include public taps (where water may or
may not have to be purchased), water sold by households with
a connection and purchase from vendors (Whittington et al.
1991; Cairncross & Kinnear 1992; Howard 2001; Tatietse &
Rodriguez 2001). They also include a variety of small point
water supplies such as boreholes with handpumps, protected
springs and dug wells (Gelinas et al. 1996; Rahman et al. 1997;
Howard et al. 1999).
Significant health gains accrue by ensuring access to an
improved water source within 1 kilometre of the user’s house
(Esrey et al. 1985; Howard & Bartram 2003). Reducing the
proportion on the global population that does not enjoy such
access remainsaglobal goal for thewater sector (UNGA2000).
Further significant health gains are accrued once water supply
is delivered ‘on-plot’ through at least one tap (Howard &
Bartram 2003). Experience suggests that improvements in
water supply and water-handling hygiene are typically incre-
mental and may be most significant for those that have least
access to basic water supply services (Kalbermatten &
Middleton 1999).
Water supply surveillance programmes should identify
those interventions that will result in improvements in water
supply that will be protective of public health (Lloyd &
Bartram 1991; WHO 1997; Howard 2002). An important further
objective for water supply surveillance is to identify those
communities where water supply improvements will deliver
the greatest health gain (Lloyd et al. 1991). Given the link
between vulnerability to disease and poverty (Payment &
Hunter 2001) this indicates thevalueof includingassessmentof
poverty within surveillance programmes (Howard 2002).
Water supply surveillance programmes that compre-
hensively cover whole cities and towns can provide the
evidence base for designing incremental improvements.
A range of indicators of water supply will be taken into
account, including the quality of water, sanitary integrity of
the supply, the costs of water at the point of purchase,
reliability of supply and service level, as defined by
distance/time criteria. The first two indicators relate to the
likely quality of water consumed and therefore are direct
influences on health. The remaining three indicators have
equally important indirect influence in terms of encouraging
alternative source use, decreasing quantities of water used
and increasing vulnerability to contamination in some
supplies (Lloyd & Bartram 1991; WHO 1997; Howard 2002).
Experiences of urban drinking water supply
surveillance in developing countries
In preparing this review, a search for published studies was
undertaken to identify experiences with drinking water
supply surveillance (as defined above) in urban areas of
developing countries. Key word searches in Cambridge
Scientific Abstracts (including Aqualine, Water Resource
Abstracts and Bacteriology Abstracts) as well as Medline
Table 1 | Global access to water supply (data taken from WHO & UNICEF 2000)
Year
No access
(millions)
Access to improved
sources within 1 kilometre
(millions)
Access through
household connections
(millions)
1990 22% (1,129) 78% (4,086) 43% (2,255)
2000 18% (1,069) 82% (4,988) 52% (3,169)
32 Guy Howard and Jamie Bartram | Effective surveillance in urban areas of developing countries Journal of Water and Health | 03.1 | 2005
were employed. Cases studies were screened to see whether
they met the following criteria:
1. Adopted a population-wide approach, for example:
† went beyond testing of water in piped distribution and
incorporated alternative sources and household water;
† attempted to develop surveillance programmes cover-
ing whole cities rather than individual communities;
2. Were sustained for a significant period to enable mean-
ingful review (a minimum of three years);
3. Contained documented methodologies;
4. Were primarily implemented through domestic organi-
sations in developing nations.
Few published studies exist that address the development of
water supply surveillance programmes in urban areas of
developing countries. A review conducted for the IWA
indicated that, while most countries have some form of
guidelines on water quality, these are not routinely enforced
(Steynberg 2002). This review suggested that the health sector
often performs more monitoring than the water supply sector,
but provided no evidence that systematic monitoring of water
supply extended beyond utility piped systems in urban areas.
A recent assessment of drinking water supply surveillance
in the WHO South-East Asia Region noted that none of the
countries had a comprehensive national programme of
surveillance (Howard & Pond 2002). Surveillance of piped
water supplies in urban areas was carried out more extensively
than of rural water supplies, although alternative sources and
household water in urban areas were not typically included.
Even in middle-income countries, sources other than the
piped utility system are often not included in monitoring
programmes despite the fact that they serve a significant
proportion of the population (Parr & Rogers 2002).
There are very few reported examples of surveillance
programmes where there is a mix of water source type and
service level, or which have addressed the targeting of
vulnerable populations. Some projects tried to focus on
alternative sources and household water, but were typically
focused on single communities or were time-limited assess-
ments of water (Howard 1997; Karte 2001). None of the
literature reviewed indicated that poverty or the targeting of
vulnerable populations had been a significant factor in the
surveillance programme design.
Two principal case studies were identified, each invol-
ving one or other of the authors of the present paper. One
was implemented in Peru in the 1980s and 1990s (Lloyd &
Bartram 1991; Lloyd & Helmer 1991; Lloyd et al. 1991); the
other was implemented in Uganda in the 1990s (Howard &
Luyima 1999a, b; Howard 2002). These case studies are
presented here for comparison and as models that have
proved to be effective.
CASE STUDIES
Objectives and scope
Both case studies (Peru and Uganda) set out to investigate
how water supply surveillance in urban areas could better
contribute to information needs to ensure public health gain
from improved water supplies. In both case studies the
surveillance data assessed service adequacy as experienced
at the household level. The findings of these projects and
the ways in which the data were used to promote
improvements have been reported elsewhere for both Peru
(Lloyd & Bartram 1991; Lloyd et al. 1991) and Uganda
(Howard & Luyima 1999b; Howard 2002).
In both studies, attempts were made to incorporate
some assessment of poverty within the surveillance design
as a mechanism by which to identify groups or communities
believed to be most vulnerable to health consequences of
inadequate water supply. This took the form of ‘zoning’ of
urban areas as a first step in programme design using
population categories and use of water to provide infor-
mation to focus resources for subsequent data collection.
This was in addition to the zoning of piped water supply,
which was also carried out in both countries and which is
recommended practice for monitoring of microbial quality
in such systems (Geldreich 1996; WHO 1997).
A key factor in the zoning was to introduce a stratified
random sampling of communities in the design of water
supply surveillance programmes. Stratified sampling was
selected as both programmes had the explicit aim of
attempting to cover all communities within the surveillance
of water supply, using a ‘rolling’ programme of visits.
Stratified random sampling is a commonly applied
approach within monitoring programmes that attempt to
33 Guy Howard and Jamie Bartram | Effective surveillance in urban areas of developing countries Journal of Water and Health | 03.1 | 2005
cover a representative sample of the total population
(Bartram & Ballance 1996).
Alternative approaches, such as cluster sampling, were
considered and such approaches are currently being tested
for rapid assessments of water quality within overall sector
monitoring as part of global initiatives (Howard et al. 2003).
Cluster sampling within the context of ongoing surveillance
programmes, however, remains less well applied. Cluster
sampling may be justified for surveillance in rural areas of
developing countries, where the numbers of very small
supplies inhibit regular visits to an individual community
(Bartram 1999). In contrast, in urban areas it would
generally be considered that more regular visits to individ-
ual communities should be practical given the more
concentrated nature of the population and the greater
potential for increased numbers of communities to be
visited within one sampling period.
The two case studies have clearly defined links – the
Uganda study building on the experience obtained in Peru
– both in terms of the indicators used and the approach to
identifying vulnerable communities.
Indicators
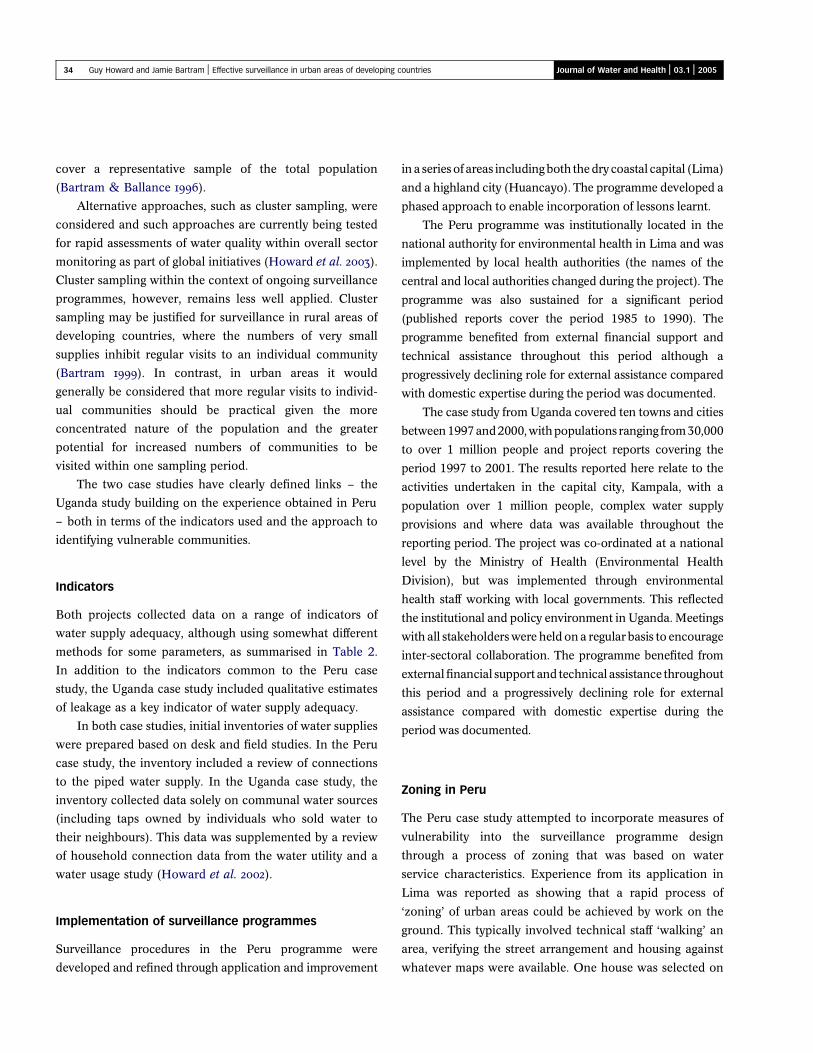
Both projects collected data on a range of indicators of
water supply adequacy, although using somewhat different
methods for some parameters, as summarised in Table 2.
In addition to the indicators common to the Peru case
study, the Uganda case study included qualitative estimates
of leakage as a key indicator of water supply adequacy.
In both case studies, initial inventories of water supplies
were prepared based on desk and field studies. In the Peru
case study, the inventory included a review of connections
to the piped water supply. In the Uganda case study, the
inventory collected data solely on communal water sources
(including taps owned by individuals who sold water to
their neighbours). This data was supplemented by a review
of household connection data from the water utility and a
water usage study (Howard et al. 2002).
Implementation of surveillance programmes
Surveillance procedures in the Peru programme were
developed and refined through application and improvement
in a series of areas including both the dry coastal capital (Lima)
and a highland city (Huancayo). The programme developed a
phased approach to enable incorporation of lessons learnt.
The Peru programme was institutionally located in the
national authority for environmental health in Lima and was
implemented by local health authorities (the names of the
central and local authorities changed during the project). The
programme was also sustained for a significant period
(published reports cover the period 1985 to 1990). The
programme benefited from external financial support and
technical assistance throughout this period although a
progressively declining role for external assistance compared
with domestic expertise during the period was documented.
The case study from Uganda covered ten towns and cities
between1997and2000,withpopulations ranging from30,000
to over 1 million people and project reports covering the
period 1997 to 2001. The results reported here relate to the
activities undertaken in the capital city, Kampala, with a
population over 1 million people, complex water supply
provisions and where data was available throughout the
reporting period. The project was co-ordinated at a national
level by the Ministry of Health (Environmental Health
Division), but was implemented through environmental
health staff working with local governments. This reflected
the institutional and policy environment in Uganda. Meetings
with all stakeholders were held on a regular basis to encourage
inter-sectoral collaboration. The programme benefited from
external financial support and technical assistance throughout
this period and a progressively declining role for external
assistance compared with domestic expertise during the
period was documented.
Zoning in Peru
The Peru case study attempted to incorporate measures of
vulnerability into the surveillance programme design
through a process of zoning that was based on water
service characteristics. Experience from its application in
Lima was reported as showing that a rapid process of
‘zoning’ of urban areas could be achieved by work on the
ground. This typically involved technical staff ‘walking’ an
area, verifying the street arrangement and housing against
whatever maps were available. One house was selected on
34 Guy Howard and Jamie Bartram | Effective surveillance in urban areas of developing countries Journal of Water and Health | 03.1 | 2005
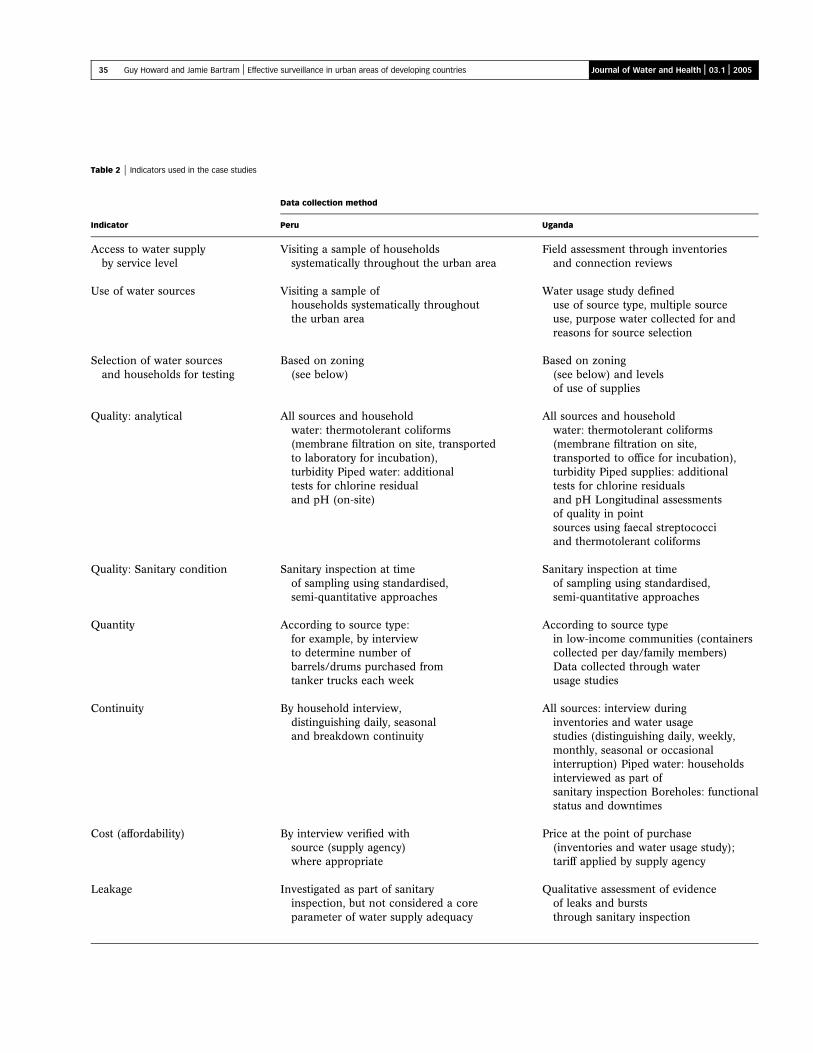
Table 2 | Indicators used in the case studies
Data collection method
Indicator Peru Uganda
Access to water supplyby service level
Visiting a sample of householdssystematically throughout the urban area
Field assessment through inventoriesand connection reviews
Use of water sources Visiting a sample ofhouseholds systematically throughoutthe urban area
Water usage study defineduse of source type, multiple sourceuse, purpose water collected for andreasons for source selection
Selection of water sourcesand households for testing
Based on zoning(see below)
Based on zoning(see below) and levelsof use of supplies
Quality: analytical All sources and householdwater: thermotolerant coliforms(membrane filtration on site, transportedto laboratory for incubation),turbidity Piped water: additionaltests for chlorine residualand pH (on-site)
All sources and householdwater: thermotolerant coliforms(membrane filtration on site,transported to office for incubation),turbidity Piped supplies: additionaltests for chlorine residualsand pH Longitudinal assessmentsof quality in pointsources using faecal streptococciand thermotolerant coliforms
Quality: Sanitary condition Sanitary inspection at timeof sampling using standardised,semi-quantitative approaches
Sanitary inspection at timeof sampling using standardised,semi-quantitative approaches
Quantity According to source type:for example, by interviewto determine number ofbarrels/drums purchased fromtanker trucks each week
According to source typein low-income communities (containerscollected per day/family members)Data collected through waterusage studies
Continuity By household interview,distinguishing daily, seasonaland breakdown continuity
All sources: interview duringinventories and water usagestudies (distinguishing daily, weekly,monthly, seasonal or occasionalinterruption) Piped water: householdsinterviewed as part ofsanitary inspection Boreholes: functionalstatus and downtimes
Cost (affordability) By interview verified withsource (supply agency)where appropriate
Price at the point of purchase(inventories and water usage study);tariff applied by supply agency
Leakage Investigated as part of sanitaryinspection, but not considered a coreparameter of water supply adequacy
Qualitative assessment of evidenceof leaks and burststhrough sanitary inspection
35 Guy Howard and Jamie Bartram | Effective surveillance in urban areas of developing countries Journal of Water and Health | 03.1 | 2005
each side of each block by the fieldwork team and the
means of provision of drinking water determined.
On the basis of the results obtained the urban area was
divided with respect to dominant means of water supply
provision. These were of very variable size and typically
bore little relationship to administrative boundaries. In
areas of piped supply efforts were made to identify supply
zones related to the areas of influence of different sources
(wells, treated surface water) and to take account of this and
the layout of supply mains and different piped networks in
order to sub-divide the piped supply into meaningful areas.
One effect of this zoning was to bring into the ambit of the
surveillance programme small, often ‘informal’ urban settle-
ments of very high density and low service provision. It also
provided evidence with which to highlight the frequency of the
differentmeansofprovision,particularly tanker truckdelivery,
and therefore to argue for their explicit inclusion in subsequent
surveillance and improvement activities. The experience in
Peru suggested that a qualitativeapproach could be effective as
an initial assessment tool for targeting resources within a
surveillance programme.
Zoning in Uganda
The Uganda case study attempted to build on the process of
zoningdevelopedand applied inPeru through thedevelopment
of a semi-quantitative measure of community vulnerability to
water-relateddisease.Thiswasused tozone theurbanareasand
in planning surveillance activities.
The zoning used a categorisation matrix, which was
developed incorporating a quantitative measure of socio-
economic status, population density and a composite measure
of water availability and use. The rationale for including each
factor is described below. Kampala was administratively
divided into a number of parishes and each parish assigned
to a zone category.
The evaluation of socio-economic status was based on a
range of variables reflecting housing conditions, employment
status and education, and an index was developed of relative
poverty for each town. Socio-economic indices have been
shown to be effective in defining socio-economic status and
have been used in measuring health differentials in developing
countries (Stephens et al. 1997). Such measures provide a
better indication of relative wealth than wage income, which
constituted a relatively small proportion of total income in
Uganda (Bigsten & Kayizzi-Mugerwa 1992). Furthermore,
access to services is often more a function of mode of
employment (e.g. government) than wage income (Hardoy
& Satterthwaite 1989).
Using the approach recommended by Stephens (1995),
a series of discussions with expert groups was held to define
which of the available variables were sensitive to changes in
wealth. An index was then developed based on the
following variables:
† Roof material type
† Floor material type
† Persons per room
† Educational attainment
† Main source of household livelihood
† Household size
Data for these variables were taken from household
characteristics from the 1991 census. Discussions with the
expert groups also led to the definition of low, medium or
high income depending on their socio-economic score. This
data was then used to prepare a map of socio-economic
status for Kampala with the zone category of each parish
shown.
Population density was included because more densely
populated areas have greater faecal loadings within the
environment and the literature indicates that these are
associated with greater vulnerability to infectious disease
(Woodward et al. 2000). ‘Vulnerability’ in this context
includes both the effects arising from the greater pathogen
exposure and the increase in the number of people likely to
be affected by the introduction of a pathogen.
Population density of each parish was derived by dividing
the estimated parish population (calculated from the 1991
populations and applying a 4.76% annual growth rate) by the
area recorded in the 1991 census. No attempt was made to
correct for intra-urban differences in growth rate. The parishes
were then ranked in order of population density: those with
populations below the 33rd percentile were classified as low
density, those with populations above the 66thpercentile were
classified as high density and those between the 33rd and 66th
percentiles classified as medium density.
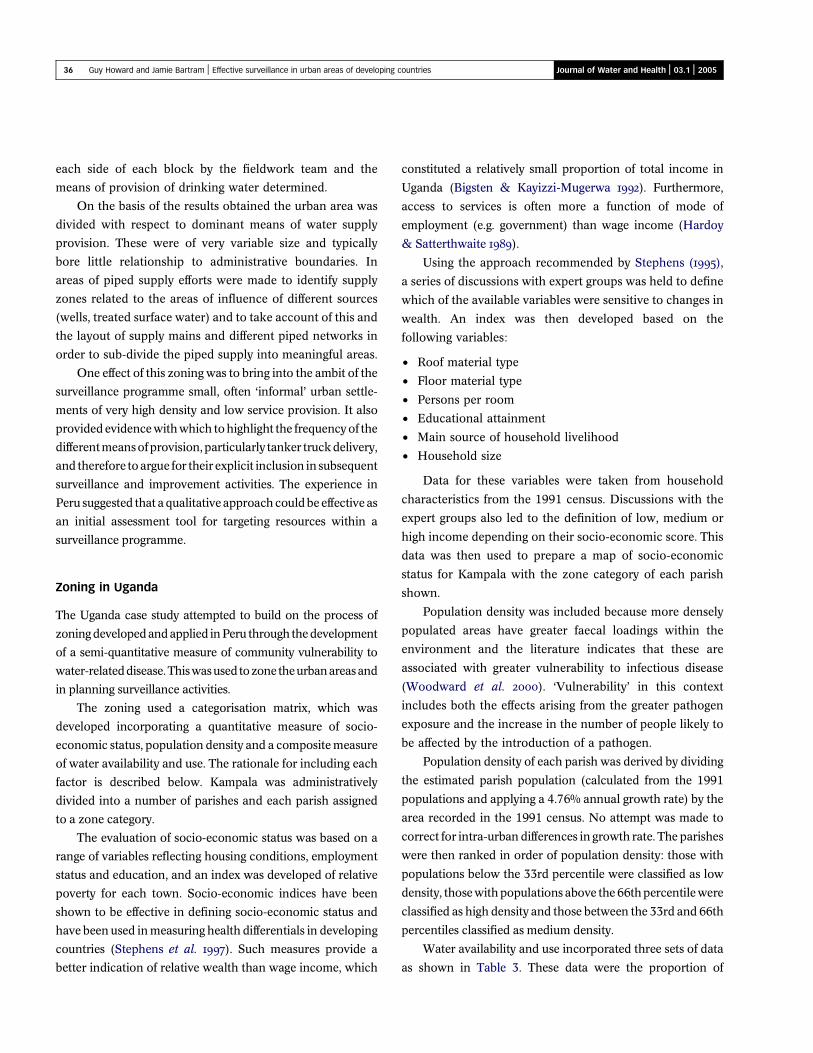
Water availability and use incorporated three sets of data
as shown in Table 3. These data were the proportion of
36 Guy Howard and Jamie Bartram | Effective surveillance in urban areas of developing countries Journal of Water and Health | 03.1 | 2005
households with a domestic connection, available communal
water source types obtained from an inventory and estimated
levels of use of different source types obtained from a water
usage study. The water usage studies were undertaken because
availability ofwater supplies does not directly equate to level of
use for drinking purposes by households (Madanat &
Humplinck 1993; Howard et al. 2002).
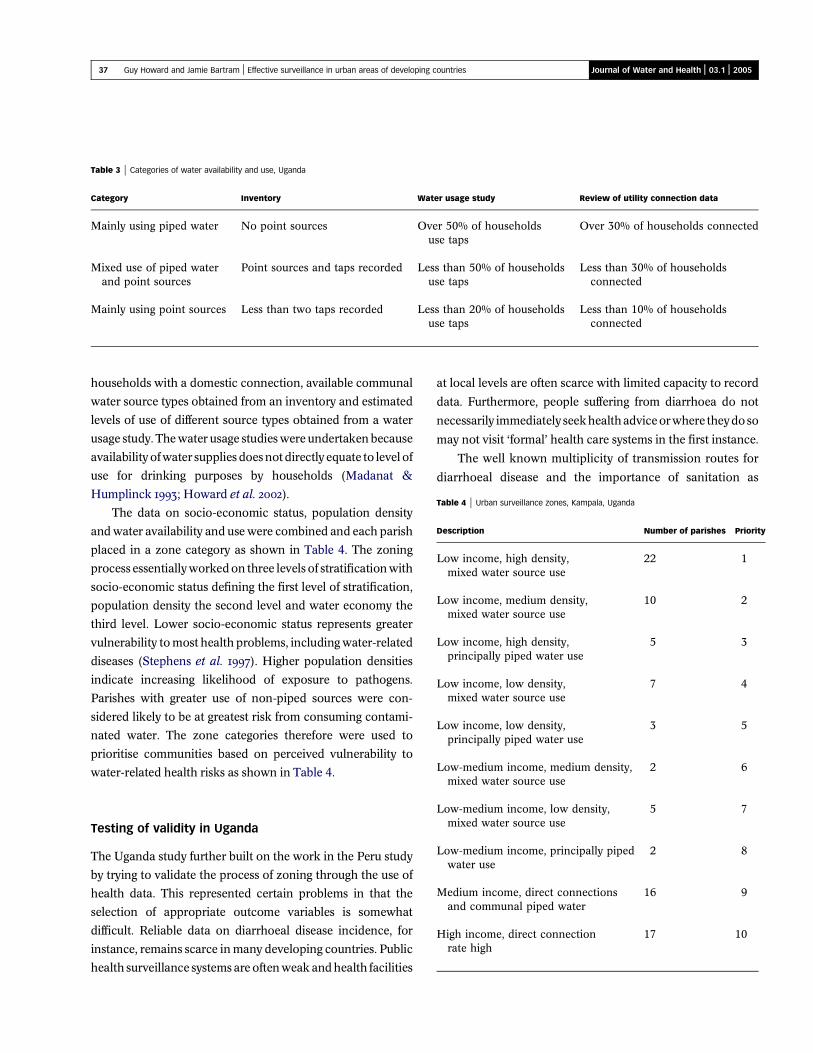
The data on socio-economic status, population density
and water availability and use were combined and each parish
placed in a zone category as shown in Table 4. The zoning
process essentially worked on three levels of stratification with
socio-economic status defining the first level of stratification,
population density the second level and water economy the
third level. Lower socio-economic status represents greater
vulnerability to most health problems, including water-related
diseases (Stephens et al. 1997). Higher population densities
indicate increasing likelihood of exposure to pathogens.
Parishes with greater use of non-piped sources were con-
sidered likely to be at greatest risk from consuming contami-
nated water. The zone categories therefore were used to
prioritise communities based on perceived vulnerability to
water-related health risks as shown in Table 4.
Testing of validity in Uganda
The Uganda study further built on the work in the Peru study
by trying to validate the process of zoning through the use of
health data. This represented certain problems in that the
selection of appropriate outcome variables is somewhat
difficult. Reliable data on diarrhoeal disease incidence, for
instance, remains scarce in many developing countries. Public
health surveillance systems are often weak and health facilities
at local levels are often scarce with limited capacity to record
data. Furthermore, people suffering from diarrhoea do not
necessarily immediately seekhealthadviceorwhere theydoso
may not visit ‘formal’ health care systems in the first instance.
The well known multiplicity of transmission routes for
diarrhoeal disease and the importance of sanitation as
Table 3 | Categories of water availability and use, Uganda
Category Inventory Water usage study Review of utility connection data
Mainly using piped water No point sources Over 50% of householdsuse taps
Over 30% of households connected
Mixed use of piped waterand point sources
Point sources and taps recorded Less than 50% of householdsuse taps
Less than 30% of householdsconnected
Mainly using point sources Less than two taps recorded Less than 20% of householdsuse taps
Less than 10% of householdsconnected
Table 4 | Urban surveillance zones, Kampala, Uganda
Description Number of parishes Priority
Low income, high density,mixed water source use
22 1
Low income, medium density,mixed water source use
10 2
Low income, high density,principally piped water use
5 3
Low income, low density,mixed water source use
7 4
Low income, low density,principally piped water use
3 5
Low-medium income, medium density,mixed water source use
2 6
Low-medium income, low density,mixed water source use
5 7
Low-medium income, principally pipedwater use
2 8
Medium income, direct connectionsand communal piped water
16 9
High income, direct connectionrate high
17 10
37 Guy Howard and Jamie Bartram | Effective surveillance in urban areas of developing countries Journal of Water and Health | 03.1 | 2005
a protective measure, as well as widespread predisposing
factors such as suppressed nutrition and repeated infection,
make direct use of health data problematic (WELL 1998).
As a result, the validation in Uganda used data from a
cholera epidemic in 1997–1998. This provided particularly
useful data, as cholera had been absent from Kampala for
well over 30 years. Therefore problems with differentiating
background and outbreak conditions and the likely mode
of transmission did not arise. In many developing countries,
the route of transmission of the same disease may vary
significantly between outbreaks (when contaminated water
supply may be important) and background disease, where
transmission derived from poor hygiene or sanitation may
predominate.
In order to test the effectiveness of the zoning approach in
predicting vulnerability to disease, a retrospective analysis of
the zone categories in comparison with the number of cholera
cases recorded in the 1997/98 epidemic was carried out using
the Spearman’s rank correlation statistic.
In Kampala different parishes may share the same name
and are differentiated through the use of a numerical suffix:
for example Kamwokya I and Kamwokya II. In some cases,
up to four parishes share the same name, with a numerical
suffix ranging from I to IV (for example, Nakasero I –
Nakasero IV). The data on cholera incidence identified the
name of the parish, but failed to identify the numerical
suffix and therefore could potentially include data from
several different parishes under one parish name. This was
a particular problem where two parishes sharing the same
name were in different zone categories. Therefore all
parishes with the same name but different numerical suffix
were excluded from the analysis of the cholera data and
zone priority. The null hypothesis was that no significant
relationship would be found between the priority accorded
to zones and number of cholera cases. The analysis gave a
correlation significant above the 99% confidence level
(Rs = 20.49, p = 0.001).
As the socio-economic status and connection rate to the
water supply were considered likely to be particularly
confounding variables, these were tested individually
against the cholera cases with the same null hypothesis.
The test for socio-economic status gave a result that was not
significant (Rs = 20.16, p = 0.294), while the test for
connection rate gave a result that was significant to the 95%
confidence level (Rs = 20.35, p = 0.018). Analysis of the
population density also showed a result significant to the
95% level (Rs = 0.31, p = 0.038).
These analyses show that correlation between cholera
cases is strongest with the use of a multi-criteria zoning
approach. This improves the reliability of the zoning
methodology to predict which areas are likely to suffer
most from an epidemic and provides a mechanism to
capture the multi-faceted nature of vulnerability and
exposure. The significance of the correlations with connec-
tion data and population density also support the need to
address water supply adequacy rather than simply water
quality. Both suggest that limited access to water supply
at higher service levels and increased potential for
person-to-person transmission were important in determin-
ing the spread of the epidemic. The parishes with low rates
of connection and high population density were also those
where use of protected springs was more common, which
previous research suggests was a significant factor in
diarrhoeal disease transmission in the city (Nasinyama
et al. 2000).
USE OF ZONING IN SURVEILLANCE
Organisation of surveillance and collection of data
on indicators, Peru
In Lima, on completion of zoning, the quality of water supply
service within each zone was determined through a second
round of visits to a smaller number of households. In these
visits water supply service was characterised according to
water quality, quantity, continuity and cost (affordability).
For reasons of public health priority greatest attention was
paid to areas where the greatest populations depended on
unpiped supplies. For instance a dedicated study was
undertaken on tanker truck provision in slum areas. At the
time of the study, the piped water supply in Lima was ‘rotated’
around supply zones as a form of rationing. This affected
hydrants used to fill tankers that supplied slum areas, as well as
individual households and other users. One result of this
rotation was that it severely limited the supply of water via
tanker trucks into slum communities and had significant
adverse effects on the users. The study into the impact on water
38 Guy Howard and Jamie Bartram | Effective surveillance in urban areas of developing countries Journal of Water and Health | 03.1 | 2005
supply in slum areas led to remedial action to ensure that there
was no rationing of water at hydrants used by tankers.
In the Peru case study, there were a number of other
studies and ‘vertical’ targeted activities that were outside the
simple flow of organised surveillance. The data were also
used to influence local and national policy towards water
supply provision.
Organisation of surveillance and collection of data
on indicators, Uganda
In Kampala, following zoning, data were collected monthly
on the quality of different water sources and water stored
within households, the continuity of the supply and
evidence of leakage. Less frequent data were also collected
on the cost of water (as purchased by the household) and
quantity of water used.
The zoning was a rapid assessment tool for directing the
resources of the surveillance programme. It allowed identifi-
cation of areas of interest because they contained populations
at increased risk of water-related disease. Surveillance data
acquisition was focused on those parishes falling into
categories ranked 1–7 in Table 4, where more extensive data
collection was required to characterise vulnerability to water-
related health risks and water supply arrangements. Far less
attention was paid to those parishes in categories ranked
8–10, as characterisation in relation to water supply arrange-
ments and water-relatedhealth risks was relatively simple. The
data collected in the parishes in categories 8–10 primarily
focused on piped water supply and was designed to support
overall water quality management in the piped supply when
water quality problems were found.
The use of zoning significantly reduced the number of
parishes to be covered for detailed data acquisition. Overall,
five times as many sanitary inspections were performed on
water sources and 4.6 times as many samples analysed in
parishes in zones 1–7 compared with zones 8–10. All
household water quality testing was carried out in zones 1–7.
By identifying the numbers of households using different
source types, the number of samples required from each source
type was calculated.
At a micro-level, the data collected on water supply in
priority zones allowed a range of remedial actions to be
undertaken including improvement of alternative supplies
and hygiene education (Howard et al. 2001, 2002).
In addition, the data were used to inform water supply
policy at local and national levels.
DISCUSSION
The development of surveillance programmes in urban areas
of developing countries has been limited and hampered by a
lack of appropriate models. Much reliance is placed on models
used indevelopedcountrieswithanemphasison thecontrolof
quality in piped water supplies. This is reasonable where the
norm is for households to have access to piped water supplies,
but is less appropriate where the norm is for the use of
communal supplies (including non-piped sources) and where
other measures of supply adequacy may be as important as
water quality. A focus on control of water quality in piped
water supply in these situations is likely to direct attention to
areas of already improved water supply, rather than to areas
where the water supply is less well developed and the potential
for public health gain is greatest.
The experience of using zoning in both case studies
suggests that assessment of community vulnerability is a useful
means of prioritising data collection for surveillance pro-
grammes. It also allows surveillance programmes to concen-
trate on those communities and areas where the greatest
potential health gain is available from improved water supply.
The zoning approaches adopted in the case studies were
very different. In Peru, the zoning relied on primary data
collection through surveys and did not formally introduce
poverty. In Uganda, a more formal approach to include
poverty was implemented and drew on data from the
census, initial comprehensive inventory and systematically
designed water usage studies. There are benefits and
drawbacks in each approach that should be considered
when developing zoning methodology.
The approach adopted in Uganda provided a quantitative
and reproducible set of results because a national census is
repeated on a regular schedule (the most recent in Uganda was
2001) and the socio-economic index can be revised in light of
new data. Acquiring this data does not directly imply
additional costs, as the Bureau of Statistics keeps this data
and will provide details on request, but does imply the need for
39 Guy Howard and Jamie Bartram | Effective surveillance in urban areas of developing countries Journal of Water and Health | 03.1 | 2005
expertise in developing a socio-economic index and in
particular selection and weighting of variables and conditions.
There are drawbacks in using this data as it may be
considered that the usual interval between censuses (typically
ten years) would not capture inter-census changes. However,
as the approach is designed to capture relative socio-economic
status, the impact in Uganda was not significant because,
despite changes in conditions, relative status was less
responsive. There was little evidence that ‘gentrification’ of
low-income areas occurred on a wide scale in Kampala. In a
review in 2002 of possible changes in socio-economic
conditions within the city, it was concluded that there were
limited changes in relative socio-economic status (Howard
et al. 2002). Although the index proved useful, it is important to
note that in other countries different variables may be
included, for instance nutritional status, where this is available
and used in poverty assessments.
As population is recorded within censuses, the popu-
lation density component can be readily updated, but use of
this data may well not be sensitive to inter-census changes.
The approach is also not sensitive to intra-urban variation
in growth rates that may be significant. The use of this
approach would certainly not account for very rapidly
developed squatter settlements; however, these were not a
common feature in Kampala. Such drawbacks would,
however, represent problems in applying this approach in
cities where land invasion is common, such as in Latin
America (Hardoy and Satterthwaite 1989). Although such
drawbacks exist because the population density component
is essentially a relative measure, changes in actual popu-
lation density in Kampala appear to have had relatively
limited impact on the use of the zoning methodology.
As a comprehensive inventory would be expected as the
first activity in developing a water supply surveillance
programme (Lloyd & Bartram 1991; WHO 1997), no additional
costs areaccrued byusing this aspartofa zoningmethodology.
The Uganda methodology used data from water usage studies
to refine the component dealing with water availability and
use. Although this incurred additional costs, in situations with
complex water supply availability, such studies are essential to
ensure that only those sources used for consumption are
included within programmes to test water quality. Therefore,
these studies provide useful data beyond that used in the
zoning methodology.
The zoning employed in Peru relied more heavily on
surveys. The lack of an explicit measure of poverty is a
limitation, as the approach assumes the major influence of
poverty can be captured through service level of water
supply and estimates of population density. The approach
used in Peru did standardise data collection and therefore
can be seen as providing reliable data, although perhaps not
as rich as the semi-quantitative approach used in Uganda.
In repeating the survey approach adopted in Peru, there
would be a benefit in collecting data on household
characteristics that would allow a wider definition of
socio-economic status to be derived.
A follow-up exercise in Uganda, for instance, used
sample surveys where data were collected in the field on
roof material and wall material, which provides an
indication of relative wealth (Howard et al. 2002). However,
the use of limited surveys was not found to be wholly
satisfactory, as it became clear that in defining socio-
economic status other data originally included within the
quantitative index used, notably employment type, must
have exerted a significant influence on overall socio-
economic score. Whilst it would be possible to collect
such data through community interview, doing so would be
likely to increase costs and it may be more cost-effective to
use secondary data from a census or other surveys where
this was available and considered reasonably reliable.
Both case studies allowed surveillance programmes to
prioritise activities and therefore both have legitimacy.
In general, the approach used in Uganda may provide
greater reliability and reproducibility of results. However, in
countries where recent census data is not available, is
considered unreliable or cannot be disaggregated to
sufficiently small areas, the use of the survey approach in
Peru provides useful data for the surveillance programme.
In repeating such exercises, the development and field-
testing of a range of tools and means of collecting data on
socio-economic conditions would be of value.
The testing of validity of such approaches is of
importance in assessing whether they provide reliable
information regarding likely impact on public health in
different communities. In Uganda, the outbreak of cholera
provided an opportunity to use health outcome data as a
means of validating the approach. This was not without
problems given the imprecise reporting of some parishes
40 Guy Howard and Jamie Bartram | Effective surveillance in urban areas of developing countries Journal of Water and Health | 03.1 | 2005
within the health statistics. There would be value in
developing approaches to validity testing through the use
of routinely collected data on diarrhoeal disease. However,
the weakness in health surveillance systems in most
developing countries suggests that it may be difficult to
rely on data from clinics and there may be a need to develop
routine prospective data collection in carefully selected
sentinel communities (WHO 2004).
In the case studies presented here, the surveillance
programme moved beyond simply addressing measures of
water quality and took a more comprehensive view of water
supply adequacy. These indicators were continuity of
supply, cost (affordability) of water at a household level,
water quantity (as determined by service level) and the
quality of water. The rationale for each of these criteria was
outlined based on the work in Peru (Lloyd & Bartram 1991)
and is now accepted, along with estimates of coverage, as
providing the core set of indicators of value for surveillance
bodies in developing countries (WHO 1997). In Uganda,
qualitative estimates of leakage from piped water supplies,
collected through sanitary inspection, also provided a useful
measure of the quality of the water supply, primarily related
to overall assessment of performance by the utility. As noted
in the results, the evidence from the validation in Uganda
suggests that assessment of overall adequacy in supply is
important in predicting risks to public health.
The value of the set of core indicators is that it takes a
more comprehensive and integrated view of the adequacy of
water supply in relation to public health. Given the
evidence of the multiple ways in which water supply
influences health this is desirable. These influences include
direct impact on transmission routes of infectious disease
and indirect effects where supply inadequacy results in use
of contaminated sources of water and restricts hygiene
practices. If surveillance programmes are to be used as a
mechanism to inform improvement strategies, it is essential
that they collect data that permit an understanding of the
interactions between water supply and public health and
are able to direct investment into those interventions
yielding greatest public health gain.
Work carried out in both case studies moved beyond
assessments of the piped water system and addressed issues
relating to alternative sources and water stored within the
home.Thisdirected interventionstrategies to improve thewater
sources most commonly used by poor families and supported
improvements that delivered significant public health gains.
In both case studies, surveillance staff were also directly
involved in the delivery of improvements to water supply.
In Peru, this included changing the ‘rotation’ of water
supply to exempt hydrants used by vendors who served
slum settlements, where extension of piped water supply
was not likely to occur in the short to medium term.
In Uganda, surveillance staff were involved in the re-
protection of protected springs and hygiene education
(Howard et al. 2001). Although at an organisation level
institutional separation of the surveillance and remedial
action roles remains desirable, in practice at a community
level such differentiation may not be possible or desirable.
CONCLUSION
The development of surveillance programmes in urban areas
of developing countries can generate information about the
adequacy of water supplies to protect health. This information
is of relevance to public health professionals in helping to set
priorities for water supply improvements. The inclusion of all
water sources used and of household water is important and
has been shown to be possible.
Surveillance programmes are most effective when they
target groups that are most vulnerable to public health risks
from poor water supply, as it is within these groups that greatest
publichealthgaincanbeachievedoften throughrelatively low-
cost interventions. Simple techniques can provide direction in
identifying priority areas as shown by the example from Peru.
Targeting of the urban poor can be most effectively achieved
when poverty and vulnerability are used in determining the
water supply surveillance data collection process. This has
been shown in Uganda to be an effective tool in assessing
vulnerability of communities to outbreaks of disease.
The data generated through well-designed and
implemented surveillance programmes can be used to
provide public health input into water supply improvements.
Therefore, the development of targeted surveillance pro-
grammes has the potential to do much to help reduce the
infectious disease burden faced by the poor in urban areas of
developing countries.
41 Guy Howard and Jamie Bartram | Effective surveillance in urban areas of developing countries Journal of Water and Health | 03.1 | 2005
ACKNOWLEDGEMENT
The authors wish to thank the Department for International
Development, UK (DFID) for their support in funding the
research leading to this paper. The views expressed in this
paper are those of the authors and do not reflect the official
position of DFID or WHO. The authors would also like to
thank Ricardo Rojas, WHO-CEPIS, Lima, Peru, and Paul
Luyima, Ministry of Health, Uganda, for their constructive
comments in the preparation of this paper.
REFERENCES
Andreasen, J. 1996 Urban tenants and community involvement.
Habitat Int. 20(3), 359–365.
Bartram, J. K. 1999 Effective monitoring of small drinking water
supplies. In: Providing Safe Drinking Water in Small Systems:
Technology, Operations and Economics (Cotruvo, J. A., Craun,
G. F. & Hearne, N. eds). Lewis Publishers, Washington, D.C.,
pp. 353–365.
Bartram, J. & Ballance, R. (eds) 1996 Water Quality Monitoring.
E&FN Spon, London.
Bigsten, A. & Kayizzi-Mugerwa, S. 1992 Adaptation and distress in
the urban economy: a study of Kampala households. Wld Dev.
20(10), 1423–1441.
Cairncross, S. & Kinnear, J. 1992 Elasticity of demand for water in
Khartoum. Sudan. Soc. Sci. Med. 34(2), 183–189.
DFID 2001 Addressing the Water Crisis: Healthier and More
Productive Lives for Poor People. Department for
International Development, London.
Esrey, S. A., Feacham, R. G. & Hughes, J. M. 1985 Interventions
for the control of diarrhoeal diseases among young children:
improving water supplies and excreta disposal facilities.
Bull. Wld Health Orgn 63(4), 757–772.
Esrey, S. A., Potash, J. B., Roberts, L. & Shiff, C. 1991 Effects of
improved water supply and sanitation on ascariasis, diarrhoea,
dracunculiasis, hookworm infection, schistosomiasis, and
trachoma. Bull. Wld Health Orgn 69(5), 609–621.
Fass, S. M. 1993 Water and poverty: implications for water
planning. Wat. Resour. Res. 29(7), 1975–1981.
Ford, T. E. 1999 Microbiological safety of drinking water: United
States and global perspectives. Environ. Health Perspect.
107(S1), 191–206.
Geldreich, E. E. 1996 Microbiological Quality of Water Supply in
Distribution Systems. Lewis Publishers, New York.
Gelinas, Y., Randall, H., Robidoux, L. & Schmit, J-P. 1996 Well water
survey in two Districts of Conakry (republic of Guinea) and
comparison with the piped city water. Wat. Res. 30(9), 2017–2026.
Hardoy, J. E. & Satterthwaite, D. 1989 Squatter Citizen: Life in the
Urban Third World. Earthscan, London.
Howard, G. 1997 Water-quality monitoring and NGOs. Waterlines
16(1), 19–22.
Howard, G. 2001 Challenges in increasing access to safe water in urban
Uganda: economic, social and technical issues. In: Safety of
Water Disinfection: balancing microbial and chemical risks
(Craun, G. F., Huachman, F. S. & Robinson, D. E. eds). ILSI
Publications, Washington, D.C., pp. 483–499.
Howard, G. (ed.) 2002 Water Supply Surveillance: A Reference
Manual. WEDC, Loughborough, UK.
Howard, G. & Bartram, J. 2003 Domestic Water Quantity, Service Level
and Health. WHO Report, World Health Organization, Geneva.
Howard, G. & Luyima, P. G. 1999a Urban water supply surveillance
in Uganda. In: Integrated Development for Water Supply and
Sanitation. Proceedings of the 25th WEDC Conference, Addis
Ababa, Ethiopia (Pickford, J. ed.). WEDC, Loughborough, UK,
pp. 290–293.
Howard, G. & Luyima, P. G. 1999b Report on Water Supply
Surveillance in Ten Selected Towns in Uganda. Government
of Uganda, Kampala, www.lboro.ac.uk/watermark.
Howard, G. & Pond, K. 2002 Drinking Water Surveillance
Programmes in the South-East Asia Region: Updated Situation
Assessment and Recommendations for Future Activity. Report
for WHO/SEARO. World Health Organization South-East
Asia Regional Office, New Delhi, India.
Howard, G., Bartram, J. K. & Luyima, P. G. 1999 Small water
supplies in urban areas of developing countries. In: Providing
Safe Drinking Water in Small Systems: Technology,
Operations and Economics (Cotruvo, J. A., Craun, G. F. &
Hearne, N.eds). Lewis Publishers, Washington, D.C.,
pp. 83–93.
Howard, G., Mutabazi, R. & Nalubega, M. 2001 Rehabilitation of
protected springs in Kampala, Uganda. In: Water, Sanitation
and Hygiene: Challenges of the Millennium. Proceedings of
the 26th WEDC Conference, Dhaka, Bangladesh (Pickford, J.
ed.). WEDC, Loughborough, UK, pp. 20–23.
Howard, G., Teuton, J., Luyima, P. & Odongo, R. 2002 Water usage
patterns in low-income urban communities in Uganda:
implications for surveillance. Int. J. Environ. Health Res.
12(1), 63–73.
Howard, G., Ince, M. & Smith, M. 2003 Handbook on Rapid
Assessment of Drinking-Water Quality. WHO, Geneva.
Kalbermatten, J. M. & Middleton, R. N. 1999 The need for
innovation. Wat. Suppl. 17(3–4), 389–395.
Karn, S. K. & Harada, H. 2002 Field survey on water supply,
sanitation and associated health impacts in urban poor
communities – a case from Mumbai City, India. Wat. Sci.
Technol. 46(11–12), 269–275.
Karte, D. 2001 Drinking water contamination in Kolkata. In: Water,
Sanitation and Hygiene: Challenges of the Millennium.
Proceedings of the 26th WEDC Conference, Dhaka,
Bangladesh (Pickford, J. ed.). WEDC, Loughborough, UK,
pp. 224–226.
Lloyd, B. & Bartram, J. 1991 Surveillance solutions to
microbiological problems in water quality control in
developing countries. Wat. Sci. Technol. 24(2), 61–75.
Lloyd, B. & Helmer, R. 1991 Surveillance of Drinking Water Quality
in Rural Areas. Longman, Harlow, UK.
42 Guy Howard and Jamie Bartram | Effective surveillance in urban areas of developing countries Journal of Water and Health | 03.1 | 2005
Lloyd, B., Bartram, J., Rojas, R., Pardon, M., Wheeler, D. &
Wedgewood, K. 1991 Surveillance and Improvement of
Peruvian Drinking Water Supplies. Robens Institute, DelAgua
and ODA, Guildford, UK.
Madanat, S. & Humplinck, F. 1993 A model of household choice of
water supply systems in developing countries. Water. Resour.
Res. 29(5), 1353–1358.
McMichael, A. J. 2000 The urban environment and health in a
world of increasing globalization: issues for developing
countries. Bull. Wld Health Orgn 78(9), 1117–1126.
Nasinyama, G. W., McEwen, S. A., Wilson, J. B., Waltner-Towers,
D., Gyles, C. L. & Opuda-Asibo, J. 2000 Risk factors for acute
diarrhoea among inhabitants of Kampala District. Uganda.
SA Med. J. 90(90), 891–898.
Parr, J. & Rogers, J. 2002 Water quality monitoring in Anguilla.
J. CIWEM 16(2), 96–99.
Payment, P. & Hunter, P. R. 2001 Endemic and epidemic infectious
intestinal disease and its relationship to drinking water. In:
Water Quality: Guidelines, Standards and Health (Fewtrell, L.
& Bartram, J. eds). IWA Publishing, London, pp. 61–88.
Pruss, A., Kay, D., Fewtrell, L. & Bartram, J. 2002 Estimating the burden
of disease from water, sanitation and hygiene at a global level.
Environ. Health Perspect. 110(5), 537–542.
Rahman, A., Lee, H. K. & Khan, M. A. 1997 Domestic water
contamination in rapidly growing megacities of Asia: Case of
Karachi, Pakistan. Environ. Monit. Assess. 44(1–3),
339–360.
Stephens, C. 1995 The urban environment, poverty and health
in developing countries. Health Policy Plann. 10(2),
109–121.
Stephens, C., Akerman, M., Avle, S., Maia, P. B., Campanario, P.,
Doe, B. & Tetteh, D. 1997 Urban equity and urban health:
using existing data to understand inequalities in health and
environment in Accra, Ghana and Sao Paulo, Brazil. Environ.
Urban. 9(1), 181–202.
Steynberg, M. 2002 Drinking water quality assessment practices:
a review of international experience. Wat. Sci. Technol.:
Wat. Suppl. 2(2), 43–49.
Tatietse, T. T. & Rodriguez, M. 2001 A method to improve population
access to drinking water networks in cities of developing
countries. J. Wat. Suppl.: Res. & Technol.-AQUA 50(1), 47–60.
UNCHS 2001 Cities in a Globalizing World: Global Report on
Human Settlements 2001. Earthscan, London.
United Nations General Assembly 2000 Resolution 55/2:
Millennium Declaration. United Nations, New York.
WELL 1998 Guidance Manual on Water Supply and Sanitation
Programmes. WEDC, Loughborough, UK.
Whittington, D., Lauria, D. T. & Mu, X. 1991 A study of water
vending and willingness to pay for water in Onitsha. Nigeria.
Wld Dev. 19(2–3), 179–198.
WHO 1976 Surveillance of Drinking-Water Quality. World Health
Organization, Geneva.
WHO 1993 Guidelines for Drinking-Water Quality: Volume 1
Recommendations, 2nd edition. World Health Organization,
Geneva.
WHO 1997 Guidelines for Drinking-Water Quality: Volume 3
Surveillance and Control of Community Water Supplies,
2nd edition. World Health Organization, Geneva.
WHO 2002 Reducing Risks, Promoting Healthy Life, World Health
Report 2002. World Health Organization, Geneva.
WHO 2004 Guidelines for Drinking-Water Quality: Volume 1
Recommendations, 3rd edition. World Health Organization,
Geneva.
WHO and UNICEF 2000 Global Water Supply and Sanitation
Assessment 2000 Report. World Health Organization/United
Nations Children’s Fund, Geneva/New York.
Woodward, A., Hales, S., Litidamu, N., Philips, D. & Martin, J.
2000 Protecting human health in a changing world: the role
of social and economic development. Bull. Wld Health Orgn
78(9), 1148–1155.
43 Guy Howard and Jamie Bartram | Effective surveillance in urban areas of developing countries Journal of Water and Health | 03.1 | 2005