Embed Size (px)
Citation preview

CLICKHERETOKNOWMORE

GEOSPATIAL APPLICATION FOR WATER SUPPLY
BY HAJI IBRAHIM B.ABDUL RAHMAN
DEPUTY DIRECTOR
WATER SUPPLY DEPARTMENT
MINISTERY OF ENERGY, GREEN TECHNOLOGY AND WATER MALAYSIA
BERJAYA TIMES SQUARE HOTEL , KUALA LUMPUR
18 OCTOBER 2016
CONTENTS 1. Introduction
2. Types of Geospatial Technologies
3. GeoSpatial Applications in Water Supply
4. History of Application in Water Supply
5. Financial Allocations for GIS related projects
6. Current GeoSpatial Related Applications
7. Conclusion
• Is the range of modern tools contributing to the geographic mapping and analysis of the Earth and human societies.
• Airborne photo/satellite imagery allowed image capturing of the Earth’s surface and human activities with certain limitations.
• Computers allowed storage and transfer of imagery together with the development of associated digital software, maps, and data sets on socioeconomic and environmental phenomena, collectively called geographic information systems (GIS).
WHAT IS GEOSPATIAL TECHNOLOGIES?

WHAT IS GEOSPATIAL TECHNOLOGIES? • GIS assemble the range of geospatial data into a layered set of maps which allow
complex themes to be analyzed and then communicated to wider audiences. This ‘layering’ is enabled by the fact that all such data includes information on its precise location on the surface of the Earth, hence the term ‘geospatial’.
• In the last decade, satellite technologies have evolved into a network of national security, scientific, and commercially operated satellites complemented by powerful desktop GIS. High quality hardware and data is now available to new audiences such as universities, corporations, and non-governmental organizations.
• The fields and sectors deploying these technologies are currently growing at a rapid pace, informing decision makers on topics such as industrial engineering, biodiversity conservation, forest fire suppression, agricultural monitoring, humanitarian relief, and much more.
TYPE OF GEOSPATIAL TECHNOLOGY
• Remote Sensing: imagery and data collected from space- or airborne camera and sensor platforms. Some commercial satellite image providers now offer images showing details of one-meter or smaller, making these images appropriate for monitoring humanitarian needs and human rights abuses.
• Geographic Information Systems (GIS): a suite of software tools for mapping and analyzing data which is georeferenced (assigned a specific location on the surface of the Earth, otherwise known as geospatial data). GIS can be used to detect geographic patterns in other data, such as disease clusters resulting from toxins, sub-optimal water access, etc.
• Global Positioning System (GPS): a network of U.S. Department of Defense satellites which can give precise coordinate locations to civilian and military users with proper receiving equipment (note: a similar European system called Galileo will be operational within the next several years while a Russian system is functioning but restricted).
• Internet Mapping Technologies: software programs like Google Earth and web features like Microsoft Virtual Earth are changing the way geospatial data is viewed and shared. The developments in user interface are also making such technologies available to a wider audience whereas traditional GIS has been reserved for specialists and those who invest time in learning complex software programs.
TYPE OF GEOSPATIAL TECHNOLOGY
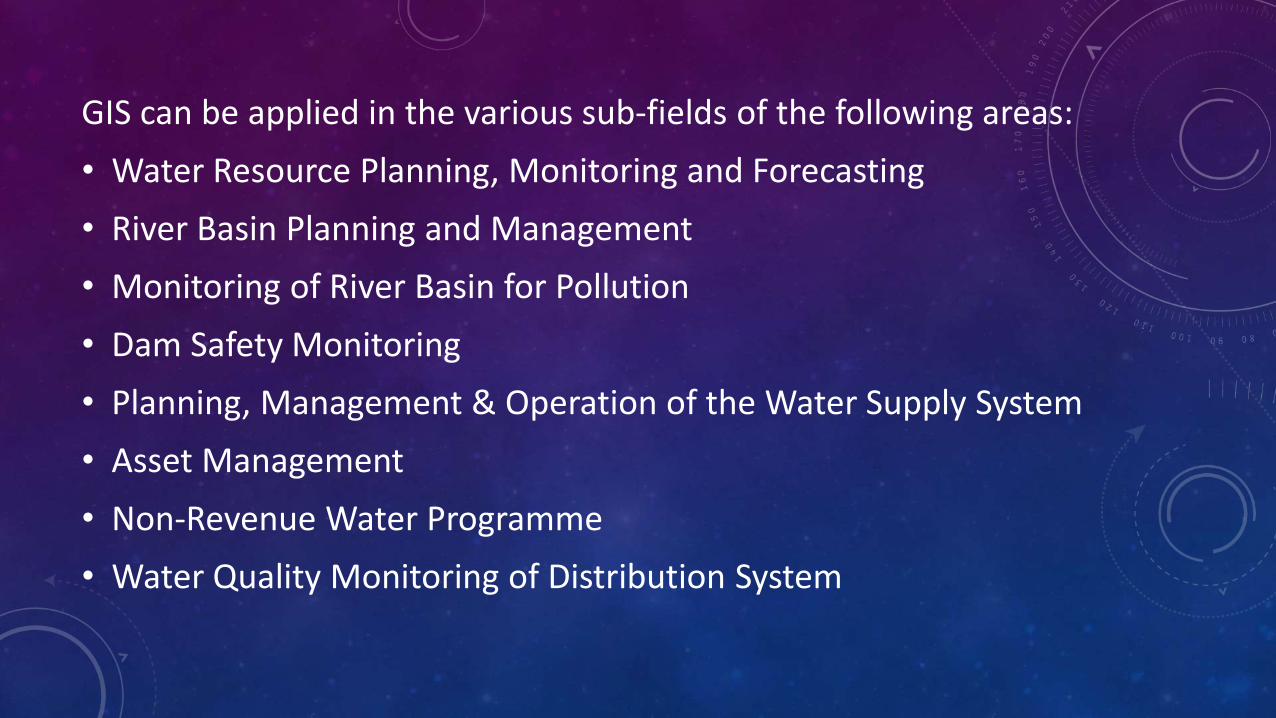
GIS can be applied in the various sub-fields of the following areas:
• Water Resource Planning, Monitoring and Forecasting
• River Basin Planning and Management
• Monitoring of River Basin for Pollution
• Dam Safety Monitoring
• Planning, Management & Operation of the Water Supply System
• Asset Management
• Non-Revenue Water Programme
• Water Quality Monitoring of Distribution System
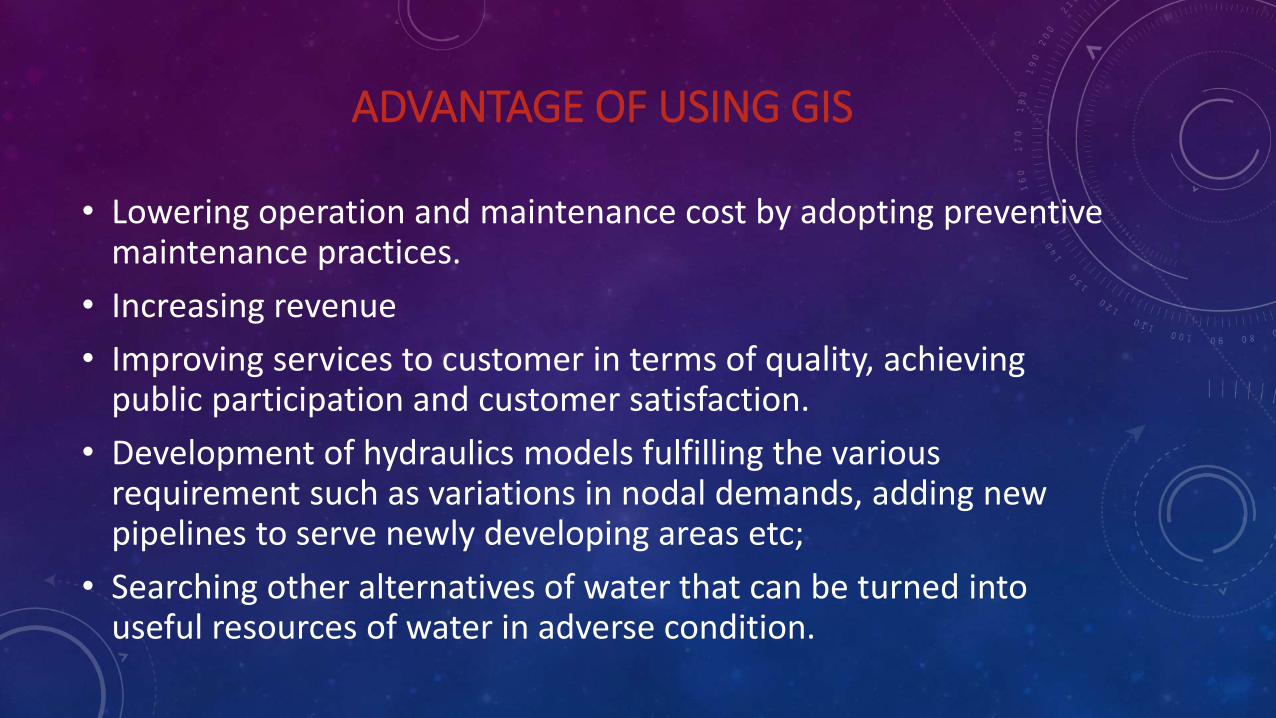
ADVANTAGE OF USING GIS
• Lowering operation and maintenance cost by adopting preventive maintenance practices.
• Increasing revenue
• Improving services to customer in terms of quality, achieving public participation and customer satisfaction.
• Development of hydraulics models fulfilling the various requirement such as variations in nodal demands, adding new pipelines to serve newly developing areas etc;
• Searching other alternatives of water that can be turned into useful resources of water in adverse condition.
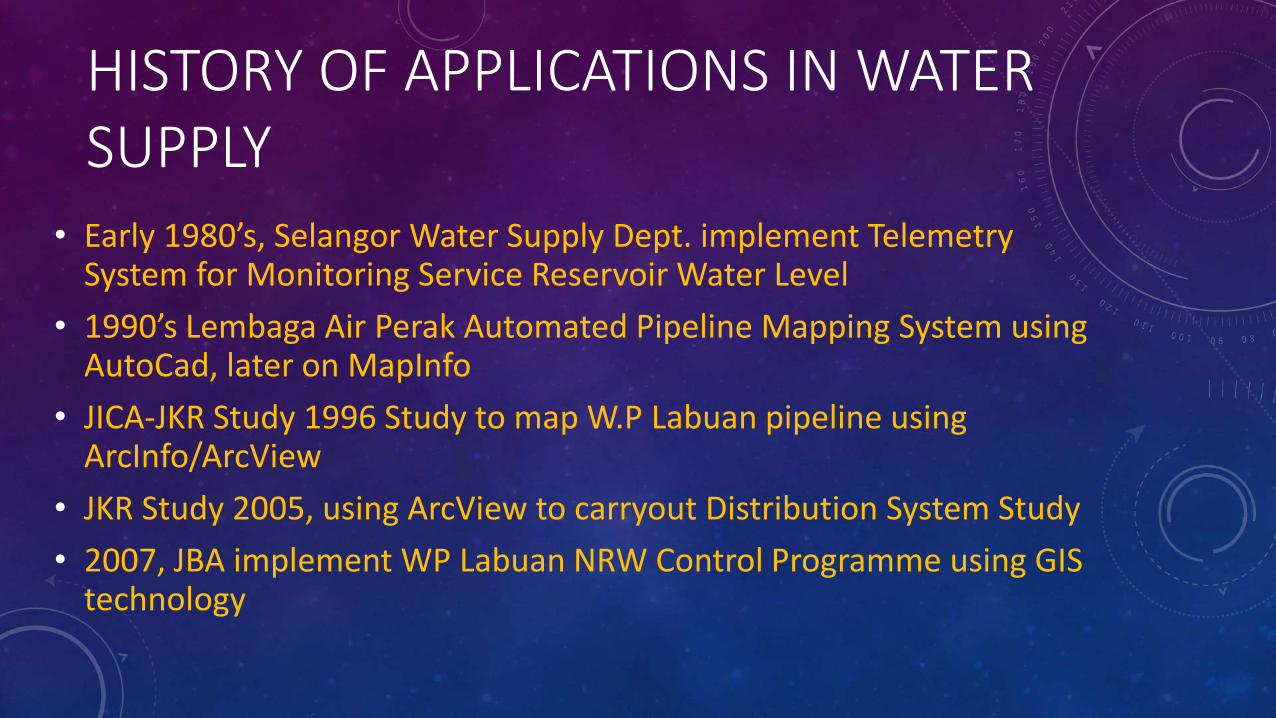
HISTORY OF APPLICATIONS IN WATER SUPPLY • Early 1980’s, Selangor Water Supply Dept. implement Telemetry System for Monitoring Service Reservoir Water Level
• 1990’s Lembaga Air Perak Automated Pipeline Mapping System using AutoCad, later on MapInfo
• JICA-JKR Study 1996 Study to map W.P Labuan pipeline using ArcInfo/ArcView
• JKR Study 2005, using ArcView to carryout Distribution System Study
• 2007, JBA implement WP Labuan NRW Control Programme using GIS technology
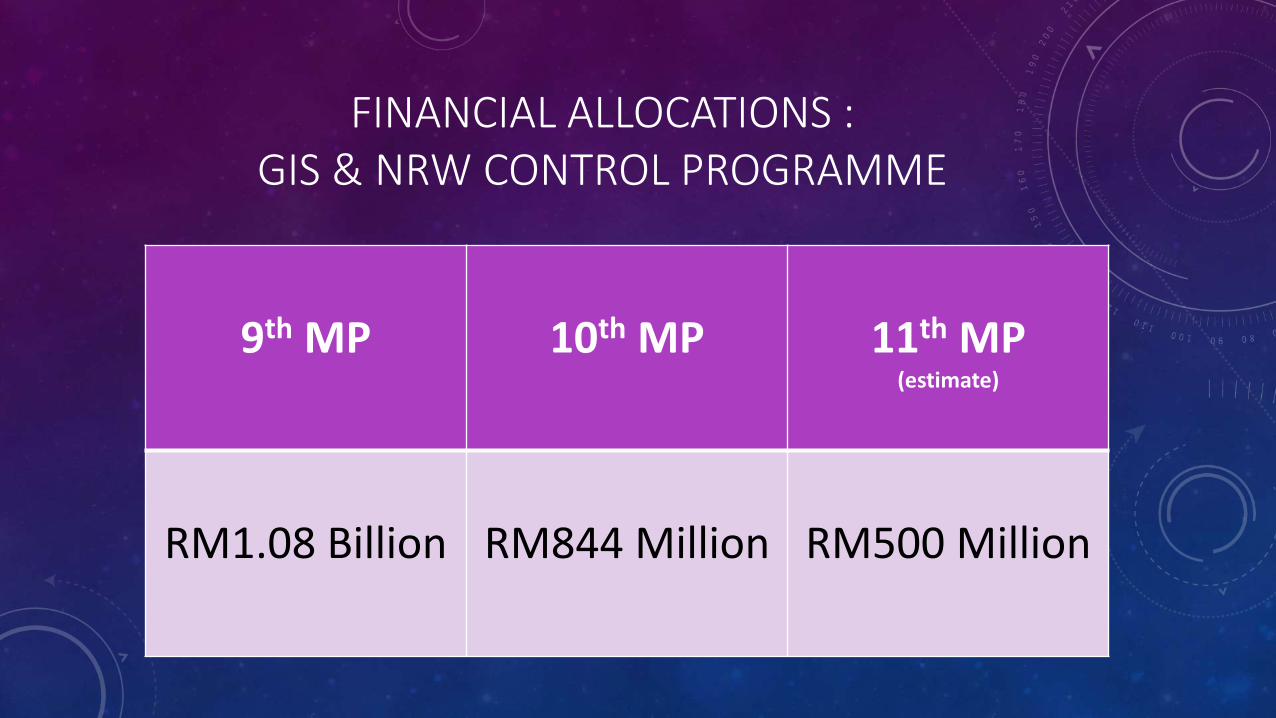
FINANCIAL ALLOCATIONS : GIS & NRW CONTROL PROGRAMME
9th MP
10th MP
11th MP
(estimate)
RM1.08 Billion
RM844 Million
RM500 Million
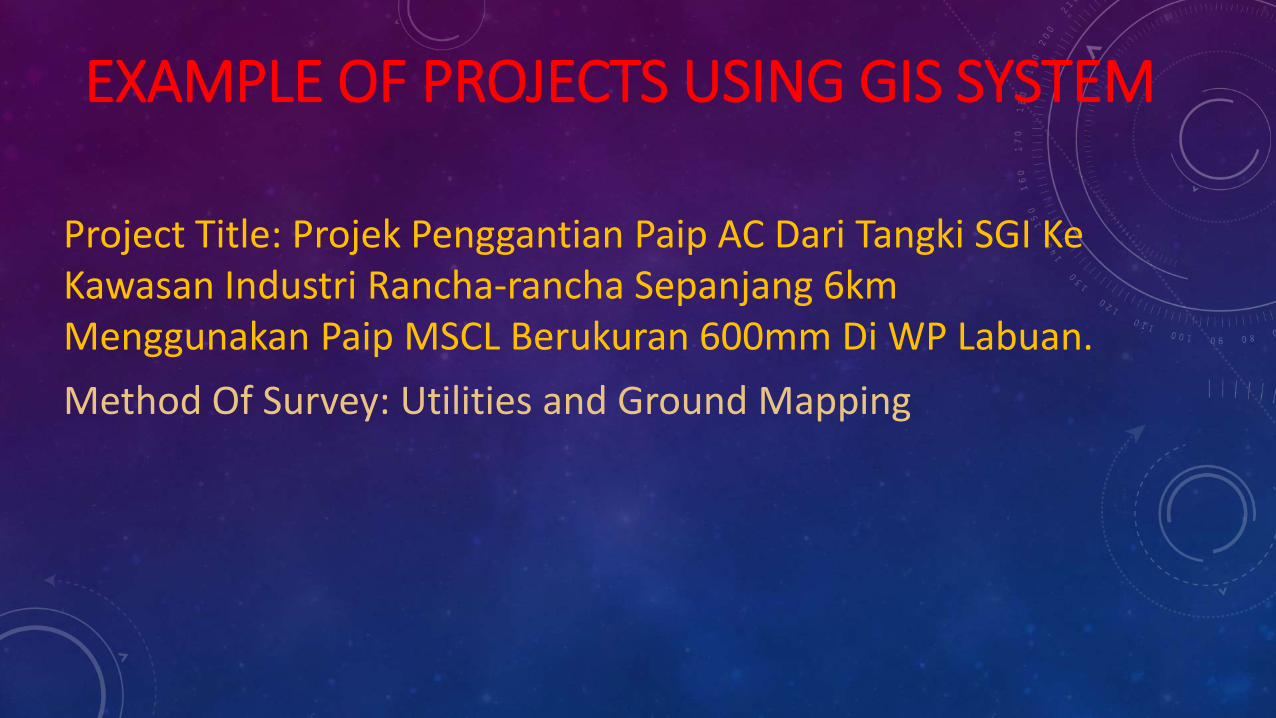
EXAMPLE OF PROJECTS USING GIS SYSTEM
Project Title: Projek Penggantian Paip AC Dari Tangki SGI Ke Kawasan Industri Rancha-rancha Sepanjang 6km Menggunakan Paip MSCL Berukuran 600mm Di WP Labuan.
Method Of Survey: Utilities and Ground Mapping
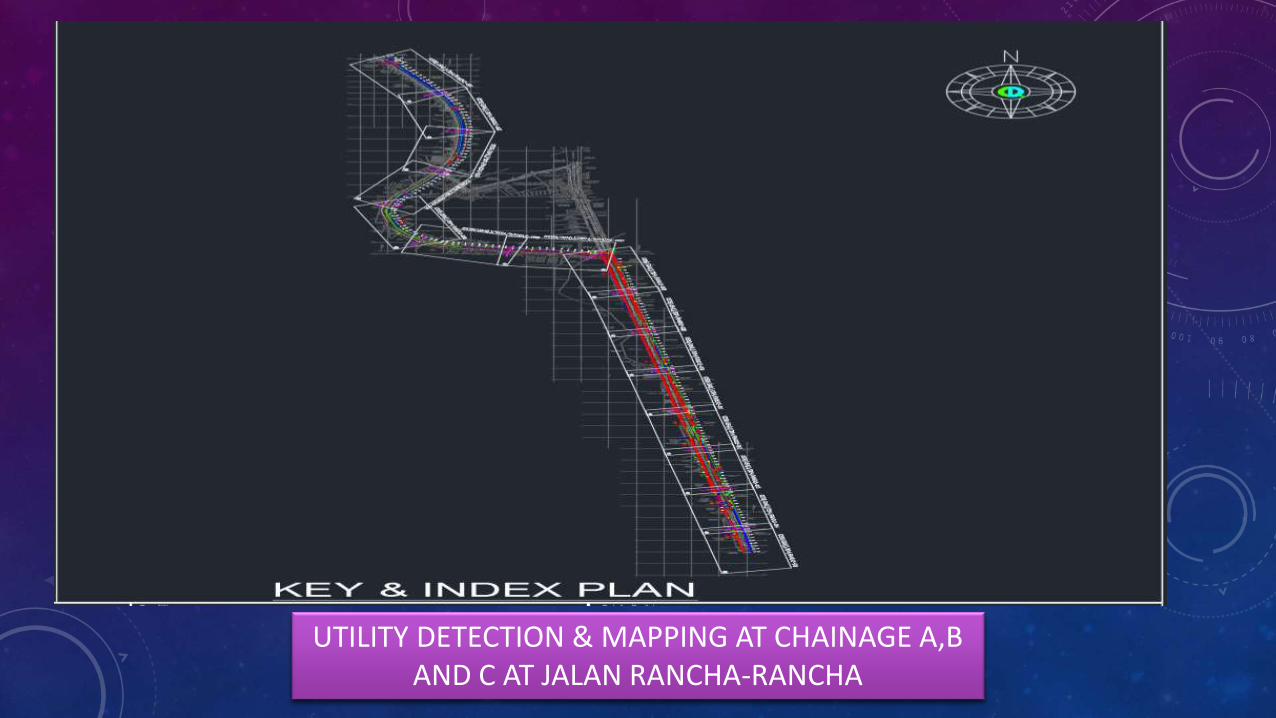
UTILITY DETECTION & MAPPING AT CHAINAGE A,B AND C AT JALAN RANCHA-RANCHA
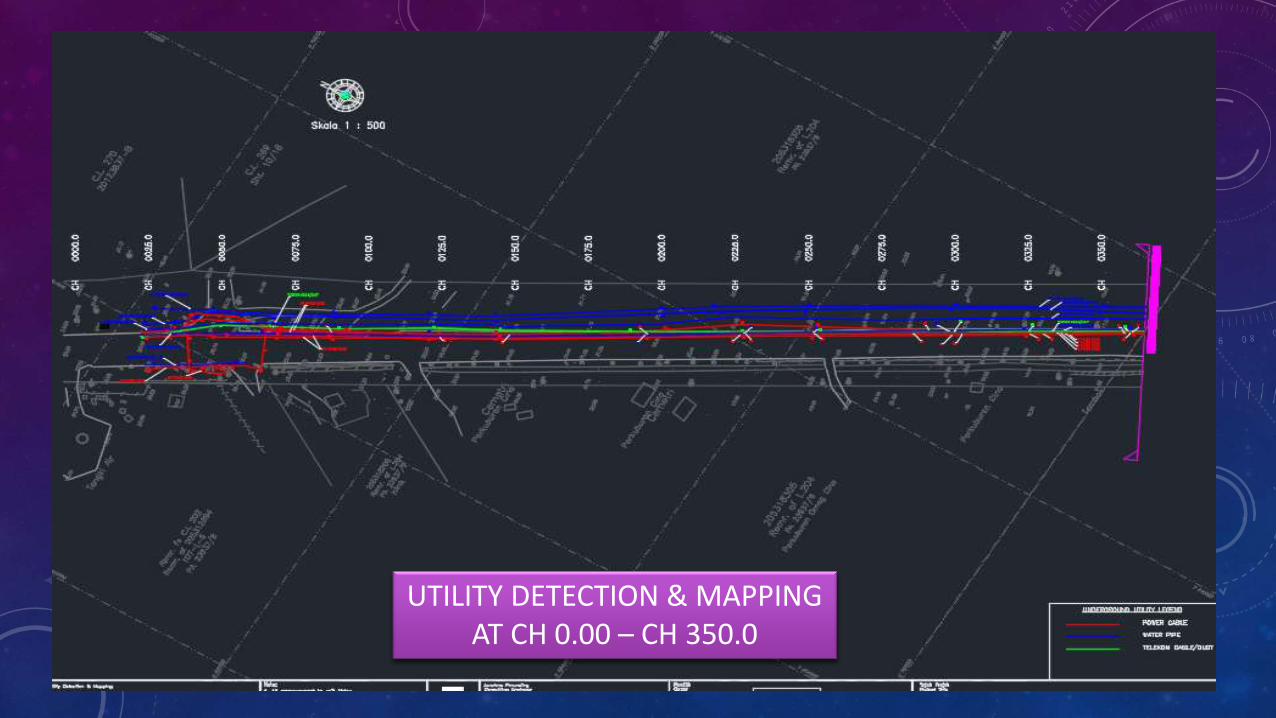
UTILITY DETECTION & MAPPING AT CH 0.00 – CH 350.0
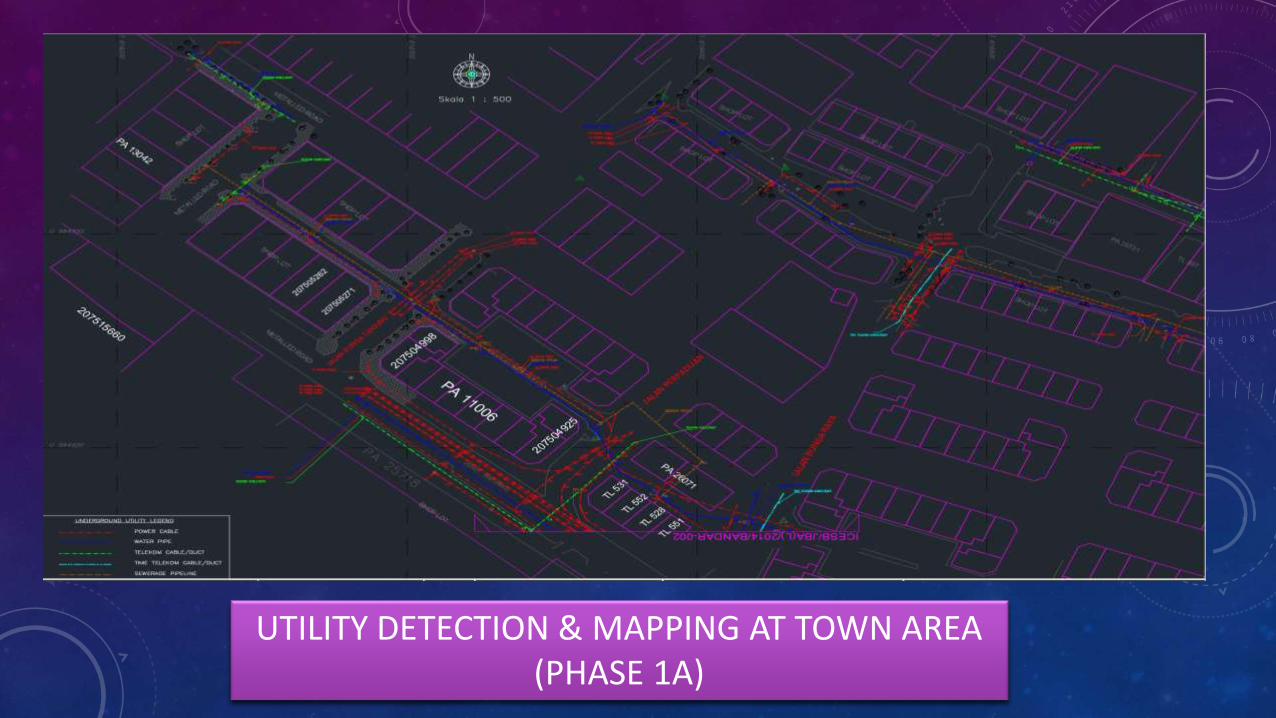
UTILITY DETECTION & MAPPING AT TOWN AREA (PHASE 1A)
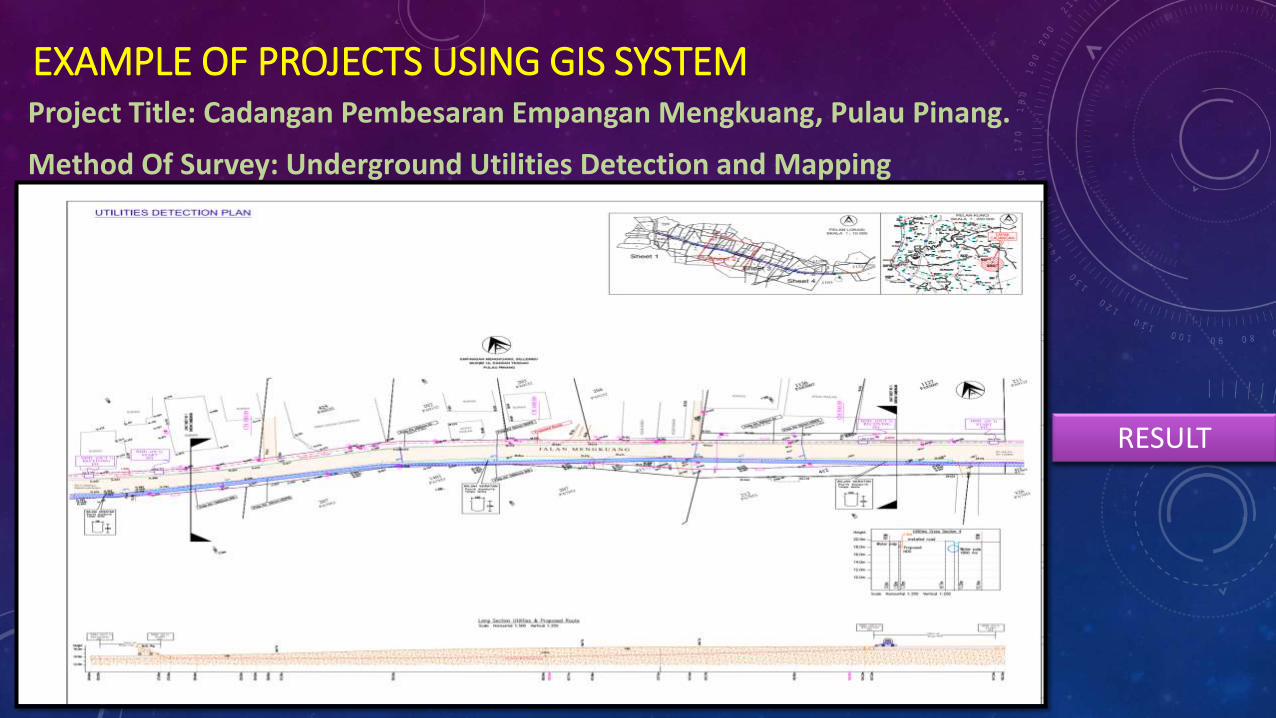
EXAMPLE OF PROJECTS USING GIS SYSTEM Project Title: Cadangan Pembesaran Empangan Mengkuang, Pulau Pinang.
Method Of Survey: Underground Utilities Detection and Mapping
RESULT
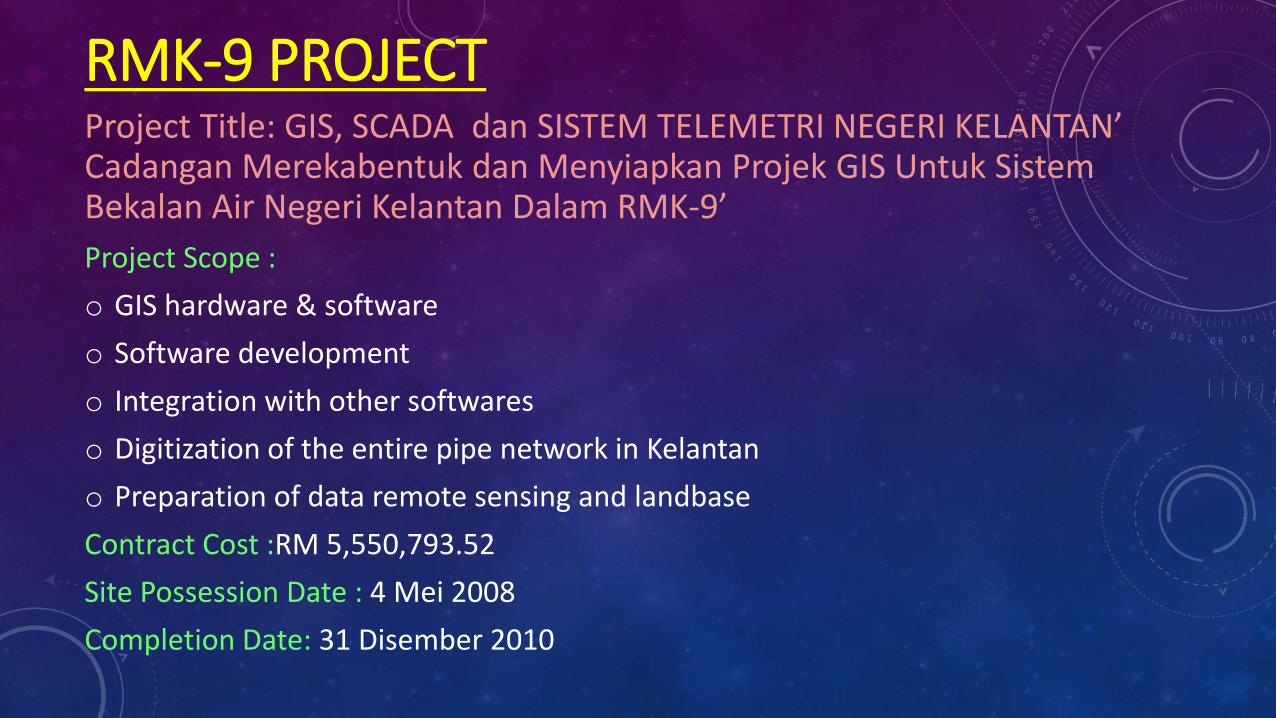
RMK-9 PROJECT Project Title: GIS, SCADA dan SISTEM TELEMETRI NEGERI KELANTAN’ Cadangan Merekabentuk dan Menyiapkan Projek GIS Untuk Sistem Bekalan Air Negeri Kelantan Dalam RMK-9’
Project Scope :
o GIS hardware & software
o Software development
o Integration with other softwares
o Digitization of the entire pipe network in Kelantan
o Preparation of data remote sensing and landbase
Contract Cost :RM 5,550,793.52
Site Possession Date : 4 Mei 2008
Completion Date: 31 Disember 2010
SUMMARY OF THE OUTCOMES AND RESULTS

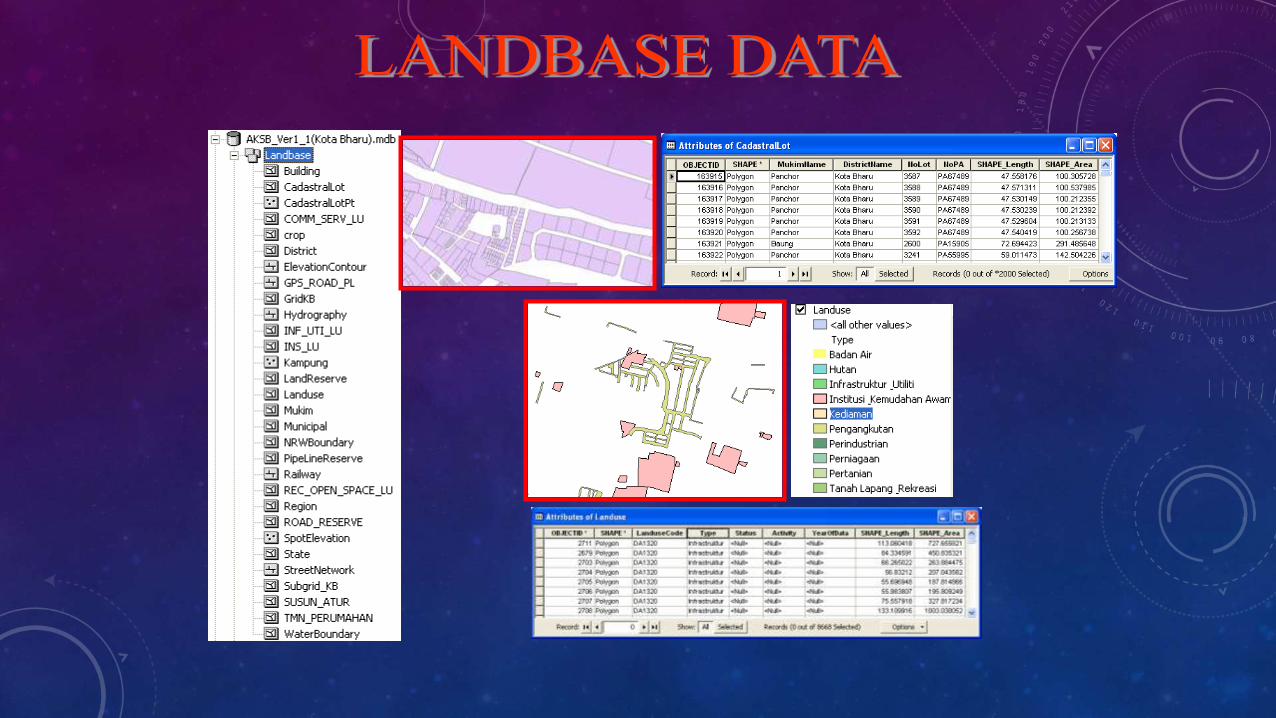
DIGITIZATION OF THE ENTIRE PIPE NETWORK
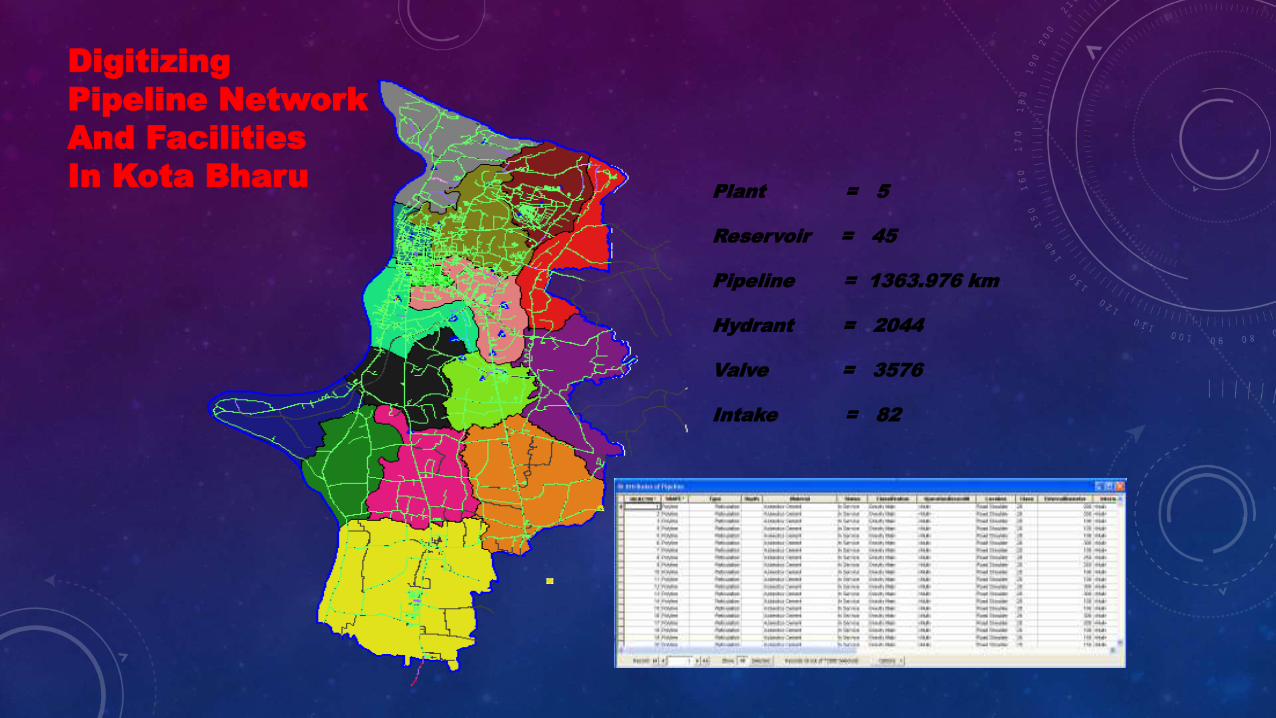
Digitizing
Pipeline Network
And Facilities
In Kota Bharu Plant = 5 Reservoir = 45 Pipeline = 1363.976 km Hydrant = 2044 Valve = 3576 Intake = 82
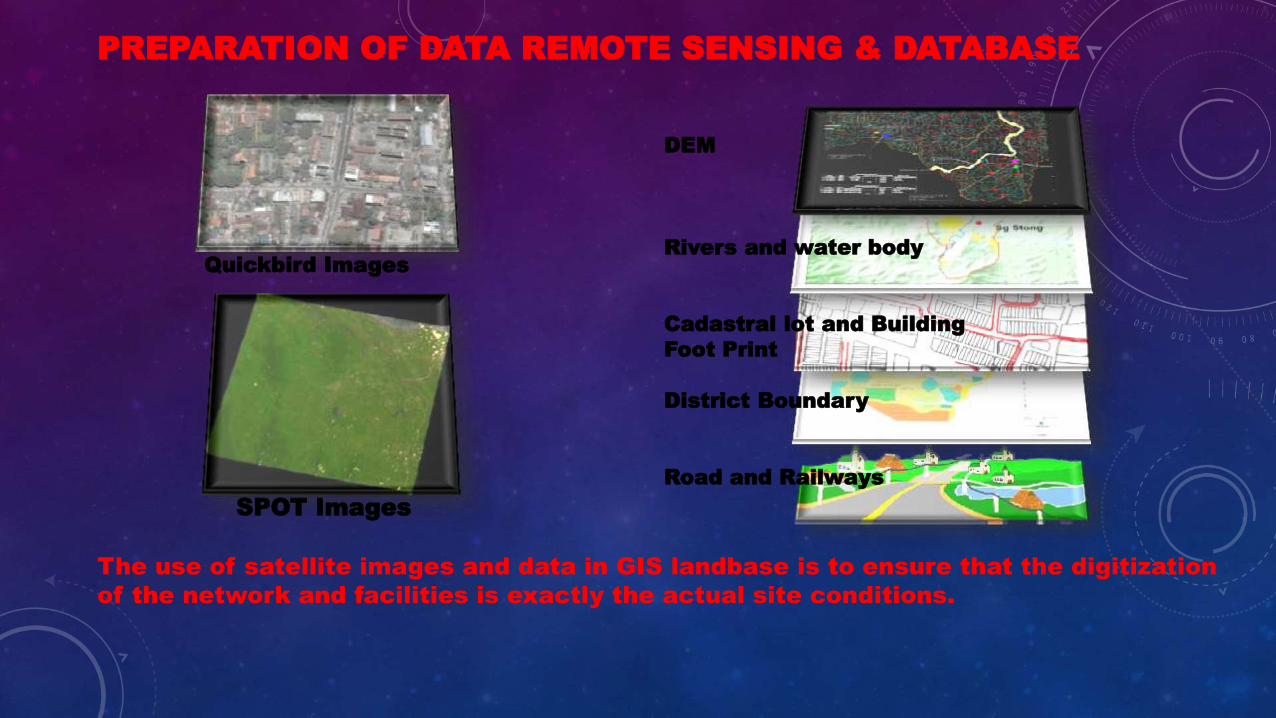
PREPARATION OF DATA REMOTE SENSING & DATABASE
DEM
Rivers and water body
Cadastral lot and Building
Foot Print
District Boundary
Road and Railways
Quickbird Images
SPOT Images
The use of satellite images and data in GIS landbase is to ensure that the digitization
of the network and facilities is exactly the actual site conditions.
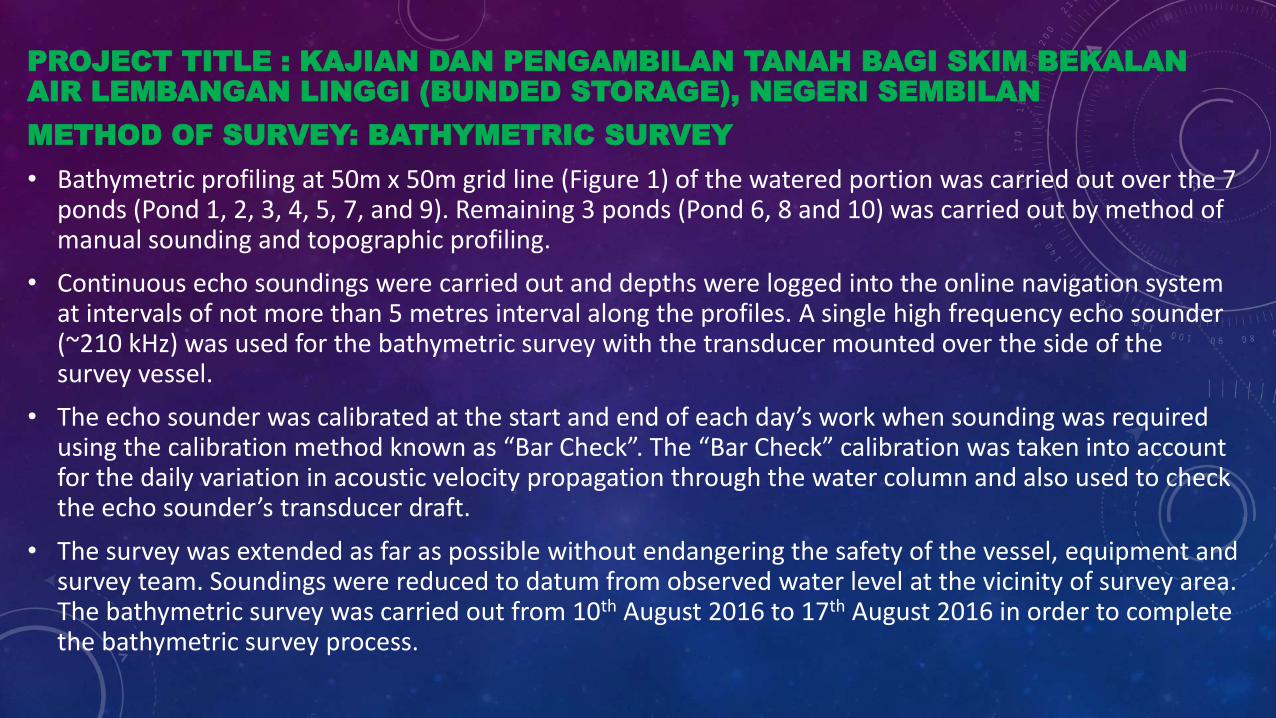
PROJECT TITLE : KAJIAN DAN PENGAMBILAN TANAH BAGI SKIM BEKALAN AIR LEMBANGAN LINGGI (BUNDED STORAGE), NEGERI SEMBILAN
METHOD OF SURVEY: BATHYMETRIC SURVEY
• Bathymetric profiling at 50m x 50m grid line (Figure 1) of the watered portion was carried out over the 7 ponds (Pond 1, 2, 3, 4, 5, 7, and 9). Remaining 3 ponds (Pond 6, 8 and 10) was carried out by method of manual sounding and topographic profiling.
• Continuous echo soundings were carried out and depths were logged into the online navigation system at intervals of not more than 5 metres interval along the profiles. A single high frequency echo sounder (~210 kHz) was used for the bathymetric survey with the transducer mounted over the side of the survey vessel.
• The echo sounder was calibrated at the start and end of each day’s work when sounding was required using the calibration method known as “Bar Check”. The “Bar Check” calibration was taken into account for the daily variation in acoustic velocity propagation through the water column and also used to check the echo sounder’s transducer draft.
• The survey was extended as far as possible without endangering the safety of the vessel, equipment and survey team. Soundings were reduced to datum from observed water level at the vicinity of survey area. The bathymetric survey was carried out from 10th August 2016 to 17th August 2016 in order to complete the bathymetric survey process.

Figure 1:Topographic and Bathymetric Survey Areas
Pond 1 Pond 2
Pond 3
Pond 4 Pond 5
Pond 6 Pond 7
Pond 10
Pond 8 Pond 9
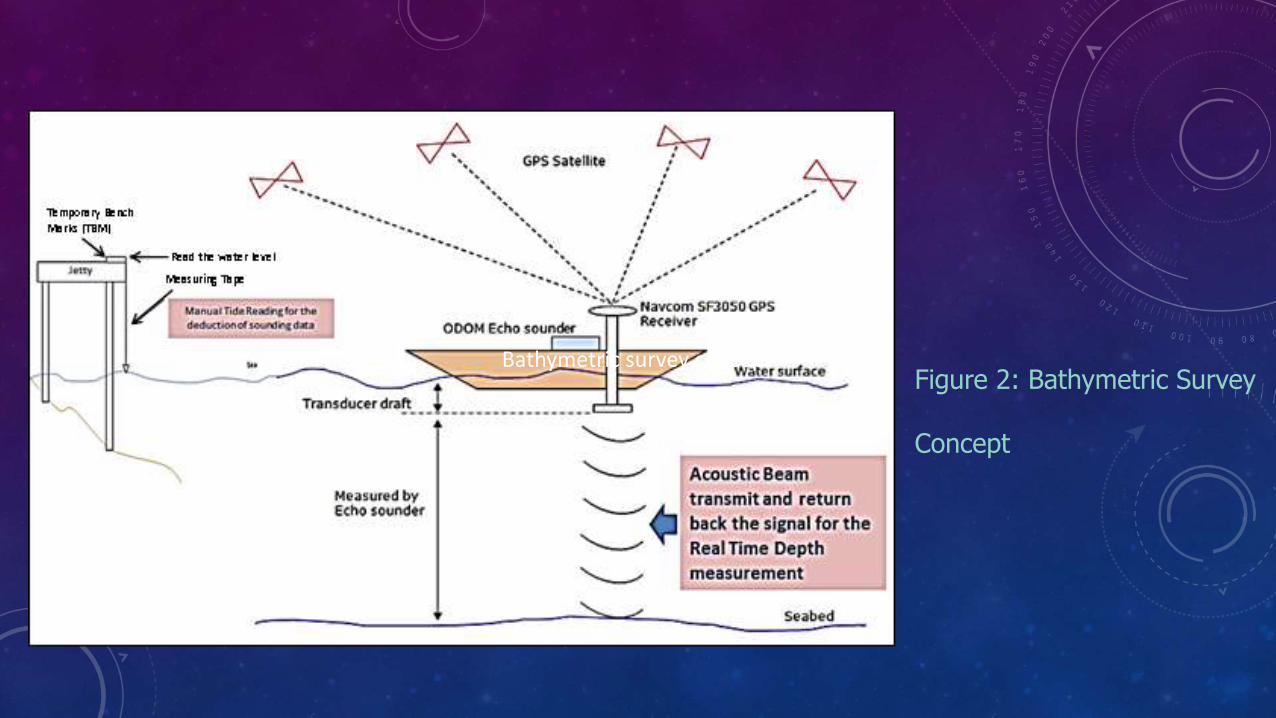
Figure 2: Bathymetric Survey
Concept
Bathymetric survey concept

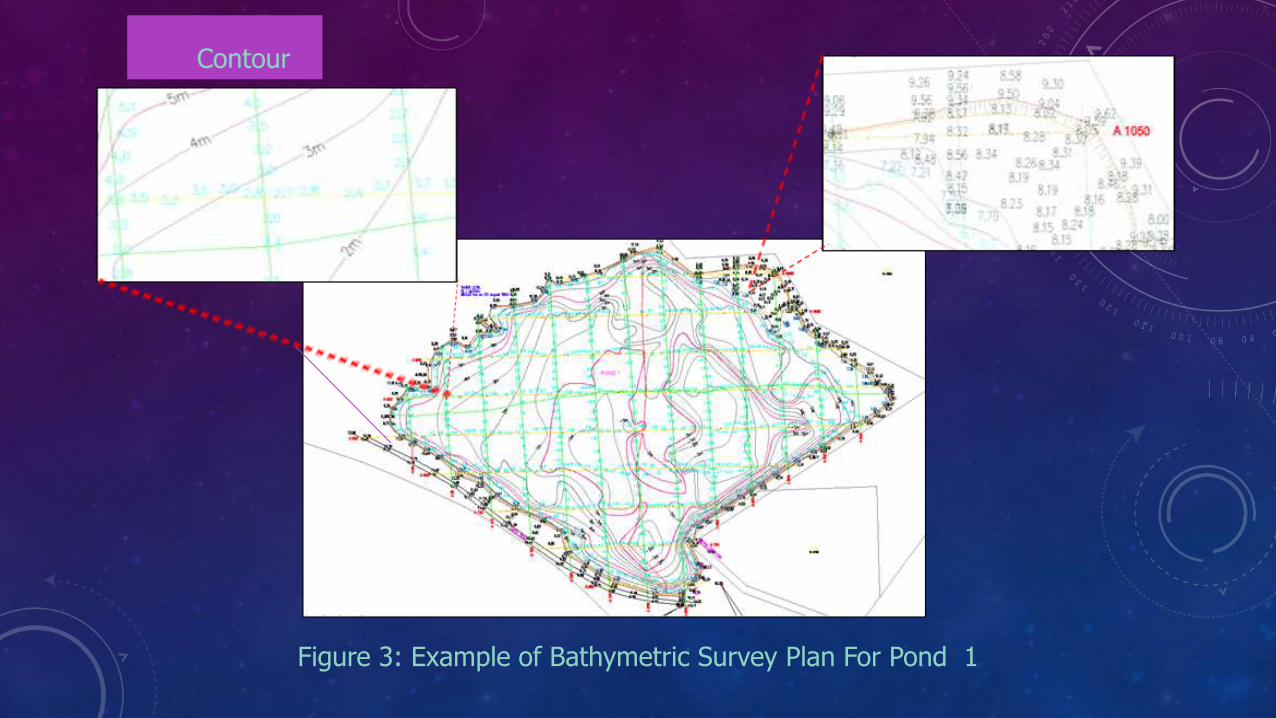
Figure 3: Example of Bathymetric Survey Plan For Pond 1
Contour
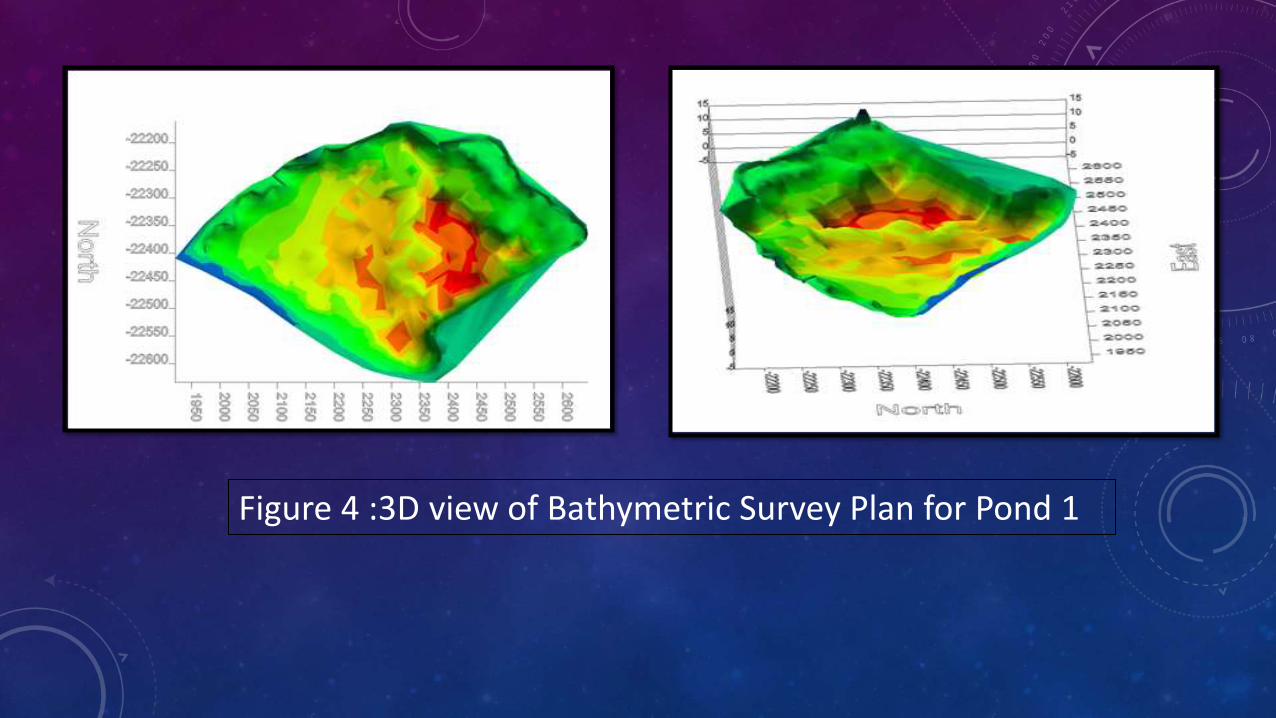
Figure 4 :3D view of Bathymetric Survey Plan for Pond 1
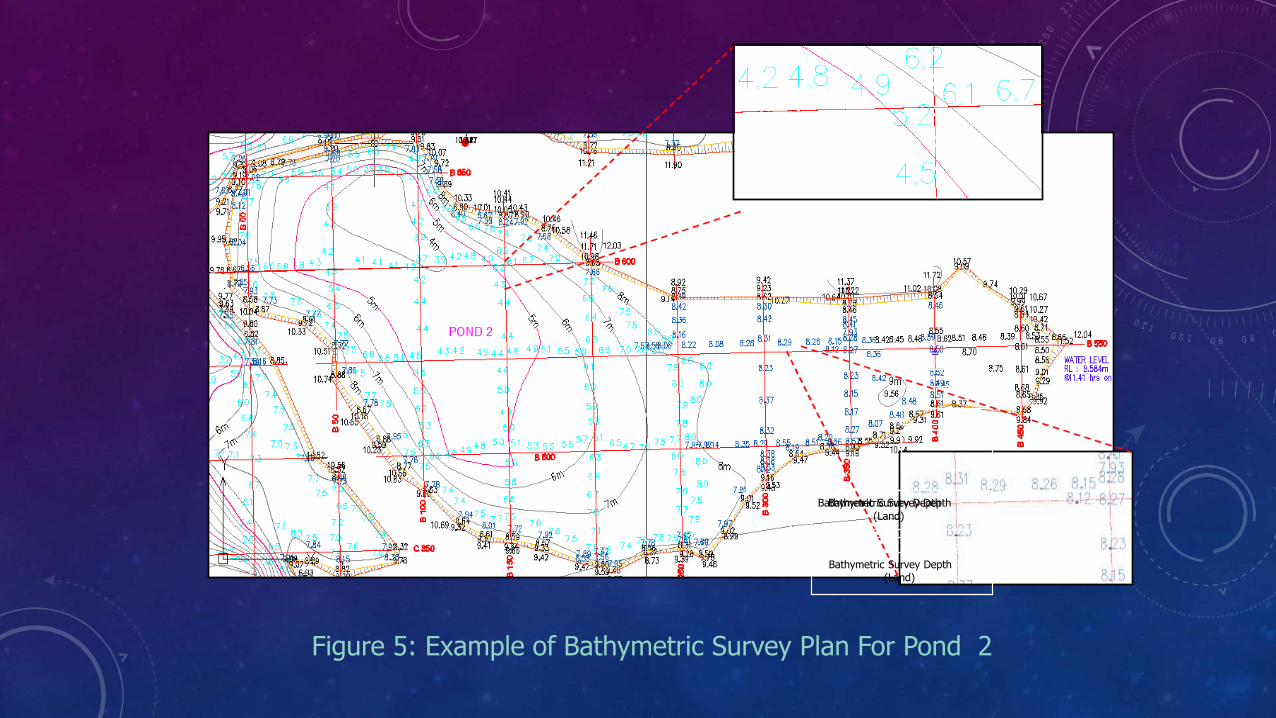
Figure 1 6 : Example of Bathymetric Survey Plan for Pond 2
Bathymetric Survey Depth
Bathymetric Survey Depth
(Land)
Bathymetric Survey Depth
Bathymetric Survey Depth
(Land)
Figure 5: Example of Bathymetric Survey Plan For Pond 2
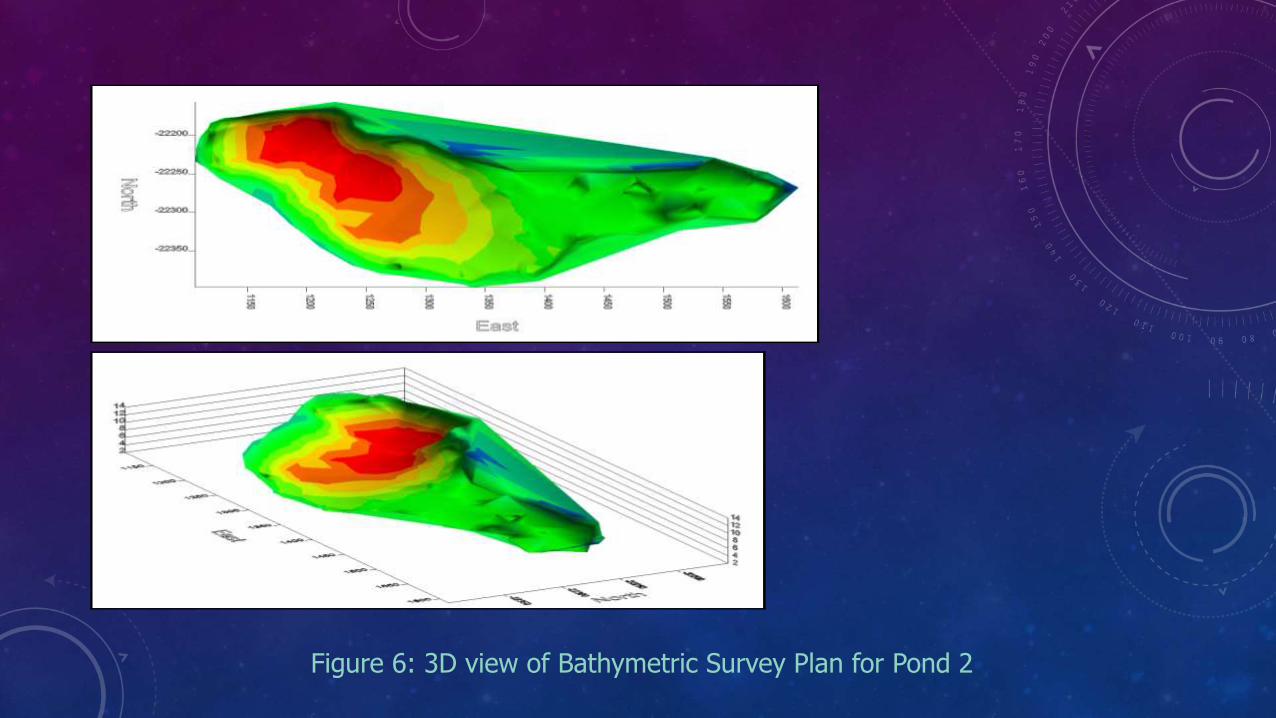
Figure 6: 3D view of Bathymetric Survey Plan for Pond 2
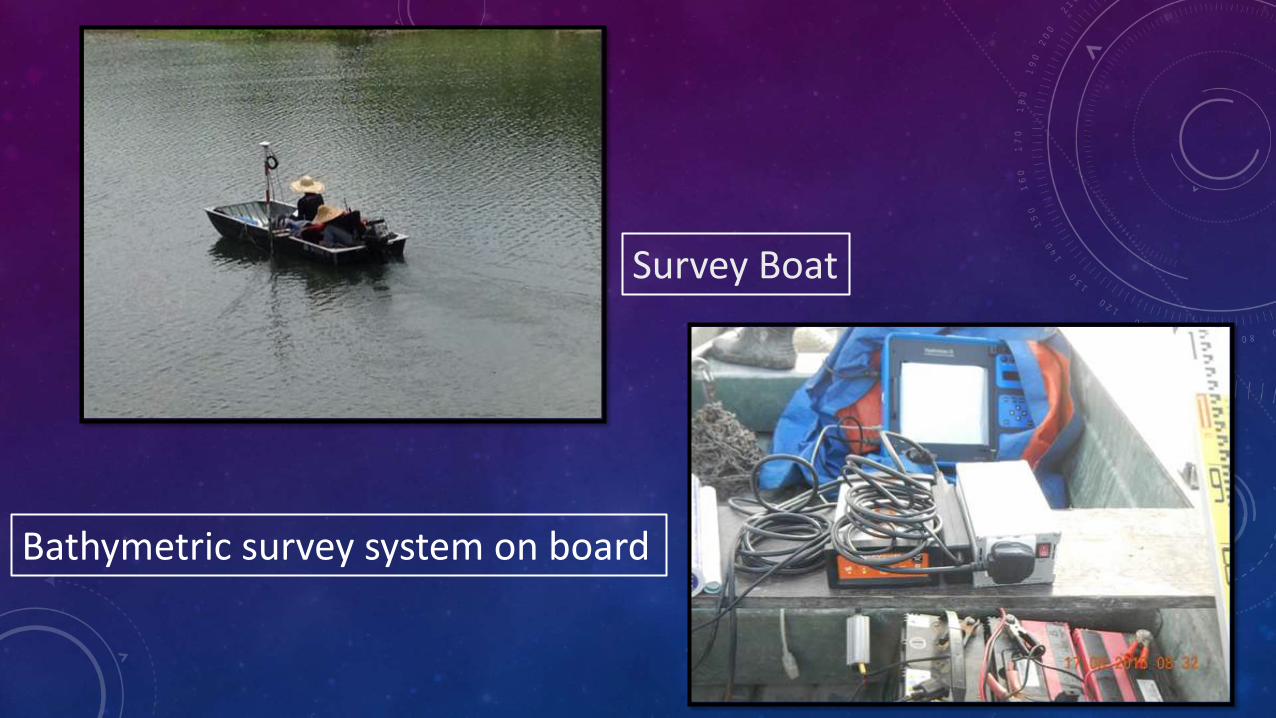
Survey Boat
Bathymetric survey system on board
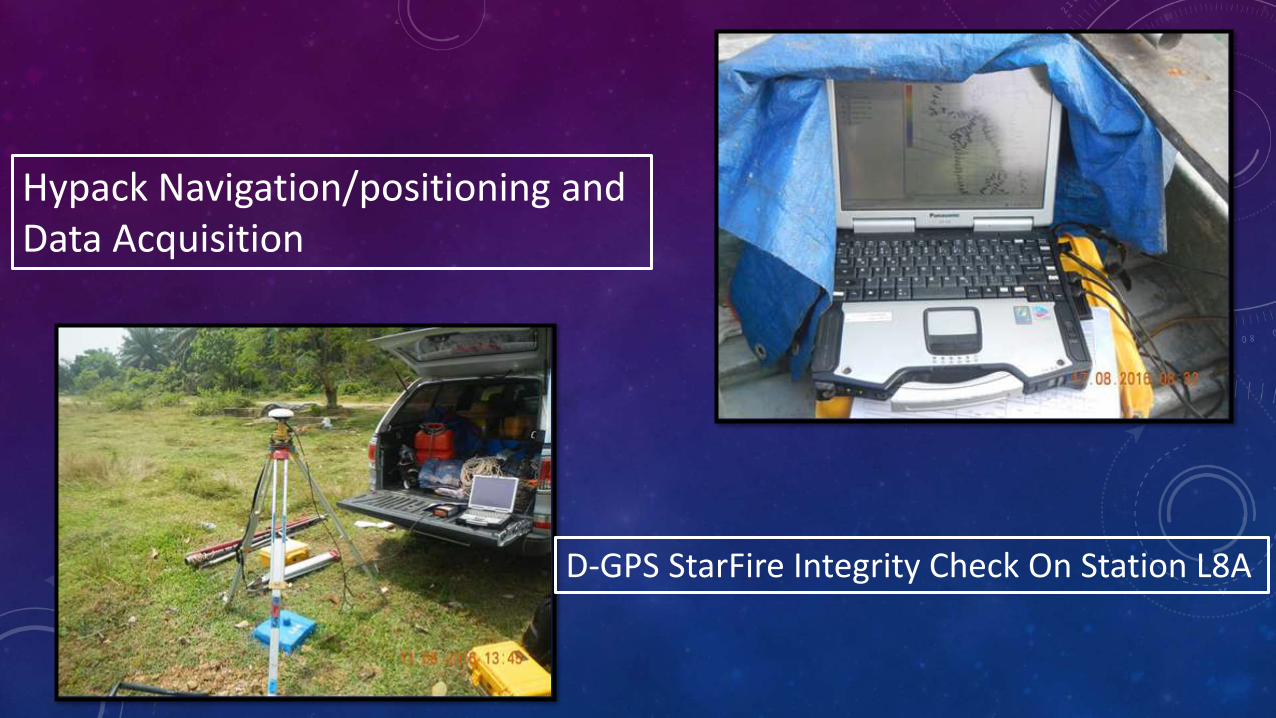
Hypack Navigation/positioning and Data Acquisition
D-GPS StarFire Integrity Check On Station L8A
SIBU WATER BOARD: GIS APPLICATION IN WATER SUPPLY
Sibu Water Board using GIS application in water supply for: -
Planned Shutdown
Assets Management Reporter
PLANNED SHUTDOWN APPLICATION
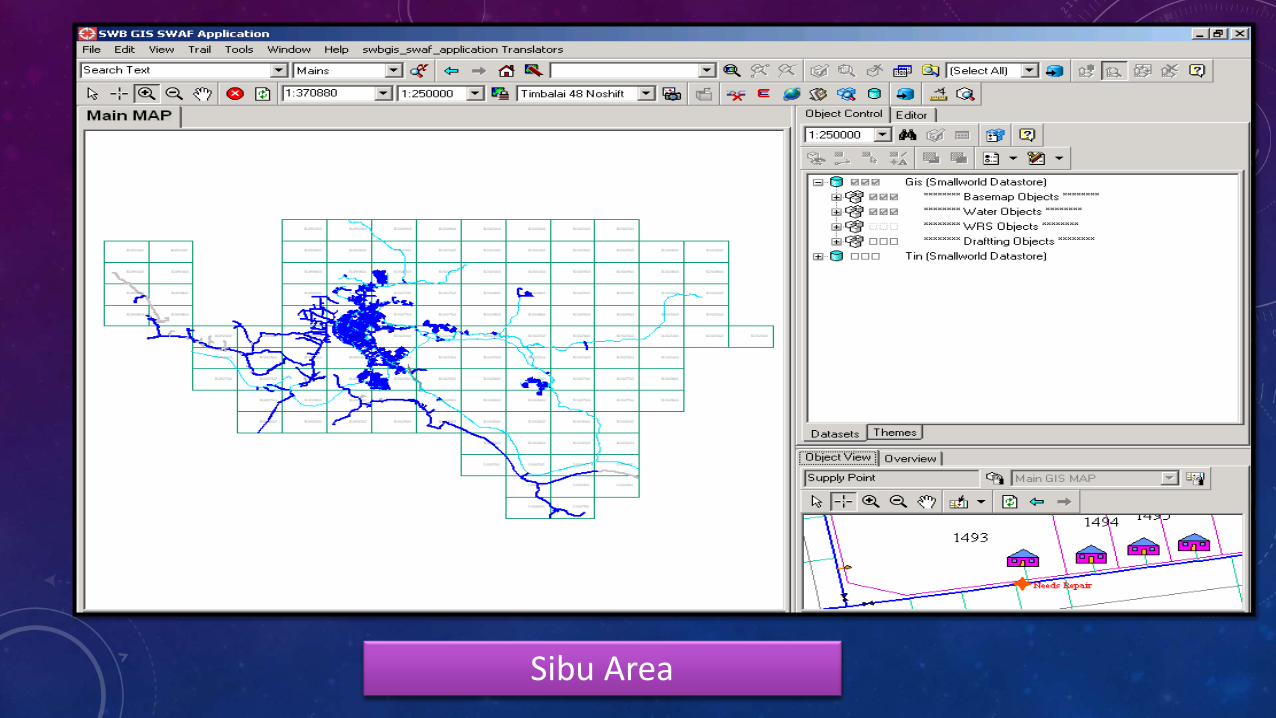
Sibu Area
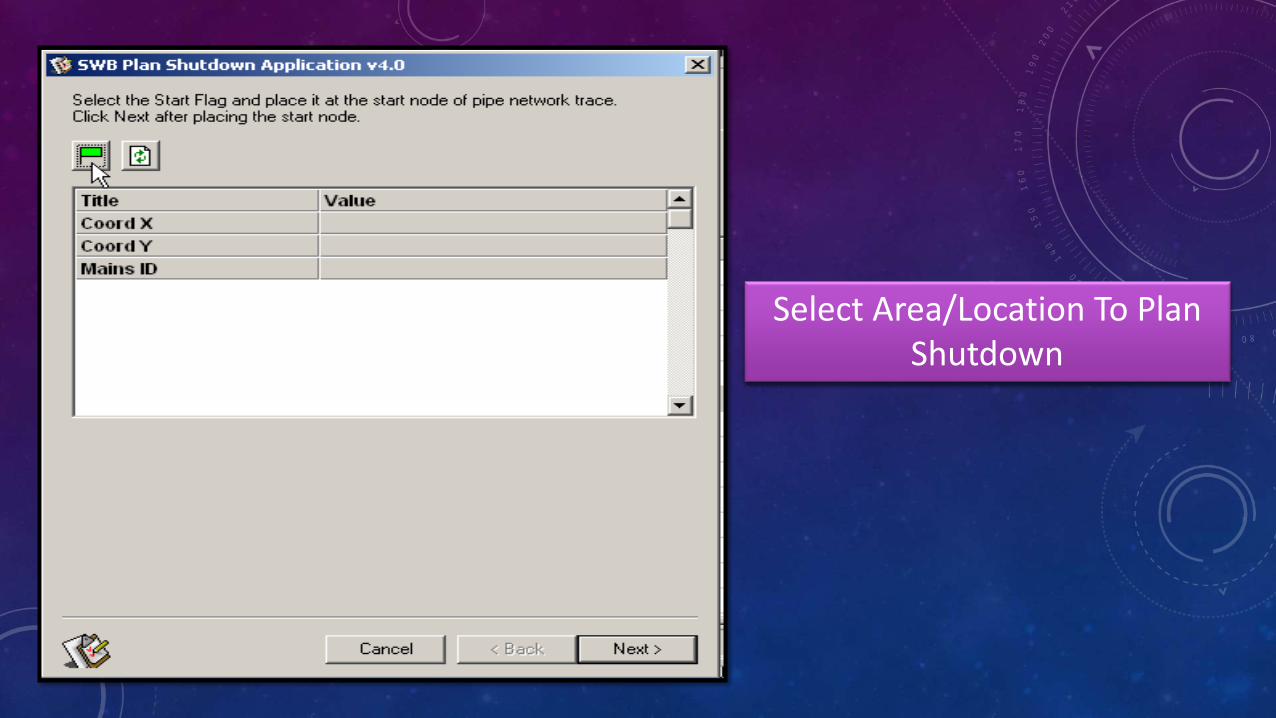
Select Area/Location To Plan Shutdown
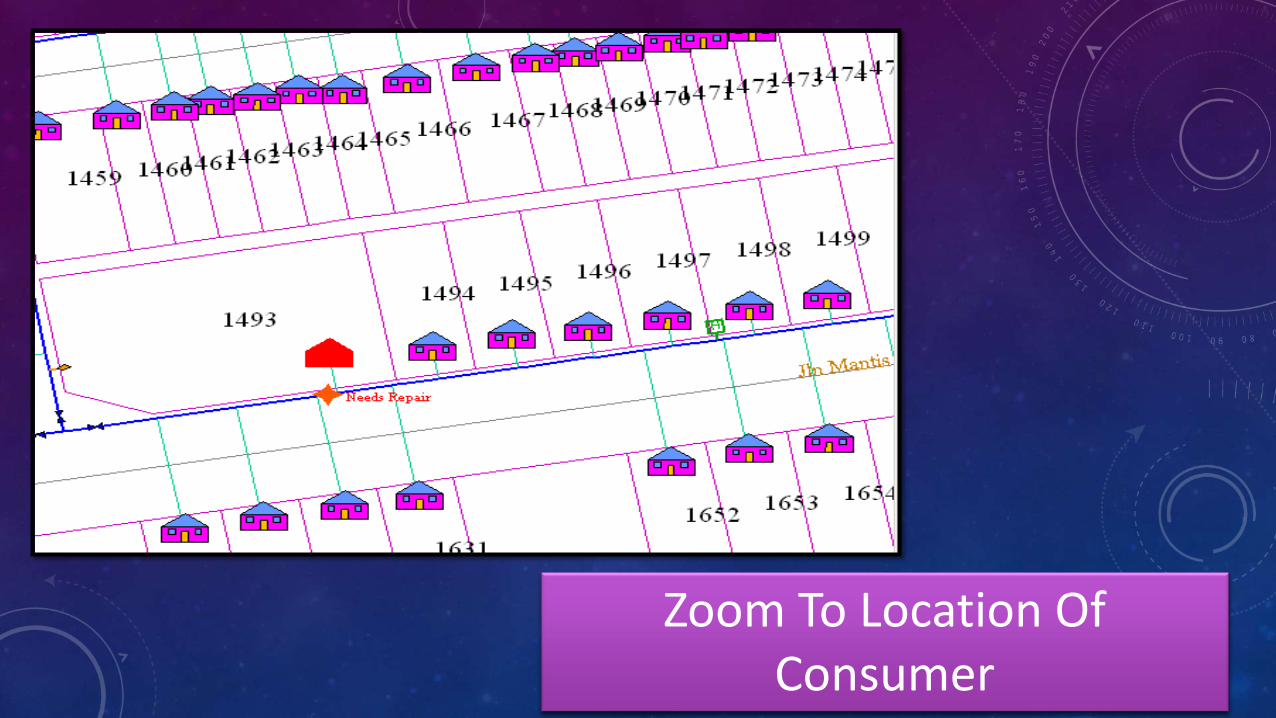
Zoom To Location Of Consumer
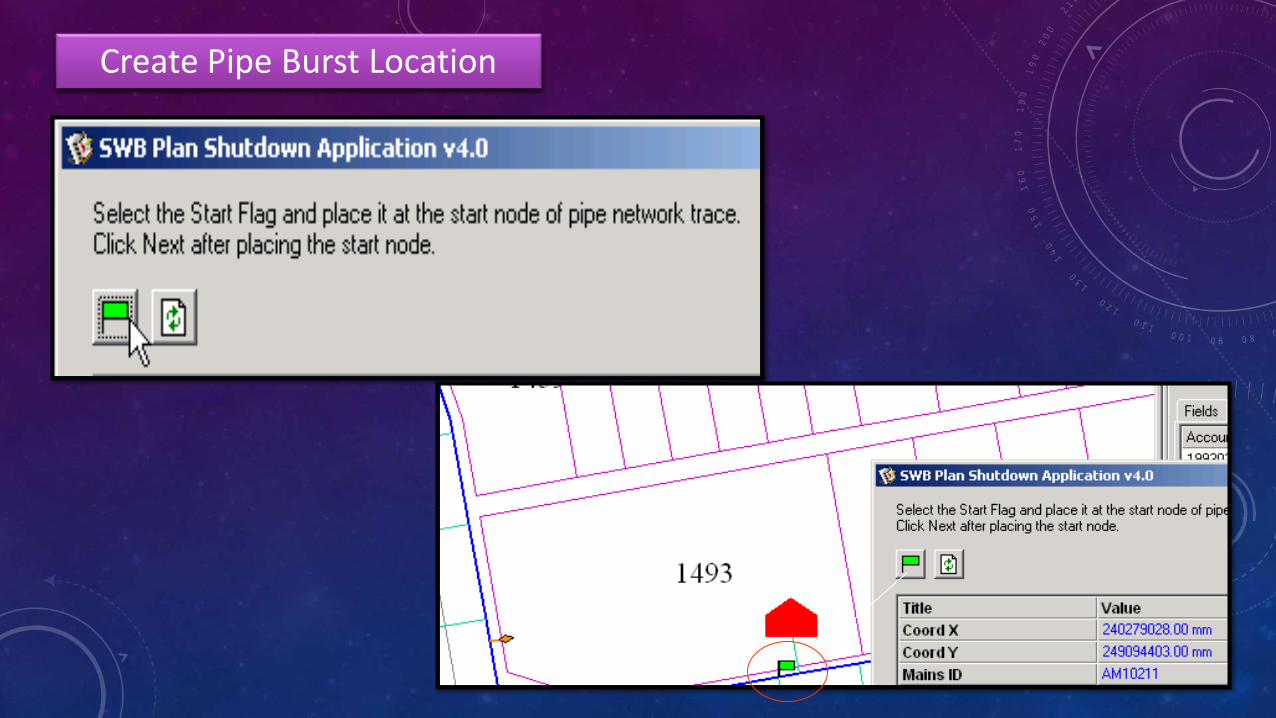
Create Pipe Burst Location

Map And List Customers Of Affected Area
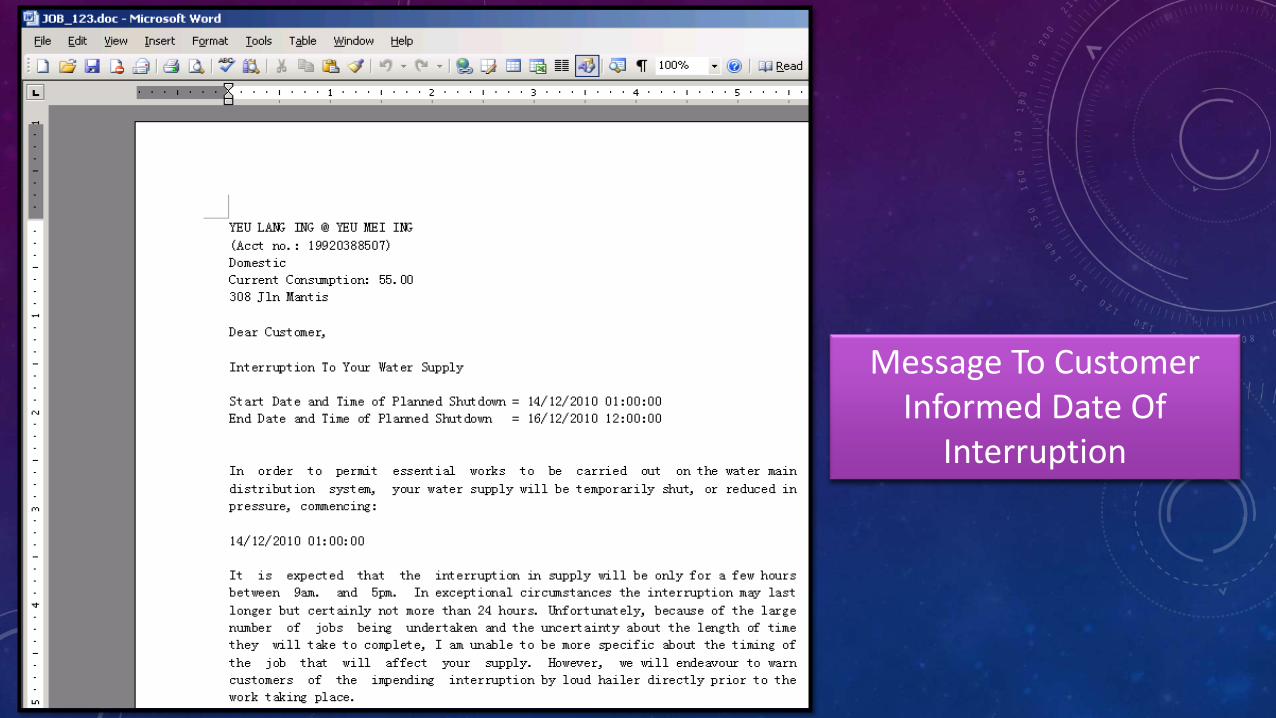
Message To Customer Informed Date Of
Interruption
ASSETS MANAGEMENT REPORTER
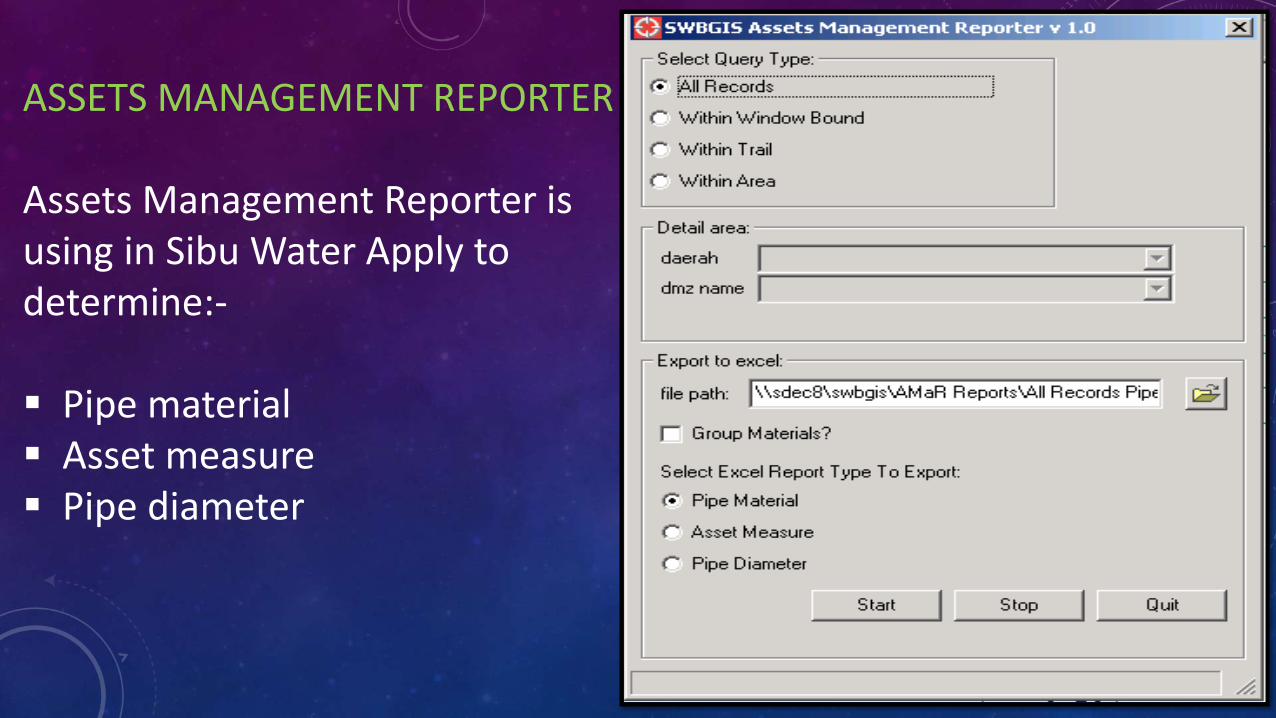
ASSETS MANAGEMENT REPORTER Assets Management Reporter is using in Sibu Water Apply to determine:- Pipe material Asset measure Pipe diameter
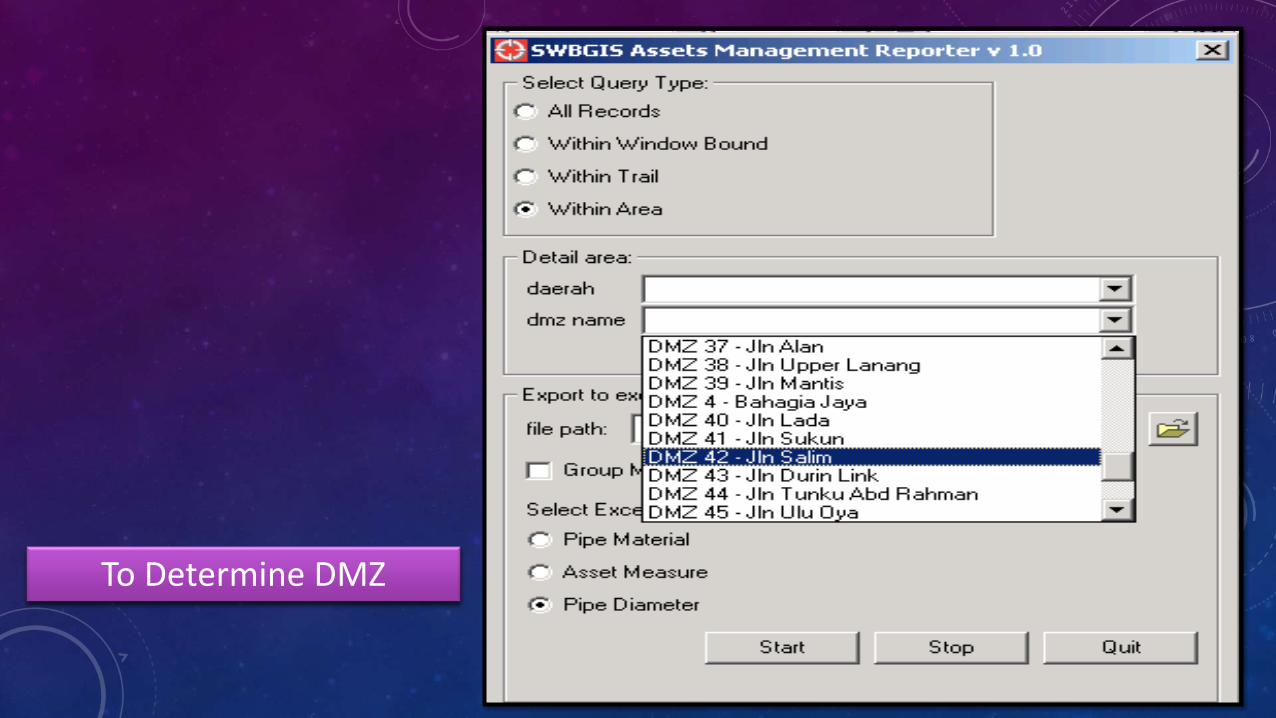
To Determine DMZ
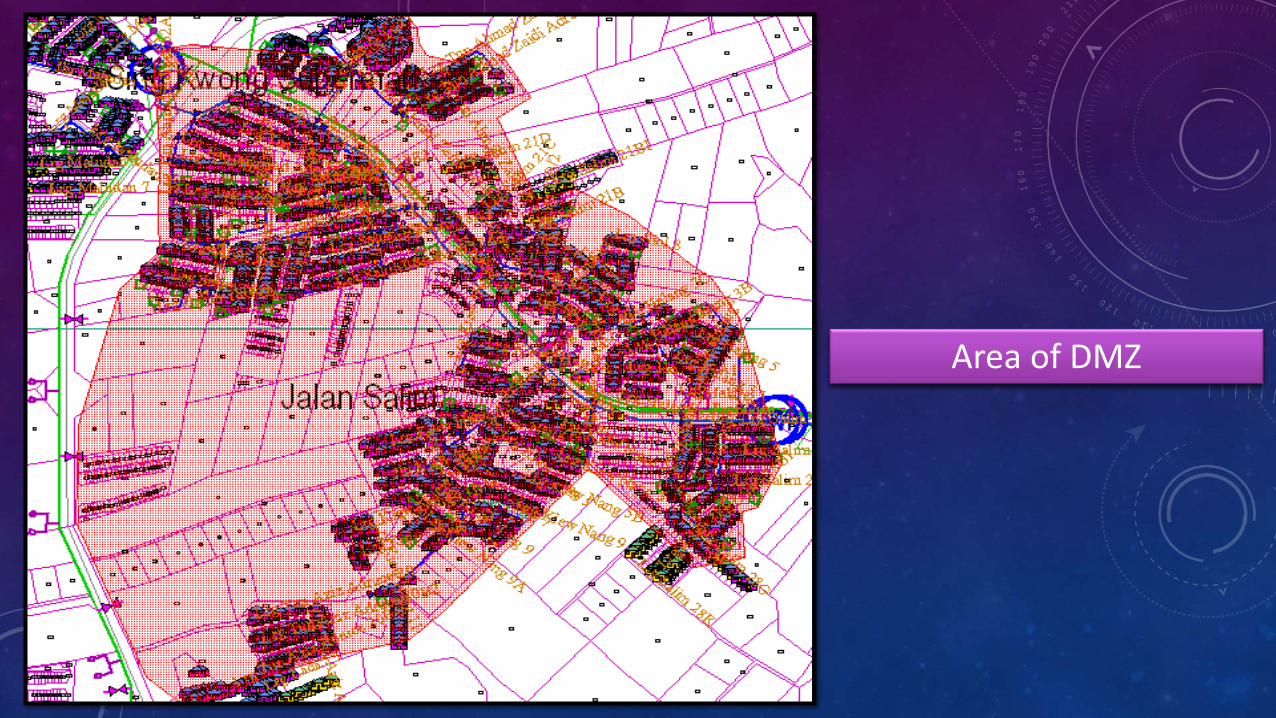
Area of DMZ
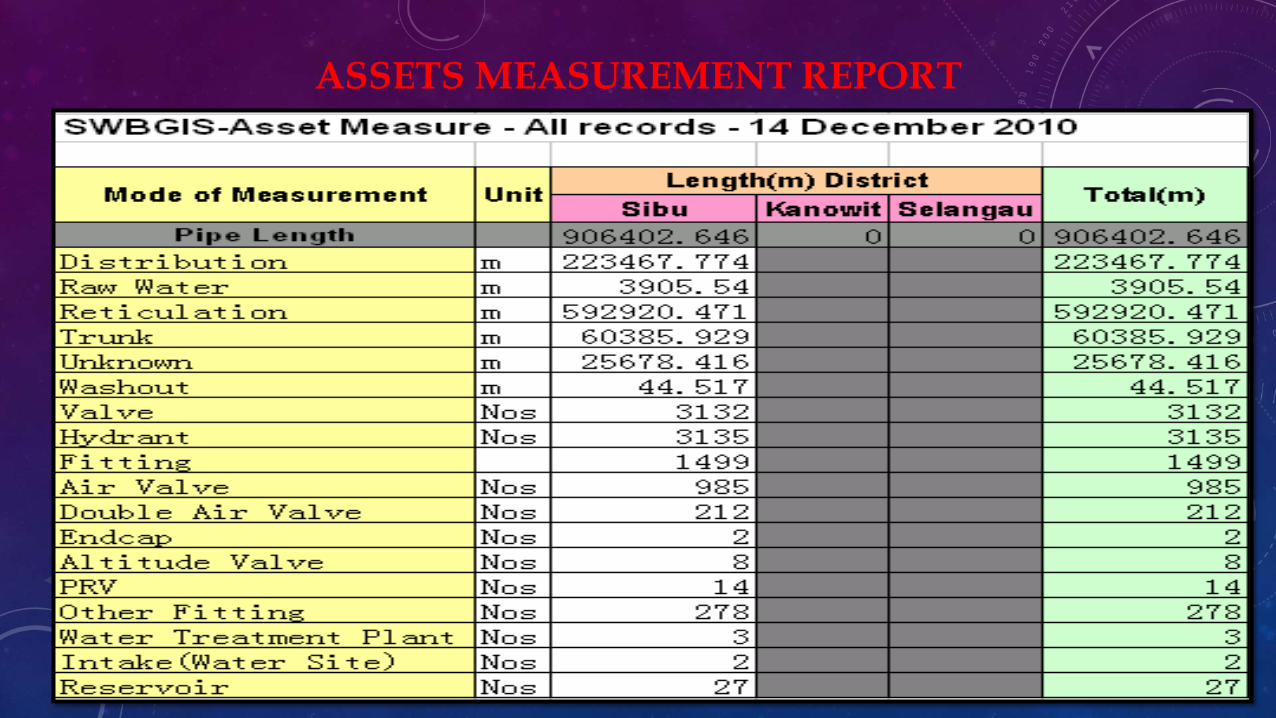
ASSETS MEASUREMENT REPORT
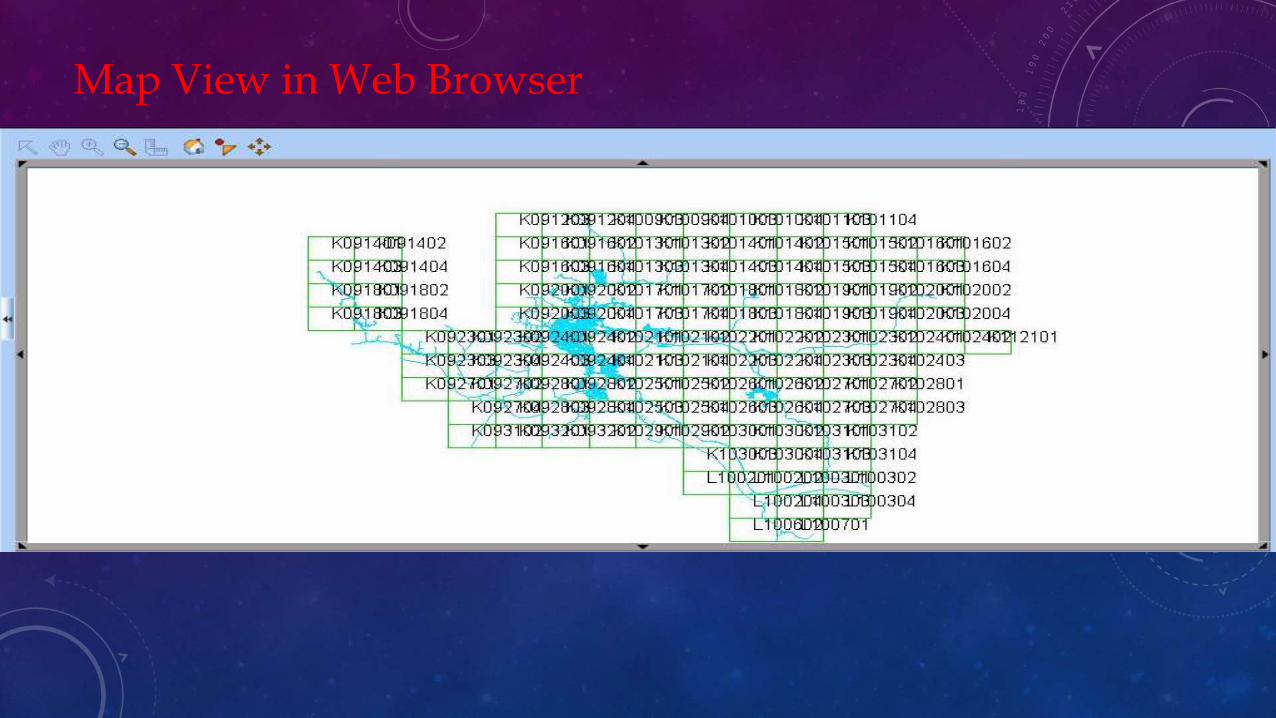
Map View in Web Browser
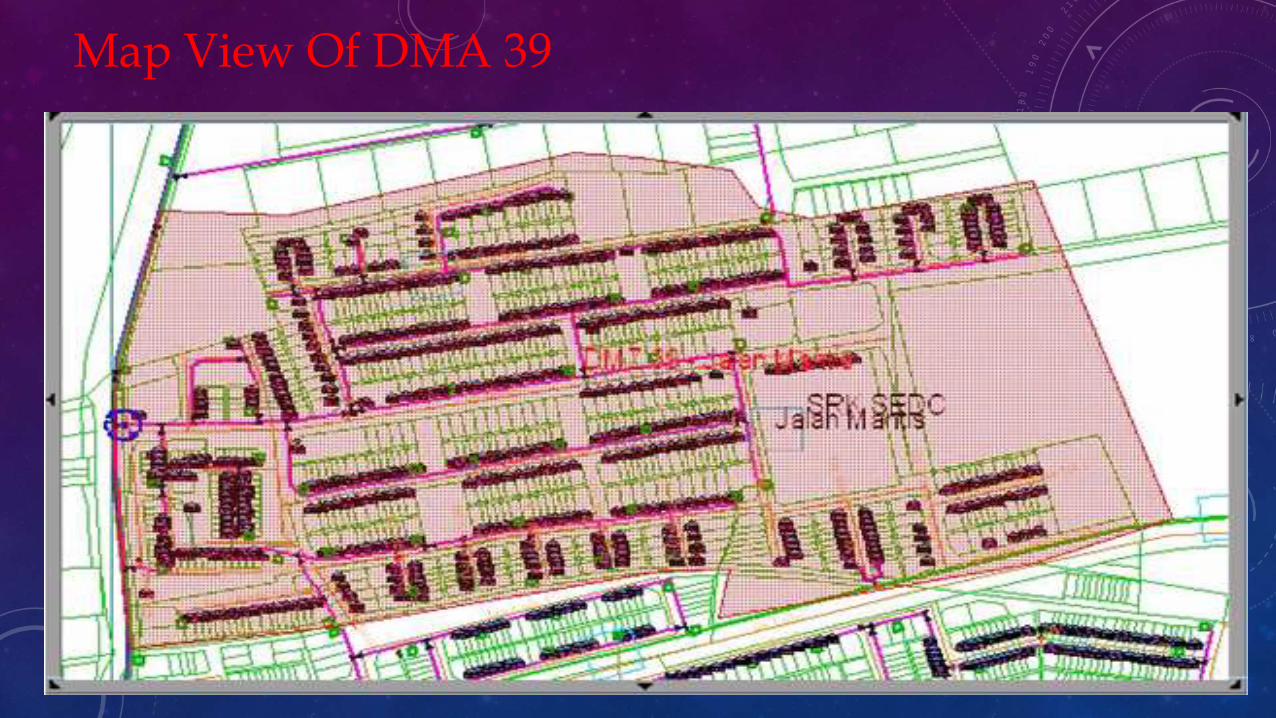
Map View Of DMA 39
KeTTHA INTELIGENT INFORMATION SYSTEM (KIIS) • KIIS is also known as monitoring system that used to
monitor all important data & information that involving all the sectors (Energy, Water, Green Technology) under KeTTHA.
• The system was built using IBM Intelligent Operation Center (IOC) Technology which is the the first one establish in Malaysia.
Features of KIIS • able to manage the data structured and unstructured
such as PDF, excel and so on • provide analyse visually to get statistical and graphic
information and generate reports through dashboards • monitor and addressing critical issues of national
utility based on business needs and system parameters specified in the stakeholders

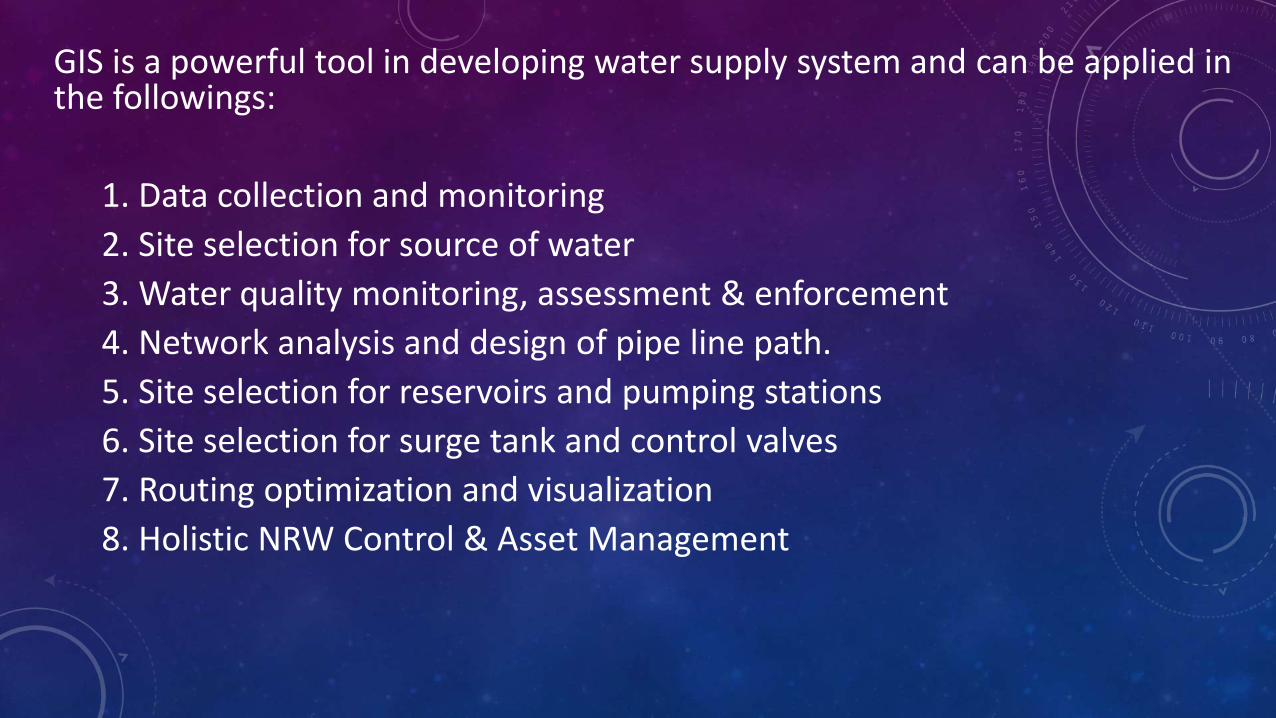
GIS is a powerful tool in developing water supply system and can be applied in the followings:
1. Data collection and monitoring
2. Site selection for source of water
3. Water quality monitoring, assessment & enforcement
4. Network analysis and design of pipe line path.
5. Site selection for reservoirs and pumping stations
6. Site selection for surge tank and control valves
7. Routing optimization and visualization
8. Holistic NRW Control & Asset Management


![[Geospatial] [Caleb Kelly] [20210965] Water management](https://img.pdfslide.us/doc/110x75/623608850a80fd398a133315/geospatial-caleb-kelly-20210965-water-management-.jpg)