Embed Size (px)
Citation preview

ISSN: 2277-3754
ISO 9001:2008 Certified International Journal of Engineering and Innovative Technology (IJEIT)
Volume 8, Issue 8, February 2019
16
Effectiveness of Your Speed Sign in Hua Hin
Municipality Patchareeya Chaikaew
a, Chalermphol Chaikaew
b and Pornnarong Lueanpech
c,*
aDepartment of Civil Engineering, Rajamangala University of Technology Rattakosin,
Wang KlaiKangwon Campus, Prachuap Khiri Khan, Thailand
bDepartment of Civil Engineering, Rajamangala University of Technology Rattakosin,
Wang KlaiKangwon Campus, Prachuap Khiri Khan, Thailand
cDepartment of Civil Engineering, King Mongkut’s University of Technology North Bangkok, Bangkok, Thailand
Abstract: This study aims to investigate the effectiveness of
your speed sign on highway no.4 within the Hua Hin
Municipality, Prachuap Khiri Khan, Thailand. The vehicle
speed in several decision ranges was conducted by radar speed
gun and the spot speed distribution was utilized to explore the
vehicle speed behavior while approach and departed from your
speed sign. The 2 locations of the your speed sign on highway
no. 4 inbound direction was chosen as study area. The result
indicated that the speed behavior was different on each location,
vehicle tend to use high speed in the outward region more than
the central region. The your speed sign likely had consequence
for vehicles. Most of the vehicle tend to decrease their operating
speed while approach to the your speed sign and the effected
location was 250 meters prior to the your speed sign however,
the driver decided to accelerate again after departed the your
speed sign. The contrasting outcome has been occurred while
compared with the speed limit addressed by local government.
The finding shows that the 85th percentile speed of vehicle was
higher than speed limit both in outward region and central
region. In summary, this study concluded that even though the
your speed sign have got some benefit by slightly reduce the
vehicle speed however, it still not able to control the operating
speed lower than the speed limit. Therefore, the suggested
solutions to mitigate the speeding situation in study area
especially within the central region included the improvement of
physical geometry by adding the rumble strip with appropriated
distance and importantly combine with law enforcement
program. The contribution of this study will lead to assess the
efficiency of the speed sign and accident risk on the highway
no.4 within Hua Hin Municipality, Prachuap Khiri Khan
Province.
Keywords: spot speed, the85th percentile speed, speed limit,
accident.
I. BACKGROUND/ OBJECTIVES AND GOALS
The road accident is one of the major causes of death
globally, the highest rate was occurred in developing
country and from reveal of the www.worldatlas.com [1]
about the world's highest road deaths in the world within
the year 2017, stated that Thailand has been ranked as
number 1 in the world. The highest rate of traffic related
moralities at 36 per 100,000 people due to the increasing of
urbanization, inadequately traffic controlled, poor road
marking and signs and importantly the reckless and
intoxication while diving. Comprehensively, the impact of
road accidents did not affect only the victims but also
causes the huge losses of the Thai economy, society
especially lost in productivity of the country.
The Thailand Development Research Institute (TDRI) [2]
studied the loss of life and death from road traffic accidents
with the method of willingness to pay. This study found
that the value of death was about 10 million baht per person
while the value of serious injuries was about 3 million baht
per case. Based on that value for the loss assessment of the
whole country can be concluded that during the year
2011-2013, the average annual accident value was 545,435
million-baht, accounted for 6 percent of gross domestic

ISSN: 2277-3754
ISO 9001:2008 Certified International Journal of Engineering and Innovative Technology (IJEIT)
Volume 8, Issue 8, February 2019
17
product (GDP) of the country. However, even though the
road accidents had caused the huge losses in Thailand,
many of Thai people still lacking awareness of the hazards
and impacts of road accidents.
Considering the situation of road traffic accidents in
Thailand, it was found that Thailand road traffic accident
statistics compiled by the National Bureau of Statistics
stated that more than 60% of the cases were caused by
personal driving behavior [3]. The top three causes of
accidents in Thailand included unexpectedly lane change
25%, speeding over the speed limit 22% and driving too
close to another 19% respectively.
Focusing the traffic accident situation in Hua Hin
municipality, Prachuap Khiri Khan Province which is one
of the world's major tourist destinations in Thailand where
the location of KlaiKangwon Palace, local government
offices, Hua Hin beach and business district. The statistic
compiled by the National Bureau of Statistics stated that
the top three causes of accidents in Hua Hin municipality
included speeding over the speed limit 33%, less
experience driver 21%, and driving too close to another
14% [3] and regard to the number of accidents of Prachuap
Khiri Khan Province in the year 2017, the top three districts
with highest number of accidents included Hua Hin district
22%, Prachuap Khiri Khan city district 21% and Bang
Saphan district 18% respectively. Inspecting closely to the
proportion of deaths from road traffic accidents, we found
that within Hua Hindi strict had the highest proportion of
deaths from accidents [4].
Concerning the effected factor contribute to speed
decision, AASHTO [5] specified that the speed of the
vehicle was influenced by the physical characteristics of the
road, the weather, the type of vehicle and the speed limit
and importantly the factors related to the geometric design
of the road had been identified as the main factor to
determine the driving speed which consistent with the
speed limit addressing by the Land Traffic Act [6] of
Thailand. The vehicle speed behavior on different physical
characteristics of the road, Glennon et al. [7] investigated
the effect of curved roads to the vehicle operating speed.
The study indicated that there was not affected when the
radius of curve more than 800 meters, but the vehicle speed
tent to reduced significantly when the radius of curve was
less than 250 meters.
Jägerbr and Sjöbergh [8] studied the effect of vehicle
speed on the road from different lighting environment in
Sweden. This study concluded that the vehicle speed was
fluctuated by the time of day and the presence and absence
of the illumination system on road. The vehicle speed was
likely decreased in the unusual weather conditions liked
raining or snowing and the vehicle speed significantly
reduced in the unusual weather conditions on road that
without the illumination system.
In term of prevention strategies, the most popular
scheme to encountered with was the traffic calming. The
traffic calming was the physical improvement to prevented
and reduced the negative impact of a vehicle and changed
the driving behaviors. Jorgense and Mertne r[9]
investigated the outcome after applied the traffic calming
strategies in Denmark using before and after comparisons.
The results summarized that the speed control policy with
the traffic calming strategies had a positive tendency to the
traffic safety, perception of risk factors and improved the
environment quality within the area.
Recently in Thailand, the Department of Highways had
been installed the your speed sign in several locations in
Thailand especially the location where the highest rate of
accident in order to warn and reminds the driver to keep
their speed within the speed limit and to reduce the risk of
road accidents. The effectiveness of the your speed sign
was studied both in the UK and in the US, the result found
the effectively decrease the vehicle speed [10],[11] .Even
though the speed reductions less than resulting from
physical improvement but the your speed signs had the
major effect on drivers who exceeding the posted speed
limit and driving pass through the speed transition zones

ISSN: 2277-3754
ISO 9001:2008 Certified International Journal of Engineering and Innovative Technology (IJEIT)
Volume 8, Issue 8, February 2019
18
[12]. On highway no. 4 in Hue Hin Municipality, there
were 2 locations of the your speed sign had been installed
in order to maintain the vehicle speed in the inbound
direction heading to the Hua Hin central region.
The objective of this study was aimed to investigate the
effectiveness of your speed sign on highway no.4 within
the Hua Hin Municipality by conducting the vehicle speed
in several decision ranges with radar speed gun and
explored the vehicle speed behavior while approach and
departure from they our speed sign. The contribution of this
study will lead to assess the efficiency of the your speed
sign and accident risk on the highway no.4 within Hua Hin
Municipality, Prachuap Khiri Khan Province.
II. METHODS
A. Case Study and Data Collection
The study area was the highway no.4 within Hua Hin
Municipality, Prachuap Khiri Khan Province which the
main access road to the Klai Kangwon Palace, local
government offices, Hua Hin beach and business district.
The physical characteristic included the at-graded 6 lanes
road for 2 direction and divided by raise median. It also
included the exclusive lane for motorcycle in the most left
lane nearby shoulder lane. The physical characteristic and
location of the your speed sign illustrated in Fig 1.
(a) Your Speed sign at km
200+360
(b) Your Speed sign at km
213+850
Fig. 1. The physical characteristic and location of study area
The main objective of this study was to examine the spot
speed of vehicles using radar speed gun and to avoid the
effect from traffic condition, the vehicle speed data
collection was conducted during off-peak period (10.00
AM-03.00 PM). The post kilometer of highway no.4 km
200+360 and km 213+850 where the locations of the your
speed sign were selected as test bed. Apparently, each
location had unique characteristics, in example the location
of km 200+360 involved with the sight distance problem
because this station was located behind the sharp curve and
the location of km 213+850 related with speeding problem
because this area was the speed transition zones between
outward region and central region where differently speed
limit and most of the vehicle kept using their speed more
than speed limit. Beside of the your speed sign location, the
distance both in approach and depart of the your speed sign
at 500 m. and 250 m. were adopted as speed data collection
point to explore the vehicle speed behavior. The location
and distance of spot speed data collection point illustrated
in Fig 2.

ISSN: 2277-3754
ISO 9001:2008 Certified International Journal of Engineering and Innovative Technology (IJEIT)
Volume 8, Issue 8, February 2019
19
(a) Characteristics and data collection point of the km
200+360
(b) Characteristics and data collection point of the km
213+850
Fig. 1.The location and distance of spot speed data collection
point
B. Sample and Population
This study was captured the operating speed of vehicle
which classified according to their usage within the area.
The classification of vehicles as followed;
Passenger Car
Truck or Heavy Goods Vehicle
Bus
Motorcycle
The sample size in this study was determined based on the
vehicle speed behavior from 20 examples pilot test. The
appropriated number of sample was calculated following
this equation,
𝑛 = 𝑍𝛼∗𝜎
𝑒 2
(1)
Where 𝑛is the appropriate number of sample.
𝑍𝛼 is the Z score at the confidence level.
𝜎is the variance of the sample.
𝑒is the acceptable error.
The 20 examples pilot test found that the vehicle speed in
this area had a variance of 18.145 kph.While applied the
acceptable error less than 5 kph as well as the confident
level at 95 percent, it was concluded that the appropriated
sample size in the study area should contain at least 50
vehicles for each vehicle type. The data collection with
radar speed gun illustrated in Fig 3.
(a) data collection at the km
200+360
(b) data collection at the km
213+850
Fig. 2. The data collection with radar speed gun.
C. Data Analysis
The 85th percentile of vehicle speed was widely used for
traffic statistical analysis. It provided an accurate
estimation of traffic conditions determined the quality of
road design and evaluated the posted speed limits. The 85th
percentile of vehicle speed was considered differently by
road environment and it was defined as the speed at or
below which 85 percent of all vehicles were observed to
travel under free-flowing conditions past a monitored point.
The 85thpercentile value was calculated followed by the
assumption of normal distribution of traveling speeds and
ISSN: 2277-3754
ISO 9001:2008 Certified International Journal of Engineering and Innovative Technology (IJEIT)
Volume 8, Issue 8, February 2019
20
in term of traffic engineering, which typically used the 85th
percentile speed as a standard to set the speed limit at a safe
speed, minimizing crashes and promoting uniform traffic
flow along a corridor. Homburger et al. [13] also
hypothesized that the 85thpercentile of vehicle speed was
the speed that motorists consider to be traveling at safe
speeds and for the road design AASHTO [5] suggested that
the 85thpercentile of vehicle speed was considered to the
safest speed for the road segment. In this study, the vehicle
speed analysis was considered the 85thpercentile of vehicle
speed as a tool to determine the speed limits. The
85thpercentile of vehicle speed analysis concept illustrated
in Fig 4.
Fig. 3The 85th percentile of vehicle speed concept
Source: Modification from Lincoln Public Works and Utilities
III. RESULTS
A. Spot Speed Analysis
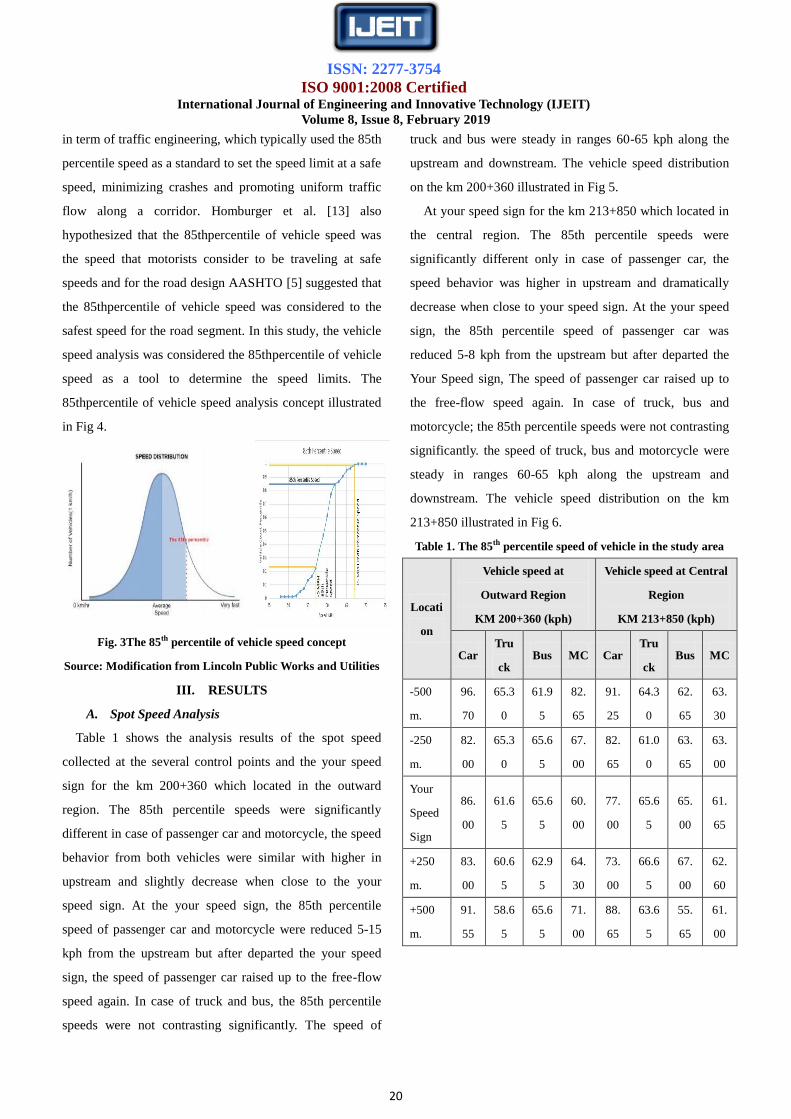
Table 1 shows the analysis results of the spot speed
collected at the several control points and the your speed
sign for the km 200+360 which located in the outward
region. The 85th percentile speeds were significantly
different in case of passenger car and motorcycle, the speed
behavior from both vehicles were similar with higher in
upstream and slightly decrease when close to the your
speed sign. At the your speed sign, the 85th percentile
speed of passenger car and motorcycle were reduced 5-15
kph from the upstream but after departed the your speed
sign, the speed of passenger car raised up to the free-flow
speed again. In case of truck and bus, the 85th percentile
speeds were not contrasting significantly. The speed of
truck and bus were steady in ranges 60-65 kph along the
upstream and downstream. The vehicle speed distribution
on the km 200+360 illustrated in Fig 5.
At your speed sign for the km 213+850 which located in
the central region. The 85th percentile speeds were
significantly different only in case of passenger car, the
speed behavior was higher in upstream and dramatically
decrease when close to your speed sign. At the your speed
sign, the 85th percentile speed of passenger car was
reduced 5-8 kph from the upstream but after departed the
Your Speed sign, The speed of passenger car raised up to
the free-flow speed again. In case of truck, bus and
motorcycle; the 85th percentile speeds were not contrasting
significantly. the speed of truck, bus and motorcycle were
steady in ranges 60-65 kph along the upstream and
downstream. The vehicle speed distribution on the km
213+850 illustrated in Fig 6.
Table 1. The 85th percentile speed of vehicle in the study area
Locati
on
Vehicle speed at
Outward Region
KM 200+360 (kph)
Vehicle speed at Central
Region
KM 213+850 (kph)
Car Tru
ck Bus MC Car
Tru
ck Bus MC
-500
m.
96.
70
65.3
0
61.9
5
82.
65
91.
25
64.3
0
62.
65
63.
30
-250
m.
82.
00
65.3
0
65.6
5
67.
00
82.
65
61.0
0
63.
65
63.
00
Your
Speed
Sign
86.
00
61.6
5
65.6
5
60.
00
77.
00
65.6
5
65.
00
61.
65
+250
m.
83.
00
60.6
5
62.9
5
64.
30
73.
00
66.6
5
67.
00
62.
60
+500
m.
91.
55
58.6
5
65.6
5
71.
00
88.
65
63.6
5
55.
65
61.
00

ISSN: 2277-3754
ISO 9001:2008 Certified International Journal of Engineering and Innovative Technology (IJEIT)
Volume 8, Issue 8, February 2019
21
(a) -500 m.
(b) -250 m.
(c) Your Speed Sign
(d) +250 m.
(e) +500 m.
Fig. 5. The vehicle speed distribution on the km 200+360
(a) -500 m.
(b) -250 m.
(c) Your Speed Sign
(d) +250 m.
(e) +500 m.
Fig. 6. The vehicle speed distribution on the km 213+85
B. Effect of Your Speed Sign
The speed sign was an interactive sign, generally
displayed the approach speed of vehicle. The main
objective of the your speed signs was to decrease the
vehicle speed by making drivers pay attention and aware
when they were driving at speeds above the posted speed
limits and it also used as a traffic calming device instead of
physical devices. In this study, the location of km 200+360
which involved with the sight distance problem, the result
shown that the your speed sign mostly effected to the
passenger car and motorcycle. The reduction in 85th
percentile speeds were ranging from 10 to 20 kph and the
effected location was 250 meters prior to your speed sign.
However, after departed your speed sign this study found
that the passenger car and motorcycle tend to accelerate their
speed again cause by lack of law enforcement. In case of the
truck and bus, the variance of 85th percentile speeds were still
uncertain. The effect of your speed sign on the km 200+360
illustrated in Fig 7.

ISSN: 2277-3754
ISO 9001:2008 Certified International Journal of Engineering and Innovative Technology (IJEIT)
Volume 8, Issue 8, February 2019
22
Fig. 7. Effect of the Your Speed sign on the km 200+360
The location of km 213+850 which related with speeding
problem due to the speed transition zones, the result shown
that the your speed sign mostly effected to the passenger
car. The reduction in 85th
percentile speeds were ranging
from 5 to 15 kph and the effected location was 250 meters
prior to your speed sign. Although, their transition to low
speed zone this study found that the passenger car tends to
accelerate their speed again after departed your speed sign
which increase the risk of accident especially in CBD area.
In case of the truck and bus, the variance of 85th
percentile
speeds were still uncertain. The effect of your speed sign on
the km 213+360 illustrated in Fig 8.
Fig.8. Effect of the Your Speed sign on the km 213+850
C. Comparing with the Speed Limit
The speed limit of road was usually set the maximum
speed of road which vehicles may legally drive. The speed
limit may be variable based on physical characteristic of
road and density of area. The speed limit was typically
addressed by the legislative agency of nations or local
governments and enforced by police officer. The overview
of this study found the reduction of operating speed while
approach to your speed sign and accelerated again after
departed. Considering to the speed limit addressed by local
government which stated that 80 kph within outward region
and 50 kph within central region. In this case, the
contrasting outcome has been occurred, the 85th percentile
vehicle speeds were higher than speed limit. Surprisingly,
within the central region all of the vehicles included
passenger car, truck, bus and motorcycle were kept using
higher speed. The comparison with the speed limit
illustrated in Fig 9 & Fig 10.
Fig. 9. Comparing with speed limit on the km 200+360
Fig. 10. Comparing with speed limit on the km 213+850

ISSN: 2277-3754
ISO 9001:2008 Certified International Journal of Engineering and Innovative Technology (IJEIT)
Volume 8, Issue 8, February 2019
23
IV. CONCLUSION
The main objective of this study was aimed to
investigate the effectiveness of your speed sign on highway
no.4 within the Hua Hin Municipality, Prachuap Khiri
Khan, Thailand. The result indicated that the speed
behavior was different on each location, vehicle tend to use
high speed in the outward region more than the central
region due to the traffic density and different of land use
and within the decision range, the your speed sign likely
had consequence for vehicles. Most of the vehicle tend to
decrease their operating speed and the reduction in 85th
percentile speeds were ranging from 5 to 20 kph while
approach to the your speed sign and the effected location
was 250 meters prior to the your speed sign however, the
driver decided to accelerate again after departed the your
speed sign. The contrasting outcome has been occurred
while compared with the speed limit addressed by local
government. The finding shows that the 85th percentile
speed of vehicle was higher than speed limit both in
outward region and central region.
In summary, this study concluded that even though the
your speed sign on highway no.4 within the Hua Hin
Municipality, Prachuap Khiri Khan, Thailand have got some
benefit by slightly reduce the vehicle speed however it still
not able to control the operating speed lower than the speed
limit. Therefore, the suggested solutions to mitigate the
speeding especially, within the central region included the
improvement of physical measure by adding the rumble strip
with appropriated distance and importantly combine with
law enforcement program. The contribution of this study will
lead to assess the efficiency of your speed sign and accident
risk on the highway no.4 within Hua Hin Municipality,
Prachuap Khiri Khan Province.
ACKNOWLEDGMENT
The funding in this research was partially supported by
Department Civil Engineering, Faculty of Engineering,
Rajamangala University of Technology Rattanakosin.The
author would like to thank for the students of Civil
Engineering Department, Rajamangala University of
Technology Rattanakosin, Wang KlaiKangwon Campus for
the data collection.
REFERENCES
[1] "worldatlas," 2018. [Online]. Available:
https://www.worldatlas.com/articles/the-countries-with-the-
most-car-accidents.html. [Accessed 26 April 2018].
[2] Thailand Development Research Institute (TDRI), "Road
Safety Assessment Project In the case of the Port of Tha
Luang And the Road to Friendship - Kaeng Khoi Cement
Plant," 2017.
[3] National Bureau of Statistics, "service.nso.go.th," 2015.
[Online]. Available:
http://service.nso.go.th/nso/web/statseries/statseries21.html.
[4] Thai Road Accident Data Center for Road Safety Culture,
"http://www.thairsc.com/," 2017. [Online]. Available:
http://rvpreport.rvpeservice.com/viewrsc.aspx?report=0486&
session=16..
[5] AASHTO, A policy on geomatric design of highways and
streets, 6th edition, Washington D.C., 2011.
[6] Royal Thai Police Department, "Land Traffic Act.," 1979.
[7] J. Glennon, T. Neuman and J. Leisch, "Safety and
Operational Considerations for Design of Rural Highway
Curves," Federal Highway Administration, 1985.
[8] A. Jägerbrand and J. Sjöbergh, "Effects of weather conditions,
light conditions and road lighting on vehicle speed," Springle
Plus, vol. 5, no. 505, 2016.
[9] L. Jorgense and J. Mertner, "Effects of traffic calming
schemes in Denmark," in 4th international Conference on
Urban Transport and the Environmt for 21th Century, Lisbon,
Portugal, 1998.
[10] E. Rose and G. L. Ullman, "Evaluation of dynamic speed
display signs," Texas Transportation Institute, Texas, 2003.
[11] D. Veneziano, L. Hayden and J. Ye, "Effective deployment of
radar speed signs," Western Transportation Institute,
Montana, 2010.
[12] W. Sandburg, T. Schoenecker, K. Sebastian and D. Soler,
"Long-term effectiveness of dynamic speed monitoring
ISSN: 2277-3754
ISO 9001:2008 Certified International Journal of Engineering and Innovative Technology (IJEIT)
Volume 8, Issue 8, February 2019
24
displays (DSMD) for speed management at speed limit
transitions," Washington County, Dakota County and
Ramsey County Department of Transportation., 2006.
[13] Homburger, W.S., J.W. Hall, R.C. Loutzenheiser and W.R.
Reilly, Spot Speed Studies, In Fundamentals of Traffic
Engineering, Berkeley:: Institute of Transportation Studies,
University of California, 1996.


![Nepal Observer kang hin ? lb sª lxg < What is this ? Di kitap hin. lb lstfk lxg . This is a book. Phokiti kang hin ? kmf]lstL sª lxg < What is that ? Phokiti naksha hin. kmf]lstL](https://img.pdfslide.us/doc/110x75/5caa160688c993c9218dbc2a/nepal-observer-kang-hin-lb-sa-lxg-what-is-this-di-kitap-hin-lb-lstfk-lxg.jpg)