Embed Size (px)
Citation preview
1
Effectiveness and transportability of primary school violence prevention interventions: A
systematic review
Jessica Ehrenreich
Naseegha Firfirey
PSY4000W
University of Cape Town
Supervisor: Catherine Ward
Co-supervisor: Soraya Lester
Word count
Abstract: 248
Main Body: 9,999

2
Plagiarism Declaration
1. We know that plagiarism is wrong. Plagiarism is to use another’s work and pretend that it is
one’s own.
2. We have used the APA convention for citation and referencing. Each contribution to, and
quotation in, this essay from the work(s) of other people has been attributed, and has
been cited and referenced.
3. This essay is our own work.
4. We have not allowed, and will not allow, anyone to copy our work with the intention of
passing it off as his or her own work.
5. We acknowledge that copying someone else’s assignment or essay, or part of it, is wrong,
and declare that this is our own work.
Signature: Jessica Ehrenreich
Signature: Naseegha Firfirey
3
Acknowledgements
We would like to express our gratitude to our supervisor, Prof. Catherine Ward, for her
continuous efforts and guidance throughout this research project.
A further thank you goes to our co-supervisor, Soraya Lester, who has provided us with her
ongoing support, feedback and assistance with this thesis.
A special thank you to Alex D’Angelo, the librarian at the University of Cape Town, for his
assistance in research related queries.
Lastly, we would like to thank our families for their persistent support, patience and
encouragement.
4
Abstract
School violence is a problem both globally and in the South African context, and results in a
number of social, emotional, and psychological consequences. We conducted a systematic
review to identify and assess the effectiveness of interventions aimed at preventing primary
school violence among peers, as well as the transportability of these interventions to the South
African context. Studies were eligible if they were published between 2005 and 2017, were
randomised controlled trials and assessed violence between primary school learners. Studies
that assessed interventions aiming to reduce violence such as bullying, externalising behaviour
and aggression were included in the review. We identified 35 studies that met our eligibility
criteria. Thirty-three of the studies were conducted in high-income countries. Of these, 26 were
conducted in North America, including Canada and the United States, six studies were
conducted in Europe and one in the Western Pacific. Two studies were conducted in Africa;
one was completed in a lower-middle income country and the other a low-income country. The
majority of the studies reported a significant improvement in violence related behaviours. The
studies described 23 different interventions, which varied considerably in design and content.
Two interventions targeted only boys, one targeted only girls, while the rest targeted both boys
and girls. Eleven of the interventions have been transported from the original place of study.
However, none of them were transported to upper middle-income countries such as South
Africa. More research is required on the effectiveness of interventions in low- and middle-
income contexts.
Keywords: systematic review; primary school violence; bullying; aggression; randomised
controlled trials; intervention; transportability.
5
Introduction
The magnitude of the problem of violence in South African primary schools is alarming. A
nationally representative school violence study done in South Africa in 2008 showed that
15.3% of primary school children had experienced or been exposed to various forms of
violence while attending school (Burton, 2008a). This refers to both interpersonal physical and
emotional violence, namely physical attacks, sexual harassment and threats of violence
(Burton, 2008a). Incidents of physical attacks by learners amounted to 7.5% (Burton, 2008b)
while 12% of primary school learners stated that they had been victims of relational violence -
shouting or intentionally being embarrassed by learner perpetrators in the presence of other
peers (Burton, 2008a). Between 2006 and 2007, cases of sexual harassment among South
African primary school learners amounted to 106,249 (Burton, 2008c). There is some evidence,
although not nationally representative, that many - 91.3% in one small study - primary school
children have witnessed learners physically attacking one another (Shields, Nadasen, & Pierce,
2008). This kind of exposure is also detrimental to children’s mental state (Shields et al., 2008).
Although these studies revealed high rates of interpersonal violence among learners,
96.3% of primary school learners stated that they did not consider themselves in danger at
school, which might indicate the extent to which school violence has become normalised
(Burton, 2008b). The prevalence of violence in primary schools appears to vary according to
socioeconomic background, race and gender. Greater rates of learner-to-learner violence in
primary schools were reported to have been experienced by Coloured (22%) and Black learners
(20.2%) compared to White learners (16.9%; Burton, 2008c; De Wet, 2003; Shields et al.,
2008). In terms of gender, relational violence is more common among girls while boys are
more likely to engage in physical forms of violence (Menesini & Salmivalli, 2017).
Rates of school violence in South Africa are higher than those in the United States (US)
and other high-income countries (Burton, 2008c) although globally, violence in primary
6
schools also occurs at high rates. For instance, in a study on prevalence of violence in primary
schools in Cairo, interpersonal violence between learners amounted to 69% (Ez-Elarab,
Sabbour, Gadallah, & Asaad, 2007). In Massachusetts, 23% of elementary school learners
reported having been bullied up to three times in one month (Yerger & Gehret, 2011).
Clearly, violence among learners in primary schools is prevalent, and this is the focus
of this systematic review. Violence refers to:
The intentional use of physical force or power, threatened or actual, (against
oneself), another person, or against a group or community, that either results
in or has a high likelihood of resulting in injury, death, psychological harm,
maldevelopment or deprivation (Krug, Dahlberg, Mercy, Zwi, & Lozano, 2002, p. 5).
More specifically, school violence refers to “violence occurring on school premises,
while travelling to or from school, or during a school-sponsored event” (Lester, Lawrence, &
Ward, 2017, p. 2). Forms of school violence include harassment, bullying and teasing
(Leoschut, 2008). According to Olweus (1997), bullying refers to when a learner is “exposed,
repeatedly and over time, to negative actions on the part of one or more other students” (p.
496). These actions may be physical or emotional (Burton, 2008b; Olweus, 1997). Bullying
also involves unequal power relations between the bully and victim (Lester et al., 2017;
Menesini & Salmivalli, 2017). This imbalance can result from the victim being physically
weaker than the bully, having less institutional power or a difference in number where a group
is bullying an individual (Olweus, 1997). Bullying is a subset of violence, and, from the
definitions of ‘violence’ and ‘bullying’ above, differences between the two lies in the
imbalance of power and repetition of acts in bullying while violent acts need only occur once.
Whether these violent acts occur once or are repeated, it is a problem that is unacceptable and
needs to be addressed. Thus, violence, including bullying, will be addressed in this review.
7
Not only is the extent of violence in primary schools alarming but its consequences are
too, in both local and international contexts. High rates of school violence negatively affect the
quality of education received as well as the emotional and physiological state of these victims
(Burton, Leoschut, & Popovac, 2011; Makota & Leoschut, 2016). Exposure to school violence
may lead to permanent health, economic, educational and social problems (World Health
Organization, United Nations Office on Drugs and Crime, & United Nations Development
Programme, 2014). Learners who experience violence are likely to have low confidence levels
and to be less popular at school (Johnson, 2009; Yerger & Gehret, 2011). School violence
affects their academic performance and learning abilities (Ez-Elarab et al., 2007; Johnson,
2009), and increases the dropout and absenteeism rates (Menesini & Salmivalli, 2017). In turn,
these consequences negatively affect opportunities for employment later on for victims
(Gavine, Donnelly, & Williams, 2016; Menesini & Salmivalli, 2017). Suicide rates as well as
reports of mental health disorders such as depression and anxiety are higher for learners
exposed to violence than those who are not (Johnson, 2009; Liang, Flisher, & Lombard, 2007;
Olweus, 1997; Yerger & Gehret, 2011). A long-term consequence for learners involved in
school violence is the increased risk of delinquency and criminal behaviour later on in life
(Olweus & Limber, 2010).
There are several reasons why an emphasis needs to be placed on interventions
specifically in primary schools, rather than later in the educational trajectory. Firstly, earlier
exposure to violence is related to a long list of health risk behaviours, such as consuming
alcohol and smoking, that emerge in adolescence, as well as experiencing a range of chronic
health conditions such as depression, cancer and heart disease (Ez-Elarab et al., 2007; Gavine
et al., 2016). Early exposure to violence might contribute to an increased and more severe use
of or exposure to violence at an older age (Eisenbraun, 2007). If exposure to violence can be
prevented in young children, it is highly likely that these behaviours will be prevented in
8
adolescents (Nation et al., 2003). Secondly, Yerger and Gehret (2011) also suggest that younger
learners are more vulnerable and inclined to be influenced by those who surround them daily
such as parents and school teachers. Due to this vulnerability, children not only learn negative
actions and habits from parents and teachers but positive ones too if they are exposed to them.
The third reason is that adjusting negative behaviours is more difficult later on when children
are older and have already adopted their negative habits (Yerger & Gehret, 2011). Lastly,
interventions have shown better outcomes when conducted in primary schools (Dymnicki,
Weissberg, & Henry, 2011; Kärnä et al., 2013; Piotrowski & Hoot, 2008). Due to the high
prevalence rates and consequences of violence in primary schools discussed above, the
importance of violence prevention interventions hardly needs to be stressed.
There is clear evidence that primary schools are important targets for violence
prevention interventions. One significant gap in the literature is that not much attention appears
to have been paid to interventions that reduce school violence in general, rather than bullying
specifically. Another gap is that there appear to be very few interventions aimed at preventing
primary school violence, while a great deal of attention has been paid to violence in high
schools. This limitation extends particularly to the South African context where the rates of
violence are high (Ward et al., 2012). Our proposal therefore addresses another gap as the
majority of prevention interventions have been studied in high income countries. South Africa
is an upper middle-income country (The World Bank Group, 2017) and the transportability -
the replication of interventions to different contexts - of these successful interventions is
unknown.
Given the importance of prevention interventions in primary schools and the difficulty
in identifying interventions in low- to middle-income countries, a systematic review will be
conducted. A systematic review allows us to examine the state of the evidence and whether
9
there is any evidence to suggest that these interventions might be suitable in low- to middle-
income countries.
Objectives
The key aim of this review is to answer the following research questions:
1. How effective are violence prevention interventions in reducing peer
violence in primary school settings?
2. Is there evidence that these effective interventions might be successfully
transported into low-and middle-income contexts such as South African
primary schools?
Methods
Criteria for Inclusion and Exclusion of Studies in the Review
Studies were included in this systematic review if they met the following criteria:
- They used a randomised controlled trial (RCT) design as it is the design that provides
the strongest evidence of effect (Cochrane Consumer Network, n.d.).
- The participants were primary school students in grades one to seven, ages six to 13.
This age group falls under elementary or middle school in some of the literature and
studies using this alternate terminology were included.
- Studies on interventions in kindergarten, primary and high schools were included if the
results were differentiated by grade or age, so that the results for primary schools were
clear.
- Interventions measured violence as an outcome variable. Studies on interventions using
other terminology for violence, such as “aggression”, “bullying” and “externalizing
behaviour” were also included.
10
- Studies that measure outcome variables such as attitudes towards violence were not
included, as attitudes are not strong predictors of behaviour (Snyder & Kendzierski,
1982).
- Studies that used medication as an intervention for violence were excluded.
- Interventions adopting universal, selective, indicated, whole-school, discrete,
comprehensive and specific approaches (Gevers & Flisher, 2012; Mrazek & Haggerty,
1994).
o Universal approaches are aimed at everyone in the suitable population.
Selective approaches are aimed at individuals in certain subgroups of the
population who are at a higher than average risk of engaging in a particular
behaviour. Lastly, indicated approaches are aimed at individuals who have
exhibited risk factors for a particular behaviour and are therefore at an increased
risk for developing that behaviour in the future (Mrazek & Haggerty, 1994).
o Whole-school approaches involve all facets of the school whereas discrete
approaches target specific facets of the school (Gevers & Flisher, 2012).
o Comprehensive interventions cover many risk behaviours whereas specific
interventions are focused on particular risk behaviours (Gevers & Flisher,
2012).
- Interventions which aimed to prevent corporal punishment, cyber bullying, dating
violence or other forms of violence that do not occur on school premises or during
school related events were excluded as they were beyond the scope of this study.
- Studies must have been published between 2005 and 2017.
- Searches were limited to peer-reviewed papers. No grey literature was included.
- Only papers published in English were included.
11
- The search was not restricted by geography, publication status or other study
characteristics.
Search Strategy for Finding Eligible Studies
This review is building on previous work conducted by two pairs of researchers from
the University of Cape Town on the broad topic of school violence. These teams conducted
literature searches for the years 2005-2010 and 2011-2015 respectively. Searches had been
conducted in multiple databases and were limited to searching within abstracts using the search
terms, school AND (violen* OR aggress* OR bully* OR bulli*) for the period 2005 to 2015.
Hand searches were also conducted in relevant journals. Each researcher had conducted his/her
own searches independently and the results from these databases and hand searches were saved.
No further work was done once the abstracts had been downloaded.
For the current review, using the same search string as the previous teams, databases
and hand searched journals were updated. Independently each of us updated the searches for
the period of October 2015 to 2017, as the previous teams finished their searches in September
2015. These teams also conducted searches within grey literature; however, this literature was
excluded in this review (see Appendix A).
Search Terms and Keywords
Each of us screened the previous teams’ and updated search results independently. To
refine the searches to fit our current topic, the following process was conducted within each
library:
1. The terms “intervention” or “prevention” were searched. Results were saved in a
separate folder.
2. Within this new folder, the terms “primary” or “middle” or “elementary” were
searched. The results from this search were saved in a second folder.
12
3. Within the second folder, the terms “randomised” or “randomized” or “RCT” were
searched and results saved in a final folder.
The limiters were set to “any field” and “contains” so that any study containing the
abovementioned search terms in any section of the paper would be found. After each individual
search, the number of results were recorded.
Data Collection and Analysis
Selection of studies. When selecting data for inclusion the following steps were taken:
1. We searched all libraries from previous studies and all updated searches independently.
From the narrowed down results, we reviewed the abstracts and titles independently to
make decisions on inclusion and exclusion.
2. Screened abstracts were compared by both reviewers and consensus was reached
regarding relevant abstracts.
3. From the final list of abstracts, full-texts were downloaded independently and screened
for inclusion (see Appendix B). If information was missing or unclear, we contacted
the author when possible.
4. Once completed, we met to agree on a final list of included studies.
5. After each step, we recorded the number of included and excluded studies in the
PRISMA flow diagram (see Figure 1; Moher, Liberati, Tetzlaff, Altman, & The
PRISMA Group, 2009).
6. From the final list of included studies, all relevant data was extracted as described
below.
Data extraction and management. The data from the final list of full-text studies was
independently extracted by the reviewers using the data coding form (Appendix C). The first
11 were extracted by both reviewers to compare consistency of data extraction, which was
achieved. The remaining studies were split between the two reviewers. This form included
13
information about the intervention approach, grades involved, implementer, study and
intervention duration, programme content, type of violence assessed, items used to measure
violence, WHO region, country income group, data for transportability and study results. In
terms of coding the country’s income group, categories of low-, lower middle-, upper middle-
and high-income were used (The World Bank Group, 2017). For measuring transportability,
place of origin, place to which transported, and results were reported. If we could not find any
evidence that interventions had been transported, we assumed that they were not transported.
The Cochrane handbook recommends the use of the PROGRESS characteristics which stands
for Place, Race, Occupation, Gender, Religion, Education, Socioeconomic status, Social status
(“National Collaborating Centre for Methods and Tools”, 2015). We recognise that the effects
of interventions may be moderated by these factors. We collected data for all of these
characteristics except Occupation, Religion, Education and Social status as these would play a
very little role in the lives of learners.
Assessment of risk of bias in included studies. We each assessed the risk of bias in
the studies using the Downs and Black (1998) checklist to assess the methodological quality
of RCTs (Appendix D). This assessment included various domains of reporting, validity, and
power to assess the risk of bias. Each bias was coded as yes, no or unable to determine. At the
end, numbers of yes, no and unable to determine were tallied and each study was assessed
accordingly. From this, each study was coded as either having an “excellent”, “good”, “fair”
or “poor” risk of bias (Downs & Black, 1998). We used this to identify possible limitations of
the studies and the effects of the bias when interpreting the results.
Measures of treatment effect. If the intervention effect size was reported, it was
identified to assess the size of the treatment effect, if any. We included standardised effect sizes
such as Cohen’s d, R2, and odds ratio.
14
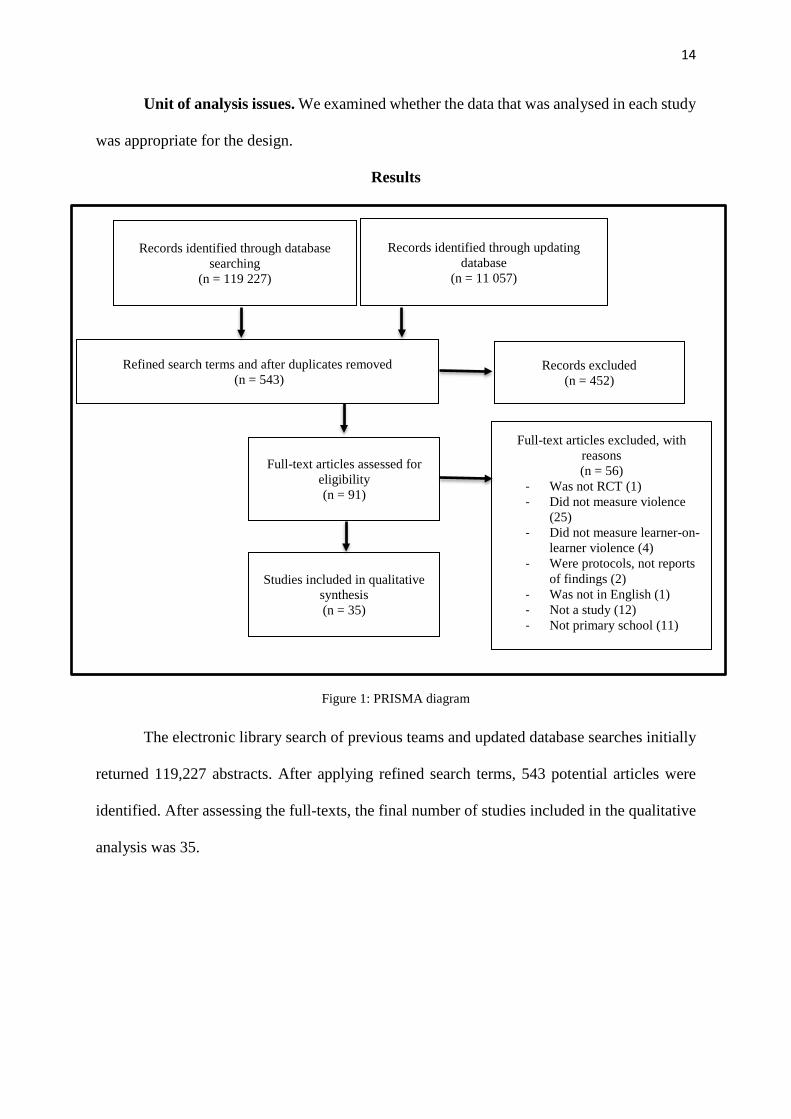
Unit of analysis issues. We examined whether the data that was analysed in each study
was appropriate for the design.
Results
Figure 1: PRISMA diagram
The electronic library search of previous teams and updated database searches initially
returned 119,227 abstracts. After applying refined search terms, 543 potential articles were
identified. After assessing the full-texts, the final number of studies included in the qualitative
analysis was 35.
Records identified through database searching
(n = 119 227)
Records identified through updating database
(n = 11 057)
Refined search terms and after duplicates removed (n = 543)
Records excluded (n = 452)
Full-text articles assessed for eligibility (n = 91)
Full-text articles excluded, with reasons (n = 56)
- Was not RCT (1) - Did not measure violence
(25) - Did not measure learner-on-
learner violence (4) - Were protocols, not reports
of findings (2) - Was not in English (1) - Not a study (12) - Not primary school (11)
Studies included in qualitative synthesis (n = 35)
15
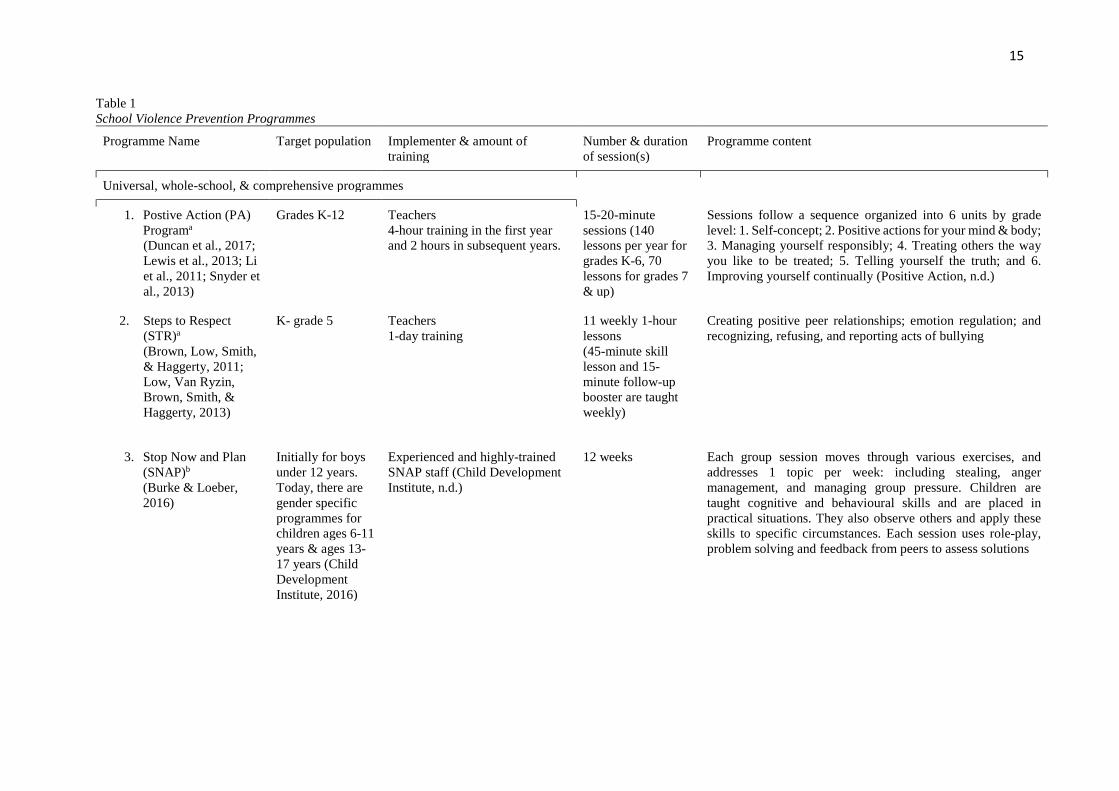
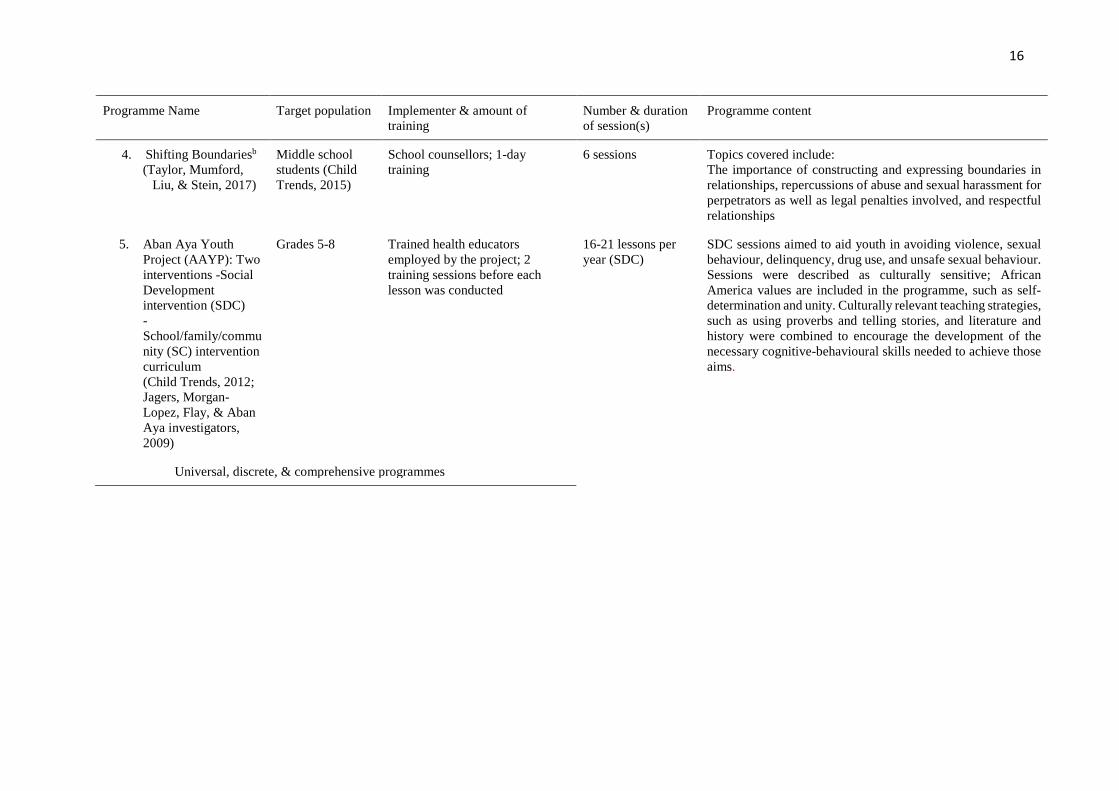
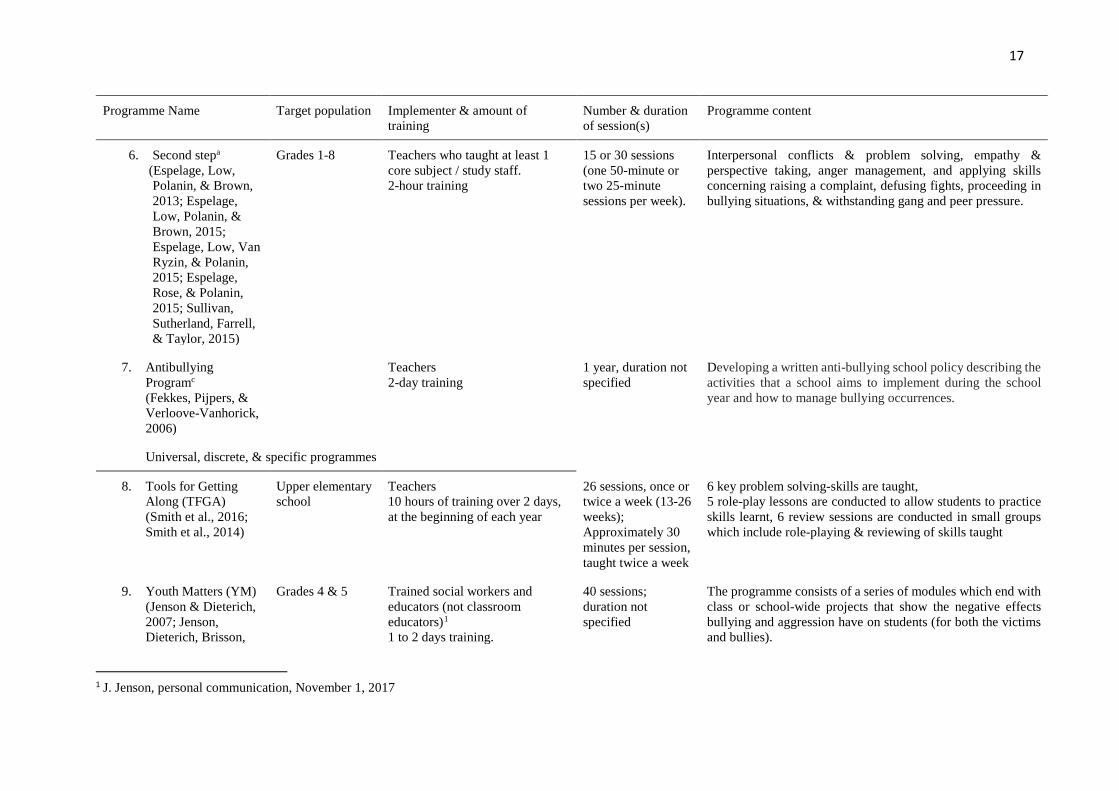
Table 1 School Violence Prevention Programmes
Programme Name Target population Implementer & amount of training
Number & duration of session(s)
Programme content
Universal, whole-school, & comprehensive programmes
1. Postive Action (PA) Programa (Duncan et al., 2017; Lewis et al., 2013; Li et al., 2011; Snyder et al., 2013)
Grades K-12
Teachers 4-hour training in the first year and 2 hours in subsequent years.
15-20-minute sessions (140 lessons per year for grades K-6, 70 lessons for grades 7 & up)
Sessions follow a sequence organized into 6 units by grade level: 1. Self-concept; 2. Positive actions for your mind & body; 3. Managing yourself responsibly; 4. Treating others the way you like to be treated; 5. Telling yourself the truth; and 6. Improving yourself continually (Positive Action, n.d.)
2. Steps to Respect (STR)a
(Brown, Low, Smith, & Haggerty, 2011; Low, Van Ryzin, Brown, Smith, & Haggerty, 2013)
K- grade 5
Teachers 1-day training
11 weekly 1-hour lessons (45-minute skill lesson and 15-minute follow-up booster are taught weekly)
Creating positive peer relationships; emotion regulation; and recognizing, refusing, and reporting acts of bullying
3. Stop Now and Plan (SNAP)b
(Burke & Loeber, 2016)
Initially for boys under 12 years. Today, there are gender specific programmes for children ages 6-11 years & ages 13-17 years (Child Development Institute, 2016)
Experienced and highly-trained SNAP staff (Child Development Institute, n.d.)
12 weeks Each group session moves through various exercises, and addresses 1 topic per week: including stealing, anger management, and managing group pressure. Children are taught cognitive and behavioural skills and are placed in practical situations. They also observe others and apply these skills to specific circumstances. Each session uses role-play, problem solving and feedback from peers to assess solutions
16
Programme Name Target population Implementer & amount of training
Number & duration of session(s)
Programme content
4. Shifting Boundariesb (Taylor, Mumford,
Liu, & Stein, 2017)
Middle school students (Child Trends, 2015)
School counsellors; 1-day training
6 sessions Topics covered include: The importance of constructing and expressing boundaries in relationships, repercussions of abuse and sexual harassment for perpetrators as well as legal penalties involved, and respectful relationships
5. Aban Aya Youth Project (AAYP): Two interventions -Social Development intervention (SDC) -School/family/community (SC) intervention curriculum (Child Trends, 2012; Jagers, Morgan-Lopez, Flay, & Aban Aya investigators, 2009)
Grades 5-8
Trained health educators employed by the project; 2 training sessions before each lesson was conducted
16-21 lessons per year (SDC)
SDC sessions aimed to aid youth in avoiding violence, sexual behaviour, delinquency, drug use, and unsafe sexual behaviour. Sessions were described as culturally sensitive; African America values are included in the programme, such as self-determination and unity. Culturally relevant teaching strategies, such as using proverbs and telling stories, and literature and history were combined to encourage the development of the necessary cognitive-behavioural skills needed to achieve those aims.
Universal, discrete, & comprehensive programmes
17
Programme Name Target population Implementer & amount of training
Number & duration of session(s)
Programme content
6. Second stepa (Espelage, Low,
Polanin, & Brown, 2013; Espelage, Low, Polanin, & Brown, 2015; Espelage, Low, Van Ryzin, & Polanin, 2015; Espelage, Rose, & Polanin, 2015; Sullivan, Sutherland, Farrell, & Taylor, 2015)
Grades 1-8
Teachers who taught at least 1 core subject / study staff. 2-hour training
15 or 30 sessions (one 50-minute or two 25-minute sessions per week).
Interpersonal conflicts & problem solving, empathy & perspective taking, anger management, and applying skills concerning raising a complaint, defusing fights, proceeding in bullying situations, & withstanding gang and peer pressure.
7. Antibullying Programc (Fekkes, Pijpers, & Verloove-Vanhorick, 2006)
Teachers 2-day training
1 year, duration not specified
Developing a written anti-bullying school policy describing the activities that a school aims to implement during the school year and how to manage bullying occurrences.
Universal, discrete, & specific programmes
8. Tools for Getting Along (TFGA) (Smith et al., 2016; Smith et al., 2014)
Upper elementary school
Teachers 10 hours of training over 2 days, at the beginning of each year
26 sessions, once or twice a week (13-26 weeks); Approximately 30 minutes per session, taught twice a week
6 key problem solving-skills are taught, 5 role-play lessons are conducted to allow students to practice skills learnt, 6 review sessions are conducted in small groups which include role-playing & reviewing of skills taught
9. Youth Matters (YM) (Jenson & Dieterich, 2007; Jenson, Dieterich, Brisson,
Grades 4 & 5
Trained social workers and educators (not classroom educators)1
1 to 2 days training.
40 sessions; duration not specified
The programme consists of a series of modules which end with class or school-wide projects that show the negative effects bullying and aggression have on students (for both the victims and bullies).
1 J. Jenson, personal communication, November 1, 2017
18
Programme Name Target population Implementer & amount of training
Number & duration of session(s)
Programme content
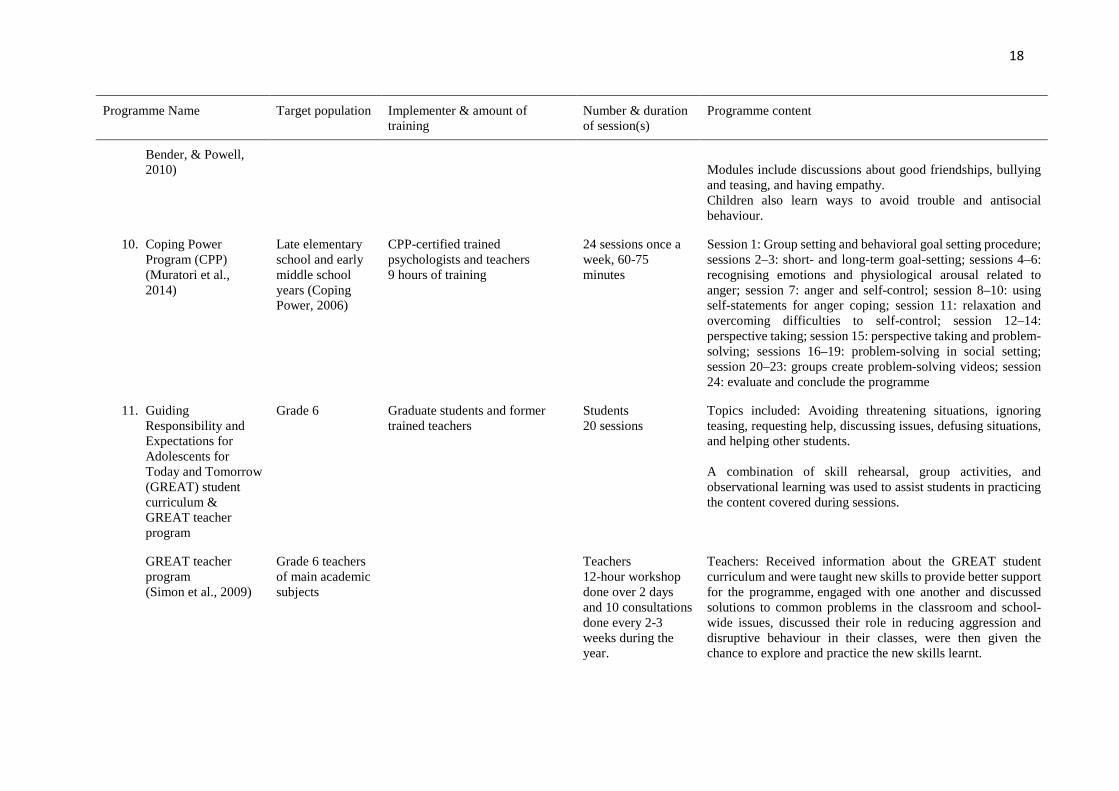
Bender, & Powell, 2010)
Modules include discussions about good friendships, bullying and teasing, and having empathy. Children also learn ways to avoid trouble and antisocial behaviour.
10. Coping Power Program (CPP) (Muratori et al., 2014)
Late elementary school and early middle school years (Coping Power, 2006)
CPP-certified trained psychologists and teachers 9 hours of training
24 sessions once a week, 60-75 minutes
Session 1: Group setting and behavioral goal setting procedure; sessions 2–3: short- and long-term goal-setting; sessions 4–6: recognising emotions and physiological arousal related to anger; session 7: anger and self-control; session 8–10: using self-statements for anger coping; session 11: relaxation and overcoming difficulties to self-control; session 12–14: perspective taking; session 15: perspective taking and problem- solving; sessions 16–19: problem-solving in social setting; session 20–23: groups create problem-solving videos; session 24: evaluate and conclude the programme
11. Guiding Responsibility and Expectations for Adolescents for Today and Tomorrow (GREAT) student curriculum & GREAT teacher program
Grade 6
Graduate students and former trained teachers
Students 20 sessions
Topics included: Avoiding threatening situations, ignoring teasing, requesting help, discussing issues, defusing situations, and helping other students. A combination of skill rehearsal, group activities, and observational learning was used to assist students in practicing the content covered during sessions.
GREAT teacher program (Simon et al., 2009)
Grade 6 teachers of main academic subjects
Teachers 12-hour workshop done over 2 days and 10 consultations done every 2-3 weeks during the year.
Teachers: Received information about the GREAT student curriculum and were taught new skills to provide better support for the programme, engaged with one another and discussed solutions to common problems in the classroom and school-wide issues, discussed their role in reducing aggression and disruptive behaviour in their classes, were then given the chance to explore and practice the new skills learnt.
19
Programme Name Target population Implementer & amount of training
Number & duration of session(s)
Programme content
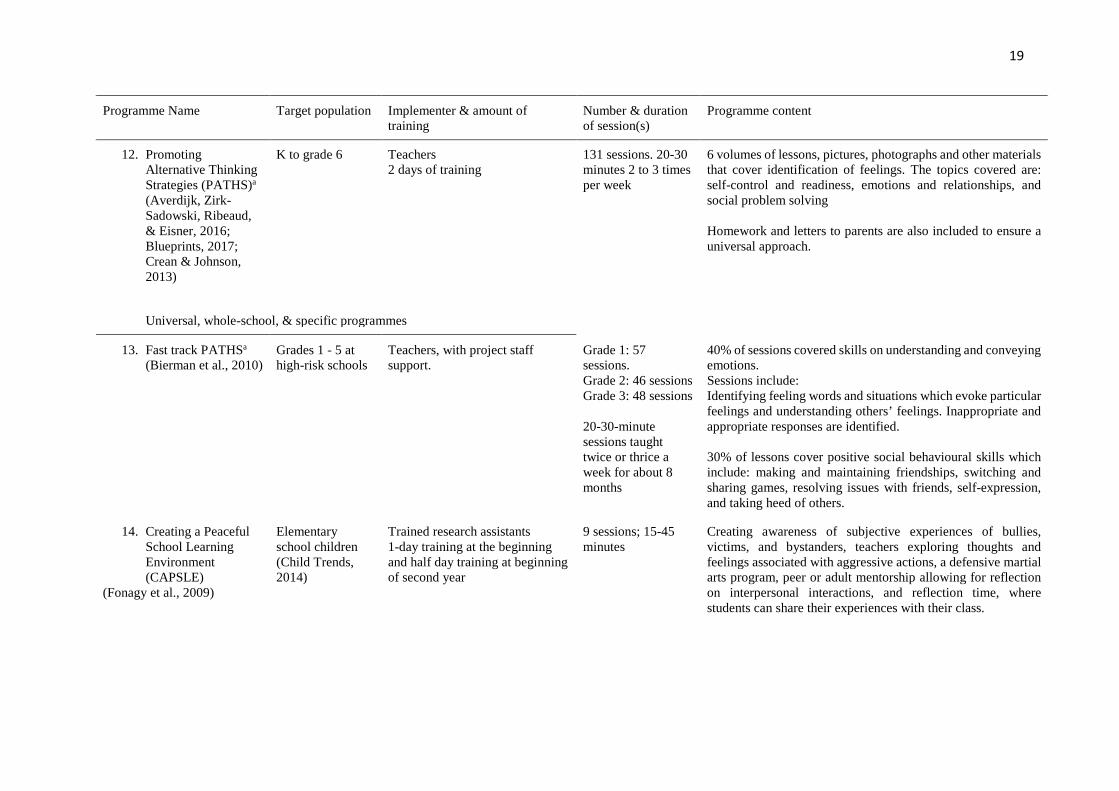
12. Promoting Alternative Thinking Strategies (PATHS)a (Averdijk, Zirk-Sadowski, Ribeaud, & Eisner, 2016; Blueprints, 2017; Crean & Johnson, 2013)
K to grade 6
Teachers 2 days of training
131 sessions. 20-30 minutes 2 to 3 times per week
6 volumes of lessons, pictures, photographs and other materials that cover identification of feelings. The topics covered are: self-control and readiness, emotions and relationships, and social problem solving Homework and letters to parents are also included to ensure a universal approach.
Universal, whole-school, & specific programmes
13. Fast track PATHSa
(Bierman et al., 2010) Grades 1 - 5 at high-risk schools
Teachers, with project staff support.
Grade 1: 57 sessions. Grade 2: 46 sessions Grade 3: 48 sessions 20-30-minute sessions taught twice or thrice a week for about 8 months
40% of sessions covered skills on understanding and conveying emotions. Sessions include: Identifying feeling words and situations which evoke particular feelings and understanding others’ feelings. Inappropriate and appropriate responses are identified. 30% of lessons cover positive social behavioural skills which include: making and maintaining friendships, switching and sharing games, resolving issues with friends, self-expression, and taking heed of others.
14. Creating a Peaceful School Learning Environment (CAPSLE)
(Fonagy et al., 2009)
Elementary school children (Child Trends, 2014)
Trained research assistants 1-day training at the beginning and half day training at beginning of second year
9 sessions; 15-45 minutes
Creating awareness of subjective experiences of bullies, victims, and bystanders, teachers exploring thoughts and feelings associated with aggressive actions, a defensive martial arts program, peer or adult mentorship allowing for reflection on interpersonal interactions, and reflection time, where students can share their experiences with their class.
20
Programme Name Target population Implementer & amount of training
Number & duration of session(s)
Programme content
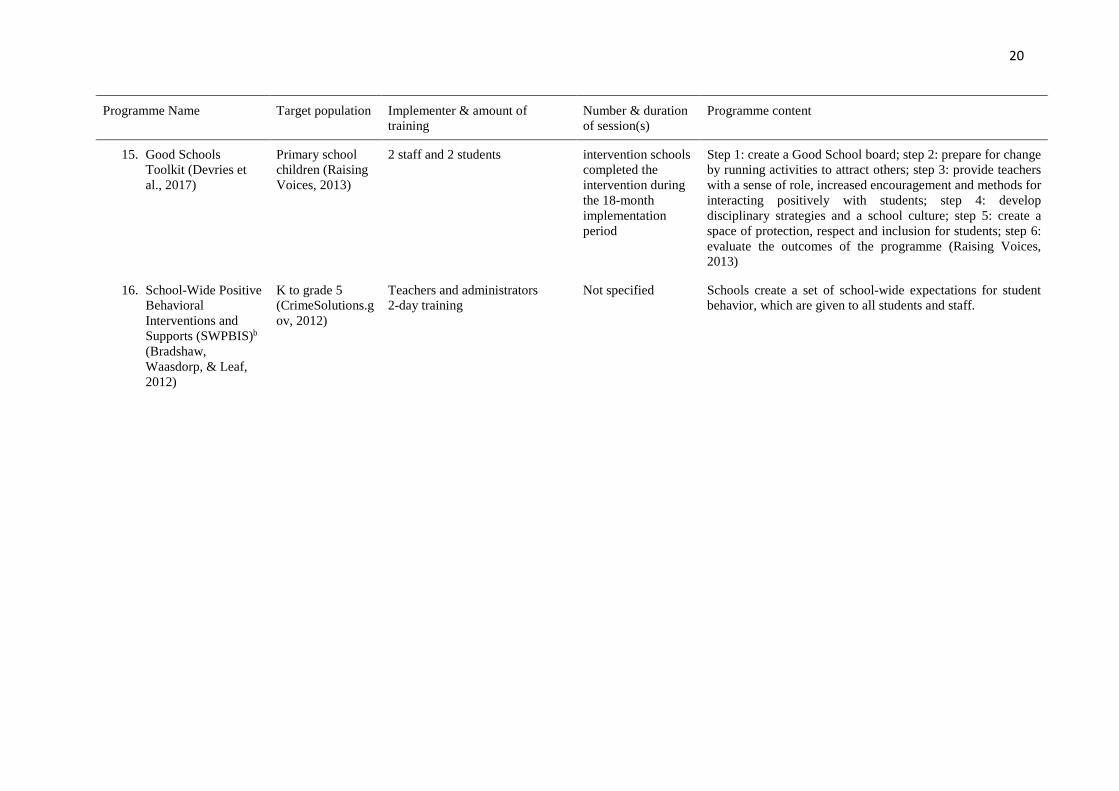
15. Good Schools Toolkit (Devries et al., 2017)
Primary school children (Raising Voices, 2013)
2 staff and 2 students intervention schools completed the intervention during the 18-month implementation period
Step 1: create a Good School board; step 2: prepare for change by running activities to attract others; step 3: provide teachers with a sense of role, increased encouragement and methods for interacting positively with students; step 4: develop disciplinary strategies and a school culture; step 5: create a space of protection, respect and inclusion for students; step 6: evaluate the outcomes of the programme (Raising Voices, 2013)
16. School-Wide Positive Behavioral Interventions and Supports (SWPBIS)b (Bradshaw, Waasdorp, & Leaf, 2012)
K to grade 5 (CrimeSolutions.gov, 2012)
Teachers and administrators 2-day training
Not specified Schools create a set of school-wide expectations for student behavior, which are given to all students and staff.
21
Programme Name Target population Implementer & amount of training
Number & duration of session(s)
Programme content
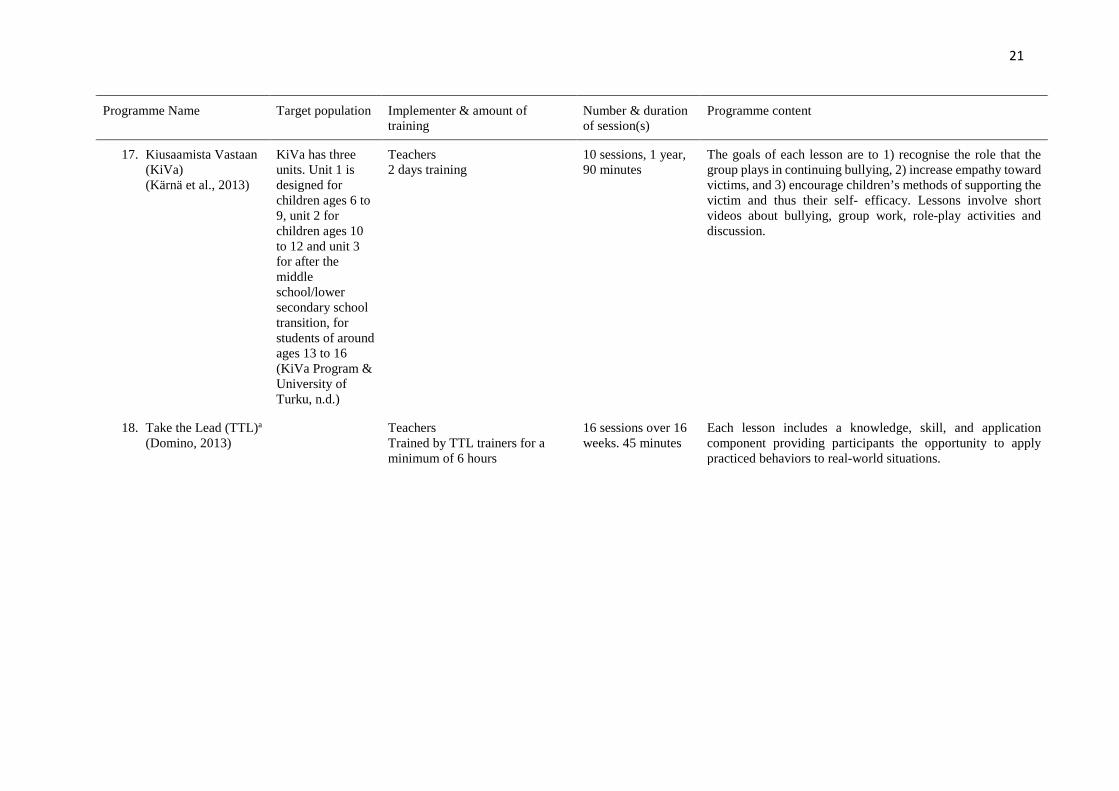
17. Kiusaamista Vastaan (KiVa) (Kärnä et al., 2013)
KiVa has three units. Unit 1 is designed for children ages 6 to 9, unit 2 for children ages 10 to 12 and unit 3 for after the middle school/lower secondary school transition, for students of around ages 13 to 16 (KiVa Program & University of Turku, n.d.)
Teachers 2 days training
10 sessions, 1 year, 90 minutes
The goals of each lesson are to 1) recognise the role that the group plays in continuing bullying, 2) increase empathy toward victims, and 3) encourage children’s methods of supporting the victim and thus their self- efficacy. Lessons involve short videos about bullying, group work, role-play activities and discussion.
18. Take the Lead (TTL)a
(Domino, 2013)
Teachers Trained by TTL trainers for a minimum of 6 hours
16 sessions over 16 weeks. 45 minutes
Each lesson includes a knowledge, skill, and application component providing participants the opportunity to apply practiced behaviors to real-world situations.
22
Programme Name Target population Implementer & amount of training
Number & duration of session(s)
Programme content
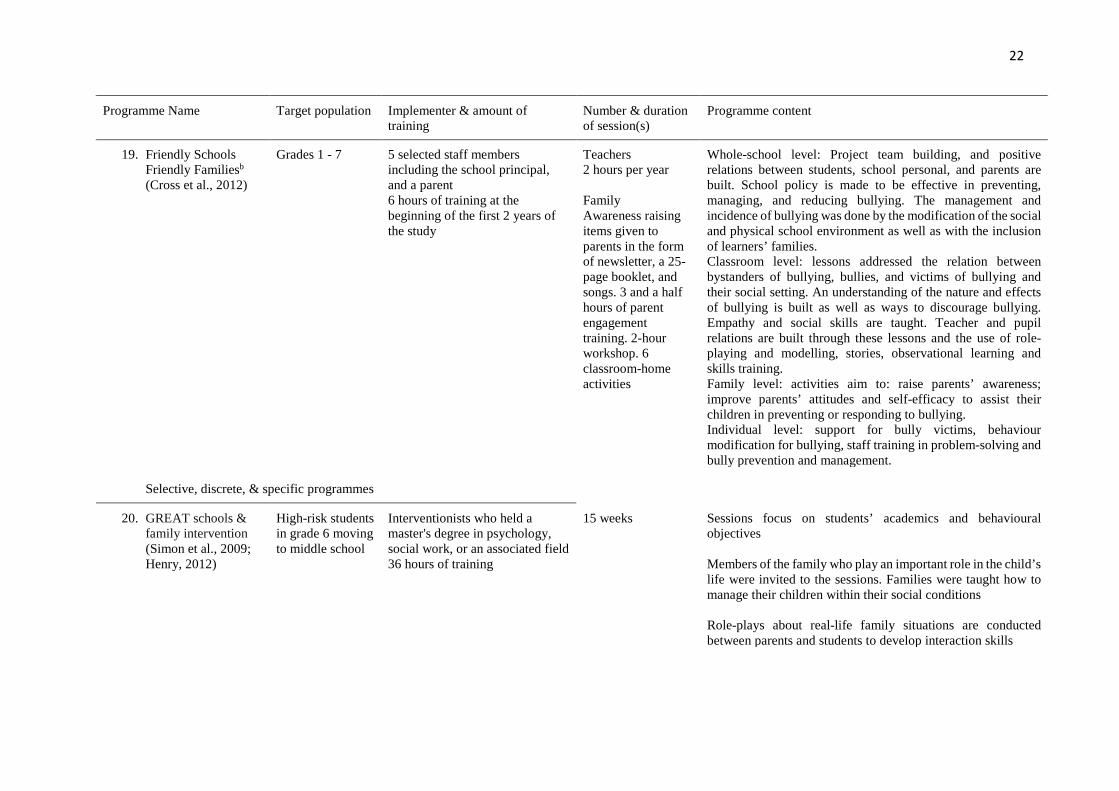
19. Friendly Schools Friendly Familiesb
(Cross et al., 2012)
Grades 1 - 7
5 selected staff members including the school principal, and a parent 6 hours of training at the beginning of the first 2 years of the study
Teachers 2 hours per year Family Awareness raising items given to parents in the form of newsletter, a 25-page booklet, and songs. 3 and a half hours of parent engagement training. 2-hour workshop. 6 classroom-home activities
Whole-school level: Project team building, and positive relations between students, school personal, and parents are built. School policy is made to be effective in preventing, managing, and reducing bullying. The management and incidence of bullying was done by the modification of the social and physical school environment as well as with the inclusion of learners’ families. Classroom level: lessons addressed the relation between bystanders of bullying, bullies, and victims of bullying and their social setting. An understanding of the nature and effects of bullying is built as well as ways to discourage bullying. Empathy and social skills are taught. Teacher and pupil relations are built through these lessons and the use of role- playing and modelling, stories, observational learning and skills training. Family level: activities aim to: raise parents’ awareness; improve parents’ attitudes and self-efficacy to assist their children in preventing or responding to bullying. Individual level: support for bully victims, behaviour modification for bullying, staff training in problem-solving and bully prevention and management.
Selective, discrete, & specific programmes
20. GREAT schools & family intervention (Simon et al., 2009; Henry, 2012)
High-risk students in grade 6 moving to middle school
Interventionists who held a master's degree in psychology, social work, or an associated field 36 hours of training
15 weeks Sessions focus on students’ academics and behavioural objectives Members of the family who play an important role in the child’s life were invited to the sessions. Families were taught how to manage their children within their social conditions Role-plays about real-life family situations are conducted between parents and students to develop interaction skills
23
Programme Name Target population Implementer & amount of training
Number & duration of session(s)
Programme content
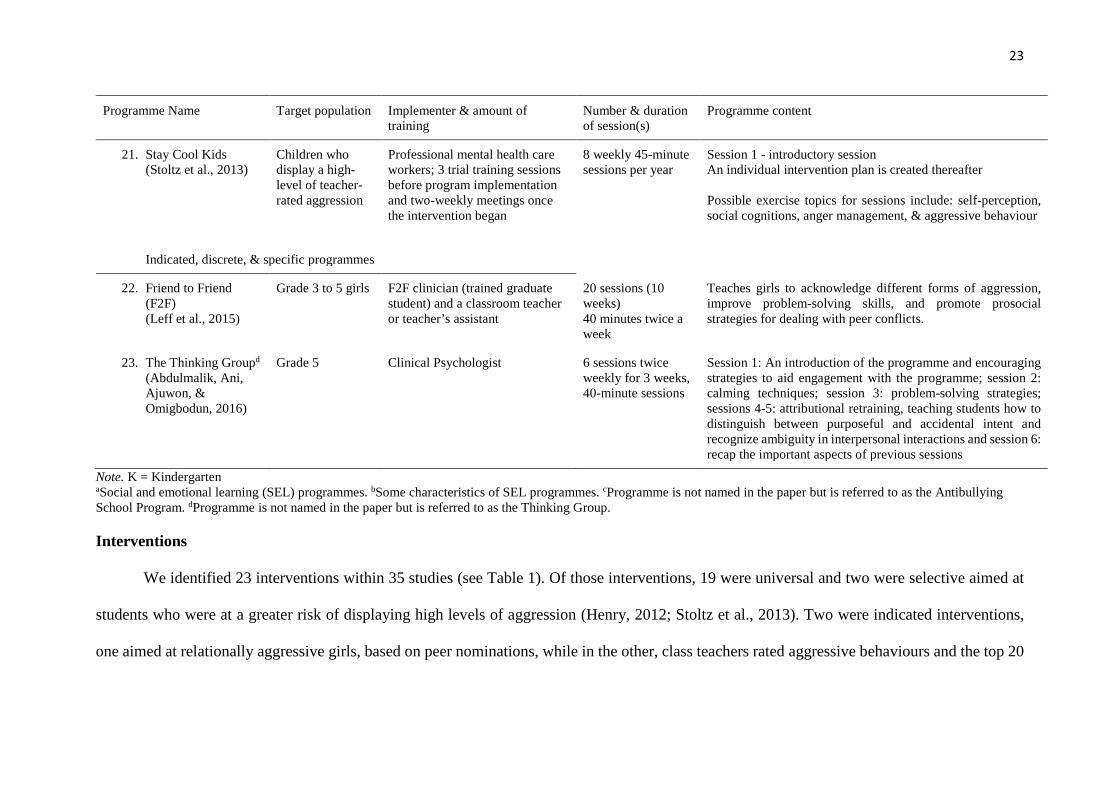
21. Stay Cool Kids (Stoltz et al., 2013)
Children who display a high-level of teacher-rated aggression
Professional mental health care workers; 3 trial training sessions before program implementation and two-weekly meetings once the intervention began
8 weekly 45-minute sessions per year
Session 1 - introductory session An individual intervention plan is created thereafter Possible exercise topics for sessions include: self-perception, social cognitions, anger management, & aggressive behaviour
Indicated, discrete, & specific programmes
22. Friend to Friend (F2F) (Leff et al., 2015)
Grade 3 to 5 girls
F2F clinician (trained graduate student) and a classroom teacher or teacher’s assistant
20 sessions (10 weeks) 40 minutes twice a week
Teaches girls to acknowledge different forms of aggression, improve problem-solving skills, and promote prosocial strategies for dealing with peer conflicts.
23. The Thinking Groupd (Abdulmalik, Ani, Ajuwon, & Omigbodun, 2016)
Grade 5 Clinical Psychologist 6 sessions twice weekly for 3 weeks, 40-minute sessions
Session 1: An introduction of the programme and encouraging strategies to aid engagement with the programme; session 2: calming techniques; session 3: problem-solving strategies; sessions 4-5: attributional retraining, teaching students how to distinguish between purposeful and accidental intent and recognize ambiguity in interpersonal interactions and session 6: recap the important aspects of previous sessions
Note. K = Kindergarten aSocial and emotional learning (SEL) programmes. bSome characteristics of SEL programmes. cProgramme is not named in the paper but is referred to as the Antibullying School Program. dProgramme is not named in the paper but is referred to as the Thinking Group. Interventions
We identified 23 interventions within 35 studies (see Table 1). Of those interventions, 19 were universal and two were selective aimed at
students who were at a greater risk of displaying high levels of aggression (Henry, 2012; Stoltz et al., 2013). Two were indicated interventions,
one aimed at relationally aggressive girls, based on peer nominations, while in the other, class teachers rated aggressive behaviours and the top 20
24
highest scoring boys were targeted (Abdulmalik et al., 2016; Leff et al., 2015). One of the
interventions, Kiusaamista Vastaan (KiVa), uses a universal approach, with the additional
option of also using an indicated approach (Kärnä et al., 2013). The universal approach
involves three different versions for different ages, aimed at grades one, four, and seven (Kärnä
et al., 2013). In schools implementing the indicated KiVa approach, three school staff and the
classroom teacher address bullying cases as they arise (Kärnä et al., 2013). Twelve
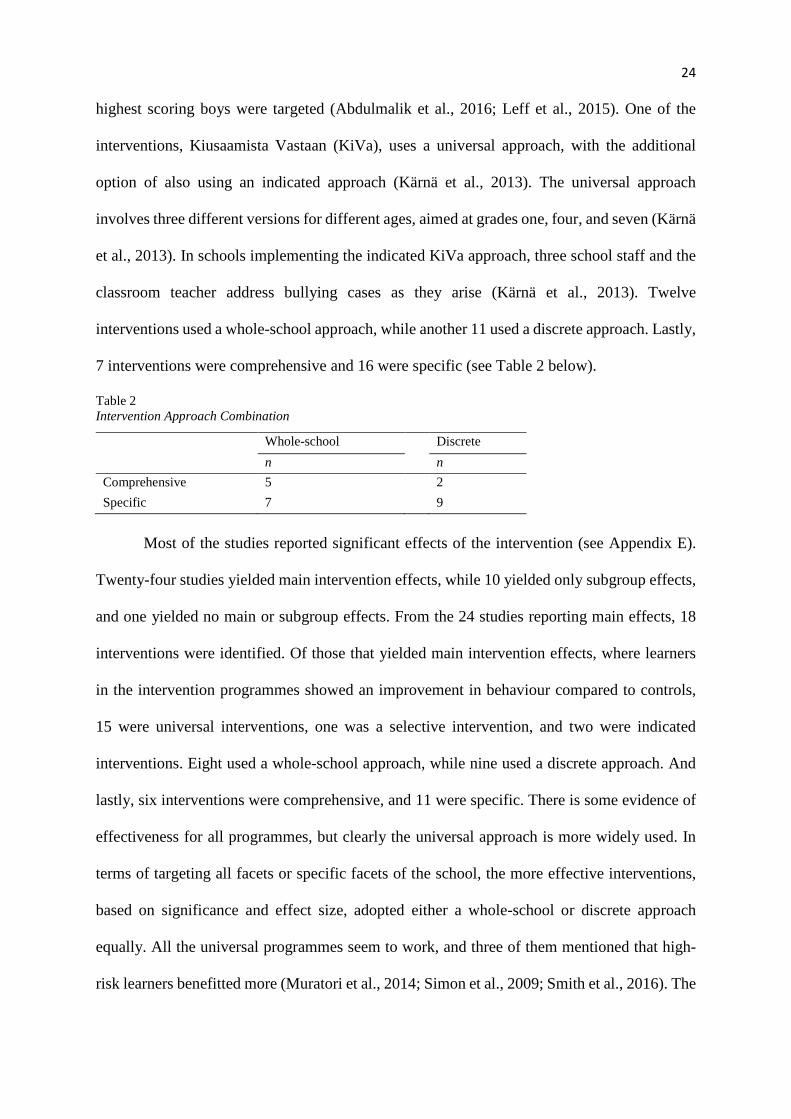
interventions used a whole-school approach, while another 11 used a discrete approach. Lastly,
7 interventions were comprehensive and 16 were specific (see Table 2 below).
Table 2 Intervention Approach Combination
Most of the studies reported significant effects of the intervention (see Appendix E).
Twenty-four studies yielded main intervention effects, while 10 yielded only subgroup effects,
and one yielded no main or subgroup effects. From the 24 studies reporting main effects, 18
interventions were identified. Of those that yielded main intervention effects, where learners
in the intervention programmes showed an improvement in behaviour compared to controls,
15 were universal interventions, one was a selective intervention, and two were indicated
interventions. Eight used a whole-school approach, while nine used a discrete approach. And
lastly, six interventions were comprehensive, and 11 were specific. There is some evidence of
effectiveness for all programmes, but clearly the universal approach is more widely used. In
terms of targeting all facets or specific facets of the school, the more effective interventions,
based on significance and effect size, adopted either a whole-school or discrete approach
equally. All the universal programmes seem to work, and three of them mentioned that high-
risk learners benefitted more (Muratori et al., 2014; Simon et al., 2009; Smith et al., 2016). The
Whole-school Discrete n n Comprehensive 5 2 Specific 7 9
25
more effective interventions – based on main intervention effects - were also specific in nature.
Therefore, the best combination of approaches appears to be universal and specific, for
example, Tools for Getting Along and the Coping Power Program (Muratori et al., 2014; Smith
et al., 2016).
Eleven interventions were implemented by school staff and eight were administered by
individuals external to the schools, such as health professionals, psychologists, intervention
clinicians and graduate students. Four interventions were implemented by both school staff and
external administrators. Of the 17 interventions that yielded main effects, seven were
implemented by internal school staff, seven by external programme staff or psychologists,
while three were implemented by both internal and external parties. The number of sessions
received ranged between six sessions to 140 sessions per year and there was no clear pattern
for those yielding main effects as the number of sessions varied.
Two interventions targeted only boys; one only targeted girls, while the rest of the
interventions targeted both boys and girls. Of the interventions targeting only boys, one used a
universal approach, while the other used a selective approach. Both were comprehensive
interventions. The intervention that only targeted girls, used an indicated and specific approach,
targeting relational aggression. The reason that interventions aiming to reduce relational
violence targeted only girls is due to relational violence being more common among girls
(Menesini & Salmivalli, 2017). All three of these interventions significantly reduced
aggression, but only two of them reported an effect size. The Thinking Group, targeting boys,
yielded a large effect size, and Friend to Friend, targeting girls, yielded a small effect size.
Many of the interventions adopted a social and emotional learning (SEL) approach.
SEL combines frameworks of youth development and proficiency promotion to decrease risk
factors and adopt protective factors encouraging positive development (Durlak, Weissberg,
Dymnicki, Taylor, & Schellinger, 2011). SEL is considered a process in which one learns
26
fundamental abilities to identify and manage emotions, create and reach goals, accept the
viewpoint of others, create and uphold positive relationships, control situations beneficially
and make reasonable decisions (Domitrovich, Durlak, Goren, & Weissberg, 2013; Durlak et
al., 2011). Social and emotional abilities are important for academic outcomes, being an
effective learner and a variety of dangerous behaviours, such as violence and bullying, can be
reduced when social and emotional skills are implemented (Domitrovich et al., 2013).
Domitrovich et al. (2013) acknowledged five interconnected sets of cognitive, affective, and
behavioral abilities: self-awareness, self-management, social awareness, relationship skills and
responsible decision-making. SEL programmes can teach and implement these abilities in
various ways. Some programmes use them to address issues of substance abuse and violence
prevention and health assistance whereas others have more particular modules that adopt safe,
open and engaging learning spaces that creates enthusiasm to learn and to achieve
(Domitrovich et al., 2013). Of the 23 interventions, four had some characteristics of SEL
programmes, and six had all five characteristics (see table 1). Of the six SEL programmes five
reported main effects in studies. Two of the programmes that possess some SEL characteristics
reported main effects in the included studies. Social and emotional learning programmes
include the theoretical change from valuing deficit-based behaviour change, such as preventing
negative behaviours, to strength-based behaviour change such as developing social abilities
(Domino, 2013).
Studies
We found two studies focusing on the broad category of externalizing behaviours, one
focusing on proactive and reactive aggression, and the other on aggressive and non-aggressive
behaviours (See Table 3 in Appendix E). Nineteen studies focused on a slightly narrower
category of aggression, and 12 on bullying. Two studies were directed at both bullying and
aggressive behaviours.
27
Thirty-three of the studies were conducted in high-income countries. Twenty-six of
those were conducted in North America, including the US and Canada, 6 in the European WHO
region, and 1 in the Western Pacific region. An additional study was conducted in a low-income
country and another in a lower middle-income country. Both were from the African WHO
region. The majority of studies were conducted in low-income schools. Using the PROGRESS
framework, we aimed to compare these categories across studies. However, almost all the
studies measured overall intervention effects rather than these moderator effects. A clear
comparison within these categories could therefore not be made.
All the 35 studies reported a reduction in some form of violence. Thirteen of the studies
did not report an effect size. However, of those that did, 16 were small, two studies reported a
combination of small to medium effect sizes, and one had a large effect size. Three studies did
not state the actual effect size statistic used. However, even though most of the studies reported
a small effect size, it does not necessarily mean that the impact of the intervention is not
effective. It is not merely the size of the effect that is vital, but the practical or clinical value of
the results (Durlak, 2009). Furthermore, studies used different measures to assess the outcomes
of violence which therefore limits comparison.
Using the Downs and Black checklist to assess the methodological quality of each
study, scores ranged from 13 (poor) to 25 (excellent). One study was rated poor, 16 fair, 16
good, and 2 rated excellent. Overall, the methodological quality of the included studies was
between fair and good. It should be noted that a disadvantage of using the Downs and Black
checklist to assess the methodological quality of these studies was that in studies of
interventions such as these, it is impossible to blind study participants to intervention groups
and those measuring the outcomes. This is because the intent of violence prevention
programmes cannot be hidden. Based on the Downs and Black (1998) results, research on
interventions could improve their methodological quality by clearly describing the distribution
28
of principle confounders in each study group, reporting the adverse events that could be
consequences of the interventions and by recruiting participants who are representative of the
target population.
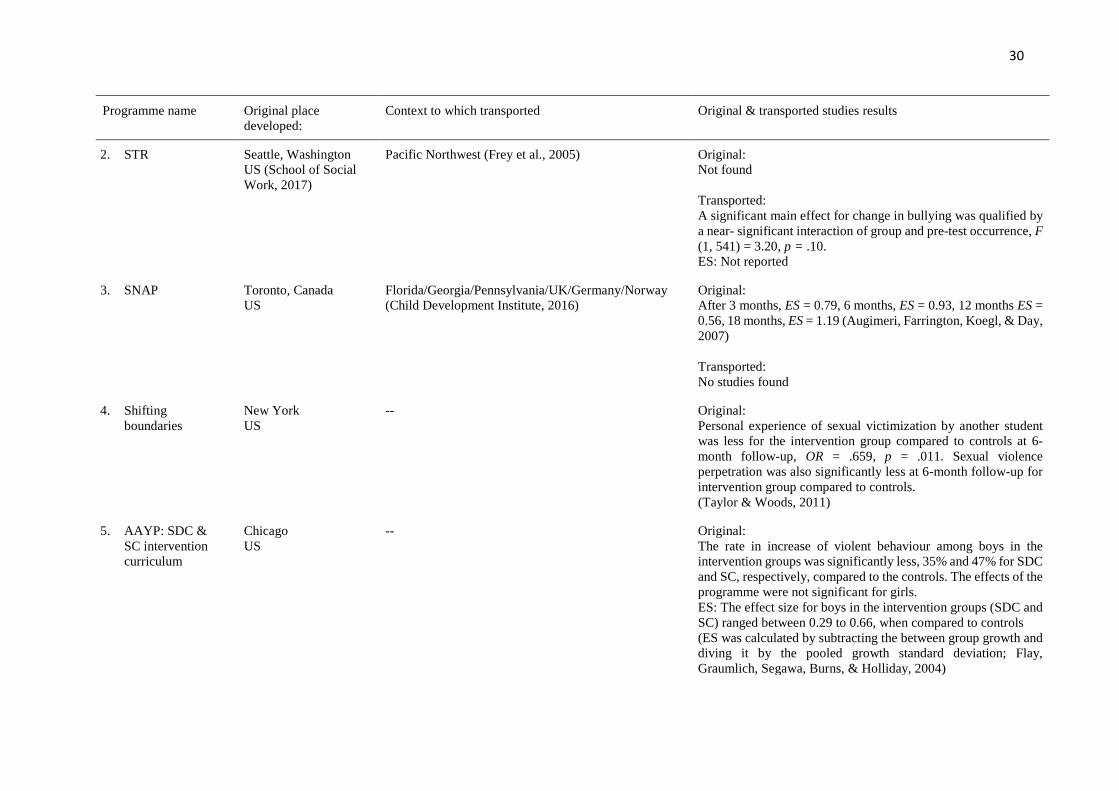
Transportability
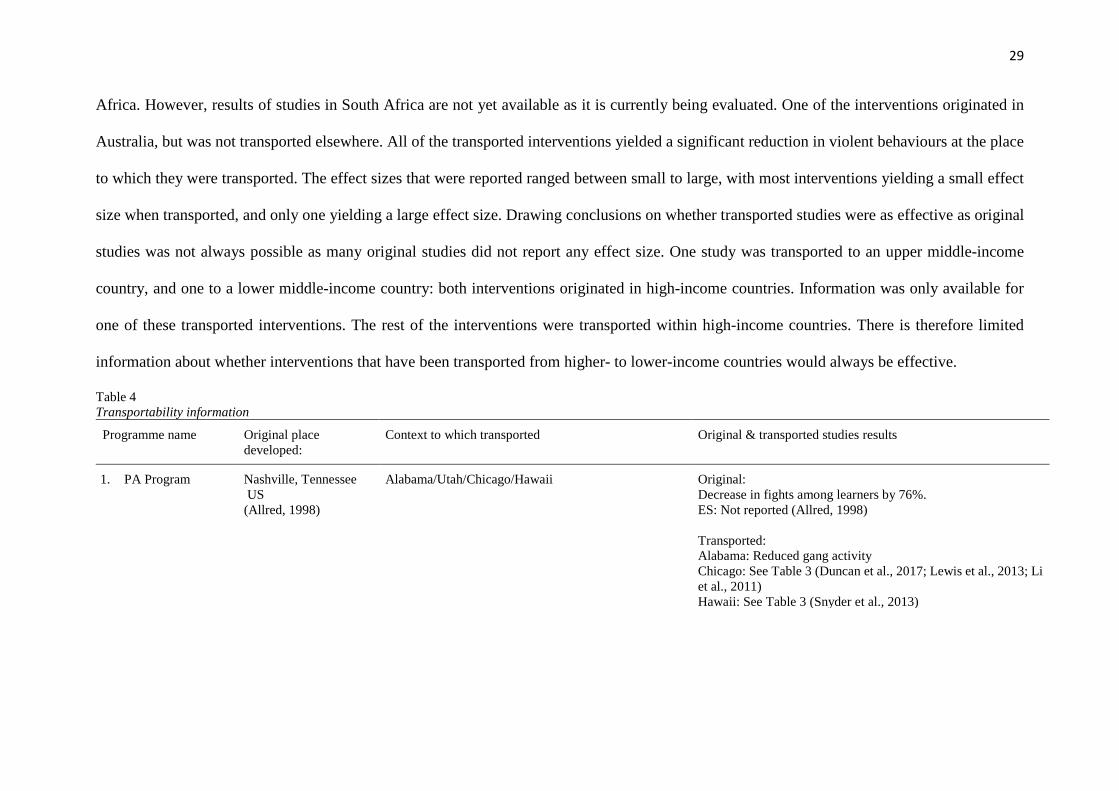
Of the 23 interventions, 11 of the interventions had been transported from one location
to another (see Table 4). These were initially tested in high-income countries. Of the 11
interventions, 10 were transported to high-income countries, and one to a lower middle-income
country. All the transported studies were effective.
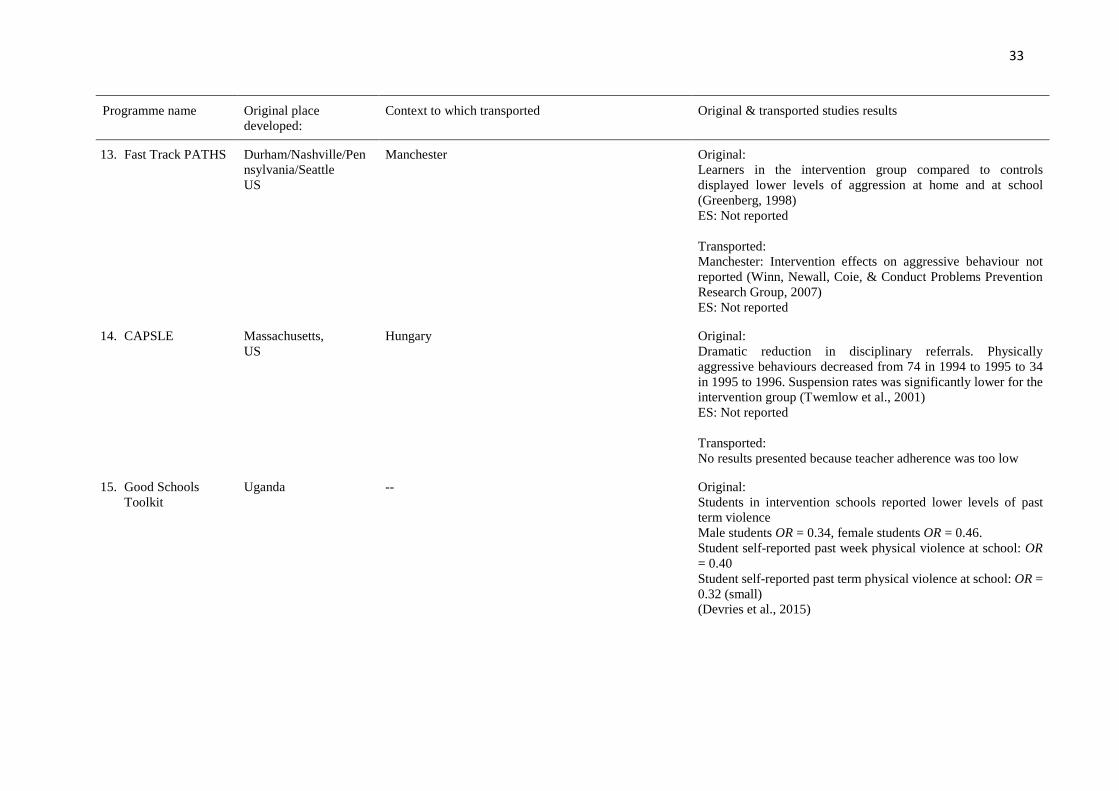
Only one intervention originated in Africa, the Good Schools Toolkit, which was
developed and tested in Uganda. This was the only intervention that originated in a low-income
country. However, no evidence was found that the Good Schools Toolkit has been transported
to any other context. We are therefore unable to conclude whether it would be effective in other
African or South African contexts.
The rest of the interventions originated in high-income countries, 17 of which were
from the US. Of those 10 were transported, seven were transported to other countries, while
the rest were transported within North American States, including the US and Canada. Only
one of the seven was transported to a lower middle-income country, Africa (Nigeria). This was
the Thinking Group. When initially implemented in the US, as the Brain Power programme,
the intervention significantly reduced aggression among boys. Similarly, when transported to
Africa, it resulted in a reduction in student self- and teacher-reported learner-on-learner
aggression, yielding a large effect size of 1.2 and 0.9 respectively. It should be noted that since
this intervention only targets boys, this review provides limited information about interventions
implemented in an African context targeting both genders.
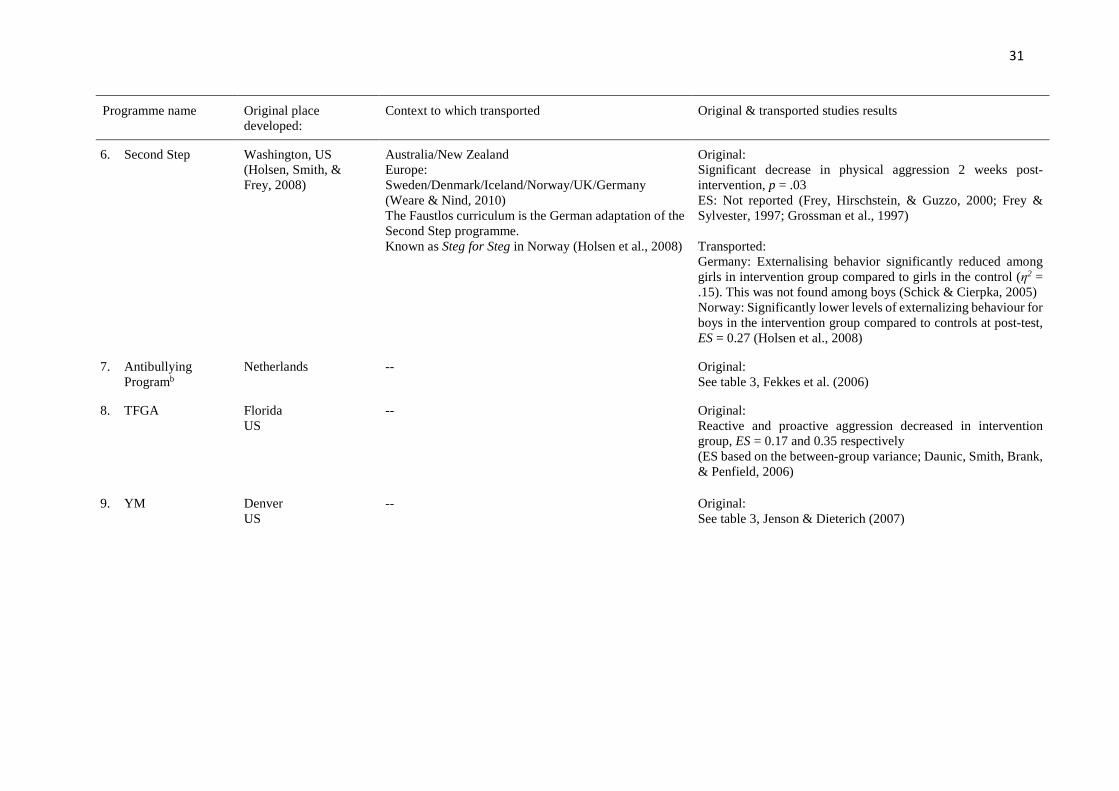
Three interventions originated in Europe (Finland and the Netherlands). Only one was
transported. This was KiVa, which has been transported to many contexts, including South
29
Africa. However, results of studies in South Africa are not yet available as it is currently being evaluated. One of the interventions originated in
Australia, but was not transported elsewhere. All of the transported interventions yielded a significant reduction in violent behaviours at the place
to which they were transported. The effect sizes that were reported ranged between small to large, with most interventions yielding a small effect
size when transported, and only one yielding a large effect size. Drawing conclusions on whether transported studies were as effective as original
studies was not always possible as many original studies did not report any effect size. One study was transported to an upper middle-income
country, and one to a lower middle-income country: both interventions originated in high-income countries. Information was only available for
one of these transported interventions. The rest of the interventions were transported within high-income countries. There is therefore limited
information about whether interventions that have been transported from higher- to lower-income countries would always be effective.
Table 4 Transportability information
Programme name Original place developed:
Context to which transported Original & transported studies results
1. PA Program Nashville, Tennessee US (Allred, 1998)
Alabama/Utah/Chicago/Hawaii Original: Decrease in fights among learners by 76%. ES: Not reported (Allred, 1998) Transported: Alabama: Reduced gang activity Chicago: See Table 3 (Duncan et al., 2017; Lewis et al., 2013; Li et al., 2011) Hawaii: See Table 3 (Snyder et al., 2013)
30
Programme name Original place developed:
Context to which transported Original & transported studies results
2. STR Seattle, Washington US (School of Social Work, 2017)
Pacific Northwest (Frey et al., 2005) Original: Not found Transported: A significant main effect for change in bullying was qualified by a near- significant interaction of group and pre-test occurrence, F (1, 541) = 3.20, p = .10. ES: Not reported
3. SNAP Toronto, Canada US
Florida/Georgia/Pennsylvania/UK/Germany/Norway (Child Development Institute, 2016)
Original: After 3 months, ES = 0.79, 6 months, ES = 0.93, 12 months ES = 0.56, 18 months, ES = 1.19 (Augimeri, Farrington, Koegl, & Day, 2007) Transported: No studies found
4. Shifting boundaries
New York US
--
Original: Personal experience of sexual victimization by another student was less for the intervention group compared to controls at 6-month follow-up, OR = .659, p = .011. Sexual violence perpetration was also significantly less at 6-month follow-up for intervention group compared to controls. (Taylor & Woods, 2011)
5. AAYP: SDC & SC intervention curriculum
Chicago US
--
Original: The rate in increase of violent behaviour among boys in the intervention groups was significantly less, 35% and 47% for SDC and SC, respectively, compared to the controls. The effects of the programme were not significant for girls. ES: The effect size for boys in the intervention groups (SDC and SC) ranged between 0.29 to 0.66, when compared to controls (ES was calculated by subtracting the between group growth and diving it by the pooled growth standard deviation; Flay, Graumlich, Segawa, Burns, & Holliday, 2004)
31
Programme name Original place developed:
Context to which transported Original & transported studies results
6. Second Step Washington, US (Holsen, Smith, & Frey, 2008)
Australia/New Zealand Europe: Sweden/Denmark/Iceland/Norway/UK/Germany (Weare & Nind, 2010) The Faustlos curriculum is the German adaptation of the Second Step programme. Known as Steg for Steg in Norway (Holsen et al., 2008)
Original: Significant decrease in physical aggression 2 weeks post-intervention, p = .03 ES: Not reported (Frey, Hirschstein, & Guzzo, 2000; Frey & Sylvester, 1997; Grossman et al., 1997) Transported: Germany: Externalising behavior significantly reduced among girls in intervention group compared to girls in the control (η2 = .15). This was not found among boys (Schick & Cierpka, 2005) Norway: Significantly lower levels of externalizing behaviour for boys in the intervention group compared to controls at post-test, ES = 0.27 (Holsen et al., 2008)
7. Antibullying Programb
Netherlands -- Original: See table 3, Fekkes et al. (2006)
8. TFGA Florida US
-- Original: Reactive and proactive aggression decreased in intervention group, ES = 0.17 and 0.35 respectively (ES based on the between-group variance; Daunic, Smith, Brank, & Penfield, 2006)
9. YM Denver US
-- Original: See table 3, Jenson & Dieterich (2007)
32
Programme name Original place developed:
Context to which transported Original & transported studies results
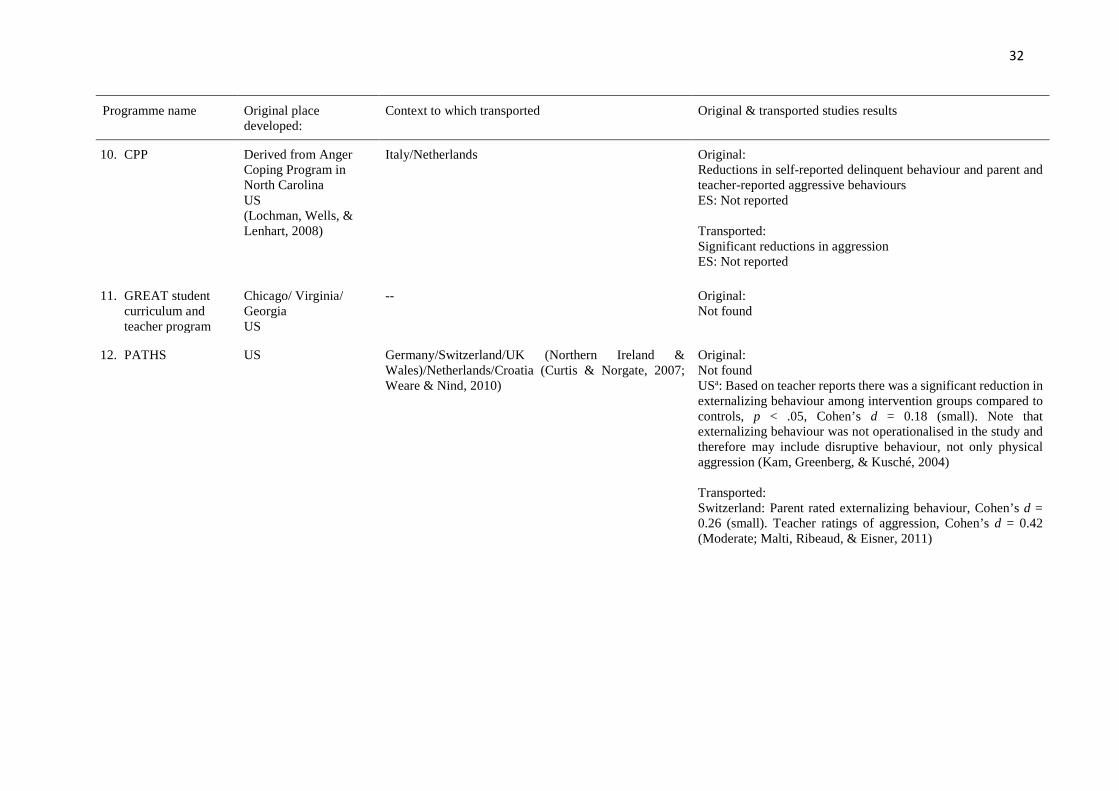
10. CPP
Derived from Anger Coping Program in North Carolina US (Lochman, Wells, & Lenhart, 2008)
Italy/Netherlands Original: Reductions in self-reported delinquent behaviour and parent and teacher-reported aggressive behaviours ES: Not reported Transported: Significant reductions in aggression ES: Not reported
11. GREAT student curriculum and teacher program
Chicago/ Virginia/ Georgia US
-- Original: Not found
12. PATHS
US Germany/Switzerland/UK (Northern Ireland & Wales)/Netherlands/Croatia (Curtis & Norgate, 2007; Weare & Nind, 2010)
Original: Not found USa: Based on teacher reports there was a significant reduction in externalizing behaviour among intervention groups compared to controls, p < .05, Cohen’s d = 0.18 (small). Note that externalizing behaviour was not operationalised in the study and therefore may include disruptive behaviour, not only physical aggression (Kam, Greenberg, & Kusché, 2004) Transported: Switzerland: Parent rated externalizing behaviour, Cohen’s d = 0.26 (small). Teacher ratings of aggression, Cohen’s d = 0.42 (Moderate; Malti, Ribeaud, & Eisner, 2011)
33
Programme name Original place developed:
Context to which transported Original & transported studies results
13. Fast Track PATHS Durham/Nashville/Pennsylvania/Seattle US
Manchester Original: Learners in the intervention group compared to controls displayed lower levels of aggression at home and at school (Greenberg, 1998) ES: Not reported Transported: Manchester: Intervention effects on aggressive behaviour not reported (Winn, Newall, Coie, & Conduct Problems Prevention Research Group, 2007) ES: Not reported
14. CAPSLE Massachusetts, US
Hungary Original: Dramatic reduction in disciplinary referrals. Physically aggressive behaviours decreased from 74 in 1994 to 1995 to 34 in 1995 to 1996. Suspension rates was significantly lower for the intervention group (Twemlow et al., 2001) ES: Not reported Transported: No results presented because teacher adherence was too low
15. Good Schools Toolkit
Uganda -- Original: Students in intervention schools reported lower levels of past term violence Male students OR = 0.34, female students OR = 0.46. Student self-reported past week physical violence at school: OR = 0.40 Student self-reported past term physical violence at school: OR = 0.32 (small) (Devries et al., 2015)
34
Programme name Original place developed:
Context to which transported Original & transported studies results
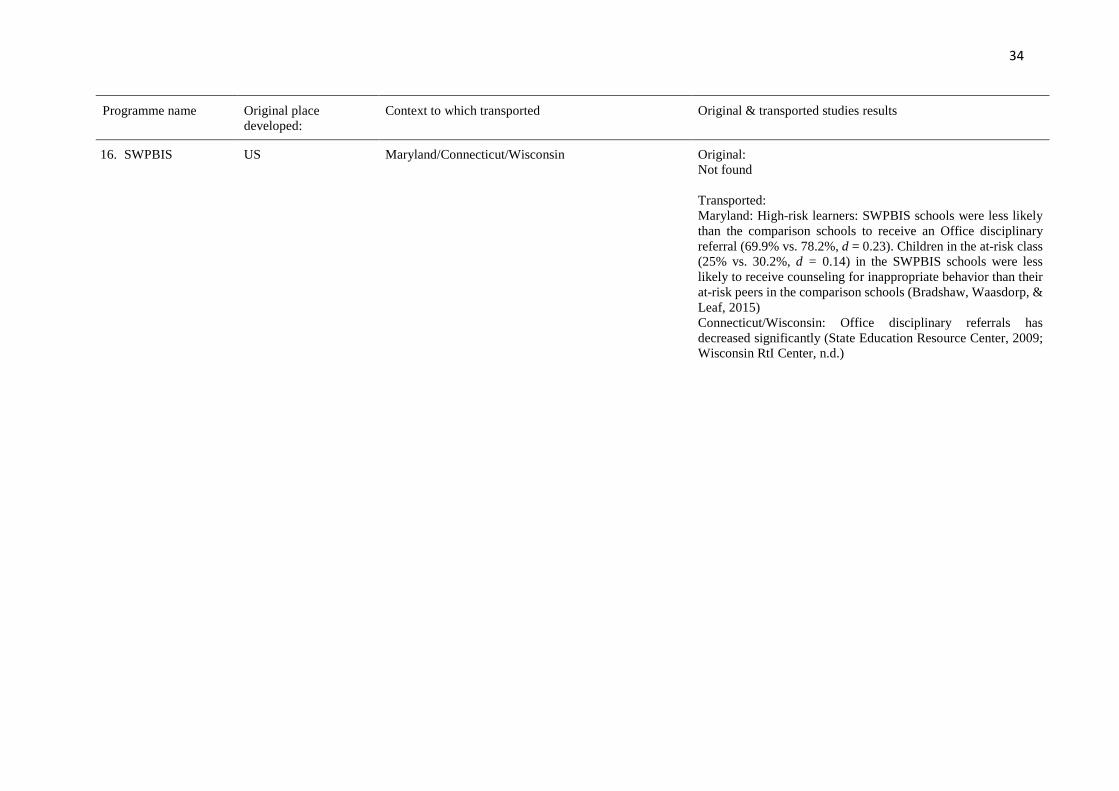
16. SWPBIS US Maryland/Connecticut/Wisconsin Original: Not found Transported: Maryland: High-risk learners: SWPBIS schools were less likely than the comparison schools to receive an Office disciplinary referral (69.9% vs. 78.2%, d = 0.23). Children in the at-risk class (25% vs. 30.2%, d = 0.14) in the SWPBIS schools were less likely to receive counseling for inappropriate behavior than their at-risk peers in the comparison schools (Bradshaw, Waasdorp, & Leaf, 2015) Connecticut/Wisconsin: Office disciplinary referrals has decreased significantly (State Education Resource Center, 2009; Wisconsin RtI Center, n.d.)
35
Programme name Original place developed:
Context to which transported Original & transported studies results
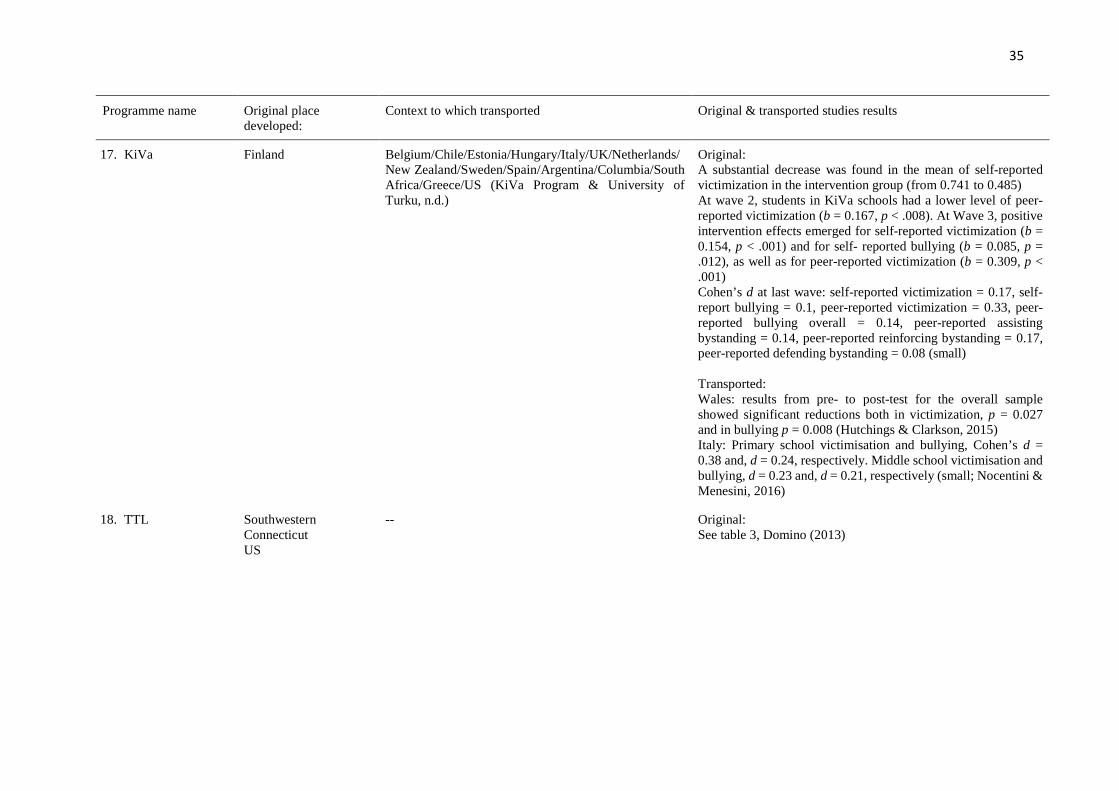
17. KiVa Finland Belgium/Chile/Estonia/Hungary/Italy/UK/Netherlands/New Zealand/Sweden/Spain/Argentina/Columbia/South Africa/Greece/US (KiVa Program & University of Turku, n.d.)
Original: A substantial decrease was found in the mean of self-reported victimization in the intervention group (from 0.741 to 0.485) At wave 2, students in KiVa schools had a lower level of peer-reported victimization (b = 0.167, p < .008). At Wave 3, positive intervention effects emerged for self-reported victimization (b = 0.154, p < .001) and for self- reported bullying (b = 0.085, p = .012), as well as for peer-reported victimization (b = 0.309, p < .001) Cohen’s d at last wave: self-reported victimization = 0.17, self-report bullying = 0.1, peer-reported victimization = 0.33, peer-reported bullying overall = 0.14, peer-reported assisting bystanding = 0.14, peer-reported reinforcing bystanding = 0.17, peer-reported defending bystanding = 0.08 (small) Transported: Wales: results from pre- to post-test for the overall sample showed significant reductions both in victimization, p = 0.027 and in bullying p = 0.008 (Hutchings & Clarkson, 2015) Italy: Primary school victimisation and bullying, Cohen’s d = 0.38 and, d = 0.24, respectively. Middle school victimisation and bullying, d = 0.23 and, d = 0.21, respectively (small; Nocentini & Menesini, 2016)
18. TTL Southwestern Connecticut US
-- Original: See table 3, Domino (2013)
36
Programme name Original place developed:
Context to which transported Original & transported studies results
19. Friendly Schools Friendly Families
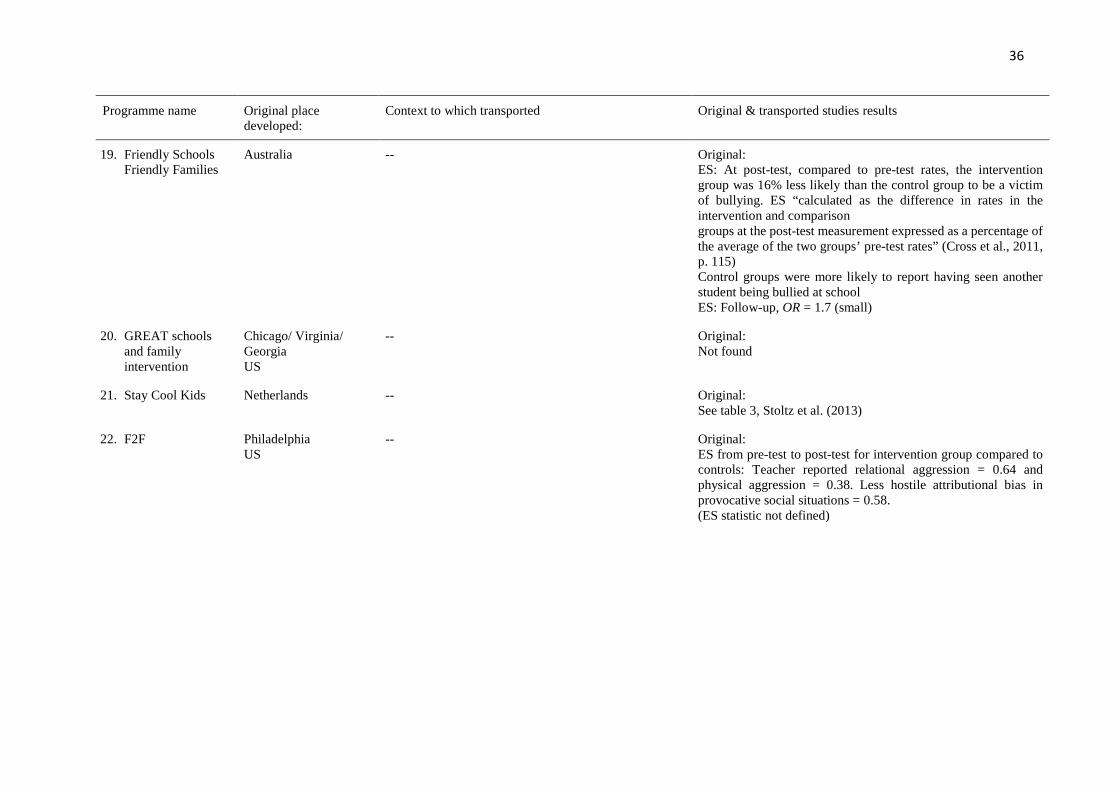
Australia -- Original: ES: At post-test, compared to pre-test rates, the intervention group was 16% less likely than the control group to be a victim of bullying. ES “calculated as the difference in rates in the intervention and comparison groups at the post-test measurement expressed as a percentage of the average of the two groups’ pre-test rates” (Cross et al., 2011, p. 115) Control groups were more likely to report having seen another student being bullied at school ES: Follow-up, OR = 1.7 (small)
20. GREAT schools and family intervention
Chicago/ Virginia/ Georgia US
-- Original: Not found
21. Stay Cool Kids Netherlands -- Original: See table 3, Stoltz et al. (2013)
22. F2F Philadelphia US
-- Original: ES from pre-test to post-test for intervention group compared to controls: Teacher reported relational aggression = 0.64 and physical aggression = 0.38. Less hostile attributional bias in provocative social situations = 0.58. (ES statistic not defined)

37
Programme name Original place developed:
Context to which transported Original & transported studies results
23. The Thinking Groupc
The thinking group is an adaptation of the Brain Power Program, also known as the Attributional Intervention, which originated in California US
Adapted for use in Nigeria Original (Brain Power Program): Not found Los Angelesa: Significantly less aggression in boys in intervention group compared to controls (Hudley & Graham, 1993). ES: Not reported Transported: For peer violence: Teacher rated aggression: Cohen’s d = 1.2 (large), self-rated aggression, Cohen’s d = 0.9 (large)
Note. -- = no evidence found of study having been transported; US = United States; OR = odds ratio; ES = Effect size. aStudy conducted in the same context as original study. bProgramme is not named in the paper but is referred to as the Antibullying School Program. cProgramme is not named in the paper but is referred to as the Thinking Group.
Discussion
Summary and integration of results
While almost all of the studies reviewed were conducted in high-income countries, they were mostly conducted in low-income SES
communities. Although South Africa is an upper middle-income country, rather than a high-income country, we cannot draw conclusions on
whether the interventions reviewed would yield similar results in South African primary schools, due to cultural differences in communities.
Programmes that have been culturally adapted have been shown to benefit the population for which it has been revised for (Parra-Cardona et al.,
2017). The KiVa intervention has been implemented in South Africa, however, no results on its effectiveness is available yet (see Table 4). Further
research is needed on interventions based in upper middle-income countries in contexts similar to South Africa’s.
38
Research on SEL including school children has shown that possessing social and
emotional abilities is related to remarkable developments in interpersonal relationships,
behavioural difficulties, social skills, emotional discomfort, aggression and substance abuse
(Domino, 2013). SEL provides a basis for better adaptation and academic outcomes seen in
more positive relationships with peers, fewer behavioural problems, decreased emotional
distress and greater academic performance (Durlak et al., 2011). Considering this, good
programmes will no doubt include SEL topics as a key area.
According to Nation et al. (2003) there are nine characteristics related to effective
prevention programmes. These include: comprehensiveness, varied methods of teaching,
adequate intervention dosage, being theory driven, promoting positive relationships, timing of
intervention, sociocultural relevance, outcome evaluation, and well-trained staff (Nation et al.,
2003). In terms of comprehensiveness, half of the interventions that yielded main effects
adopted a whole-school approach. Secondly, the use of varied methods of teaching was evident
in many interventions as they involved both teaching learners and active learner participation.
This allows children to learn specific skills through interactive role-play and apply them in real
world settings (Nation et al., 2003). Thirdly, sufficient dosage of the intervention is needed to
ensure that the intervention can have an effect. The intensity, duration and number of sessions
varied among interventions. A clear distinction between dosage and effectiveness was thus not
evident. Fourth, all the interventions reviewed were developed and based on theory that has
been empirically tested in previous studies (Nation et al., 2003). Fifth, interventions that
promote positive relationships between children and influential networks in their lives allow
for positive programme results (Nation et al., 2003). This further supports the notion that
whole-school approaches are important, however this review found equal success in studies
adopting whole-school and discrete approaches (Durlak et al., 2011; Stoltz, 2012). In terms of
timing, all interventions were implemented in primary schools, grades one to seven. This
39
timing for intervention is suitable for the developmental requirements of this target population.
Interventions are more effective if they are implemented at an earlier age (Dymnicki et al.,
2011; Nation et al., 2003). Programmes that are relevant to the norms of the community and
culture of the target population are also more effective (Nation et al., 2003). However, we
found that studies transported to other contexts with different cultures were also effective. In
terms of outcome evaluation, all the interventions reviewed were clearly aimed at reducing
learner-on-learner violence and studies assessing their effectiveness documented outcomes in
relation to this aim. Lastly, the competency of the intervention staff plays a vital role in the
success of a programme (Nation et al., 2003). All implementers received some form of training
on the program prior to implementation. According to Stoltz et al. (2013), effective
interventions are implemented by trained intervention staff rather than teachers. However,
results from this review yielded different findings. Although they were near-equal, among
interventions yielding main effects, those implemented by teachers were more than those
delivered by trained intervention staff.
Three of the interventions had been implemented in the African context. Results were
available for only two of them, and of those, one targeted only boys. KiVa, transported to South
Africa, has not yet been studied. There is therefore limited information regarding the
effectiveness of interventions in the African context, especially South Africa.
Duplicating interventions strengthens the programme and its effects by showing that it
can be implemented in other contexts (Mihalic, Irwin, Elliott, Fagan, & Hansen, 2004).
Interventions that have shown success in other settings produce greater assurance that they can
be transported (Mihalic et al., 2004). As only a few of the studies in this review were duplicated,
and even fewer were transported, the effectiveness of the transportability of the included
studies are unclear. Since we based effectiveness and transportability on effect size, there was
some difficulty experienced. This is because some studies failed to report which effect statistic
40
was used. Additionally, different violence measurements and effect size statistics are used
across studies. Confidence intervals also varied, which results in studies reporting significance
differently. Therefore, a true comparison of the results between the studies and their contexts
could not be made.
Implications
The studies in this review support the notion of early interventions being effective as
long-term results show a reduction in the likelihood of violent behaviour among students who
have been exposed to early violence prevention interventions (Yerger & Gehret, 2011). RCTs
with longer follow-up periods are needed to identify which interventions have long-term
effects. More studies that have high methodological quality are needed to understand how
effective interventions work to reduce or prevent violence.
A bias in the literature is that research conducted on the effectiveness of violence
prevention interventions was nearly entirely conducted in high-income countries,
predominantly in the US. As school violence is a major problem globally this is problematic
(see, for instance; Burton, 2008c; Ez-Elarab et al., 2007; Yerger & Gehret, 2011). Although
many of the effect sizes reported in the studies were small, all the included interventions were
effective, indicating a possible reporting bias.
Dymnicki et al. (2011) suggest that whether interventions are effective in various
settings depends on mediating factors, namely social-cognitive functions, skill acquisition and
classroom features; and that, if these are targeted, they can reduce negative behaviours. Of the
18 interventions reporting main effects, three addressed social-cognitive functions, 13 skill
acquisition, and three classroom features. None targeted all three.
Further moderating factors includes the PROGRESS characteristics. Gender and
ethnicity can be moderating factors on the effects of interventions (Stoltz, 2012). Since there
are differences in the prevalence and manifestation of aggression between boys and girls, their
41
responsiveness to interventions may differ (Stoltz, 2012). Different ethnic backgrounds results
in different: parental practices, cultural beliefs, traditions, and experiences of discrimination.
The PROGRESS categories were included in this review to assess the impact of these
moderating variables, but were not explicitly explored as moderators in most of the studies.
Intervention developers and implementers should therefore be mindful of these factors when
deciding on which type of intervention would work best for a specific population.
Although most of the interventions originated in, and were transported to, higher
income countries, there is a lacuna in the literature regarding studies that have been
implemented in lower-income regions. Furthermore, although most of the studies were
conducted among low socioeconomic communities in high-income countries, these settings
cannot be equated to the low-income communities in South Africa. This is because, although
South Africa is regarded as an upper middle-income country (The World Bank Group, 2017),
that categorisation is not representative of the entire country. In the 2011 census conducted in
South Africa, the percentage of households in the upper-income bracket was only 7.3% of the
population, whereas the low- and middle income was 29% and 48.3%, respectively (Statistics
South Africa, 2015). Although this value is small, the wealth of this percentage of households
is what makes South Africa an upper middle-income country. This stresses the divide between
the rich and the poor as the majority of the population of the country is in the low- to middle-
income bracket (Statistics South Africa, 2015). When examining the distribution across
provinces, KwaZulu-Natal and Gauteng had the highest percentage of low-income households
(Monson, Hall, Smith, & Shung-King, 2006; Statistics South Africa, 2015). Gauteng also had
the highest percentage of households in the middle- and upper-income bracket. Children are
particularly vulnerable to the burden of poverty and violence (Hall, Woolard, Lake, & Smith,
2012). Their well-being is associated to the income inequality level of a country and to the
proportion of children living in poverty (Hall et al., 2012). South Africa has extreme levels of
42
poverty and to address this issue, both poverty and the divide between the rich and the poor
needs to be addressed (Hall et al., 2012). In 2010, just fewer than 60% of children were living
in households below the lower-bound poverty line (R575 per month; Hall et al., 2012). Over
half of these children are of the African race contrasting starkly to white children (Hall et al.,
2012). The apartheid legacy is one of the main reasons for this contrast which demonstrates
that it continues to have adverse effects on children’s lives (Monson et al., 2006).
As this is the case, interventions from low-income contexts may work very well in the
upper middle-income context of South Africa – but there is almost no evidence for this
assertion yet, as it is not the usual direction of transportation. The Good Schools Toolkit is yet
to be evaluated in South Africa. Studies of interventions in low-income contexts in the global
South are urgently needed, to extend the literature in this area.
Limitations
There are a couple of limitations to this systematic review. Firstly, we included only
RCTs, peer-reviewed studies reported in English and no grey literature was included. Due to
these strict inclusion criteria, our results on effectiveness of interventions do not reflect the
findings of other studies on the topic published in other languages and using different study
designs. Secondly, since the aim of this review was to assess whether interventions would be
effective in the South African context, data on cost-effectiveness of interventions should have
been extracted. This is a limitation of the field too, as more research is needed on this.
Future directions
Despite these limitations, there is clear evidence of violence prevention interventions
being successful in primary schools. A handful of effective interventions to prevent violence
between learners could be identified. Universal and selective approaches, as well as SEL
programmes have shown to effectively reduce learner-on-learner violence, albeit mainly in
high-income countries. Future programmes should analyse moderator effects, as from this
43
review, high-risk learners have shown to benefit from the interventions more than low-risk
learners. Additionally, future studies should develop standardised agreed upon measures for
violence in order for outcomes to be more comparable.
The existing literature provides information on prevention interventions and guidelines,
but not cultural adaptations and other factors needed to be considered for transportability to
other contexts. While research in upper middle-income countries such as South Africa needs
to be conducted, the existing literature does offer us a good variety of ways to consider for
addressing the problem of violence between primary school learners.
44
References
Abdulmalik, J., Ani, C., Ajuwon, A. J., & Omigbodun, O. (2016). Effects of problem-solving
interventions on aggressive behaviours among primary school pupils in Ibadan,
Nigeria. Child and Adolescent Psychiatry and Mental Health, 10(31), 1-10. doi:
10.1186/s13034-016-0116-5
Allred, C. G. (1998). The Positive Action [R] model for comprehensive school reform: An
agent for whole-school change and parent & community involvement.
Augimeri, L. K., Farrington, D. P., Koegl, C. J., & Day, D. M. (2007). The SNAP under 12
outreach project: Effects of a community based program for children with conduct
problems. Journal of Child and Family Studies, 16(6), 799-807. doi: 10.1007/s10826-
006-9126-x
Averdijk, M., Zirk-Sadowski, J., Ribeaud, D., & Eisner, M. (2016). Long-term effects of two
childhood psychosocial interventions on adolescent delinquency, substance use, and
antisocial behaviour: A cluster randomized trial. Journal of Experimental
Criminology, 12(1), 21-47. doi: 10.1007/s11292-015-9249-4
Beets, M. W., Flay, B. R., Vuchinich, S., Snyder, F. J., Acock, A., Li, K. K., ... & Durlak, J.
(2009). Use of a social and character development program to prevent substance use,
violent behaviors, and sexual activity among elementary-school students in
Hawaii. American journal of public health, 99(8), 1438-1445. doi:
10.2105/ajph.2008.142919
Bierman, K. L., Coie, J. D., Dodge, K. A., Greenberg, M. T., Lochman, J. E., McMahon, R.
J., & Pinderhughes, E. (2010). The effects of a multiyear universal social–emotional
learning program: The role of student and school characteristics. Journal of
Consulting and Clinical Psychology, 78, 156-168. doi: 10.1037/a0018607

45
Blueprints. (2017). Promoting Alternative Thinking Strategies (PATHS). Retrieved from
http://www.blueprintsprograms.com/factsheet/promoting-alternative-thinking-
strategies-paths
Bradshaw, C. P., Waasdorp, T. E., & Leaf, P. J. (2012). Effects of School-Wide Positive
Behavioral Interventions and Supports on child behavior problems. Pediatrics,
130(5), 1136-1145. doi: 10.1542/peds.2012-0243
Bradshaw, C. P., Waasdorp, T. E., & Leaf, P. J. (2015). Examining variation in the impact of
School-Wide Positive Behavioral Interventions and Supports: Findings from a
randomized controlled effectiveness trial. Journal of Educational Psychology, 107(2),
546-547. doi: 10.1037/a0037630
Brown, E. C., Low, S., Smith, B. H., & Haggerty, K. P. (2011). Outcomes from a school-
randomized controlled trial of Steps to Respect: A bullying prevention program.
School Psychology Review, 40(3), 423-443.
Burke, J. D., & Loeber, R. (2016). Mechanisms of behavioural and affective treatment
outcomes in a cognitive behvaioral intervention for boys. Journal of Abnormal Child
Psychology, 44(1), 179-189. doi: 10.1007/s10802-015-9975-0
Burton, P. (2008a). Dealing with school violence in South Africa. Centre for Justice and
Crime Prevention (CJCP), 4, 1-16.
Burton, P. (2008b). Snapshot results of the CJCP national schools violence study. Centre for
Justice and Crime Prevention Research Bulletin, 2.
Burton, P. (2008c). Merchants, skollies and stones. Experiences of school violence in South
Africa. Centre for Justice and Crime Prevention. Monograph Series, (4).
Burton, P., Leoschut, L., & Popovac, M. (2011). Protecting the Flame: Overcoming Violence
46
as a Barrier to Education in Namibia. Retrieved from
http://www.cjcp.org.za/uploads/2/7/8/4/27845461/monograph_8_-
_protecting_the_flame_namibia.pdf
Child Development Institute. (n.d.). SNAP Boys. Retrieved from
https://www.childdevelop.ca/programs/snap/snap-programs
Child Development Institute. (2016). SNAP Affiliate Locations. Retrieved from
https://childdevelop.ca/snap/about-snap
Child Trends. (2012). Aban Aya Youth Project. Retrieved from
https://www.childtrends.org/programs/aban-aya-youth-project/
Child Trends. (2014). Creating a Peaceful School Learning Environment (CAPSLE).
Retrieved from https://www.childtrends.org/programs/capsle
Child Trends. (2015). Shifting Boundaries. Retrieved from
https://www.childtrends.org/programs/shifting-boundaries/
Cochrane Consumer Network. (n.d.). Retrieved May 19, 2017, from:
http://consumers.cochrane.org/levels-evidence
Coping Power. (2006). Target Population. Retrieved from
http://www.copingpower.com/TargetAudience.aspx
Crean, H. F., & Johnson, D. B. (2013). Promoting Alternative Thinking Strategies (PATHS)
and elementary school aged children's aggression: Results from a cluster randomized
trial. American Journal of Community Psychology, 52(1-2), 56-72. doi:
10.1007/s10464-013-9576-4
CrimeSolutions.gov. (2012). Program profile: Shifting Boundaries. Retrieved from
https://www.crimesolutions.gov/ProgramDetails.aspx?ID=385
Cross, D., Monks, H., Hall, M., Shaw, T., Pintabona, Y., Erceg, E., ... & Lester, L. (2011).
Three‐year results of the Friendly Schools whole‐of‐school intervention on children's
47
bullying behaviour. British Educational Research Journal, 37(1), 105-129. doi:
10.1080/01411920903420024
Cross, D., Waters, S., Pearce, N., Shaw, T., Hall, M., Erceg, E., ... & Hamilton, G. (2012).
The Friendly Schools Friendly Families programme: Three-year bullying behaviour
outcomes in primary school children. International Journal of Educational
Research, 53, 394-406. doi: 10.1016/j.ijer.2012.05.004
Curtis, C., & Norgate, R. (2007). An Evaluation of the Promoting Alternative Thinking
Strategies Curriculum at Key Stage 1. Educational Psychology in Practice, 23(1),
33-44. doi: 10.1080/02667360601154717
Daunic, A. P., Smith, S. W., Brank, E. M., & Penfield, R. D. (2006). Classroom-based
cognitive–behavioral intervention to prevent aggression: Efficacy and social
validity. Journal of School psychology, 44(2), 123-139. doi:
10.1016/j.jsp.2006.01.005
Daunic, A. P., Smith, S. W., Garvan, C. W., Barber, B. R., Becker, M. K., Peters, C. D., ... &
Naranjo, A. H. (2012). Reducing developmental risk for emotional/behavioral
problems: A randomized controlled trial examining the Tools for Getting Along
curriculum. Journal of school psychology, 50(2), 149-166
Devries, K. M., Knight, L., Allen, E., Parkes, J., Kyegombe, N., & Naker, D. (2017). Does
the Good Schools Toolkit reduce physical, sexual and emotional violence, and
injuries, in girls and boys equally? A cluster-randomised controlled trial. Prevention
Science, 18(7), 839-853. doi: 10.1007/s11121-017-0775-3
Devries, K. M., Knight, L., Child, J. C., Mirembe, A., Nakuti, J., Jones, R., … Naker, D.
(2015). The Good School Toolkit for reducing physical violence from school staff to
primary school students: a cluster-randomised controlled trial in Uganda. The Lancet
Global Health, 3(7), e378–e386. doi:10.1016/s2214-109x(15)00060-1
48
De Wet, C. (2003). Eastern Cape educators' perceptions of the causes and the scope of school
violence. Acta Criminologica, 16, 89-106.
Domino, M. (2013). Measuring the impact of an alternative approach to school bullying.
Journal of School Health, 83(6), 430-437. doi: 10.1111/josh.12047
Domitrovich, C., Durlak, J., Goren, P., & Weissberg, R. (2013). Effective social and
emotional learning programs: Preschool and elementary school edition. 2013
CASEL Guide.
Downs, S. H., & Black, N. (1998). The feasibility of creating a checklist for the assessment
of the methodological quality both of randomised and non-randomised studies of
health care interventions. Journal of epidemiology and community health, 52(6), 377-
384.
Duncan, R., Washburn, I. J., Lewis, K. M., Bavarian, N., DuBois, D. L., Acock, A. C., ... &
Flay, B. R. (2017). Can universal SEL programs benefit universally? Effects of the
positive action program on multiple trajectories of social-emotional and misconduct
behaviors. Prevention science, 18(2), 214-224. doi:10.1007/s11121-016-0745-1
Durlak, J. A. (2009). How to Select, Calculate, and Interpret Effect Sizes. Journal of
Pediatric Psychology, 34(9), 917–928. doi:10.1093/jpepsy/jsp004
Durlak, J. A., Weissberg, R. P., Dymnicki, A. B., Taylor, R. D., & Schellinger, K. B. (2011).
The impact of enhancing students’ social and emotional learning: A meta-analysis of
school-based universal interventions. Child Development, 82(1), 405-432. doi:
10.1111/j.1467-8624.2010.01564.x
Dymnicki, A. B., Weissberg, R. P., & Henry, D. B. (2011). Understanding how programs
work to prevent overt aggressive behaviors: A meta-analysis of mediators of
elementary school–based programs. Journal of School Violence, 10(4), 315-337. doi:
10.1080/15388220.2011.602599
49
Eisenbraun, K. D. (2007). Violence in schools: Prevalence, prediction, and prevention.
Aggression and Violent Behavior, 12(4), 459-469. doi:10.1016/j.avb.2006.09.008
Espelage, D. L., Low, S., Polanin, J. R., & Brown, E. C. (2013). The Impact of a Middle
School Program to Reduce Aggression, Victimization, and Sexual Violence. Journal
of Adolescent Health, 53, 180-186. doi: 10.1016/j.jadohealth.2013.02.021
Espelage, D. L., Low, S., Polanin, J. R., & Brown, E. C. (2015). Clinical trial of Second
Step© middle-school program: Impact on aggression & victimization. Journal of
Applied Developmental Psychology, 37, 52-63. doi: 10.1016/j.appdev.2014.11.007
Espelage, D. L., Low, S., Van Ryzin, M. J., & Polanin, J. R. (2015). Clinical trial of Second
Step middle school program: Impact on bullying, cyberbullying, homophobic teasing,
and sexual harassment perpetration. School Psychology Review, 44(4), 464-479.
doi:10.17105/spr-15-0052.1
Espelage, D. L., Rose, C. A., & Polanin, J. R. (2015). Social-emotional learning program to
reduce bullying, fighting, and victimization among middle school students with
disabilities. Remedial and special education, 36(5), 299-311. doi:
10.1177/0741932514564564
Ez-Elarab, H. S., Sabbour, S. M., Gadallah, M. A., & Asaad, T. A. (2007). Prevalence and
risk factors of violence among elementary school children in Cairo. Journal of
Egyptian Public Health Association, 82(1-2), 127-146.
Fekkes, M., Pijpers, F. I. M., Verloove-Vanhorick, S. P. (2006). Effects of antibullying
school program on bullying and health complaints. Archives of Pediatrics and
Adolescent Medicine, 160(6), 638-644. doi: 10.1001/archpedi.160.6.638
Flay, B. R., Graumlich, S., Segawa, E., Burns, J. L., & Holliday, M. Y. (2004). Effects of 2
prevention programs on high-risk behaviors among African American youth: A
50
randomized trial. Archives of pediatrics & adolescent medicine, 158(4), 377-384. doi:
10.1001/archpedi.158.4.377
Fonagy, P., Twemlow, S. W., Vernberg, E. M., Nelson, J. M., Dill, E. J., Little, T. D., &
Sargent, J. A. (2009). A cluster randomized controlled trial of child-focused
psychiatric consultation and a school systems-focused intervention to reduce
aggression. Journal of Child Psychology and Psychiatry, 50(5), 607-616. doi:
10.1111/j.1469-7610.2008.02025.x
Frey, K. S., Hirschstein, M. K., & Guzzo, B. A. (2000). Second Step: Preventing aggression
by promoting social competence. Journal of Emotional and Behavioral
Disorders, 8(2), 102-112. doi: 10.1177/106342660000800206
Frey, K. S., Hirschstein, M. K., Snell, J. L., Van Schoiack Edstrom, L., MacKenzie, E. P., &
Broderick, C. J. (2005). Reducing playground bullying and supporting beliefs: An
experimental trial of the Steps to Respect program. Developmetnal Psychology, 41(3),
479-491. doi: 10.1037/0012-1649.41.3.479
Frey, K. S., & Sylvester, L. (1997). Research on the Second Step Program: Do student
behaviors and attitudes improve? What do teachers think about the program?
Gavine, A. J., Donnelly, P. D., & Williams, D. J. (2016). Effectiveness of universal school-
based programs for prevention of violence in adolescents. Psychology of Violence,
6(3), 390-399. doi: 10.1037/vio0000052
Gevers, A., & Flisher, A. J. (2012). School-based youth violence prevention interventions. In
C. L. Ward, A. van der Merwe, & A. Dawes (Eds.), Youth violence: Sources and
solutions in South Africa (pp. 176-212). Cape Town: UCT Press.
Greenberg, M. T. (1998). Testing developmental theory of antisocial behavior with outcomes
from the Fast Track Prevention Project. American Psychological Association,
Chicago, IL.
51
Grossman, D. C., Neckerman, H. J., Koepsell, T. D., Liu, P. Y., Asher, K. N., Beland, K., ...
& Rivara, F. P. (1997). Effectiveness of a violence prevention curriculum among
children in elementary school: A randomized controlled trial. Jama, 277(20), 1605-
1611.
Hall, K., Woolard, I., Lake, L., & Smith, C. (Eds.). (2012). Child Gauge 2012. Cape Town:
Children’s Institute, University of Cape Town.
Henry, D. B. (2012). Mediators of effects of a selective family-focused violence prevention
approach for middle school students. Prevention Science, 13(1), 1-14. doi:
10.1007/s11121-011-0245-2
Holsen, I., Smith, B. H., & Frey, K. S. (2008). Outcomes of the social competence program
Second Step in Norwegian elementary schools. School Psychology
International, 29(1), 71-88. doi: 10.1177/0143034307088504
Hudley, C., & Graham, S. (1993). An attributional intervention to reduce peer-directed
aggression among African-America boys. Child Development, 64, 124-138. doi:
10.2307/1131441
Hutchings, J., & Clarkson, S. (2015). Introducing and piloting the KiVa bullying prevention
programme in the UK. Educational & Child Psychology, 32(1), 49-61.
Jagers, R. J., Morgan-Lopez, A. A., Flay, B. R., & Aban Aya Investigators. (2009). The
impact of age and type of intervention on youth violent behaviors. The journal of
primary prevention, 30(6), 642-658. 642–658. doi:10.1007/s10935-009-0200-1
Jenson, J. M., & Dieterich, A. (2007). Effects of a Skills-based Prevention Program on
Bullying and Bully Victimization among Elementary School Children. Prev Sci, 8,
285-296. doi: 10.1007/s11121-007-0076-3
52
Jenson, J. M., Dieterich, W. A., Brisson, D., Bender, K. A., & Powell, A. (2010). Preventing
childhood bullying: Findings and lessons from the Denver public schools trial.
Research on Social Work Practice, 20, 509-517. doi: 10.1177/1049731509359186
Johnson, S. L. (2009). Improving the school environment to reduce school violence: A
review of the literature. Journal of School Health, 79(10), 451-465.
doi:10.1111/j.1746-1561.2009.00435.x
Kam, C. M., Greenberg, M. T., & Kusché, C. A. (2004). Sustained effects of the PATHS
curriculum on the social and psychological adjustment of children in special
education. Journal of emotional and behavioral disorders, 12(2), 66-78. doi:
10.1177/10634266040120020101
Kärnä, A., Voeten, M., Little, T. D., Alanen, E., Poskiparta, E., & Salmivalli, C. (2013).
Effectiveness of the KiVa Antibullying Program: Grades 1–3 and 7–9. Journal of
Educational Psychology, 105(2), 535-551. doi: 10.1037/a0030417
KiVa Program & University of Turku. (n.d.). KiVa globally. Retrieved from
http://www.kivaprogram.net/around-the-world
KiVa Program & University of Turku. (n.d.). Welcome to KiVa school!. Retrieved from
http://www.kivaprogram.net/program
Krug, E. G., Dahlberg, L. L., Mercy, J. A., & Zwi, A. B., & Lozano, R. (Eds.). (2002). World
report on violence and health. Geneva: World Health Organization.
Leff, S. S., Paskewich, B. S., Waasdorp, T. E., Waanders, C., Bevans, K. B., & Jawad, A. F.
(2015). Friend to Friend: A randomized trial for urban African American relationally
aggressive girls. Psychology of Violence, 5(4), 433-443. doi: 10.1037/a0039724
Leoschut, L. (2008). School violence: What makes learners vulnerable?. CJCP, 7.
Lester, S., Lawrence, C., & Ward, C. L. (2017) What do we know about preventing school
53
violence? A systematic review of systematic reviews. Psychology, Health &
Medicine, 1-37. doi: 10.1080/13548506.2017.1282616
Lewis, K. M., Schure, M. B., Bavarian, N., DuBois, D. L., Day, J., Ji, P., ... & Flay, B. R.
(2013). Problem behavior and urban, low-income youth: A randomized controlled t
rial of Positive Action in Chicago. American journal of preventive medicine, 44(6),
622-630.
Li, K., Washburn, I., DuBois, D. L., Vuchinich, P. J., Brechling, V., Day, J., … Flay, B. R.
(2011) Effects of the Positive Action programme on problem behaviours in
elementary schools tudents: A matched-pair randomised control trial in Chicago.
Psychology and Health, 26(2), 187-204. doi: 10.1080/08870446.2011.531574
Liang, H., Flisher, A. J., & Lombard, C. J. (2007). Bullying, violence, and risk behavior in
South African school students. Child Abuse & Neglect, 31(2), 161-171.
doi:10.1016/j.chiabu.2006.08.007
Lochman, J. E., Wells, K. C., & Lenhart, L. A. (2008). Coping Power: Child group
facilitator’s guide. Oxford University Press.
Low, S., Van Ryzin, M. J., Brown, E. C., Smith, B. H., & Haggerty, K. P. (2013).
Engagement matters: Lessons form assessing classroom implementation of Steps to
Respect: A Bullying Prevention Program over a one-year period. Prevention Science,
15, 165-176. doi: 10.1007/s11121-012-0359-1
Makota, G., & Leoschut, L. (2016). The National School Safety Framework: A framework
for preventing violence in South African schools. African Safety Promotion, 14, 18-
23.
Malti, T., Ribeaud, D., & Eisner, M. P. (2011). The effectiveness of two universal preventive
interventions in reducing children's externalizing behavior: a cluster randomized
54
controlled trial. Journal of Clinical Child & Adolescent Psychology, 40(5), 677-692.
doi: 10.1080/15374416.2011.597084
Menesini, E., & Salmivalli, C. (2017). Bullying in schools: the state of knowledge and
effective interventions. Psychology, Health & Medicine, 22, 240-253.
doi:10.1080/13548506.2017.1279740
Mihalic, S., Irwin, K., Elliott, D., Fagan, A., & Hansen, D. (2004). Blueprints for violence
prevention. In Center for the Study and Prevention of Violence, University of
Colorado. National Scientific Council on the Developing Child.
Moher, D., Liberati, A., Tetzlaff, J., Altman, D. G., & The Prisma Group. (2009). Preferred
reporting items for systematic reviews and meta-analyses: the PRISMA statement.
PLoS med, 6(7). doi: 10.1371/journal.pmed1000097
Monson, J., Hall, K., Smith, C., & Shung-King, M. (Eds.). (2006). Child Gauge 2006. Cape
Town: Children’s Institute, University of Cape Town.
Mrazek, P. J., & Haggerty, R. J. (Eds.). (1994). Reducing Risks for Mental Disorders:
Frontiers for Preventive Intervention Research. Washington, D.C.: National
Academies Press.
Muratori, P., Bertacchi, I., Giuli, C., Lombardi, L., Bonetti, S., Nocentini, A., … Lochman, J.
E. (2014). First adaptation of Coping Power Program as a classroom-based prevention
intervention on aggressive behaviors among elementary school children. Prevention
Science, 16, 432-439. doi: 10.1007/s11121-014-0501-3
Nation, M., Crusto, C., Wandersman, A., Kumpfer, K. L., Seybolt, D., Morrissey-Kane, E., &
Davino, K. (2003). What works in prevention: Principles of effective prevention
programs. American Psychologist, 58(6-7), 449-456. doi: 10.1037/0003-066X.58.6-
7.449
National Collaborating Centre for Methods and Tools (2015). PROGRESS Framework:
55
Applying an equity lens to interventions. Hamilton, ON: McMaster University.
Retrieved May 23, 2017, from: http://www.nccmt.ca/resources/search/234
Nocentini, A., & Menesini, E. (2016). KiVa Anti-Bullying Program in Italy: Evidence of
effectiveness in a randomized control trial. Prevention Science, 17, 1012-1023. doi:
10.1007/s11121-016-0690-z
Olweus, D. (1997). Bully/victim problems in school: Facts and intervention. European
Journal of Psychology of Education, 12(4), 495-510. doi:10.1007/bf03172807
Olweus, D., & Limber, S. P. (2010). Bullying in school: evaluation and dissemination of the
Olweus Bullying Prevention Program. American Journal of Orthopsychiatry, 80(1),
124-134. doi: 10.1111/j.1939-0025.2010.01015.x
Parra-Cardona, J. R., Bybee, D., Sullivan, C. M., Rodríguez, M. M. D., Tams, L., & Bernal,
G. (2017). Examining the impact of differential cultural adaptation with Latina/o
immigrants exposed to adapted parent training interventions. Journal of consulting
and clinical psychology, 85(1), 58-71. doi: 10.1037/ccp0000160
Piotrowski, D., & Hoot, J. (2008). Bullying and violence in schools: What teachers should
know and do. Childhood Education, 84(6), 357-363.
doi:10.1080/00094056.2008.10523043
Positive Action. (n.d.). Retrieved from //www.positiveaction.net/planning/grant-
writing/program-descriptions
Raising Voices. (2013). Good School Toolkit. Retrieved from http://raisingvoices.org/good-
school/
Raudenbush, S. W., & Xiao-Feng, L. (2001). Effects of study duration, frequency of
observation, and sample size on power in studies of group differences in polynomial
change. Psychological Methods, 6(4), 387-401. doi: 10.1037/1082-989x.6.4.387
56
Schick, A., & Cierpka, M. (2005). Faustlos: Evaluation of a curriculum to prevent violence in
elementary schools. Applied and Preventive Psychology, 11, 157-165. doi:
10.1016/j.appsy.2005.05.001
School of Social Work. (2017). Steps to Respect: A bullying prevention program. Retrieved
from https://socialwork.uw.edu/research-project/steps-respect-bullying-
prevention-program
Shields, N., Nadasen, K., & Pierce, L. (2008). The effects of community violence on children
in Cape Town, South Africa. Child Abuse & Neglect, 32, 589-601.
doi:10.1016/j.chiabu.2007.07.010
Simon, T. R., Ikeda, R. M., Smith, E. P., Reese, L. R. E., Rabiner, D. L., Miller, S., ... &
Orpinas, P. (2009). The ecological effects of universal and selective violence
prevention programs for middle school students: A randomized trial. Journal of
consulting and clinical psychology, 77, 526-542. doi: 10.1037/a0014395
Smith, S. W., Daunic, A. P., Aydin, B., Van Loan, C. L., Barber, B. R., & Taylor, G. G.
(2016). Effect of tools for getting along on student risk for emotional and behavioral
problems in upper elementary classrooms: a replication study. School Psychology
Review, 45(1), 73-92. doi: 10.17105/spr45-1.73-92
Smith, S. W., Daunic, A. P., Barber, B. R., Aydin, B., Van Loan, C. L., & Taylor, G. G.
(2014). Preventing risk for significant behavior problems through a Cognitive-
Behavioural intervention: Effects of the Tools for Fetting Along Curriculum at one-
year follow-up. Journal of Primary Prevention, 35, 371-387. doi: 10.1007/s10935-
014-0357-0
Snyder, F. J., Acock, A. C., Vuchinich, S., Beets, M. W., Washburn, I. J., & Flay, B. R.
(2013). Preventing negative behaviors among elementary-school students through
57
enhancing students' social-emotional and character development. American journal of
health promotion, 28(1), 50-58. doi: 10.4278/ajhp.120419-QUAN-207.2
Snyder, M., & Kendzierski, D. (1982). Acting on one’s attitudes: Procedures for linking
attitude and behavior. Journal of Experimental Social Psychology, 18, 165-183.
doi:10.1016/0022-1031(82)90048-8
State Education Resource Center. (2009). Data Report and Summary: A look at Connecticut
Statistics South Africa. (2015). Census 2011: Income dynamics and poverty status of
households in South Africa. Pretoria, South Africa: Statistics South Africa.
Stoltz, S. (2012). Stay Cool Kids?! Effectiveness, Moderation and Mediation of a Preventive
Intervention for Externalizing Behavior (Doctoral dissertation, Ultrecht University).
Stoltz, S., van Londen, M., Deković, M., de Castro, B. O., Prinzie, P., & Lochman, J. E.
(2013). Effectiveness of an individual school-based intervention for children with
aggressive behaviour: A randomized controlled trial. Behavioural and Cognitive
Psychotherapy, 41, 525-548. doi: 10.1017/S1352465812000525
Sullivan, T. N., Sutherland, K. S., Farrell, A. D., & Taylor, K. A. (2015). An evaluation of
Second Step: What are the benefits for youth with or without disabilities? Remedial
and Special Education, 36(5), 286-298. doi: 10.1177/0741932515575616
Taylor, B. G., Mumford, E. A., Liu, W., & Stein, N. D. (2017). The effects of different
saturation levels of the Shifting Boundaries intervention on preventing adolescent
relationship abuse and sexual harassment. Journal of Experimental
Criminology, 13(1), 79-100. doi:10.1007/s11292-016-9277-8
Taylor, B. G., & Woods, D. (2011). Shifting boundaries: Final report on an experimental
evaluation of a youth dating violence prevention program in New York City middle
schools. Police Executive Research Forum.
58
Twemlow, S. W., Fonagy, P., Sacco, F. C., Gies, M. L., Evans, R., & Ewbank, R. (2001).
Creating a peaceful learning environment: A controlled study of an elementary school
intervention to reduce violence. American Journal of Psychiatry, 158(5), 808-810.
doi: 10.1176/appi.ajp.158.5.808
Ward, C. L., Artz, L., Berg, J., Boonzaier, F., Crawford-Browne, S., Dawes, A., ... & van der
Spuy, E. (2012). Violence, violence prevention, and safety: A research agenda for
South Africa. SAMJ: South African Medical Journal, 102(4), 215-218.
Weare, K., & Nind, M. (2010). Identifying evidence-based work on mental health promotion
in schools in Europe: An interim report on the DataPrev project. Advances in
School Mental Health Promotion, 3(2), 37-45. doi: 10.1080/1754730x.2010.9715679
Winn, D. M. C., Newall, E., Coie, J., & Conduct Problems Prevention Research Group.
(2007). Fast Track Morphs into On Track: The Dissemination of a Conduct
Prevention Program in Manchester England. Child and family policy and practice
review, 3(1), 7-10.
Wisconsin RtI Center. (n.d.). Annual report 2014-15. Retrieved from
https://www.pbis.org/Common/Cms/files/pbisresources/WI_AnnualReport_14-
15.pdf
The World Bank Group. (2017). World Bank Country and Lending Group. Retrieved from
https://datahelpdesk.worldbank.org/knowledgebase/articles/906519-world-bank-
country-and-lending-groups
World Health Organization, United Nations Office on Drugs and Crime, & United Nations
Development Programme. (2014). Global status report on violence prevention.
Retrieved from
http://www.who.int/violence_injury_prevention/violence/status_report/2014/en/
Yerger, W., & Gehret, C. (2011). Understanding and dealing with bullying in schools. The
59
Educational Forum, 75(4), 315-326. doi:10.1080/00131725.2011.602468
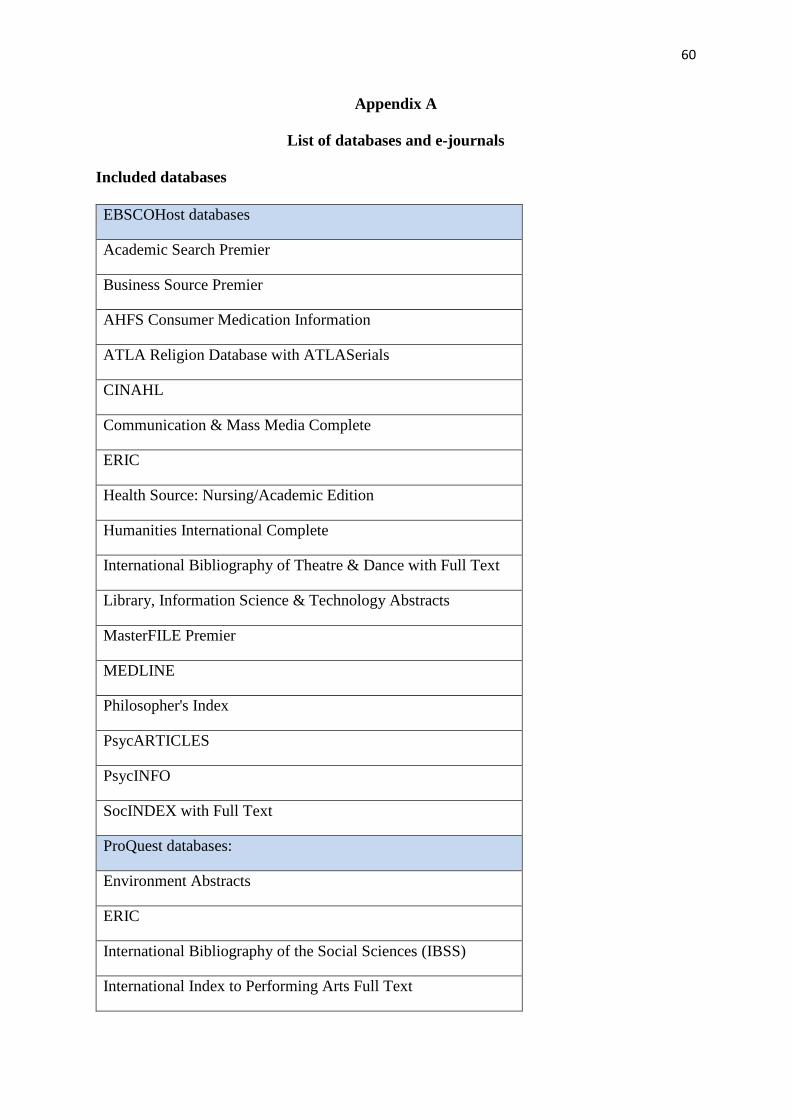
60
Appendix A
List of databases and e-journals
Included databases
EBSCOHost databases
Academic Search Premier
Business Source Premier
AHFS Consumer Medication Information
ATLA Religion Database with ATLASerials
CINAHL
Communication & Mass Media Complete
ERIC
Health Source: Nursing/Academic Edition
Humanities International Complete
International Bibliography of Theatre & Dance with Full Text
Library, Information Science & Technology Abstracts
MasterFILE Premier
MEDLINE
Philosopher's Index
PsycARTICLES
PsycINFO
SocINDEX with Full Text
ProQuest databases:
Environment Abstracts
ERIC
International Bibliography of the Social Sciences (IBSS)
International Index to Performing Arts Full Text
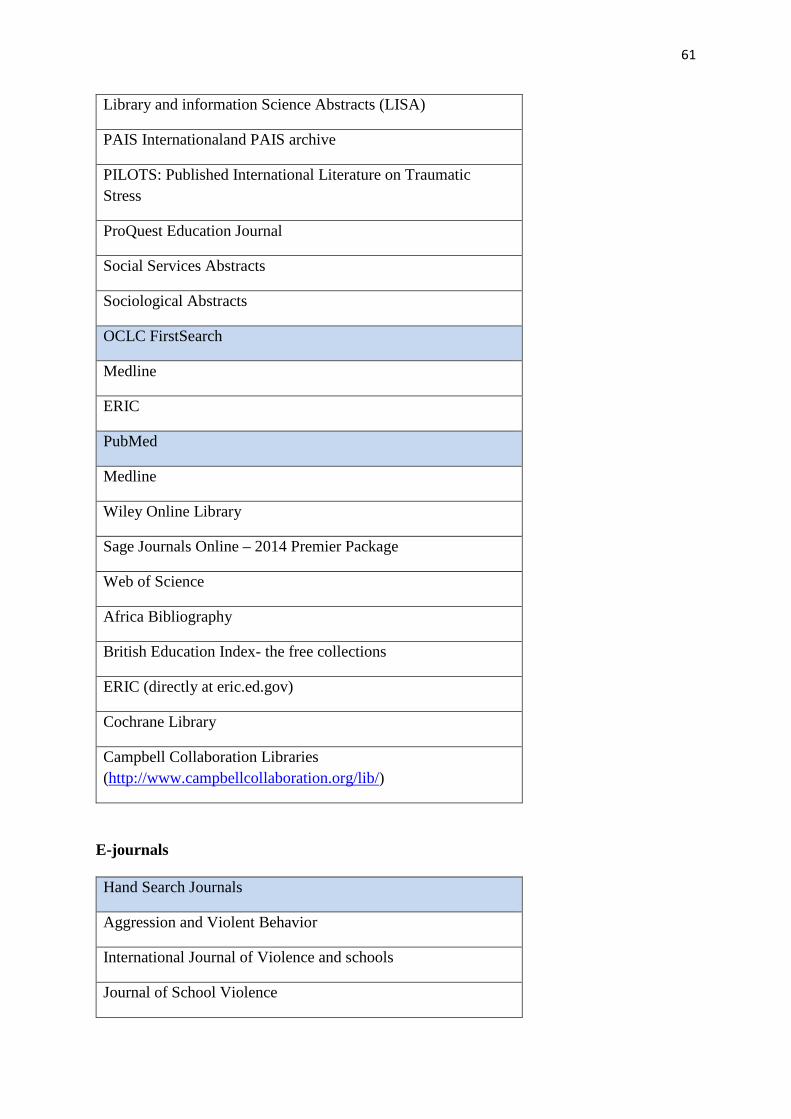
61
Library and information Science Abstracts (LISA)
PAIS International and PAIS archive
PILOTS: Published International Literature on Traumatic Stress
ProQuest Education Journal
Social Services Abstracts
Sociological Abstracts
OCLC FirstSearch
Medline
ERIC
PubMed
Medline
Wiley Online Library
Sage Journals Online – 2014 Premier Package
Web of Science
Africa Bibliography
British Education Index- the free collections
ERIC (directly at eric.ed.gov)
Cochrane Library
Campbell Collaboration Libraries (http://www.campbellcollaboration.org/lib/)
E-journals
Hand Search Journals
Aggression and Violent Behavior
International Journal of Violence and schools
Journal of School Violence
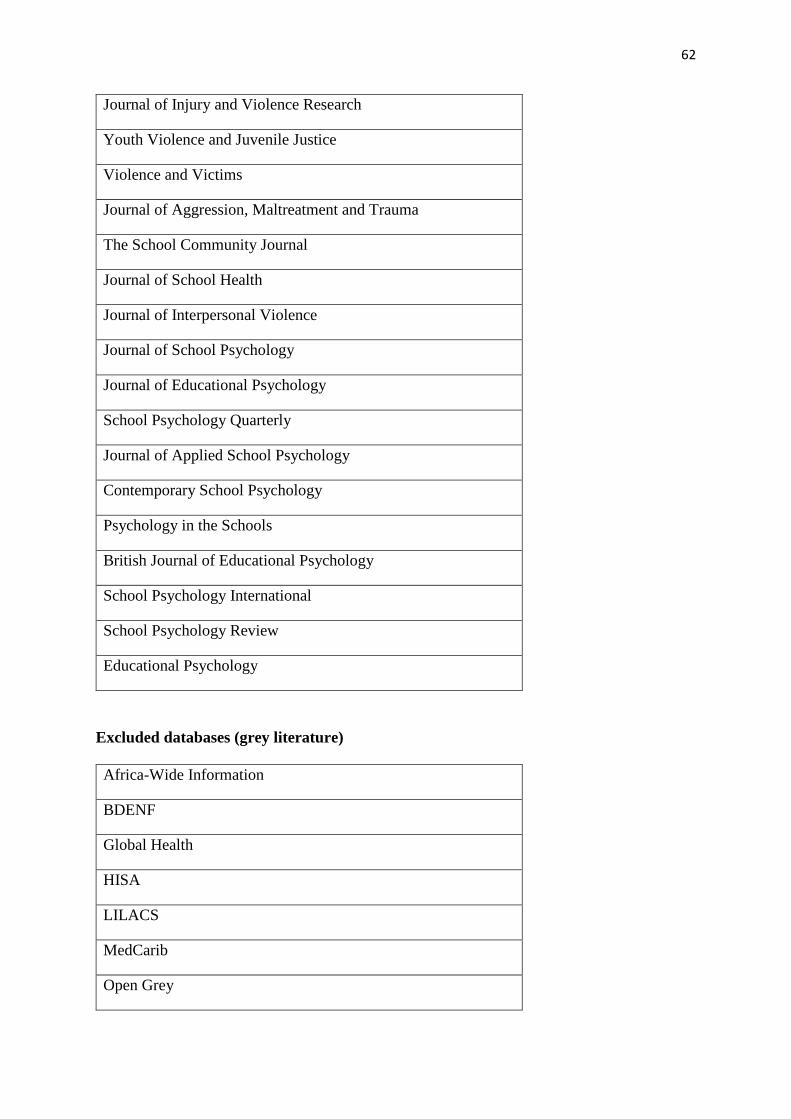
62
Journal of Injury and Violence Research
Youth Violence and Juvenile Justice
Violence and Victims
Journal of Aggression, Maltreatment and Trauma
The School Community Journal
Journal of School Health
Journal of Interpersonal Violence
Journal of School Psychology
Journal of Educational Psychology
School Psychology Quarterly
Journal of Applied School Psychology
Contemporary School Psychology
Psychology in the Schools
British Journal of Educational Psychology
School Psychology International
School Psychology Review
Educational Psychology
Excluded databases (grey literature)
Africa-Wide Information
BDENF
Global Health
HISA
LILACS
MedCarib
Open Grey
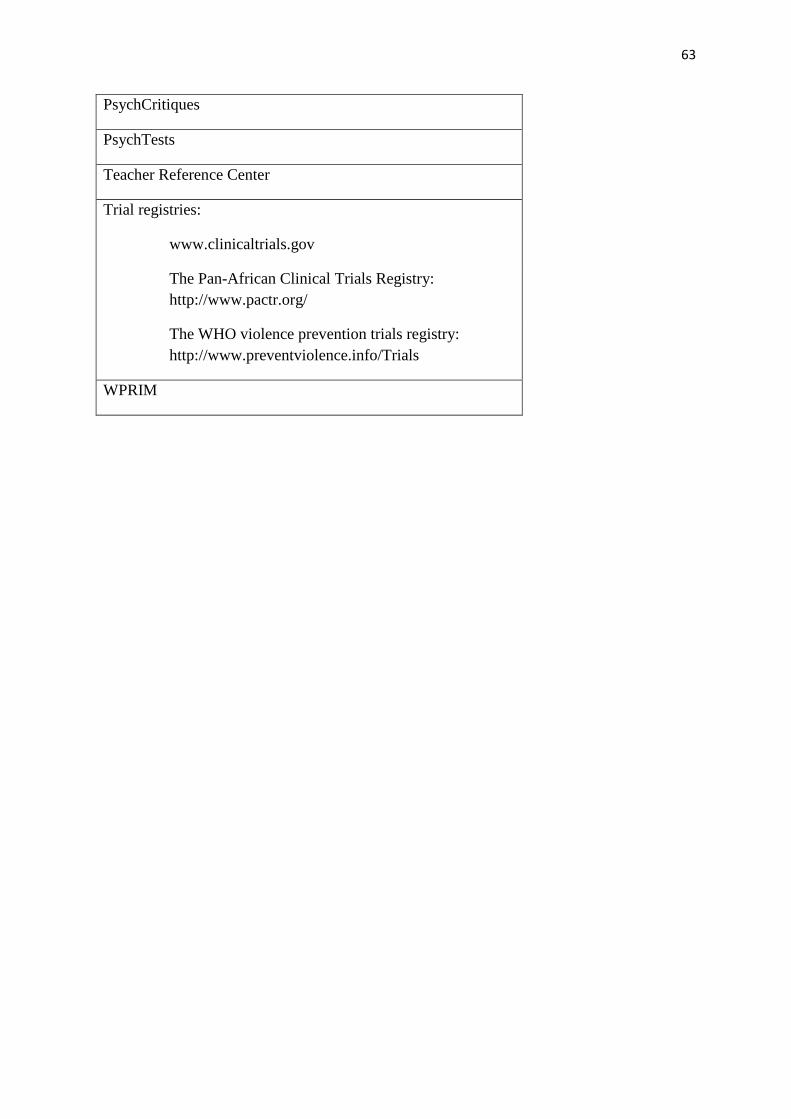
63
PsychCritiques
PsychTests
Teacher Reference Center
Trial registries:
www.clinicaltrials.gov
The Pan-African Clinical Trials Registry: http://www.pactr.org/
The WHO violence prevention trials registry: http://www.preventviolence.info/Trials
WPRIM
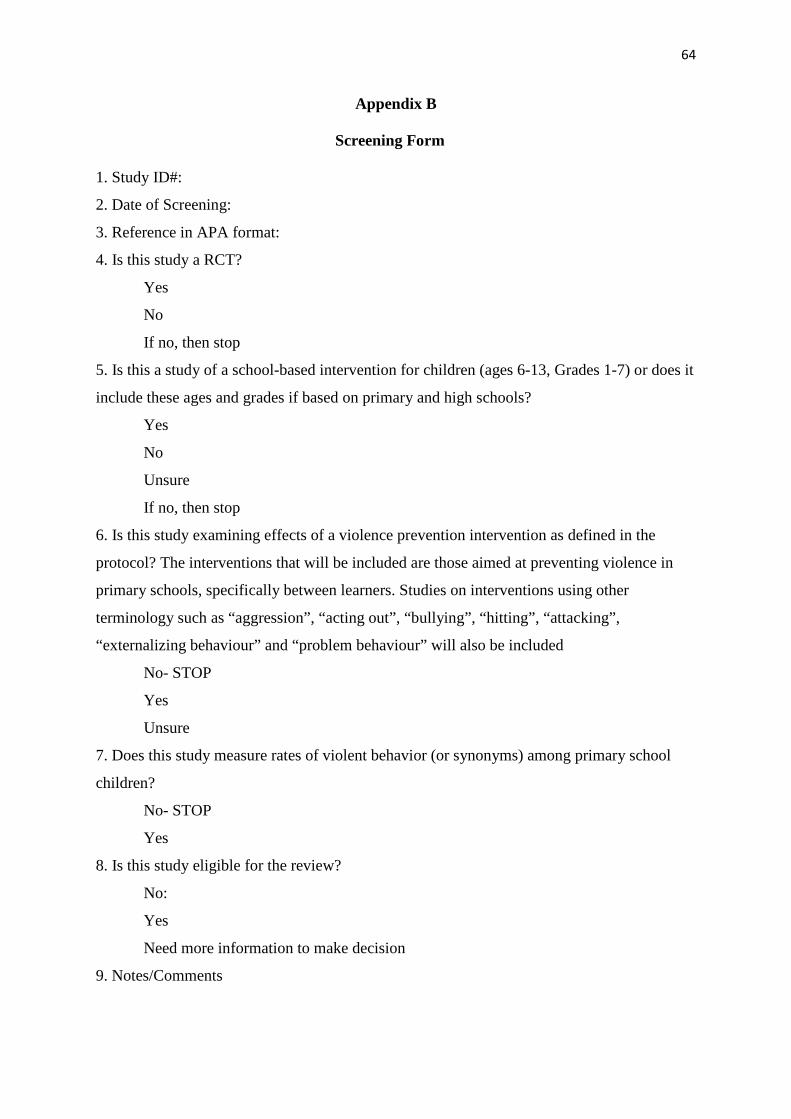
64
Appendix B
Screening Form
1. Study ID#:
2. Date of Screening:
3. Reference in APA format:
4. Is this study a RCT?
Yes
No
If no, then stop
5. Is this a study of a school-based intervention for children (ages 6-13, Grades 1-7) or does it
include these ages and grades if based on primary and high schools?
Yes
No
Unsure
If no, then stop
6. Is this study examining effects of a violence prevention intervention as defined in the
protocol? The interventions that will be included are those aimed at preventing violence in
primary schools, specifically between learners. Studies on interventions using other
terminology such as “aggression”, “acting out”, “bullying”, “hitting”, “attacking”,
“externalizing behaviour” and “problem behaviour” will also be included
No- STOP
Yes
Unsure
7. Does this study measure rates of violent behavior (or synonyms) among primary school
children?
No- STOP
Yes
8. Is this study eligible for the review?
No:
Yes
Need more information to make decision
9. Notes/Comments
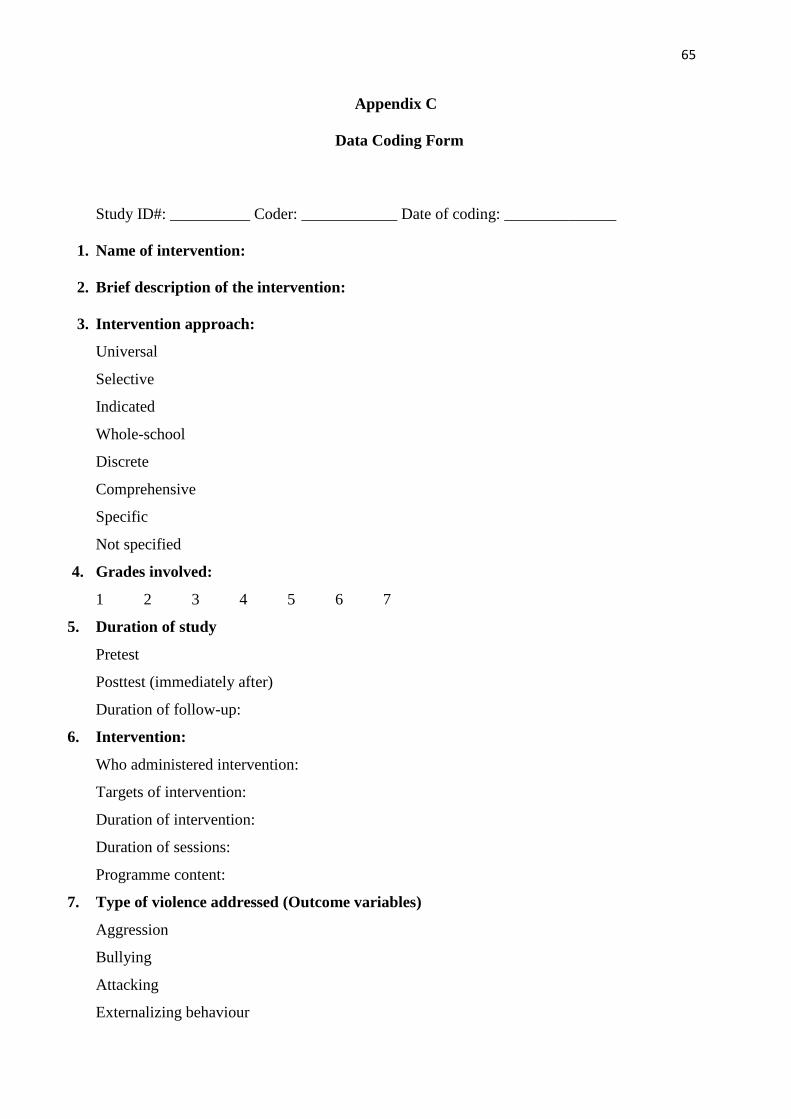
65
Appendix C
Data Coding Form
Study ID#: __________ Coder: ____________ Date of coding: ______________
1. Name of intervention:
2. Brief description of the intervention:
3. Intervention approach:
Universal
Selective
Indicated
Whole-school
Discrete
Comprehensive
Specific
Not specified
4. Grades involved:
1 2 3 4 5 6 7
5. Duration of study
Pretest
Posttest (immediately after)
Duration of follow-up:
6. Intervention:
Who administered intervention:
Targets of intervention:
Duration of intervention:
Duration of sessions:
Programme content:
7. Type of violence addressed (Outcome variables)
Aggression
Bullying
Attacking
Externalizing behaviour
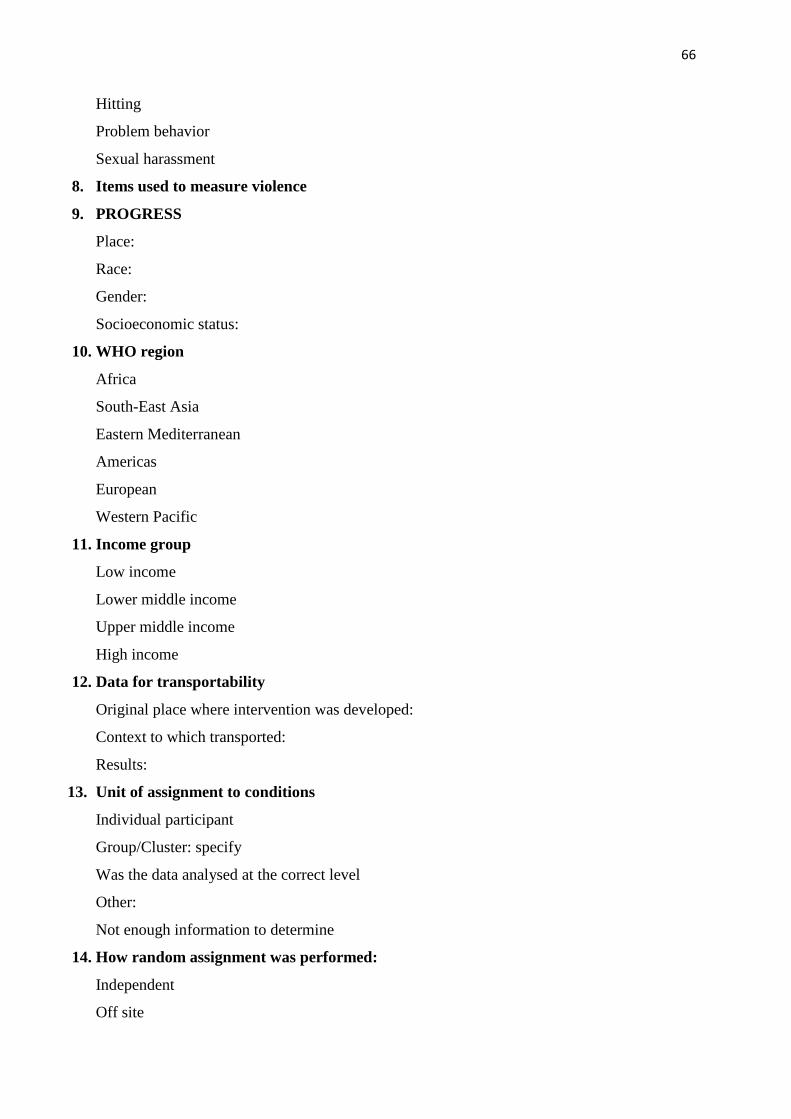
66
Hitting
Problem behavior
Sexual harassment
8. Items used to measure violence
9. PROGRESS
Place:
Race:
Gender:
Socioeconomic status:
10. WHO region
Africa
South-East Asia
Eastern Mediterranean
Americas
European
Western Pacific
11. Income group
Low income
Lower middle income
Upper middle income
High income
12. Data for transportability
Original place where intervention was developed:
Context to which transported:
Results:
13. Unit of assignment to conditions
Individual participant
Group/Cluster: specify
Was the data analysed at the correct level
Other:
Not enough information to determine
14. How random assignment was performed:
Independent
Off site
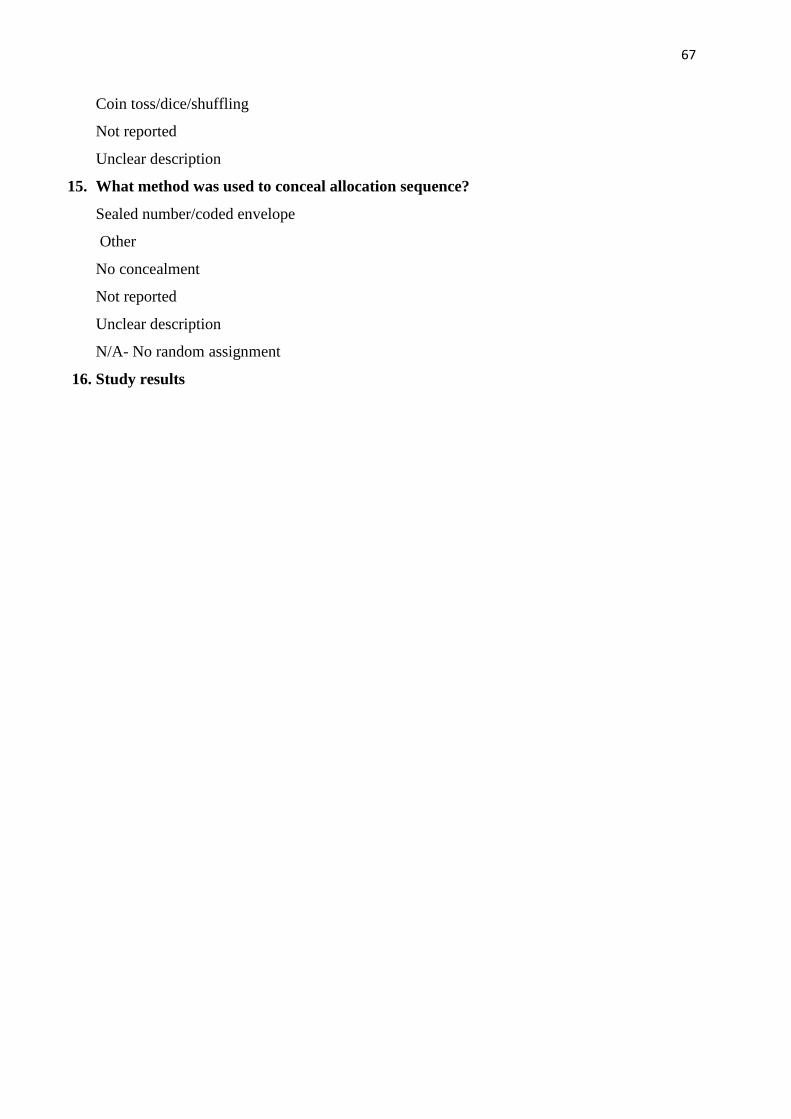
67
Coin toss/dice/shuffling
Not reported
Unclear description
15. What method was used to conceal allocation sequence?
Sealed number/coded envelope
Other
No concealment
Not reported
Unclear description
N/A- No random assignment
16. Study results
68
Appendix D
Downs and Black checklist for the assessment of the methodological quality
Item Criteria Possible Answers
Reporting
1. Is the hypothesis/aim/objective of the study clearly described?
Yes = 1
No = 0
2. Are the main outcomes to be measured clearly described in the Introduction or
Methods section? If the main outcomes are first mentioned in the Results
section, the question should be answered no.
Yes = 1
No = 0
3. Are the characteristics of the patients included in the study clearly described?
In cohort studies and trials, inclusion and/or exclusion criteria should be given.
In case-control studies, a case-definition and the source for controls should be
given.
Yes = 1
No = 0
4. Are the interventions of interest clearly described? Treatments and placebo
(where relevant) that are to be compared should be clearly described.
Yes = 1
No = 0
5. Are the distributions of principal confounders in each group of subjects to be
compared clearly described? A list of principal confounders is provided.
Yes = 1
Partially = 2
No = 0
6. Are the main findings of the study clearly described? Simple outcome data
(including denominators and numerators) should be reported for all major
findings so that the reader can check the major analyses and conclusions. (This
question does not cover statistical tests which are considered below).
Yes = 1
No = 0
7. Does the study provide estimates of the random variability in the data for the
main outcomes? In non-normally distributed data the interquartile range of
results should be reported. In normally distributed data the standard error,
69
standard deviation or confidence intervals should be reported. If the
distribution of the data is not described, it must be assumed that the estimates
used were appropriate and the question should be answered yes.
Yes = 1
No = 0
8. Have all important adverse events that may be a consequence of the
intervention been reported? This should be answered yes if the study
demonstrates that there was a comprehensive attempt to measure adverse
events. (A list of possible adverse events is provided).
Yes = 1
No = 0
9. Have the characteristics of patients lost to follow-up been described? This
should be answered yes where there were no losses to follow-up or where
losses to follow-up were so small that findings would be unaffected by their
inclusion. This should be answered no where a study does not report the
number of patients lost to follow-up.
Yes = 1
No = 0
10. Have actual probability values been reported (e.g. 0.035 rather than <0.05)
for the main outcomes except where the probability value is less than 0.001?
Yes = 1
No = 0
External validity
11. Were the subjects asked to participate in the study representative of the entire
population from which they were recruited? The study must identify the source
population for patients and describe how the patients were selected. Patients
would be representative if they comprised the entire source population, an
unselected sample of consecutive patients, or a random sample. Random
sampling is only feasible where a list of all members of the relevant population
exists. Where a study does not report the proportion of the source population
from which the patients are derived, the question should be answered as unable
to determine.
Yes = 1
No = 0
Unable to determine = 0
12. Were those subjects who were prepared to participate representative of the
entire population from which they were recruited? The proportion of those
70
asked who agreed should be stated. Validation that the sample was
representative would include demonstrating that the distribution of the main
confounding factors was the same in the study sample and the source
population.
Yes = 1
No = 0
Unable to determine = 0
13. Were the staff, places, and facilities where the patients were treated,
representative of the treatment the majority of patients receive? For the
question to be answered yes the study should demonstrate that the intervention
was representative of that in use in the source population. The question should
be answered no if, for example, the intervention was undertaken in a specialist
centre unrepresentative of the hospitals most of the source population would
attend.
Yes = 1
No = 0
Unable to determine = 0
Internal validity - bias
14. Was an attempt made to blind study subjects to the intervention they have
received? For studies where the patients would have no way of knowing which
intervention they received, this should be answered yes.
Yes = 1
No = 0
Unable to determine = 0
15. Was an attempt made to blind those measuring the main outcomes of the
intervention?
Yes = 1
No = 0
Unable to determine = 0
16. If any of the results of the study were based on “data dredging”, was this made
clear? Any analyses that had not been planned at the outset of the study should
be clearly indicated. If no retrospective unplanned subgroup analyses were
reported, then answer yes.
Yes = 1
No = 0
Unable to determine = 0
17. In trials and cohort studies, do the analyses adjust for different lengths of
71
follow-up of patients, or in case-control studies, is the time period between the
intervention and outcome the same for cases and controls? Where follow-up
was the same for all study patients the answer should be yes. If different
lengths of follow-up were adjusted for by, for example, survival analysis the
answer should be yes. Studies where differences in follow-up are ignored
should be answered no.
Yes = 1
No = 0
Unable to determine = 0
18. Were the statistical tests used to assess the main outcomes appropriate? The
statistical techniques used must be appropriate to the data. For example
nonparametric methods should be used for small sample sizes. Where little
statistical analysis has been undertaken but where there is no evidence of bias,
the question should be answered yes. If the distribution of the data (normal or
not) is not described it must be assumed that the estimates used were
appropriate and the question should be answered yes.
Yes = 1
No = 0
Unable to determine = 0
19. Was compliance with the intervention/s reliable? Where there was noncompliance
with the allocated treatment or where there was contamination of
one group, the question should be answered no. For studies where the effect of
any misclassification was likely to bias any association to the null, the question
should be answered yes.
Yes = 1
No = 0
Unable to determine = 0
20. Were the main outcome measures used accurate (valid and reliable)? For
studies where the outcome measures are clearly described, the question should
be answered yes. For studies which refer to other work or that demonstrates the
outcome measures are accurate, the question should be answered as yes.
Yes = 1
No = 0
Unable to determine = 0
Internal validity - confounding (selection bias)
21. Were the patients in different intervention groups (trials and cohort studies) or
were the cases and controls (case-control studies) recruited from the same
72
population? For example, patients for all comparison groups should be
selected from the same hospital. The question should be answered unable to
determine for cohort and case-control studies where there is no information
Yes = 1
No = 0
Unable to determine = 0
22. Were study subjects in different intervention groups (trials and cohort studies)
or were the cases and controls (case-control studies) recruited over the same
period of time? For a study which does not specify the time period over which
patients were recruited, the question should be answered as unable to
determine.
Yes = 1
No = 0
Unable to determine = 0
23. Were study subjects randomized to intervention groups? Studies which state
that subjects were randomized should be answered yes except where method of
randomization would not ensure random allocation. For example alternate
allocation would score no because it is predictable.
Yes = 1
No = 0
Unable to determine = 0
24. Was the randomized intervention assignment concealed from both patients and
health care staff until recruitment was complete and irrevocable? All nonrandomized
studies should be answered no. If assignment was concealed from
patients but not from staff, it should be answered no.
Yes = 1
No = 0
Unable to determine = 0
25. Was there adequate adjustment for confounding in the analyses from which the
main findings were drawn? This question should be answered no for trials if:
the main conclusions of the study were based on analyses of treatment rather
than intention to treat; the distribution of known confounders in the different
treatment groups was not described; or the distribution of known confounders
differed between the treatment groups but was not taken into account in the
analyses. In non-randomized studies if the effect of the main confounders was
not investigated or confounding was demonstrated but no adjustment was
made in the final analyses the question should be answered as no.
73
Yes = 1
No = 0
Unable to determine = 0
26. Were losses of patients to follow-up taken into account? If the numbers of
patients lost to follow-up are not reported, the question should be answered as
unable to determine. If the proportion lost to follow-up was too small to affect
the main findings, the question should be answered yes.
Yes = 1
No = 0
Unable to determine = 0
Power
27. Did the study have sufficient power to detect a clinically important effect
where the probability value for a difference being due to chance is less than
5%? Sample sizes have been calculated to detect a difference of x% and y%.
Yes = 1
No = 0
Unable to determine = 0
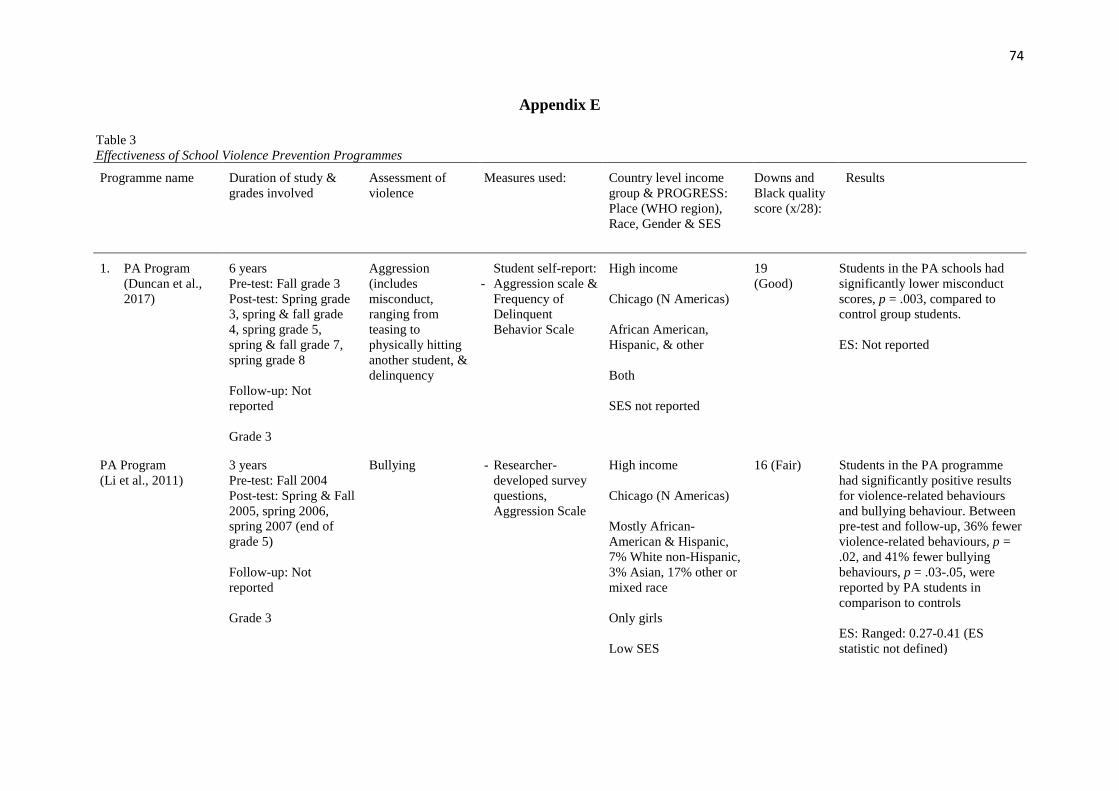
74
Appendix E
Table 3 Effectiveness of School Violence Prevention Programmes
Programme name Duration of study & grades involved
Assessment of violence
Measures used: Country level income group & PROGRESS: Place (WHO region), Race, Gender & SES
Downs and Black quality score (x/28):
Results
1. PA Program (Duncan et al., 2017)
6 years Pre-test: Fall grade 3 Post-test: Spring grade 3, spring & fall grade 4, spring grade 5, spring & fall grade 7, spring grade 8 Follow-up: Not reported Grade 3
Aggression (includes misconduct, ranging from teasing to physically hitting another student, & delinquency
Student self-report: - Aggression scale &
Frequency of Delinquent Behavior Scale
High income Chicago (N Americas) African American, Hispanic, & other Both SES not reported
19 (Good)
Students in the PA schools had significantly lower misconduct scores, p = .003, compared to control group students. ES: Not reported
PA Program (Li et al., 2011)
3 years Pre-test: Fall 2004 Post-test: Spring & Fall 2005, spring 2006, spring 2007 (end of grade 5) Follow-up: Not reported Grade 3
Bullying - Researcher-developed survey questions, Aggression Scale
High income Chicago (N Americas) Mostly African-American & Hispanic, 7% White non-Hispanic, 3% Asian, 17% other or mixed race Only girls Low SES
16 (Fair) Students in the PA programme had significantly positive results for violence-related behaviours and bullying behaviour. Between pre-test and follow-up, 36% fewer violence-related behaviours, p = .02, and 41% fewer bullying behaviours, p = .03-.05, were reported by PA students in comparison to controls ES: Ranged: 0.27-0.41 (ES statistic not defined)
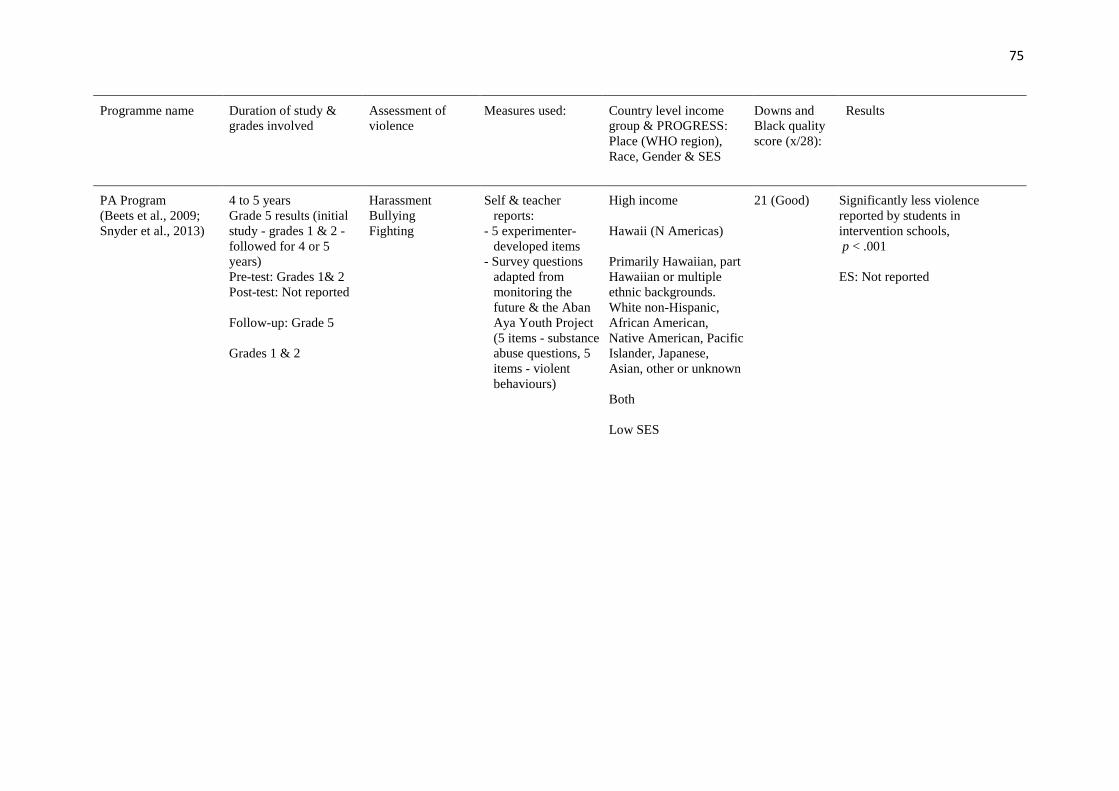
75
Programme name Duration of study & grades involved
Assessment of violence
Measures used: Country level income group & PROGRESS: Place (WHO region), Race, Gender & SES
Downs and Black quality score (x/28):
Results
PA Program (Beets et al., 2009; Snyder et al., 2013)
4 to 5 years Grade 5 results (initial study - grades 1 & 2 - followed for 4 or 5 years) Pre-test: Grades 1& 2 Post-test: Not reported Follow-up: Grade 5 Grades 1 & 2
Harassment Bullying Fighting
Self & teacher reports:
- 5 experimenter-developed items
- Survey questions adapted from monitoring the future & the Aban Aya Youth Project (5 items - substance abuse questions, 5 items - violent behaviours)
High income Hawaii (N Americas) Primarily Hawaiian, part Hawaiian or multiple ethnic backgrounds. White non-Hispanic, African American, Native American, Pacific Islander, Japanese, Asian, other or unknown Both Low SES
21 (Good) Significantly less violence reported by students in intervention schools, p < .001 ES: Not reported
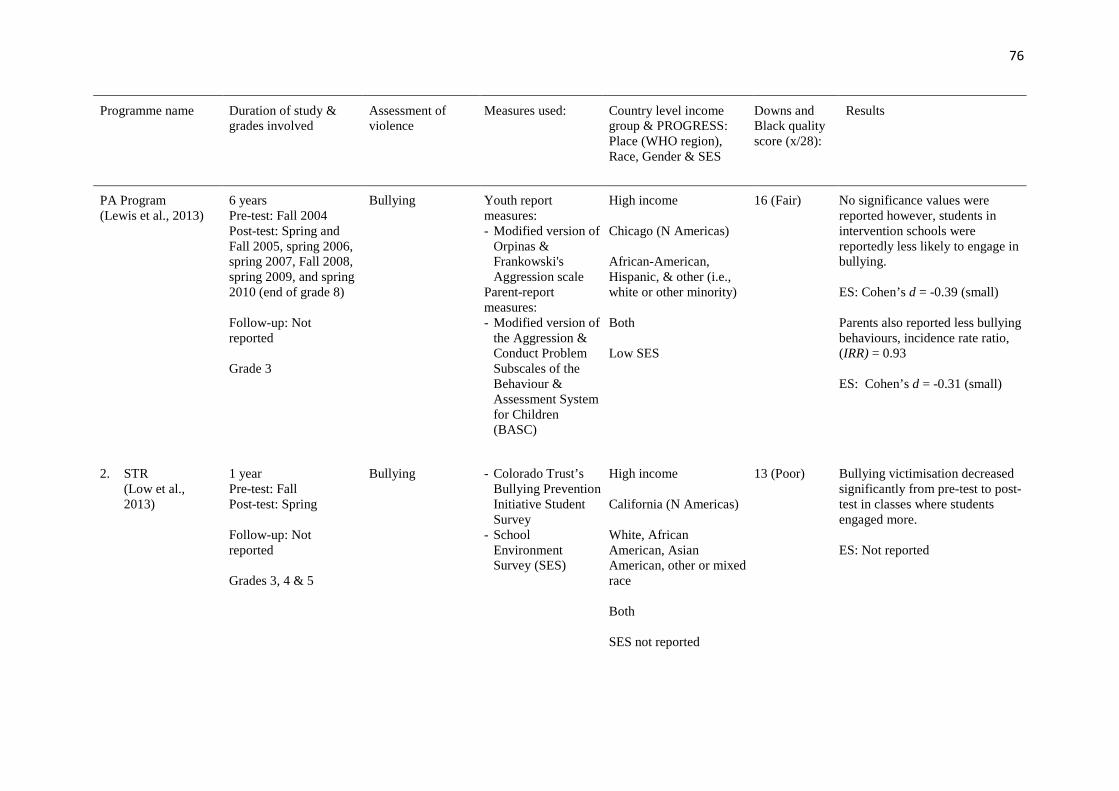
76
Programme name Duration of study & grades involved
Assessment of violence
Measures used: Country level income group & PROGRESS: Place (WHO region), Race, Gender & SES
Downs and Black quality score (x/28):
Results
PA Program (Lewis et al., 2013)
6 years Pre-test: Fall 2004 Post-test: Spring and Fall 2005, spring 2006, spring 2007, Fall 2008, spring 2009, and spring 2010 (end of grade 8) Follow-up: Not reported Grade 3
Bullying Youth report measures: - Modified version of
Orpinas & Frankowski's Aggression scale
Parent-report measures: - Modified version of
the Aggression & Conduct Problem Subscales of the Behaviour & Assessment System for Children (BASC)
High income Chicago (N Americas) African-American, Hispanic, & other (i.e., white or other minority) Both Low SES
16 (Fair) No significance values were reported however, students in intervention schools were reportedly less likely to engage in bullying. ES: Cohen’s d = -0.39 (small) Parents also reported less bullying behaviours, incidence rate ratio, (IRR) = 0.93 ES: Cohen’s d = -0.31 (small)
2. STR (Low et al., 2013)
1 year Pre-test: Fall Post-test: Spring Follow-up: Not reported Grades 3, 4 & 5
Bullying - Colorado Trust’s Bullying Prevention Initiative Student Survey
- School Environment Survey (SES)
High income California (N Americas) White, African American, Asian American, other or mixed race Both SES not reported
13 (Poor) Bullying victimisation decreased significantly from pre-test to post-test in classes where students engaged more. ES: Not reported

77
Programme name Duration of study & grades involved
Assessment of violence
Measures used: Country level income group & PROGRESS: Place (WHO region), Race, Gender & SES
Downs and Black quality score (x/28):
Results
STR (Brown et al., 2011)
6 months Pre-test: Fall Post-test: Spring Follow-up: Not reported Grades 3, 4 & 5
Bullying - School Environment Survey (SES)
- Teacher Assessment of Student Behavior (TASB)
- Initiative Student Survey
High income California (N Americas) Mostly White, 7% African American, 6% Asian American, 35% other or mixed race Both SES not reported
18 (Fair) There was a larger decrease in school bullying-related problems, p < .01, for intervention schools relative to control schools. Although the prevalence of physical bullying perpetration increased during the school year in both control and intervention schools, the increase was smaller in intervention schools, p < .01 ES: Student bullying = 0.28 (small) School bullying related problems (school environment survey measures) = -0.35 (small). Positive bystanding behavior (student survey measures) = 0.14 (small) Adjusted odds ratio (AOR) = 0.61 (small) for physical bullying perpetration (teacher assessment of student behavior)
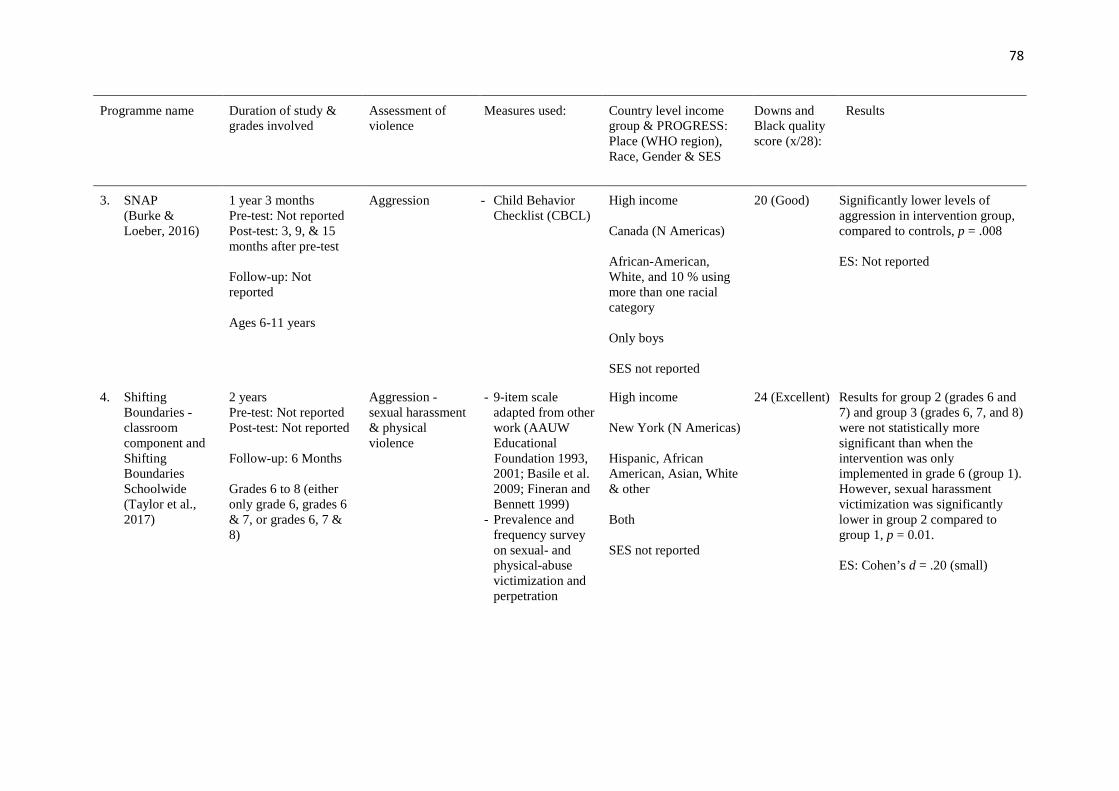
78
Programme name Duration of study & grades involved
Assessment of violence
Measures used: Country level income group & PROGRESS: Place (WHO region), Race, Gender & SES
Downs and Black quality score (x/28):
Results
3. SNAP (Burke & Loeber, 2016)
1 year 3 months Pre-test: Not reported Post-test: 3, 9, & 15 months after pre-test Follow-up: Not reported Ages 6-11 years
Aggression - Child Behavior Checklist (CBCL)
High income Canada (N Americas) African-American, White, and 10 % using more than one racial category Only boys SES not reported
20 (Good) Significantly lower levels of aggression in intervention group, compared to controls, p = .008 ES: Not reported
4. Shifting Boundaries - classroom component and Shifting Boundaries Schoolwide (Taylor et al., 2017)
2 years Pre-test: Not reported Post-test: Not reported Follow-up: 6 Months Grades 6 to 8 (either only grade 6, grades 6 & 7, or grades 6, 7 & 8)
Aggression - sexual harassment & physical violence
- 9-item scale adapted from other work (AAUW Educational
Foundation 1993, 2001; Basile et al. 2009; Fineran and Bennett 1999)
- Prevalence and frequency survey on sexual- and physical-abuse victimization and perpetration
High income New York (N Americas) Hispanic, African American, Asian, White & other Both SES not reported
24 (Excellent) Results for group 2 (grades 6 and 7) and group 3 (grades 6, 7, and 8) were not statistically more significant than when the intervention was only implemented in grade 6 (group 1). However, sexual harassment victimization was significantly lower in group 2 compared to group 1, p = 0.01. ES: Cohen’s d = .20 (small)
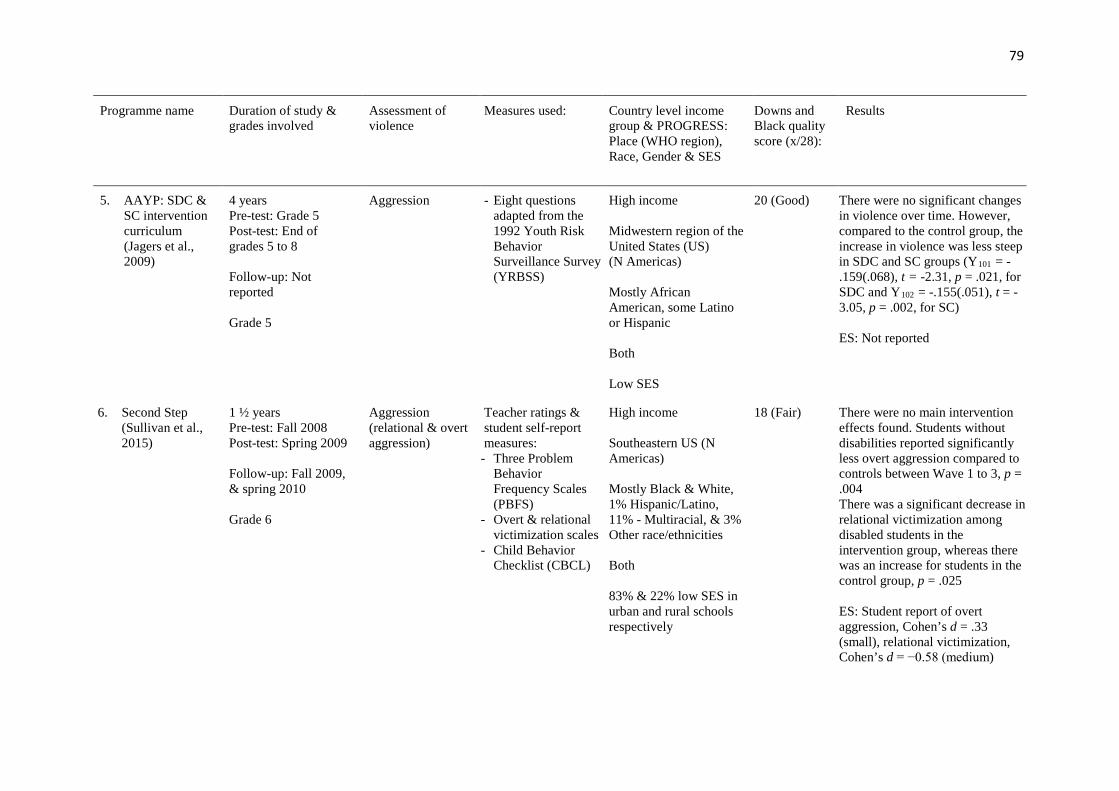
79
Programme name Duration of study & grades involved
Assessment of violence
Measures used: Country level income group & PROGRESS: Place (WHO region), Race, Gender & SES
Downs and Black quality score (x/28):
Results
5. AAYP: SDC & SC intervention curriculum (Jagers et al., 2009)
4 years Pre-test: Grade 5 Post-test: End of grades 5 to 8 Follow-up: Not reported Grade 5
Aggression - Eight questions adapted from the 1992 Youth Risk Behavior Surveillance Survey (YRBSS)
High income Midwestern region of the United States (US) (N Americas) Mostly African American, some Latino or Hispanic Both Low SES
20 (Good) There were no significant changes in violence over time. However, compared to the control group, the increase in violence was less steep in SDC and SC groups (Y101 = -.159(.068), t = -2.31, p = .021, for SDC and Y102 = -.155(.051), t = -3.05, p = .002, for SC) ES: Not reported
6. Second Step (Sullivan et al., 2015)
1 ½ years Pre-test: Fall 2008 Post-test: Spring 2009 Follow-up: Fall 2009, & spring 2010 Grade 6
Aggression (relational & overt aggression)
Teacher ratings & student self-report measures:
- Three Problem Behavior Frequency Scales (PBFS)
- Overt & relational victimization scales
- Child Behavior Checklist (CBCL)
High income Southeastern US (N Americas) Mostly Black & White, 1% Hispanic/Latino, 11% - Multiracial, & 3% Other race/ethnicities Both 83% & 22% low SES in urban and rural schools respectively
18 (Fair) There were no main intervention effects found. Students without disabilities reported significantly less overt aggression compared to controls between Wave 1 to 3, p = .004 There was a significant decrease in relational victimization among disabled students in the intervention group, whereas there was an increase for students in the control group, p = .025 ES: Student report of overt aggression, Cohen’s d = .33 (small), relational victimization, Cohen’s d = −0.58 (medium)
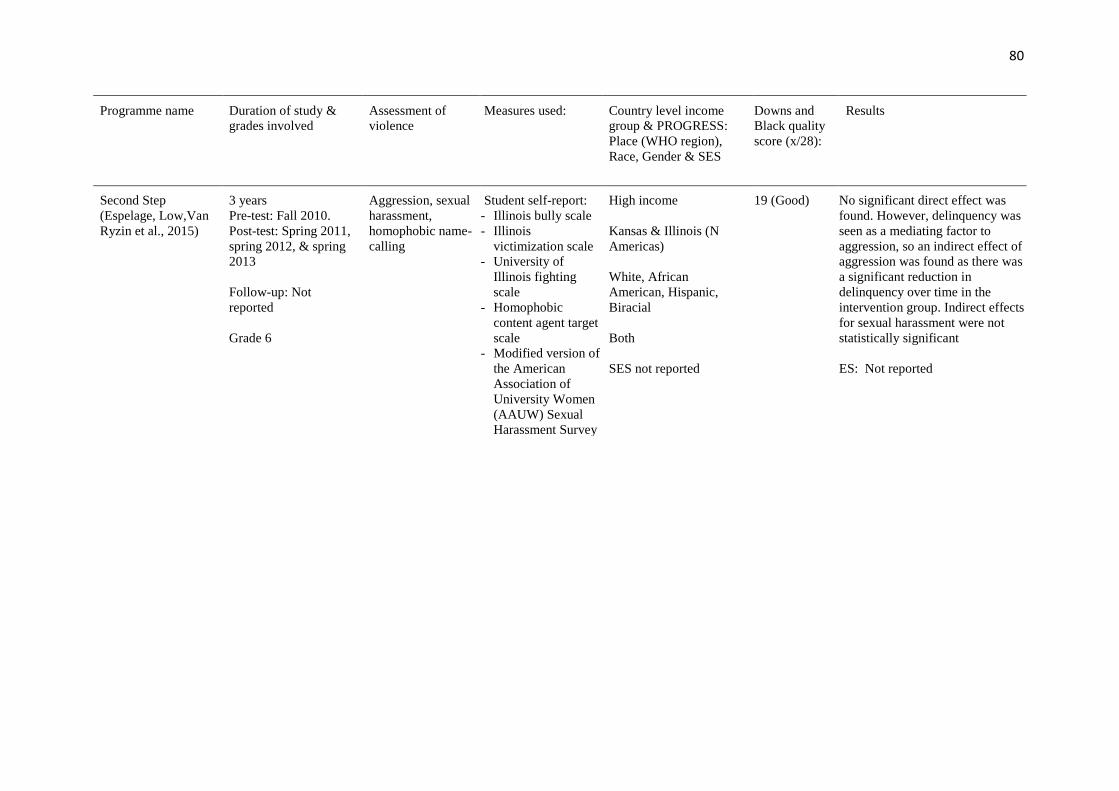
80
Programme name Duration of study & grades involved
Assessment of violence
Measures used: Country level income group & PROGRESS: Place (WHO region), Race, Gender & SES
Downs and Black quality score (x/28):
Results
Second Step (Espelage, Low,Van Ryzin et al., 2015)
3 years Pre-test: Fall 2010. Post-test: Spring 2011, spring 2012, & spring 2013 Follow-up: Not reported Grade 6
Aggression, sexual harassment, homophobic name-calling
Student self-report: - Illinois bully scale - Illinois
victimization scale - University of
Illinois fighting scale
- Homophobic content agent target scale
- Modified version of the American Association of University Women (AAUW) Sexual Harassment Survey
High income Kansas & Illinois (N Americas) White, African American, Hispanic, Biracial Both SES not reported
19 (Good) No significant direct effect was found. However, delinquency was seen as a mediating factor to aggression, so an indirect effect of aggression was found as there was a significant reduction in delinquency over time in the intervention group. Indirect effects for sexual harassment were not statistically significant ES: Not reported
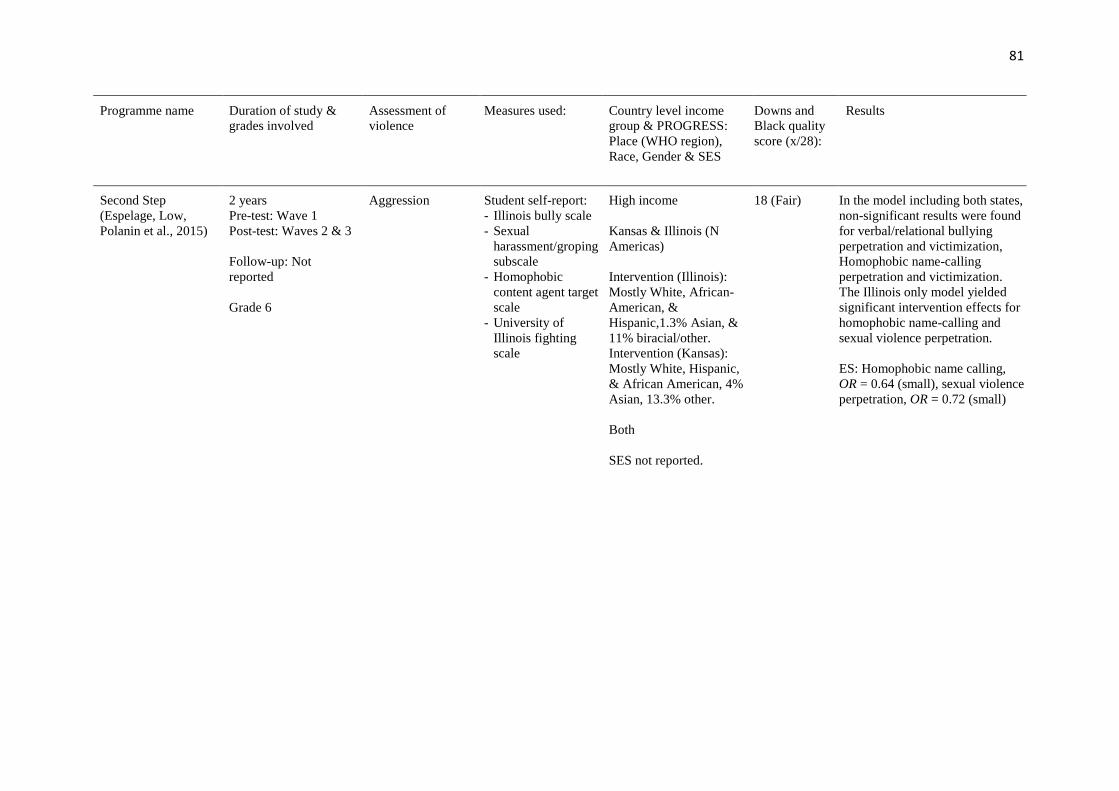
81
Programme name Duration of study & grades involved
Assessment of violence
Measures used: Country level income group & PROGRESS: Place (WHO region), Race, Gender & SES
Downs and Black quality score (x/28):
Results
Second Step (Espelage, Low, Polanin et al., 2015)
2 years Pre-test: Wave 1 Post-test: Waves 2 & 3 Follow-up: Not reported Grade 6
Aggression Student self-report: - Illinois bully scale - Sexual
harassment/groping subscale
- Homophobic content agent target scale
- University of Illinois fighting scale
High income Kansas & Illinois (N Americas) Intervention (Illinois): Mostly White, African-American, & Hispanic,1.3% Asian, & 11% biracial/other. Intervention (Kansas): Mostly White, Hispanic, & African American, 4% Asian, 13.3% other. Both SES not reported.
18 (Fair) In the model including both states, non-significant results were found for verbal/relational bullying perpetration and victimization, Homophobic name-calling perpetration and victimization. The Illinois only model yielded significant intervention effects for homophobic name-calling and sexual violence perpetration. ES: Homophobic name calling, OR = 0.64 (small), sexual violence perpetration, OR = 0.72 (small)
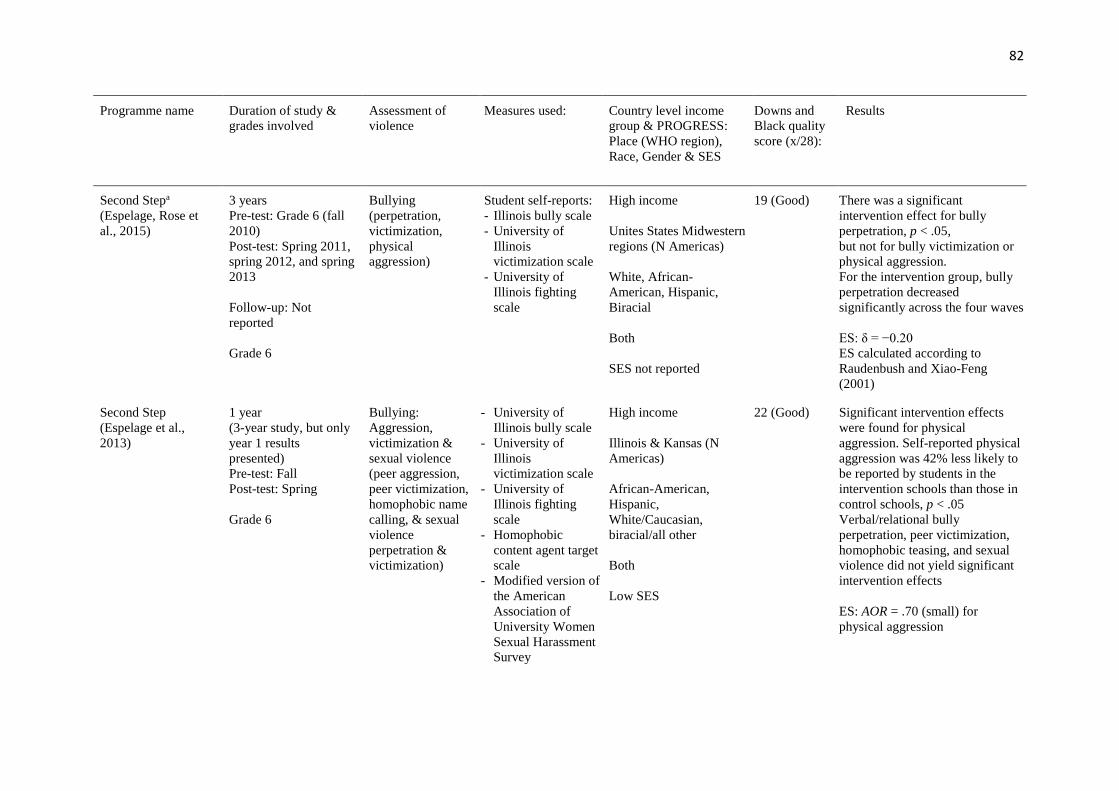
82
Programme name Duration of study & grades involved
Assessment of violence
Measures used: Country level income group & PROGRESS: Place (WHO region), Race, Gender & SES
Downs and Black quality score (x/28):
Results
Second Stepa
(Espelage, Rose et al., 2015)
3 years Pre-test: Grade 6 (fall 2010) Post-test: Spring 2011, spring 2012, and spring 2013 Follow-up: Not reported Grade 6
Bullying (perpetration, victimization, physical aggression)
Student self-reports: - Illinois bully scale - University of
Illinois victimization scale
- University of Illinois fighting scale
High income Unites States Midwestern regions (N Americas) White, African- American, Hispanic, Biracial Both SES not reported
19 (Good) There was a significant intervention effect for bully perpetration, p < .05, but not for bully victimization or physical aggression. For the intervention group, bully perpetration decreased significantly across the four waves ES: δ = −0.20 ES calculated according to Raudenbush and Xiao-Feng (2001)
Second Step (Espelage et al., 2013)
1 year (3-year study, but only year 1 results presented) Pre-test: Fall Post-test: Spring Grade 6
Bullying: Aggression, victimization & sexual violence (peer aggression, peer victimization, homophobic name calling, & sexual violence perpetration & victimization)
- University of Illinois bully scale
- University of Illinois victimization scale
- University of Illinois fighting scale
- Homophobic content agent target scale
- Modified version of the American Association of University Women Sexual Harassment Survey
High income Illinois & Kansas (N Americas) African-American, Hispanic, White/Caucasian, biracial/all other Both Low SES
22 (Good) Significant intervention effects were found for physical aggression. Self-reported physical aggression was 42% less likely to be reported by students in the intervention schools than those in control schools, p < .05 Verbal/relational bully perpetration, peer victimization, homophobic teasing, and sexual violence did not yield significant intervention effects ES: AOR = .70 (small) for physical aggression
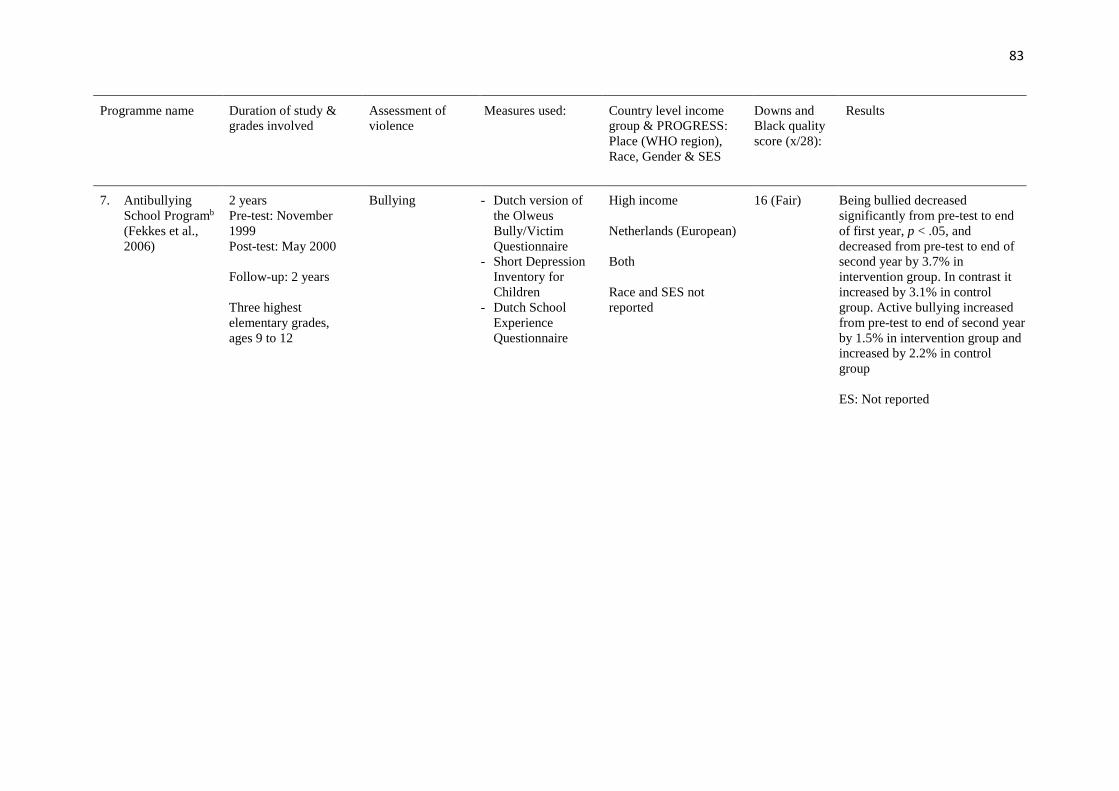
83
Programme name Duration of study & grades involved
Assessment of violence
Measures used: Country level income group & PROGRESS: Place (WHO region), Race, Gender & SES
Downs and Black quality score (x/28):
Results
7. Antibullying School Programb
(Fekkes et al., 2006)
2 years Pre-test: November 1999 Post-test: May 2000 Follow-up: 2 years Three highest elementary grades, ages 9 to 12
Bullying - Dutch version of the Olweus Bully/Victim Questionnaire
- Short Depression Inventory for Children
- Dutch School Experience Questionnaire
High income Netherlands (European) Both Race and SES not reported
16 (Fair) Being bullied decreased significantly from pre-test to end of first year, p < .05, and decreased from pre-test to end of second year by 3.7% in intervention group. In contrast it increased by 3.1% in control group. Active bullying increased from pre-test to end of second year by 1.5% in intervention group and increased by 2.2% in control group ES: Not reported
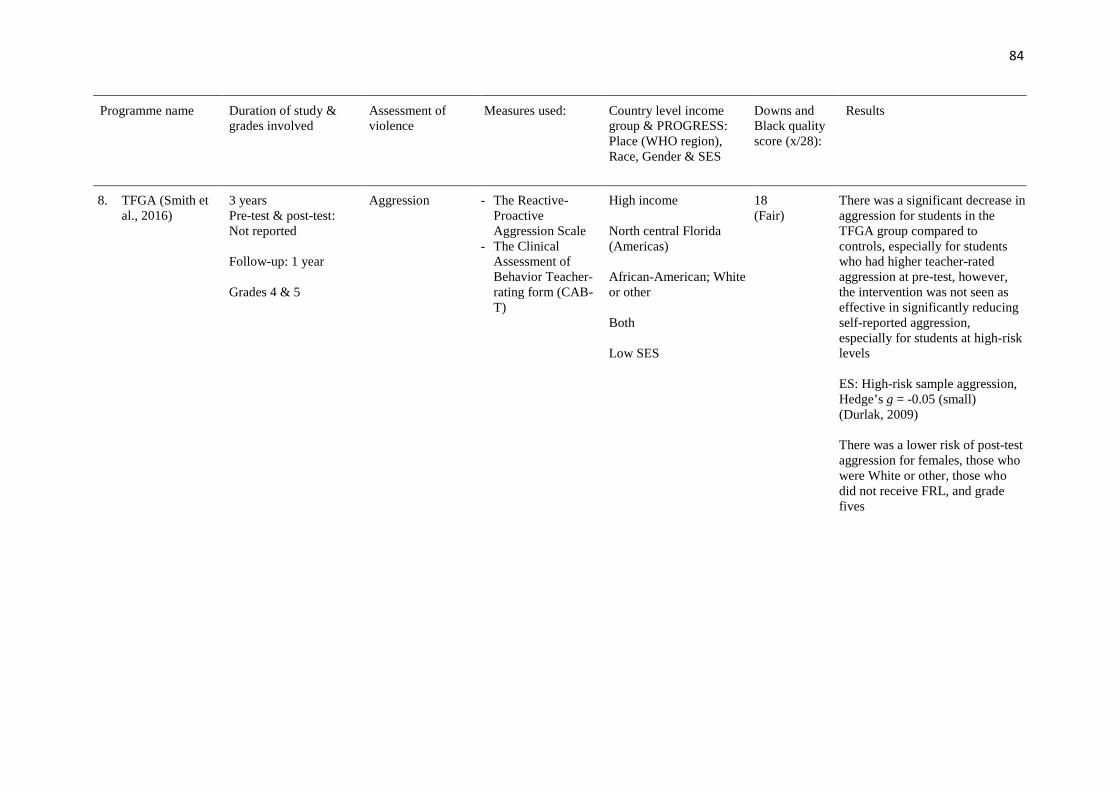
84
Programme name Duration of study & grades involved
Assessment of violence
Measures used: Country level income group & PROGRESS: Place (WHO region), Race, Gender & SES
Downs and Black quality score (x/28):
Results
8. TFGA (Smith et al., 2016)
3 years Pre-test & post-test: Not reported Follow-up: 1 year Grades 4 & 5
Aggression - The Reactive-Proactive Aggression Scale
- The Clinical Assessment of Behavior Teacher-rating form (CAB-T)
High income North central Florida (Americas) African-American; White or other Both Low SES
18 (Fair)
There was a significant decrease in aggression for students in the TFGA group compared to controls, especially for students who had higher teacher-rated aggression at pre-test, however, the intervention was not seen as effective in significantly reducing self-reported aggression, especially for students at high-risk levels ES: High-risk sample aggression, Hedge’s g = -0.05 (small) (Durlak, 2009) There was a lower risk of post-test aggression for females, those who were White or other, those who did not receive FRL, and grade fives
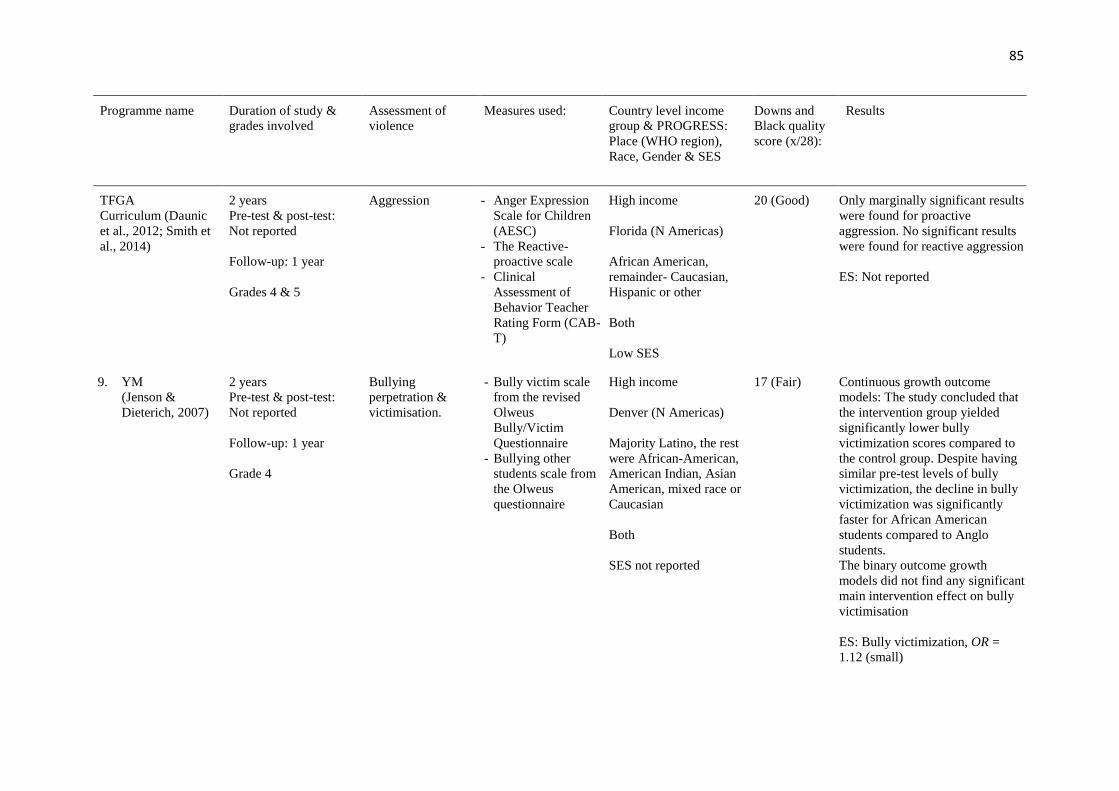
85
Programme name Duration of study & grades involved
Assessment of violence
Measures used: Country level income group & PROGRESS: Place (WHO region), Race, Gender & SES
Downs and Black quality score (x/28):
Results
TFGA Curriculum (Daunic et al., 2012; Smith et al., 2014)
2 years Pre-test & post-test: Not reported Follow-up: 1 year Grades 4 & 5
Aggression - Anger Expression Scale for Children (AESC)
- The Reactive-proactive scale
- Clinical Assessment of Behavior Teacher Rating Form (CAB-T)
High income Florida (N Americas) African American, remainder- Caucasian, Hispanic or other Both Low SES
20 (Good) Only marginally significant results were found for proactive aggression. No significant results were found for reactive aggression ES: Not reported
9. YM (Jenson & Dieterich, 2007)
2 years Pre-test & post-test: Not reported Follow-up: 1 year Grade 4
Bullying perpetration & victimisation.
- Bully victim scale from the revised Olweus Bully/Victim Questionnaire
- Bullying other students scale from the Olweus questionnaire
High income Denver (N Americas) Majority Latino, the rest were African-American, American Indian, Asian American, mixed race or Caucasian Both SES not reported
17 (Fair) Continuous growth outcome models: The study concluded that the intervention group yielded significantly lower bully victimization scores compared to the control group. Despite having similar pre-test levels of bully victimization, the decline in bully victimization was significantly faster for African American students compared to Anglo students. The binary outcome growth models did not find any significant main intervention effect on bully victimisation ES: Bully victimization, OR = 1.12 (small)
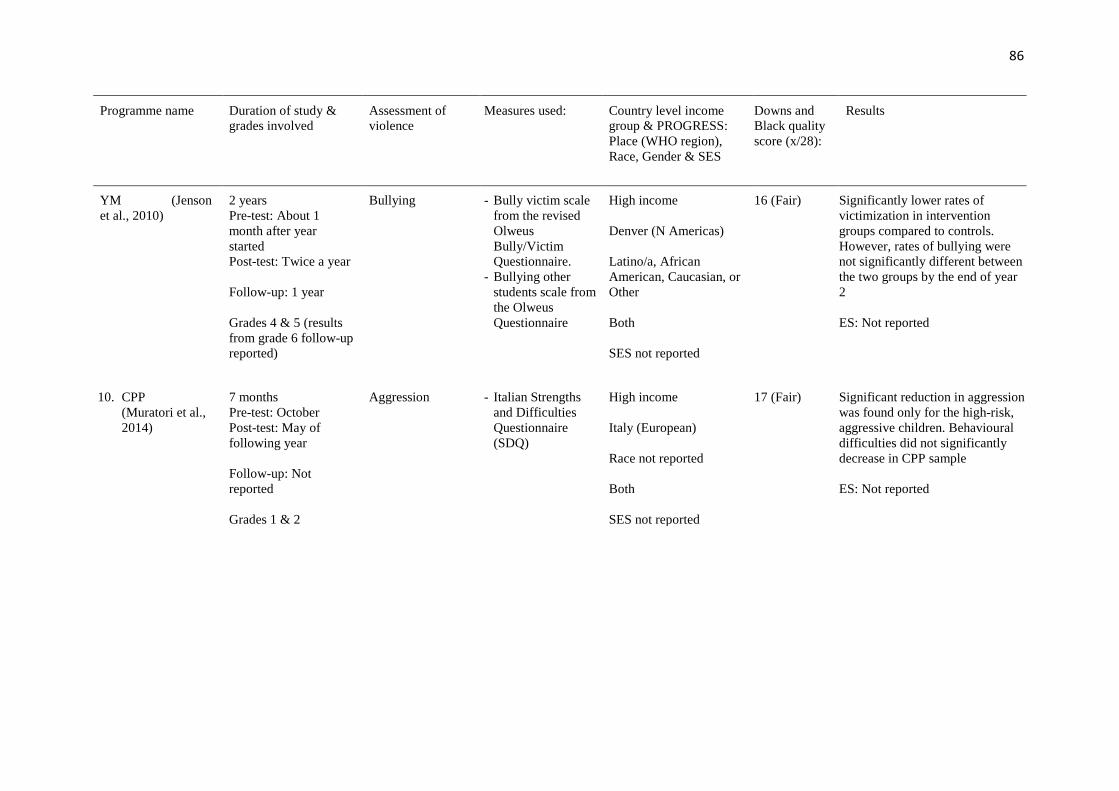
86
Programme name Duration of study & grades involved
Assessment of violence
Measures used: Country level income group & PROGRESS: Place (WHO region), Race, Gender & SES
Downs and Black quality score (x/28):
Results
YM (Jenson et al., 2010)
2 years Pre-test: About 1 month after year started Post-test: Twice a year Follow-up: 1 year Grades 4 & 5 (results from grade 6 follow-up reported)
Bullying - Bully victim scale from the revised Olweus Bully/Victim Questionnaire.
- Bullying other students scale from the Olweus Questionnaire
High income Denver (N Americas) Latino/a, African American, Caucasian, or Other Both SES not reported
16 (Fair) Significantly lower rates of victimization in intervention groups compared to controls. However, rates of bullying were not significantly different between the two groups by the end of year 2 ES: Not reported
10. CPP (Muratori et al., 2014)
7 months Pre-test: October Post-test: May of following year Follow-up: Not reported Grades 1 & 2
Aggression - Italian Strengths and Difficulties Questionnaire (SDQ)
High income Italy (European) Race not reported Both SES not reported
17 (Fair) Significant reduction in aggression was found only for the high-risk, aggressive children. Behavioural difficulties did not significantly decrease in CPP sample ES: Not reported
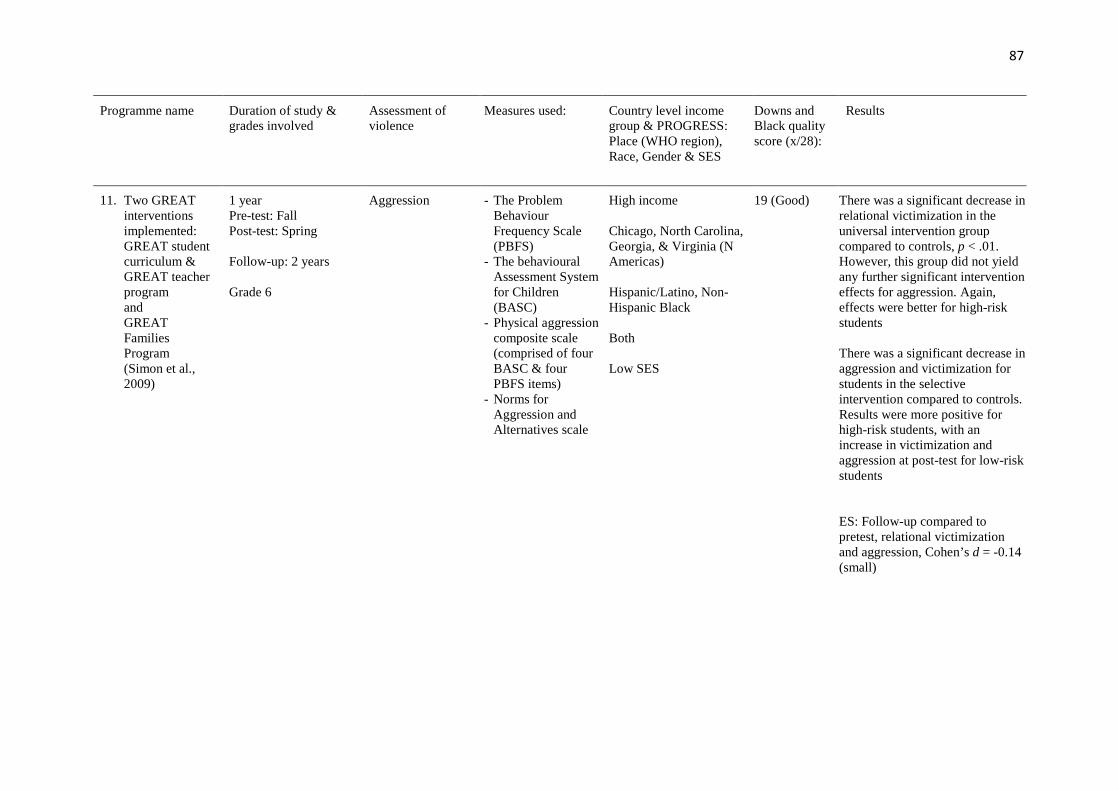
87
Programme name Duration of study & grades involved
Assessment of violence
Measures used: Country level income group & PROGRESS: Place (WHO region), Race, Gender & SES
Downs and Black quality score (x/28):
Results
11. Two GREAT interventions implemented: GREAT student curriculum & GREAT teacher program and GREAT Families Program (Simon et al., 2009)
1 year Pre-test: Fall Post-test: Spring Follow-up: 2 years Grade 6
Aggression - The Problem Behaviour Frequency Scale (PBFS)
- The behavioural Assessment System for Children (BASC)
- Physical aggression composite scale (comprised of four BASC & four PBFS items)
- Norms for Aggression and Alternatives scale
High income Chicago, North Carolina, Georgia, & Virginia (N Americas) Hispanic/Latino, Non-Hispanic Black Both Low SES
19 (Good) There was a significant decrease in relational victimization in the universal intervention group compared to controls, p < .01. However, this group did not yield any further significant intervention effects for aggression. Again, effects were better for high-risk students There was a significant decrease in aggression and victimization for students in the selective intervention compared to controls. Results were more positive for high-risk students, with an increase in victimization and aggression at post-test for low-risk students ES: Follow-up compared to pretest, relational victimization and aggression, Cohen’s d = -0.14 (small)
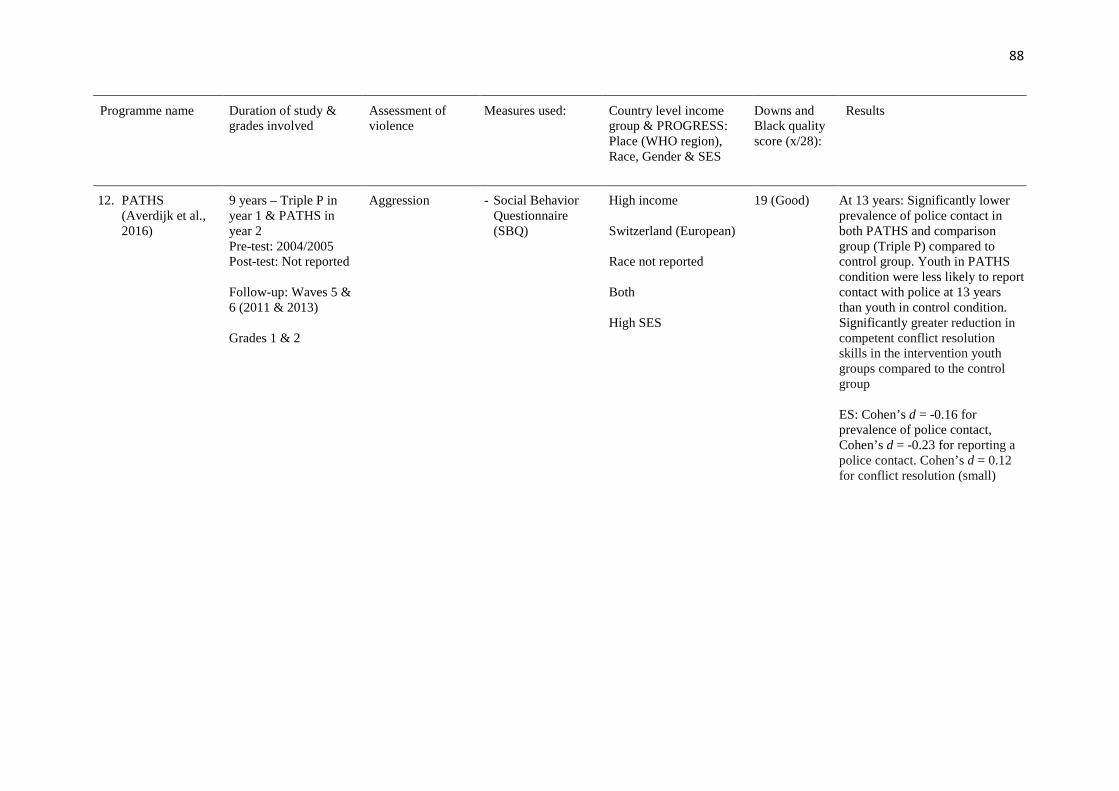
88
Programme name Duration of study & grades involved
Assessment of violence
Measures used: Country level income group & PROGRESS: Place (WHO region), Race, Gender & SES
Downs and Black quality score (x/28):
Results
12. PATHS (Averdijk et al., 2016)
9 years – Triple P in year 1 & PATHS in year 2 Pre-test: 2004/2005 Post-test: Not reported Follow-up: Waves 5 & 6 (2011 & 2013) Grades 1 & 2
Aggression - Social Behavior Questionnaire (SBQ)
High income Switzerland (European) Race not reported Both High SES
19 (Good) At 13 years: Significantly lower prevalence of police contact in both PATHS and comparison group (Triple P) compared to control group. Youth in PATHS condition were less likely to report contact with police at 13 years than youth in control condition. Significantly greater reduction in competent conflict resolution skills in the intervention youth groups compared to the control group ES: Cohen’s d = -0.16 for prevalence of police contact, Cohen’s d = -0.23 for reporting a police contact. Cohen’s d = 0.12 for conflict resolution (small)

89
Programme name Duration of study & grades involved
Assessment of violence
Measures used: Country level income group & PROGRESS: Place (WHO region), Race, Gender & SES
Downs and Black quality score (x/28):
Results
PATHS (Crean & Johnson, 2013)
3 years Pre-test: Fall of grade 3 Post-test: Fall, winter, & spring each year (grades 3, 4, & 5) Follow-up: Not reported Grade 3
Aggression - Teacher Report on Students (TRS) rating scale
- The behavior assessment scale for children-2 (BASC-2) Aggression Subscale, teacher version - administered as part of the TRS
- The Acting Out subscale of the TCRS
- Child Report (CR) - The What would I
do? Self-report assessment, included eight hypothetical vignettes
- Adaptations from the Aggression scale
- The Victimization Scale
High income Northeastern urban school district, Northeastern suburban school district, or Midwestern suburban school district (Americas) White/Caucasian, African American, Other, Hispanic Both Low-middle SES
18 (Fair) Teacher reported measures yielded significant intervention effects According to teacher rated outcomes, students in the PATHS group were less aggressive over time, p = .12. However, victimization over time was not lower according to student report measures in the PATHS group ES: -0.20 (small) (ES = mean difference divided by pooled pre-test standard deviation)
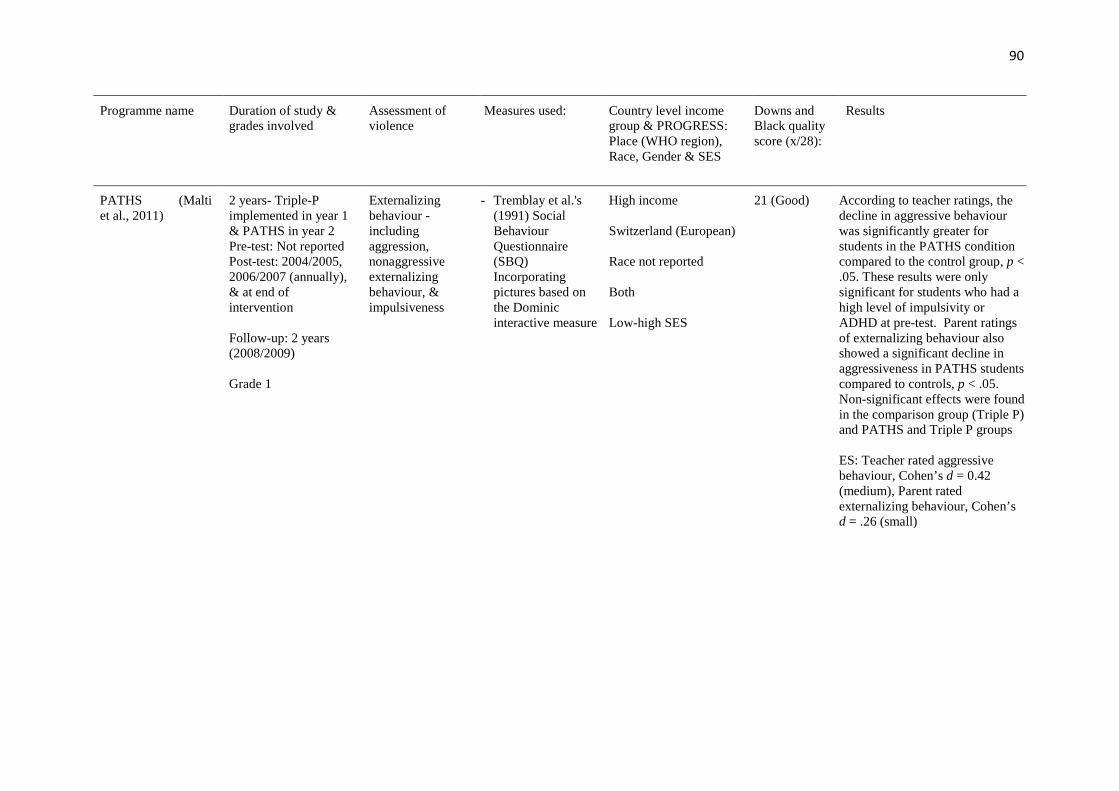
90
Programme name Duration of study & grades involved
Assessment of violence
Measures used: Country level income group & PROGRESS: Place (WHO region), Race, Gender & SES
Downs and Black quality score (x/28):
Results
PATHS (Malti et al., 2011)
2 years- Triple-P implemented in year 1 & PATHS in year 2 Pre-test: Not reported Post-test: 2004/2005, 2006/2007 (annually), & at end of intervention Follow-up: 2 years (2008/2009) Grade 1
Externalizing behaviour - including aggression, nonaggressive externalizing behaviour, & impulsiveness
- Tremblay et al.'s (1991) Social Behaviour Questionnaire (SBQ) Incorporating pictures based on the Dominic interactive measure
High income Switzerland (European) Race not reported Both Low-high SES
21 (Good) According to teacher ratings, the decline in aggressive behaviour was significantly greater for students in the PATHS condition compared to the control group, p < .05. These results were only significant for students who had a high level of impulsivity or ADHD at pre-test. Parent ratings of externalizing behaviour also showed a significant decline in aggressiveness in PATHS students compared to controls, p < .05. Non-significant effects were found in the comparison group (Triple P) and PATHS and Triple P groups ES: Teacher rated aggressive behaviour, Cohen’s d = 0.42 (medium), Parent rated externalizing behaviour, Cohen’s d = .26 (small)
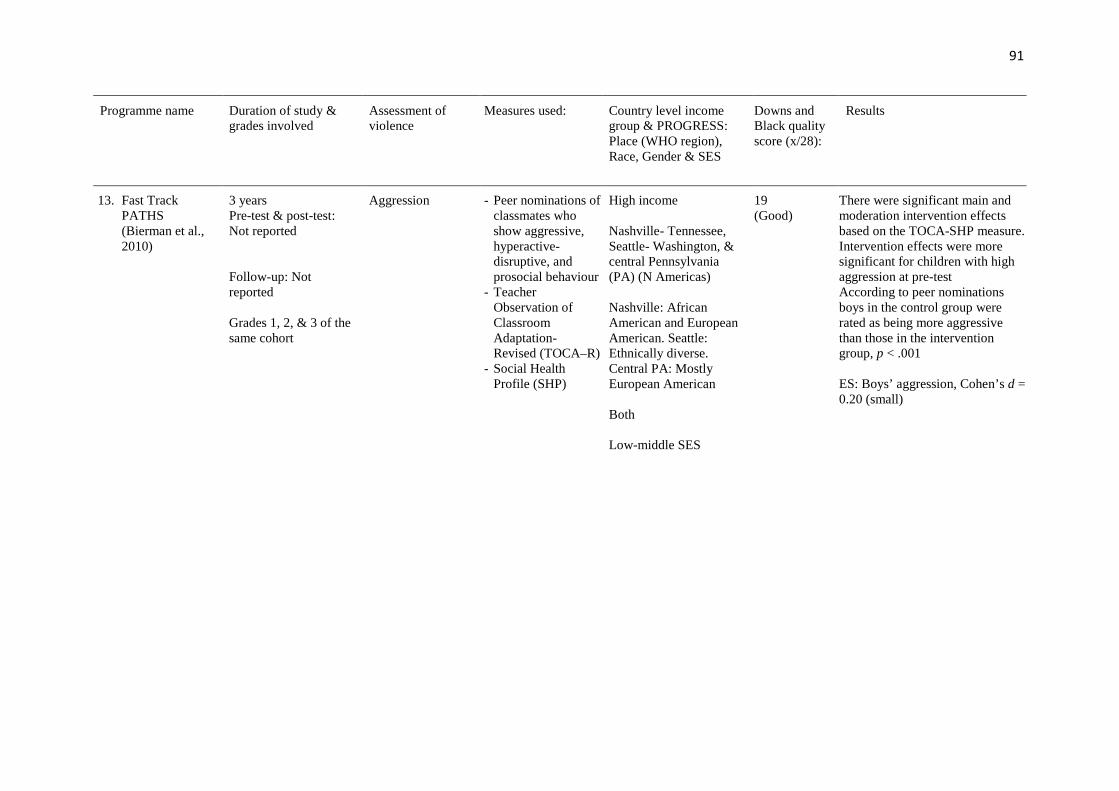
91
Programme name Duration of study & grades involved
Assessment of violence
Measures used: Country level income group & PROGRESS: Place (WHO region), Race, Gender & SES
Downs and Black quality score (x/28):
Results
13. Fast Track PATHS (Bierman et al., 2010)
3 years Pre-test & post-test: Not reported Follow-up: Not reported Grades 1, 2, & 3 of the same cohort
Aggression - Peer nominations of classmates who show aggressive, hyperactive-disruptive, and prosocial behaviour
- Teacher Observation of Classroom Adaptation- Revised (TOCA–R)
- Social Health Profile (SHP)
High income Nashville- Tennessee, Seattle- Washington, & central Pennsylvania (PA) (N Americas) Nashville: African American and European American. Seattle: Ethnically diverse. Central PA: Mostly European American Both Low-middle SES
19 (Good)
There were significant main and moderation intervention effects based on the TOCA-SHP measure. Intervention effects were more significant for children with high aggression at pre-test According to peer nominations boys in the control group were rated as being more aggressive than those in the intervention group, p < .001 ES: Boys’ aggression, Cohen’s d = 0.20 (small)
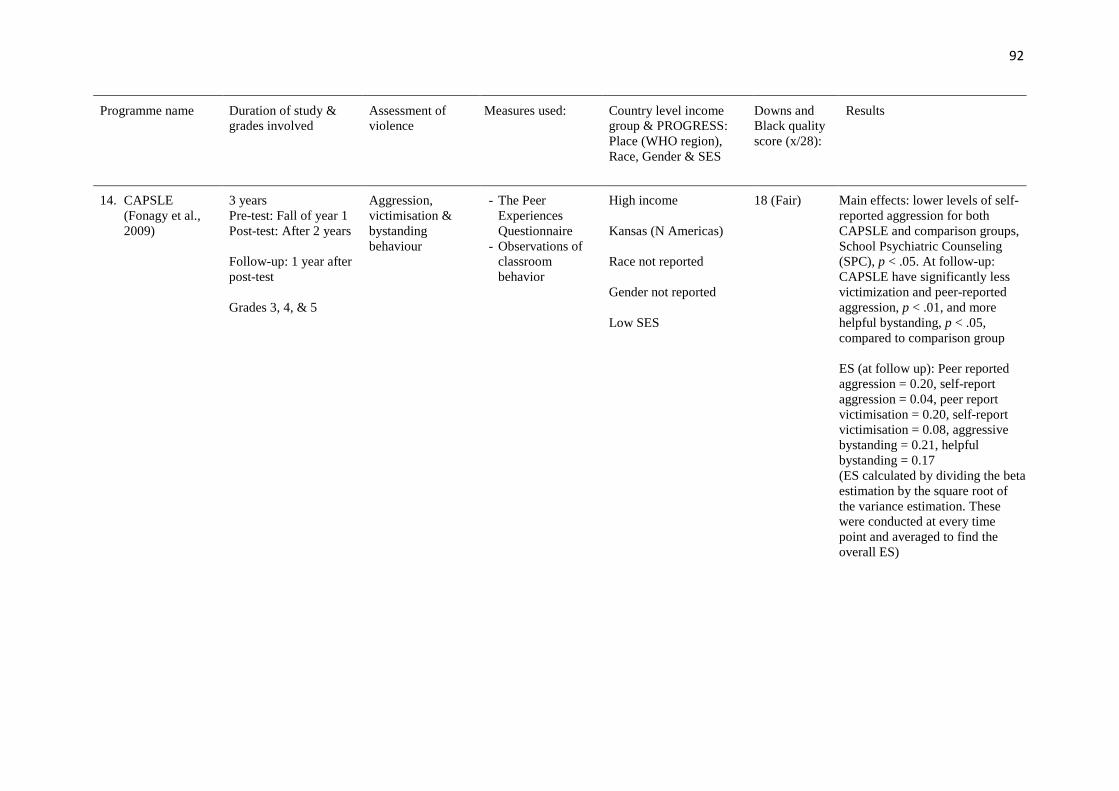
92
Programme name Duration of study & grades involved
Assessment of violence
Measures used: Country level income group & PROGRESS: Place (WHO region), Race, Gender & SES
Downs and Black quality score (x/28):
Results
14. CAPSLE (Fonagy et al., 2009)
3 years Pre-test: Fall of year 1 Post-test: After 2 years Follow-up: 1 year after post-test Grades 3, 4, & 5
Aggression, victimisation & bystanding behaviour
- The Peer Experiences Questionnaire
- Observations of classroom behavior
High income Kansas (N Americas) Race not reported Gender not reported Low SES
18 (Fair) Main effects: lower levels of self-reported aggression for both CAPSLE and comparison groups, School Psychiatric Counseling (SPC), p < .05. At follow-up: CAPSLE have significantly less victimization and peer-reported aggression, p < .01, and more helpful bystanding, p < .05, compared to comparison group ES (at follow up): Peer reported aggression = 0.20, self-report aggression = 0.04, peer report victimisation = 0.20, self-report victimisation = 0.08, aggressive bystanding = 0.21, helpful bystanding = 0.17 (ES calculated by dividing the beta estimation by the square root of the variance estimation. These were conducted at every time point and averaged to find the overall ES)
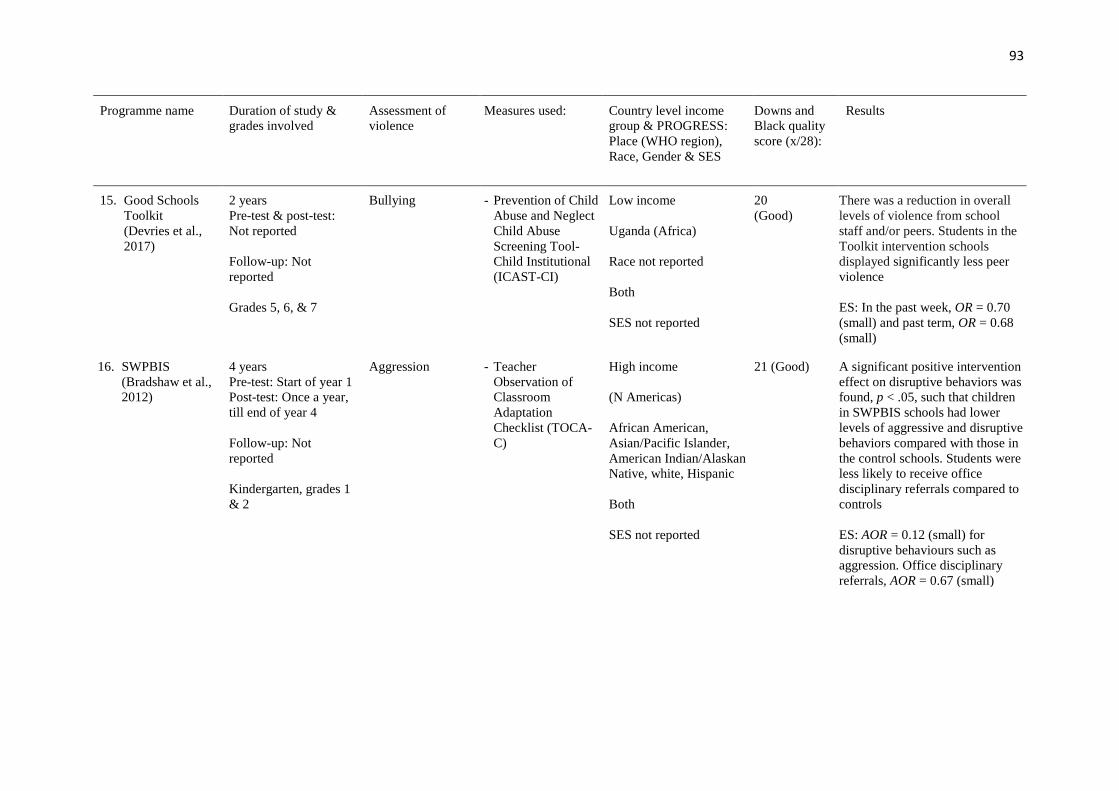
93
Programme name Duration of study & grades involved
Assessment of violence
Measures used: Country level income group & PROGRESS: Place (WHO region), Race, Gender & SES
Downs and Black quality score (x/28):
Results
15. Good Schools Toolkit (Devries et al., 2017)
2 years Pre-test & post-test: Not reported Follow-up: Not reported Grades 5, 6, & 7
Bullying - Prevention of Child Abuse and Neglect Child Abuse Screening Tool-Child Institutional (ICAST-CI)
Low income Uganda (Africa) Race not reported Both SES not reported
20 (Good)
There was a reduction in overall levels of violence from school staff and/or peers. Students in the Toolkit intervention schools displayed significantly less peer violence ES: In the past week, OR = 0.70 (small) and past term, OR = 0.68 (small)
16. SWPBIS (Bradshaw et al., 2012)
4 years Pre-test: Start of year 1 Post-test: Once a year, till end of year 4 Follow-up: Not reported Kindergarten, grades 1 & 2
Aggression - Teacher Observation of Classroom Adaptation Checklist (TOCA-C)
High income (N Americas) African American, Asian/Pacific Islander, American Indian/Alaskan Native, white, Hispanic Both SES not reported
21 (Good) A significant positive intervention effect on disruptive behaviors was found, p < .05, such that children in SWPBIS schools had lower levels of aggressive and disruptive behaviors compared with those in the control schools. Students were less likely to receive office disciplinary referrals compared to controls ES: AOR = 0.12 (small) for disruptive behaviours such as aggression. Office disciplinary referrals, AOR = 0.67 (small)
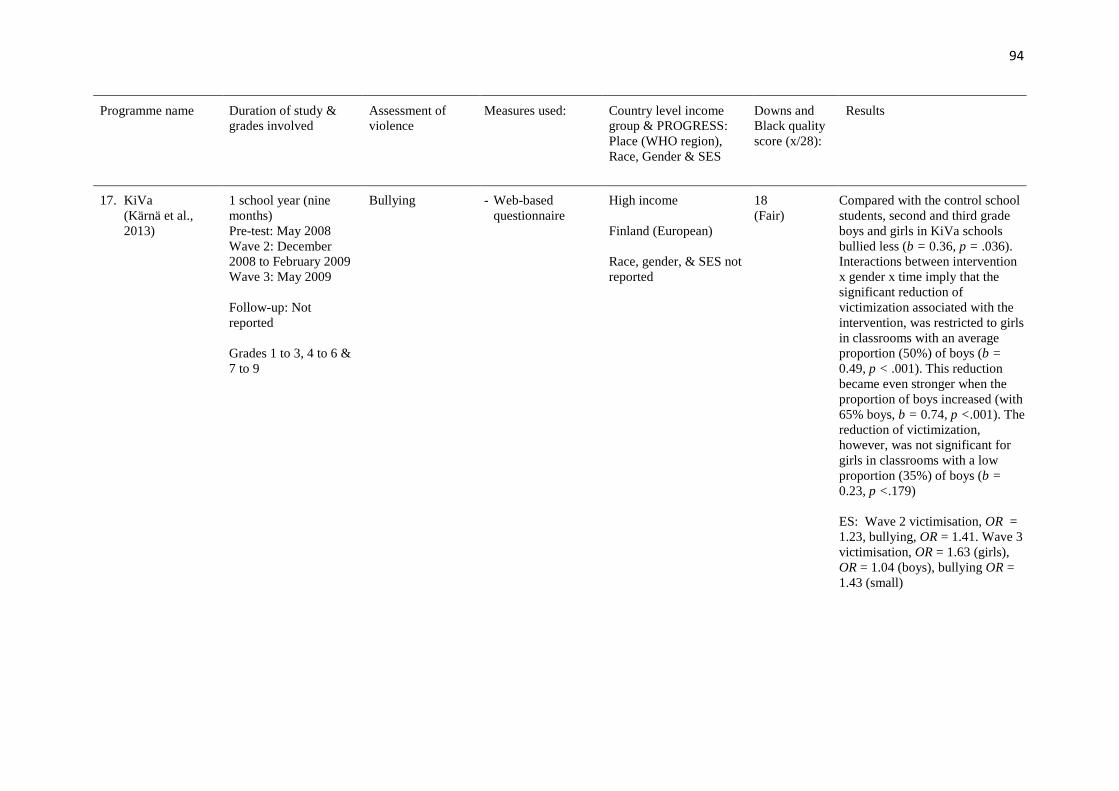
94
Programme name Duration of study & grades involved
Assessment of violence
Measures used: Country level income group & PROGRESS: Place (WHO region), Race, Gender & SES
Downs and Black quality score (x/28):
Results
17. KiVa (Kärnä et al., 2013)
1 school year (nine months) Pre-test: May 2008 Wave 2: December 2008 to February 2009 Wave 3: May 2009 Follow-up: Not reported Grades 1 to 3, 4 to 6 & 7 to 9
Bullying - Web-based questionnaire
High income Finland (European) Race, gender, & SES not reported
18 (Fair)
Compared with the control school students, second and third grade boys and girls in KiVa schools bullied less (b = 0.36, p = .036). Interactions between intervention x gender x time imply that the significant reduction of victimization associated with the intervention, was restricted to girls in classrooms with an average proportion (50%) of boys (b = 0.49, p < .001). This reduction became even stronger when the proportion of boys increased (with 65% boys, b = 0.74, p <.001). The reduction of victimization, however, was not significant for girls in classrooms with a low proportion (35%) of boys (b = 0.23, p <.179) ES: Wave 2 victimisation, OR = 1.23, bullying, OR = 1.41. Wave 3 victimisation, OR = 1.63 (girls), OR = 1.04 (boys), bullying OR = 1.43 (small)
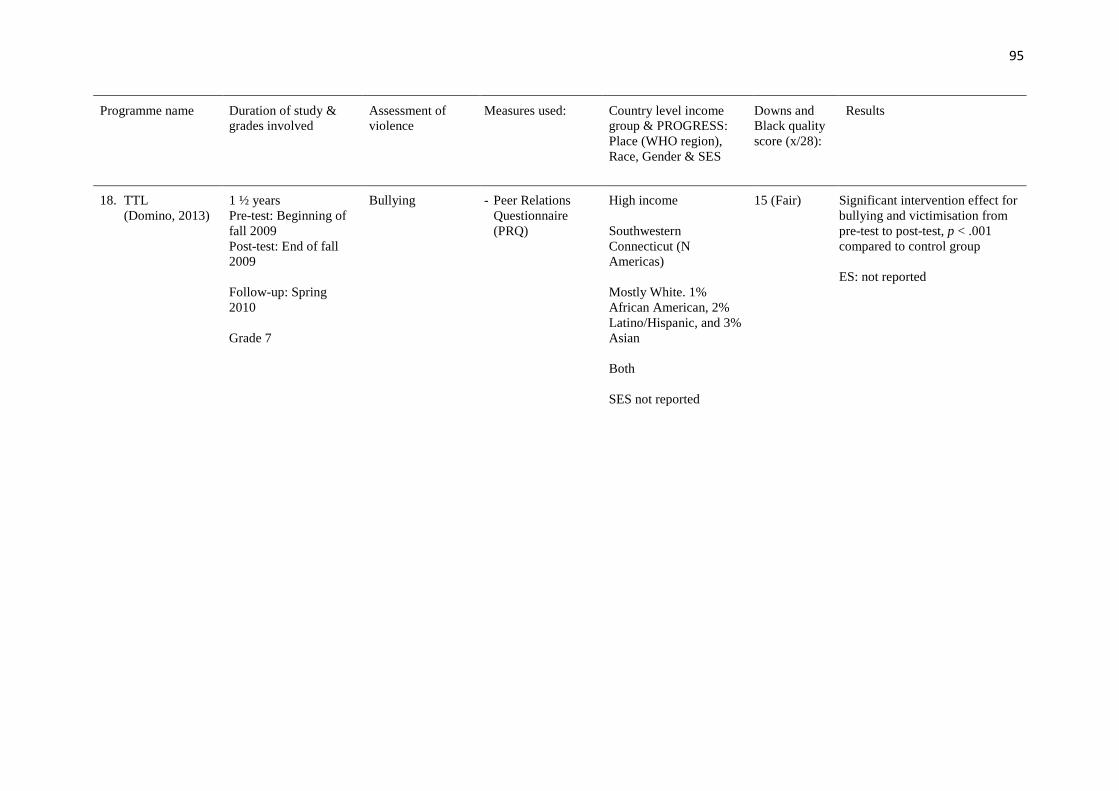
95
Programme name Duration of study & grades involved
Assessment of violence
Measures used: Country level income group & PROGRESS: Place (WHO region), Race, Gender & SES
Downs and Black quality score (x/28):
Results
18. TTL (Domino, 2013)
1 ½ years Pre-test: Beginning of fall 2009 Post-test: End of fall 2009 Follow-up: Spring 2010 Grade 7
Bullying - Peer Relations Questionnaire (PRQ)
High income Southwestern Connecticut (N Americas) Mostly White. 1% African American, 2% Latino/Hispanic, and 3% Asian Both SES not reported
15 (Fair) Significant intervention effect for bullying and victimisation from pre-test to post-test, p < .001 compared to control group ES: not reported
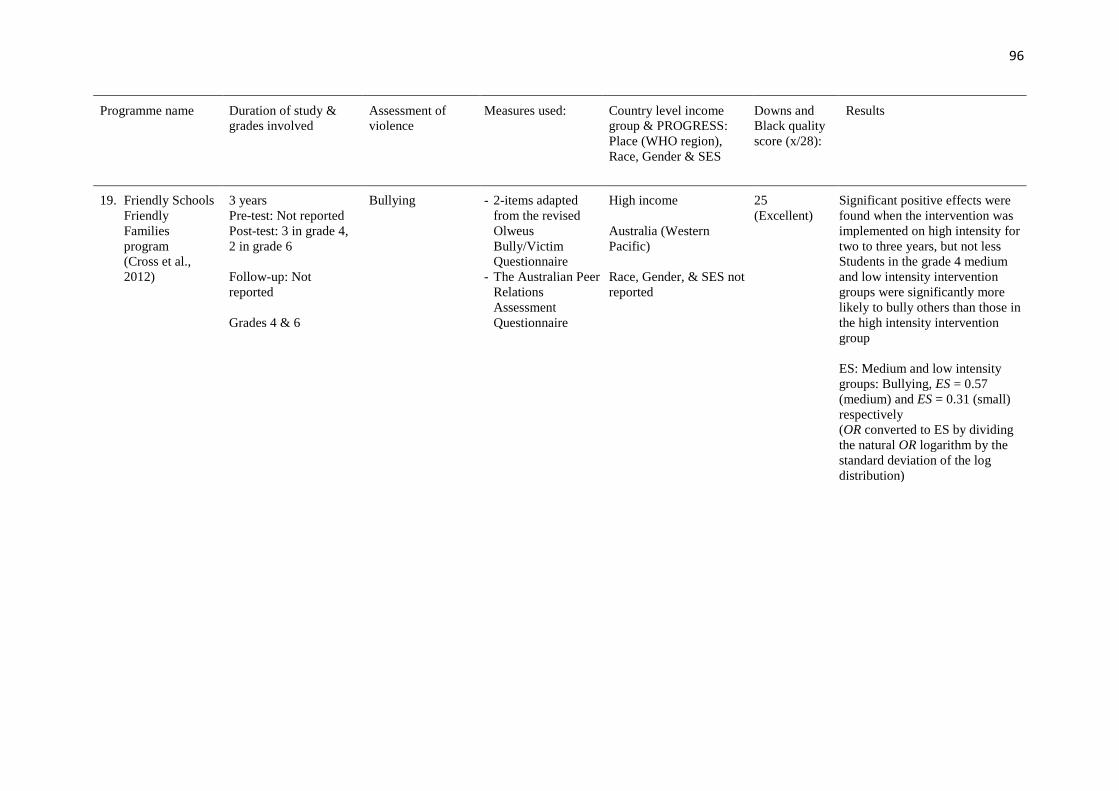
96
Programme name Duration of study & grades involved
Assessment of violence
Measures used: Country level income group & PROGRESS: Place (WHO region), Race, Gender & SES
Downs and Black quality score (x/28):
Results
19. Friendly Schools Friendly Families program (Cross et al., 2012)
3 years Pre-test: Not reported Post-test: 3 in grade 4, 2 in grade 6 Follow-up: Not reported Grades 4 & 6
Bullying - 2-items adapted from the revised Olweus Bully/Victim Questionnaire
- The Australian Peer Relations Assessment Questionnaire
High income Australia (Western Pacific) Race, Gender, & SES not reported
25 (Excellent)
Significant positive effects were found when the intervention was implemented on high intensity for two to three years, but not less Students in the grade 4 medium and low intensity intervention groups were significantly more likely to bully others than those in the high intensity intervention group ES: Medium and low intensity groups: Bullying, ES = 0.57 (medium) and ES = 0.31 (small) respectively (OR converted to ES by dividing the natural OR logarithm by the standard deviation of the log distribution)
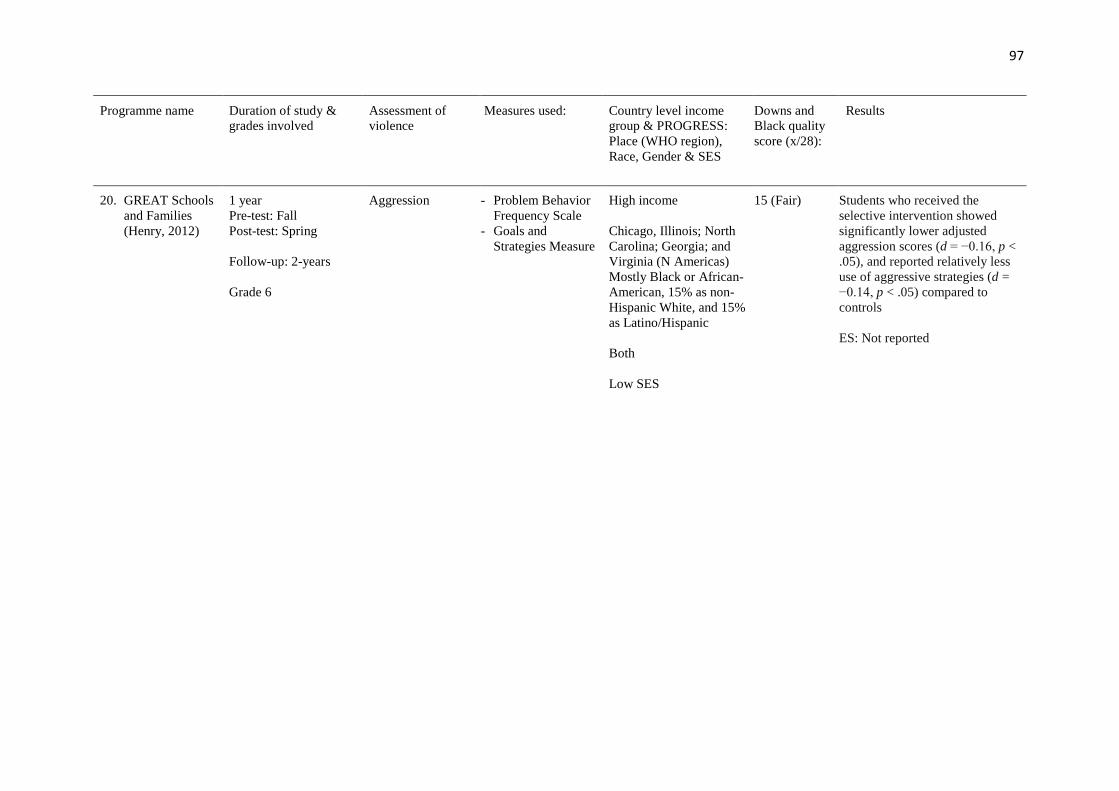
97
Programme name Duration of study & grades involved
Assessment of violence
Measures used: Country level income group & PROGRESS: Place (WHO region), Race, Gender & SES
Downs and Black quality score (x/28):
Results
20. GREAT Schools and Families (Henry, 2012)
1 year Pre-test: Fall Post-test: Spring Follow-up: 2-years Grade 6
Aggression - Problem Behavior Frequency Scale
- Goals and Strategies Measure
High income Chicago, Illinois; North Carolina; Georgia; and Virginia (N Americas) Mostly Black or African-American, 15% as non-Hispanic White, and 15% as Latino/Hispanic Both
Low SES
15 (Fair) Students who received the selective intervention showed significantly lower adjusted aggression scores (d = −0.16, p < .05), and reported relatively less use of aggressive strategies (d = −0.14, p < .05) compared to controls ES: Not reported
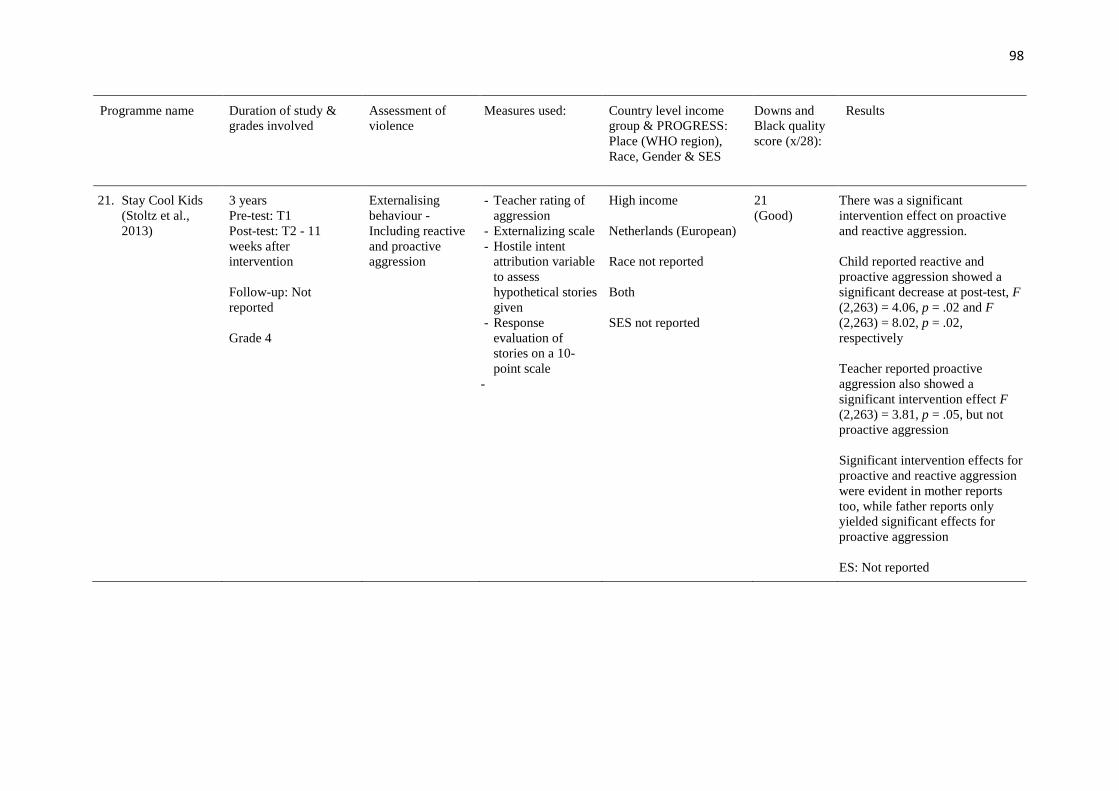
98
Programme name Duration of study & grades involved
Assessment of violence
Measures used: Country level income group & PROGRESS: Place (WHO region), Race, Gender & SES
Downs and Black quality score (x/28):
Results
21. Stay Cool Kids (Stoltz et al., 2013)
3 years Pre-test: T1 Post-test: T2 - 11 weeks after intervention Follow-up: Not reported Grade 4
Externalising behaviour - Including reactive and proactive aggression
- Teacher rating of aggression
- Externalizing scale - Hostile intent
attribution variable to assess hypothetical stories given
- Response evaluation of stories on a 10-point scale
-
High income Netherlands (European) Race not reported Both SES not reported
21 (Good)
There was a significant intervention effect on proactive and reactive aggression. Child reported reactive and proactive aggression showed a significant decrease at post-test, F (2,263) = 4.06, p = .02 and F (2,263) = 8.02, p = .02, respectively Teacher reported proactive aggression also showed a significant intervention effect F (2,263) = 3.81, p = .05, but not proactive aggression Significant intervention effects for proactive and reactive aggression were evident in mother reports too, while father reports only yielded significant effects for proactive aggression ES: Not reported
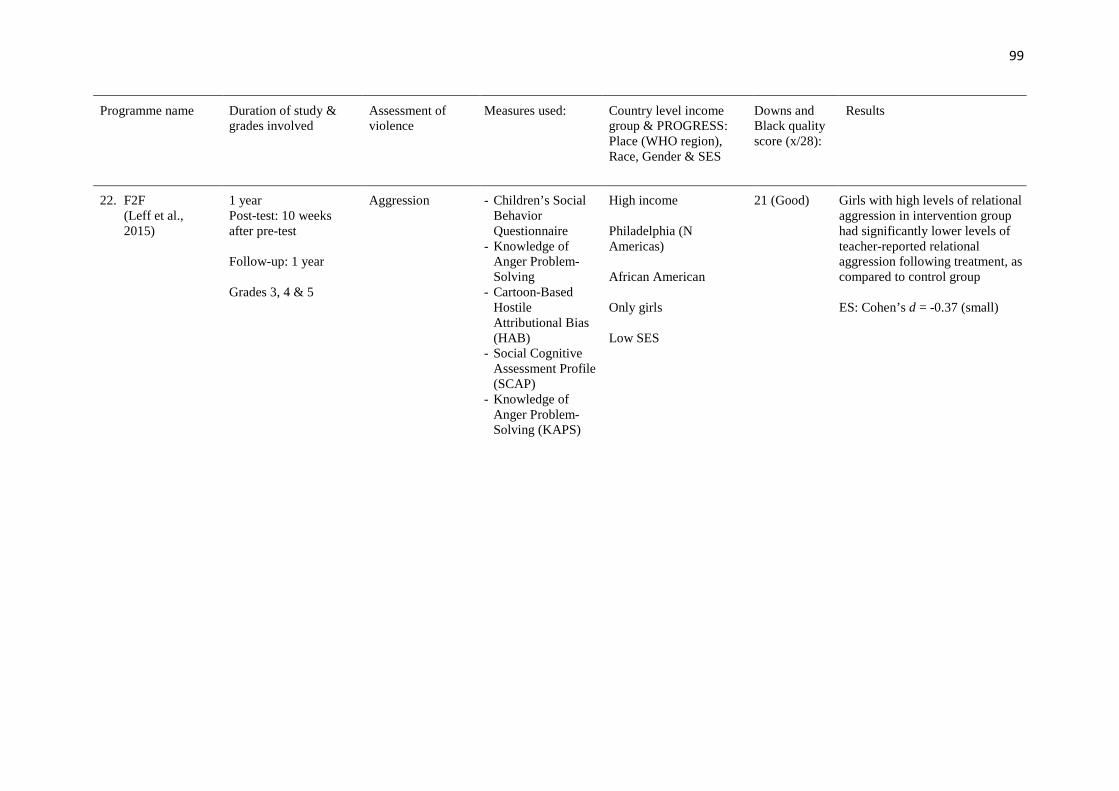
99
Programme name Duration of study & grades involved
Assessment of violence
Measures used: Country level income group & PROGRESS: Place (WHO region), Race, Gender & SES
Downs and Black quality score (x/28):
Results
22. F2F (Leff et al., 2015)
1 year Post-test: 10 weeks after pre-test Follow-up: 1 year Grades 3, 4 & 5
Aggression - Children’s Social Behavior Questionnaire
- Knowledge of Anger Problem-Solving
- Cartoon-Based Hostile Attributional Bias (HAB)
- Social Cognitive Assessment Profile (SCAP)
- Knowledge of Anger Problem-Solving (KAPS)
High income Philadelphia (N Americas) African American Only girls Low SES
21 (Good) Girls with high levels of relational aggression in intervention group had significantly lower levels of teacher-reported relational aggression following treatment, as compared to control group ES: Cohen’s d = -0.37 (small)
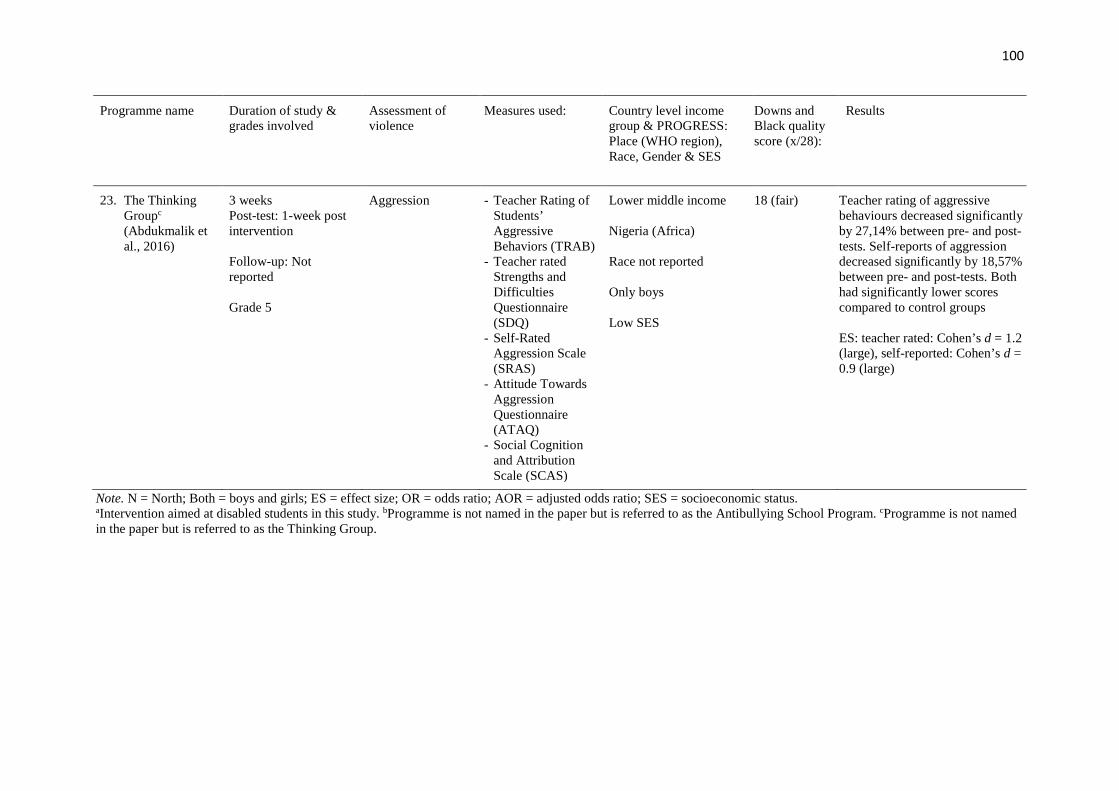
100
Programme name Duration of study & grades involved
Assessment of violence
Measures used: Country level income group & PROGRESS: Place (WHO region), Race, Gender & SES
Downs and Black quality score (x/28):
Results
23. The Thinking Groupc
(Abdukmalik et al., 2016)
3 weeks Post-test: 1-week post intervention Follow-up: Not reported Grade 5
Aggression - Teacher Rating of Students’ Aggressive Behaviors (TRAB)
- Teacher rated Strengths and Difficulties Questionnaire (SDQ)
- Self-Rated Aggression Scale (SRAS)
- Attitude Towards Aggression Questionnaire (ATAQ)
- Social Cognition and Attribution Scale (SCAS)
Lower middle income Nigeria (Africa) Race not reported Only boys Low SES
18 (fair) Teacher rating of aggressive behaviours decreased significantly by 27,14% between pre- and post-tests. Self-reports of aggression decreased significantly by 18,57% between pre- and post-tests. Both had significantly lower scores compared to control groups ES: teacher rated: Cohen’s d = 1.2 (large), self-reported: Cohen’s d = 0.9 (large)
Note. N = North; Both = boys and girls; ES = effect size; OR = odds ratio; AOR = adjusted odds ratio; SES = socioeconomic status. aIntervention aimed at disabled students in this study. bProgramme is not named in the paper but is referred to as the Antibullying School Program. cProgramme is not named in the paper but is referred to as the Thinking Group.