Embed Size (px)
Citation preview
ORIGINAL RESEARCH
Effectiveness and Safety of a Novel Care Modelfor the Management of Type 2 Diabetes at 1Year:An Open-Label, Non-Randomized, Controlled Study
Sarah J. Hallberg . Amy L. McKenzie . Paul T. Williams .
Nasir H. Bhanpuri . Anne L. Peters . Wayne W. Campbell . Tamara L. Hazbun .
Brittanie M. Volk . James P. McCarter . Stephen D. Phinney .
Jeff S. Volek
Received: December 28, 2017 / Published online: February 7, 2018� The Author(s) 2018. This article is an open access publication
ABSTRACT
Introduction: Carbohydrate restriction mark-edly improves glycemic control in patients withtype 2 diabetes (T2D) but necessitates promptmedication changes. Therefore, we assessed theeffectiveness and safety of a novel care modelproviding continuous remote care with medi-cation management based on biometric feed-back combined with the metabolic approach ofnutritional ketosis for T2D management.
Methods: We conducted an open-label, non-randomized, controlled, before-and-after 1-yearstudy of this continuous care intervention (CCI)and usual care (UC). Primary outcomes wereglycosylated hemoglobin (HbA1c), weight, andmedication use. Secondary outcomes includedfasting serum glucose and insulin, HOMA-IR,blood lipids and lipoproteins, liver and kidneyfunction markers, and high-sensitivity C-reac-tive protein (hsCRP).Results: 349 adults with T2D enrolled: CCI:n = 262 [mean (SD); 54 (8) years, 116.5(25.9) kg, 40.4 (8.8) kg m2, 92% obese, 88%prescribed T2D medication]; UC: n = 87 (52(10) years, 105.6 (22.15) kg, 36.72 (7.26) kg m2,82% obese, 87% prescribed T2D medication].218 participants (83%) remained enrolled in theCCI at 1 year. Intention-to-treat analysis of theCCI (mean ± SE) revealed HbA1c declined from
Enhanced content To view enhanced content for thisarticle go to https://doi.org/10.6084/m9.figshare.5803119.
Electronic supplementary material The onlineversion of this article (https://doi.org/10.1007/s13300-018-0373-9) contains supplementary material, which isavailable to authorized users.
S. J. Hallberg � T. L. HazbunMedically Supervised Weight Loss, IndianaUniversity Health Arnett, Lafayette, IN, USA
S. J. Hallberg � A. L. McKenzie (&) �N. H. Bhanpuri � B. M. Volk � J. P. McCarter �S. D. Phinney � J. S. VolekVirta Health, San Francisco, CA, USAe-mail: [email protected]
P. T. WilliamsIndependent Consultant, Lafayette, CA, USA
A. L. PetersKeck School of Medicine, University of SouthernCalifornia, Los Angeles, CA, USA
W. W. CampbellDepartment of Nutrition Science, PurdueUniversity, West Lafayette, IN, USA
J. P. McCarterDepartment of Genetics, Washington UniversitySchool of Medicine, St. Louis, MO, USA
J. S. VolekDepartment of Human Sciences, The Ohio StateUniversity, Columbus, OH, USA
Diabetes Ther (2018) 9:583–612
https://doi.org/10.1007/s13300-018-0373-9
59.6 ± 1.0 to 45.2 ± 0.8 mmol mol-1 (7.6 ±
0.09% to 6.3 ± 0.07%, P\1.0 9 10-16), weightdeclined 13.8 ± 0.71 kg (P\1.0 9 10-16), andT2D medication prescription other than met-formin declined from 56.9 ± 3.1% to 29.7 ±
3.0% (P\1.0 9 10-16). Insulin therapy wasreduced or eliminated in 94% of users; sul-fonylureas were entirely eliminated in the CCI.No adverse events were attributed to the CCI.Additional CCI 1-year effects were HOMA-IR- 55% (P = 3.2 9 10-5), hsCRP - 39% (P\1.09 10-16), triglycerides - 24% (P\1.0 9 10-16),HDL-cholesterol ? 18% (P\1.0 9 10-16), andLDL-cholesterol ? 10% (P = 5.1 9 10-5); serumcreatinine and liver enzymes (ALT, AST, andALP) declined (P B 0.0001), and apolipoproteinB was unchanged (P = 0.37). UC participantshad no significant changes in biomarkers orT2D medication prescription at 1 year.Conclusions: These results demonstrate thata novel metabolic and continuous remotecare model can support adults with T2D tosafely improve HbA1c, weight, and otherbiomarkers while reducing diabetes medica-tion use.ClinicalTrials.gov Identifier: NCT02519309.Funding: Virta Health Corp.
PLAIN LANGUAGE SUMMARY
Treatments for type 2 diabetes (T2D) haveimproved, yet T2D and being overweight arestill significant public health concerns. Bloodsugar in patients with T2D can improve quicklywhen patients eat significantly fewer dietarycarbohydrates. However, this demands carefulmedicine management by doctors, and patientsneed support and frequent contact with healthproviders to sustain this way of living. Thepurpose of this study was to evaluate if a newcare model with very low dietary carbohydrateintake and continuous supervision by a healthcoach and doctor could safely lower HbA1c,weight and need for medicines after 1 year inadults with T2D. 262 adults with T2D volun-teered to participate in this continuous careintervention (CCI) along with 87 adults withT2D receiving usual care (UC) from their
doctors and diabetes education program. After 1year, patients in the CCI, on average, loweredHbA1c from 7.6 to 6.3%, lost 12% of their bodyweight, and reduced diabetes medicine use.94% of patients who were prescribed insulinreduced or stopped their insulin use, and sul-fonylureas were eliminated in all patients. Par-ticipants in the UC group had no changes toHbA1c, weight or diabetes medicine use overthe year. These changes in CCI participantshappened safely while dyslipidemia and mark-ers of inflammation and liver functionimproved. This suggests the novel care modelstudied here using dietary carbohydrate restric-tion and continuous remote care can safelysupport adults with T2D to lower HbA1c,weight, and medicine use.
Keywords: Beta-hydroxybutyrate;Carbohydrate restriction; HbA1c; Ketosis; Type2 diabetes; Weight loss
AbbreviationsALP Alkaline phosphataseALT Alanine aminotransferaseApoB Apolipoprotein BAST Aspartate aminotransferaseBHB Beta-hydroxybutyrateBUN Blood urea nitrogenCBC Complete blood countCCI Continuous care interventionCCI-onsite Subset of participants who selected
on-site educationCCI-web Subset of participants who selected
web-based educationCMP Complete metabolic panelDPP-4 Dipeptidyl peptidase-4 inhibitoreGFR Estimated glomerular filtration
rateFT4 Free T4GLP-1 Glucagon-like peptide 1 receptor
agonistsHOMA-IR Homeostatic model assessment of
insulin resistancehsCRP High-sensitivity C-reactive proteinPCP Primary care providerSGLT-2 Sodium glucose co-transporter 2
inhibitorsT2D Type 2 diabetes
584 Diabetes Ther (2018) 9:583–612
TSH Thyroid stimulating hormoneUC Usual careVLCD Very low energy diet
INTRODUCTION
The number of people living with diabetesworldwide nearly quadrupled since 1980, esti-mated at 422 million in 2014 [1]. In the USA,the Centers for Disease Control reports30.3 million adults presently live with diabetes,and it is among the leading causes of death [2].Treatment modalities for type 2 diabetes (T2D)have demonstrated varying success. Intensivelifestyle interventions are effective treatmentsfor obese individuals with T2D when weightloss is achieved and sustained [3]. Evidence forimproved cardiovascular outcomes in patientswith T2D prescribed glucagon-like peptide 1receptor agonists (GLP-1) and sodium glucoseco-transporter 2 inhibitors (SGLT-2) is increas-ing [4, 5]. Forty percent of patients undergoingbariatric surgery demonstrate substantialimprovements in glycemic control after 1 yearand many achieve T2D remission [6]. Despiteadvancements in treatment options, cost, sideeffects, adherence, and disease progressionremain barriers.
Guidelines for T2D management recom-mend lifestyle change and weight loss [7, 8].However, a fraction of individuals are successfulat long-term weight loss maintenance and truedisease remission is uncommon [3, 9].Mediterranean-style, DASH, and plant-baseddiets, sometimes with prescribed energyrestriction, are recommended, but effectivenessdata are limited [7] and low fat diets have notbeen shown to be superior for weight loss [10].Commercially available weight loss programshave demonstrated short-term success in gly-cemic control, but continued success at 1 year isuncommon [11].
Glycemic control can be achieved quicklywith carbohydrate restriction via very lowenergy diets (400–800 kcal day-1; VLCD) [12].However, VLCD are necessarily temporary andoutcomes often revert when patients resumeformer dietary patterns. Alternatively,
nutritional ketosis, achieved by consumingmoderate protein and greatly reduced carbohy-drate, results in similarly increased serum beta-hydroxybutyrate (BHB) concentrations asobserved during VLCD, which signifies a shift tousing fat as the body’s primary fuel source [12].This nutritional therapy may help patientsachieve sustainable glycemic control withoutprescribed energy restriction. Benefit mayaccrue from decreased circulating glucose andinsulin [13], ketone signaling [14, 15], or even-tual weight loss. Studies utilizing carbohydraterestriction observed improved glycemic controland cardiometabolic markers, but were oftenshort-term trials of small groups, excluded sub-jects prescribed insulin, or infrequently moni-tored or achieved ketosis [16–20].
The chronic nature of diabetes care presentsan additional challenge requiring sustainedbehavioral change that is difficult to supportwith traditional medical care including infre-quent provider contact [21]. Adherence to life-style changes may be poor in the absence ofsupport from providers and peers. We thereforehypothesized that a comprehensive care modelthat supports patients to achieve sustainednutritional ketosis while eating to satiety mayhave robust benefits in T2D management. Thisintervention utilizes continuous care throughintensive, digitally enabled support includingtelemedicine access to a medical provider(physician or nurse practitioner), healthcoaching, nutrition and behavior change edu-cation and individualized care plans, biometricfeedback, and peer support via an online com-munity. Thus, the purpose of this study was toassess the effectiveness and safety of a novelcare model (Virta Clinic, Virta Health; SanFrancisco, CA, USA) for the management ofT2D after 1 year. Secondary aims were (1) todetermine if a difference in primary outcomesexisted between participants who self-selectedon-site versus web-based education deliveryand (2) explore the time course of biomarkerchange at 70 days and 1 year into the CCI.Primary endpoints to assess effectiveness of theintervention were change in glycosylatedhemoglobin (HbA1c), body weight, and medi-cation prescription after 1 year. Secondary out-comes, including clinical biomarkers of
Diabetes Ther (2018) 9:583–612 585
associated physiological systems and adverseevents, were assessed to determine safety of theintervention.
METHODS
We utilized an open-label, non-randomized,controlled, before-and-after study design with acohort of patients who self-selected to partici-pate in the metabolic and continuous careintervention (CCI) for T2D and a comparisongroup of patients who self-selected to partici-pate while receiving their usual care (UC) fromtheir own medical providers and diabetes edu-cation program (Clinicaltrials.gov IdentifierNCT02519309). Adults diagnosed with T2Dwere recruited via clinical referrals, local adver-tisements, and word of mouth in Lafayette,Indiana, USA and surrounding region fromAugust 2015 through March 2016. This studywas approved by the Franciscan Health Lafay-ette Institutional Review Board. All proceduresperformed in studies involving human partici-pants were in accordance with the ethicalstandards of the institutional and/or nationalresearch committee and with the 1964 Helsinkideclaration and its later amendments or com-parable ethical standards. Informed consent wasobtained from all individual participants inclu-ded in the study.
Continuous Care Intervention
Participants in the CCI underwent history andphysical exam followed by laboratory testing toensure they met inclusion and exclusion criteria(Supplementary Materials A). Upon qualifying,CCI participants received biomarker trackingtools including a cellular-connected bodyweight scale (BT003, Body Trace; New York, NY,USA), a finger-stick blood glucose and ketonemeter (Precision Xtra, Abbott; Alameda, CA,USA), and a blood pressure cuff if hypertensionwas diagnosed (BP742 N, Omron Healthcare,Inc.; Lake Forest, IL, USA). Access to a web-basedsoftware application (app) was provided forbiomarker reporting and monitoring, educa-tion, and communication with remote careteam (via telemedicine) consisting of a health
coach and medical provider (physician or nursepractitioner) for advice and medication man-agement. Social support was provided via anonline peer community. Participants in the CCIretained their primary care provider (PCP) forconditions other than metabolic disease, andcare coordination between the PCP and CCIprovider occurred as needed. Frequency andtype of biomarker tracking were individualizedon the basis of care needs and recorded by par-ticipants in the app; initial participant instruc-tions were to weigh and measure blood BHBconcentration daily, and to measure blood glu-cose one to three times daily. The remote careteam monitored this information; a medicalprovider made medication changes as indicatedby the participant-reported biomarkers (Sup-plementary Materials B).
Participants were provided individualizednutrition recommendations that allowed themto achieve and sustain nutritional ketosis with agoal of 0.5–3.0 mmol L-1 blood BHB. Partici-pants were encouraged to report daily hunger,cravings, energy, and mood on a four-pointLikert scale. These ratings and BHB concentra-tions were utilized to adjust nutritional guid-ance. With the insulin resistance characteristicof T2D, patients typically require total dietarycarbohydrates to be restricted to less than30 g day-1 to achieve nutritional ketosis. Healthcoaches monitored blood BHB concentrationslogged by participants and worked with partic-ipants individually to adjust dietary carbohy-drate intake to a level that would allow them toachieve nutritional ketosis. Daily protein intakewas initially targeted to a level of 1.5 g kg-1 ofreference (i.e., medium-frame ‘‘ideal’’) bodyweight and adjusted as necessary to aid partici-pants in achieving nutritional ketosis based onparticipant-logged blood BHB concentrations.Participants were coached to incorporate diet-ary fats to satiety. Participants were advised toconsume adequate intake of omega-3 (eicos-apentaenoic acid and docosahexaenoic acid)and omega-6 (linoleic acid) polyunsaturatedfats [22], while it was recommended that theremainder of their intake from fat come fromboth monounsaturated and saturated sources.Other aspects of the diet were individually pre-scribed to ensure safety, effectiveness, and
586 Diabetes Ther (2018) 9:583–612
satisfaction, including consumption of 3–5servings of non-starchy vegetables and adequatemineral and fluid intake for the ketogenic state.At onset of dietary changes, participants wereadvised to consume a multivitamin,1000–2000 IU vitamin D3, and up to 1000 mgomega-3 daily. If participants exhibited signs ofmagnesium depletion (e.g., muscle twitches orcramps), daily supplementation (500 mg mag-nesium oxide or 200 mg magnesium chloride)was suggested. If participants exhibited head-aches, constipation, or lightheadedness, ade-quate sodium and fluid intake wasrecommended. BHB concentrations were alsoutilized as a marker of adherence to nutritionalketosis. Behavior change strategies were utilizedby the remote care team and tailored to theneeds of each participant to help achieve gly-cemic control. Examples of techniques utilizedinclude education of natural consequences,shaping knowledge, goal setting, self-monitor-ing, feedback, monitoring and reinforcementfrom health coach and medical provider, self-belief, social support, relapse prevention, asso-ciations, and repetition.
Participants in the CCI self-selected howthey would receive most of their education: (1)via on-site group education classes that metweekly for 12 weeks, bi-weekly for 12 weeks,and monthly for 6 months (n = 136; CCI-on-site) or (2) via web-based, recorded educationalcontent viewed independently through the app(n = 126; CCI-web). Educational content wasthe same regardless of delivery method (Sup-plementary Materials C), and all other aspects ofcare were the same. During on-site classes,health coaches presented educational contentand medical providers met with participantsindividually. Participants receiving web-basededucation could schedule visits with the CCImedical provider if desired. Apart from educa-tion delivery, both groups received remote carefrom health coaches.
Usual Care
Participants in the UC group were patients withdiagnosed T2D who were recently referred tothe local diabetes education program by their
primary care physician or endocrinologistwhere they were counseled by registered dieti-tians on diabetes self-management, nutrition,and lifestyle [7]. Medical care for their T2D wasprovided by their primary care physician orendocrinologist. No modification to the carethat they received for their T2D was made bythe study. This group was observed at baselineand 1 year as reference for typical disease treat-ment and progression over 1 year within thesame geographical, health care, and laboratorylocations. UC participants attended a separateinformation session and informed consent wasobtained followed by laboratory testing toensure they met all inclusion and exclusioncriteria. Patients were informed that the trialalso had an intervention arm and could partic-ipate in that group if they chose to do so.
Outcome Measures
In-clinic vital signs and anthropometrics wereobtained at baseline, 70-days (CCI only [23]),and 1-year follow-up. Height was assessed viastadiometer for calculation of body mass index.In-clinic weight for all participants was mea-sured to the nearest 0.1 lb (Model 750, Detecto;Webb City, MO, USA) and converted to kg. In-clinic blood pressure was obtained manually bytrained staff after participants rested in a seatedposition for 5 min. Adverse events were repor-ted to the Principal Investigator and reviewedby the Institutional Review Board.
Fasted blood draws occurred at baseline,70-days (CCI only [23]), and 1-year follow up.Blood analytes were determined via standardprocedures at a Clinical Laboratory Improve-ment Amendment (CLIA) accredited laboratoryon the day of sample collection or from storedserum (Supplementary Materials D).
Statistical Analysis
Statistical analyses were performed using JMPsoftware (version 5.1, SAS Institute; Cary, SC,USA) for all analyses except multiple imputa-tion, for which we used Stata software (version11, StataCorp; College Station, TX, USA). Mul-tiple imputation was used to estimate means
Diabetes Ther (2018) 9:583–612 587
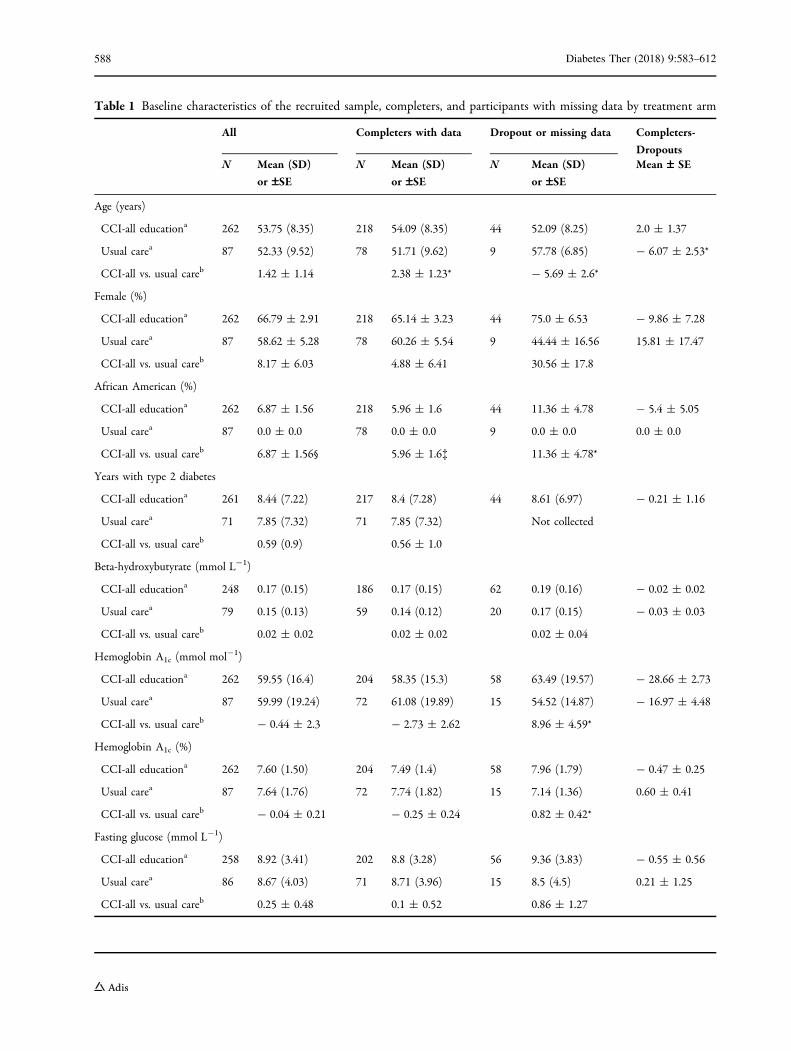
Table 1 Baseline characteristics of the recruited sample, completers, and participants with missing data by treatment arm
All Completers with data Dropout or missing data Completers-
DropoutsN Mean (SD)
or –SEN Mean (SD)
or –SEN Mean (SD)
or –SEMean – SE
Age (years)
CCI-all educationa 262 53.75 (8.35) 218 54.09 (8.35) 44 52.09 (8.25) 2.0 ± 1.37
Usual carea 87 52.33 (9.52) 78 51.71 (9.62) 9 57.78 (6.85) - 6.07 ± 2.53*
CCI-all vs. usual careb 1.42 ± 1.14 2.38 ± 1.23* - 5.69 ± 2.6*
Female (%)
CCI-all educationa 262 66.79 ± 2.91 218 65.14 ± 3.23 44 75.0 ± 6.53 - 9.86 ± 7.28
Usual carea 87 58.62 ± 5.28 78 60.26 ± 5.54 9 44.44 ± 16.56 15.81 ± 17.47
CCI-all vs. usual careb 8.17 ± 6.03 4.88 ± 6.41 30.56 ± 17.8
African American (%)
CCI-all educationa 262 6.87 ± 1.56 218 5.96 ± 1.6 44 11.36 ± 4.78 - 5.4 ± 5.05
Usual carea 87 0.0 ± 0.0 78 0.0 ± 0.0 9 0.0 ± 0.0 0.0 ± 0.0
CCI-all vs. usual careb 6.87 ± 1.56§ 5.96 ± 1.6� 11.36 ± 4.78*
Years with type 2 diabetes
CCI-all educationa 261 8.44 (7.22) 217 8.4 (7.28) 44 8.61 (6.97) - 0.21 ± 1.16
Usual carea 71 7.85 (7.32) 71 7.85 (7.32) Not collected
CCI-all vs. usual careb 0.59 (0.9) 0.56 ± 1.0
Beta-hydroxybutyrate (mmol L-1)
CCI-all educationa 248 0.17 (0.15) 186 0.17 (0.15) 62 0.19 (0.16) - 0.02 ± 0.02
Usual carea 79 0.15 (0.13) 59 0.14 (0.12) 20 0.17 (0.15) - 0.03 ± 0.03
CCI-all vs. usual careb 0.02 ± 0.02 0.02 ± 0.02 0.02 ± 0.04
Hemoglobin A1c (mmol mol-1)
CCI-all educationa 262 59.55 (16.4) 204 58.35 (15.3) 58 63.49 (19.57) - 28.66 ± 2.73
Usual carea 87 59.99 (19.24) 72 61.08 (19.89) 15 54.52 (14.87) - 16.97 ± 4.48
CCI-all vs. usual careb - 0.44 ± 2.3 - 2.73 ± 2.62 8.96 ± 4.59*
Hemoglobin A1c (%)
CCI-all educationa 262 7.60 (1.50) 204 7.49 (1.4) 58 7.96 (1.79) - 0.47 ± 0.25
Usual carea 87 7.64 (1.76) 72 7.74 (1.82) 15 7.14 (1.36) 0.60 ± 0.41
CCI-all vs. usual careb - 0.04 ± 0.21 - 0.25 ± 0.24 0.82 ± 0.42*
Fasting glucose (mmol L-1)
CCI-all educationa 258 8.92 (3.41) 202 8.8 (3.28) 56 9.36 (3.83) - 0.55 ± 0.56
Usual carea 86 8.67 (4.03) 71 8.71 (3.96) 15 8.5 (4.5) 0.21 ± 1.25
CCI-all vs. usual careb 0.25 ± 0.48 0.1 ± 0.52 0.86 ± 1.27
588 Diabetes Ther (2018) 9:583–612
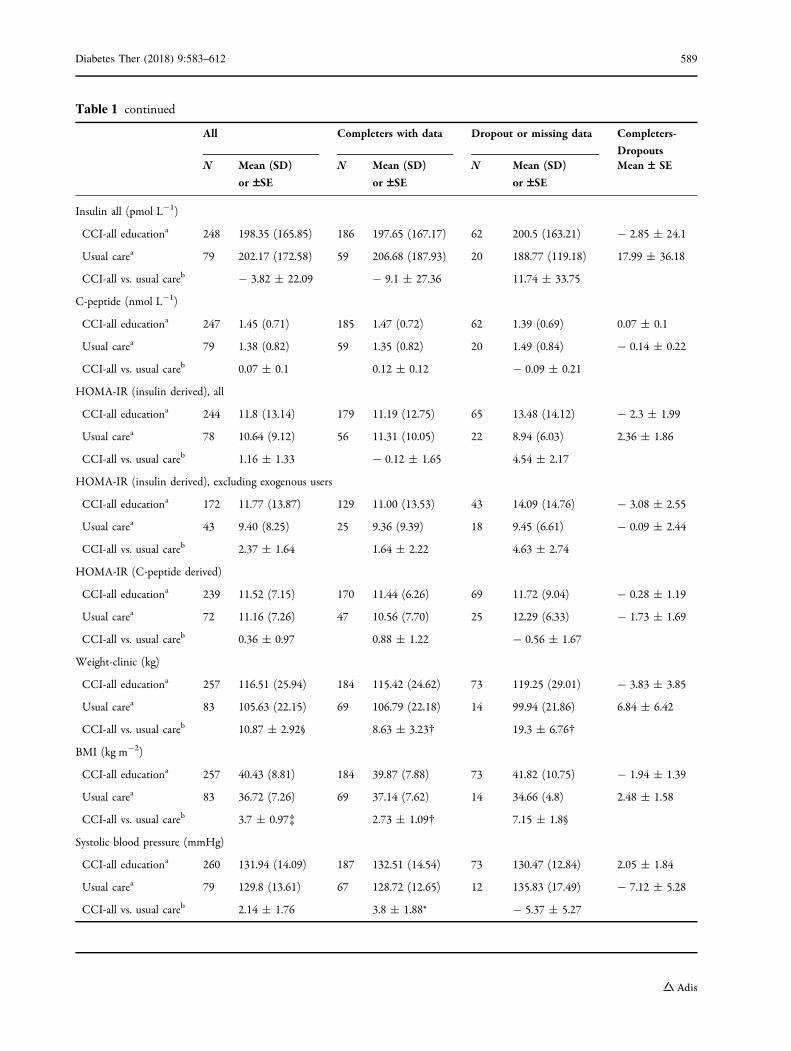
Table 1 continued
All Completers with data Dropout or missing data Completers-
DropoutsN Mean (SD)
or –SEN Mean (SD)
or –SEN Mean (SD)
or –SEMean – SE
Insulin all (pmol L-1)
CCI-all educationa 248 198.35 (165.85) 186 197.65 (167.17) 62 200.5 (163.21) - 2.85 ± 24.1
Usual carea 79 202.17 (172.58) 59 206.68 (187.93) 20 188.77 (119.18) 17.99 ± 36.18
CCI-all vs. usual careb - 3.82 ± 22.09 - 9.1 ± 27.36 11.74 ± 33.75
C-peptide (nmol L-1)
CCI-all educationa 247 1.45 (0.71) 185 1.47 (0.72) 62 1.39 (0.69) 0.07 ± 0.1
Usual carea 79 1.38 (0.82) 59 1.35 (0.82) 20 1.49 (0.84) - 0.14 ± 0.22
CCI-all vs. usual careb 0.07 ± 0.1 0.12 ± 0.12 - 0.09 ± 0.21
HOMA-IR (insulin derived), all
CCI-all educationa 244 11.8 (13.14) 179 11.19 (12.75) 65 13.48 (14.12) - 2.3 ± 1.99
Usual carea 78 10.64 (9.12) 56 11.31 (10.05) 22 8.94 (6.03) 2.36 ± 1.86
CCI-all vs. usual careb 1.16 ± 1.33 - 0.12 ± 1.65 4.54 ± 2.17
HOMA-IR (insulin derived), excluding exogenous users
CCI-all educationa 172 11.77 (13.87) 129 11.00 (13.53) 43 14.09 (14.76) - 3.08 ± 2.55
Usual carea 43 9.40 (8.25) 25 9.36 (9.39) 18 9.45 (6.61) - 0.09 ± 2.44
CCI-all vs. usual careb 2.37 ± 1.64 1.64 ± 2.22 4.63 ± 2.74
HOMA-IR (C-peptide derived)
CCI-all educationa 239 11.52 (7.15) 170 11.44 (6.26) 69 11.72 (9.04) - 0.28 ± 1.19
Usual carea 72 11.16 (7.26) 47 10.56 (7.70) 25 12.29 (6.33) - 1.73 ± 1.69
CCI-all vs. usual careb 0.36 ± 0.97 0.88 ± 1.22 - 0.56 ± 1.67
Weight-clinic (kg)
CCI-all educationa 257 116.51 (25.94) 184 115.42 (24.62) 73 119.25 (29.01) - 3.83 ± 3.85
Usual carea 83 105.63 (22.15) 69 106.79 (22.18) 14 99.94 (21.86) 6.84 ± 6.42
CCI-all vs. usual careb 10.87 ± 2.92§ 8.63 ± 3.23� 19.3 ± 6.76�
BMI (kg m-2)
CCI-all educationa 257 40.43 (8.81) 184 39.87 (7.88) 73 41.82 (10.75) - 1.94 ± 1.39
Usual carea 83 36.72 (7.26) 69 37.14 (7.62) 14 34.66 (4.8) 2.48 ± 1.58
CCI-all vs. usual careb 3.7 ± 0.97� 2.73 ± 1.09� 7.15 ± 1.8§
Systolic blood pressure (mmHg)
CCI-all educationa 260 131.94 (14.09) 187 132.51 (14.54) 73 130.47 (12.84) 2.05 ± 1.84
Usual carea 79 129.8 (13.61) 67 128.72 (12.65) 12 135.83 (17.49) - 7.12 ± 5.28
CCI-all vs. usual careb 2.14 ± 1.76 3.8 ± 1.88* - 5.37 ± 5.27
Diabetes Ther (2018) 9:583–612 589
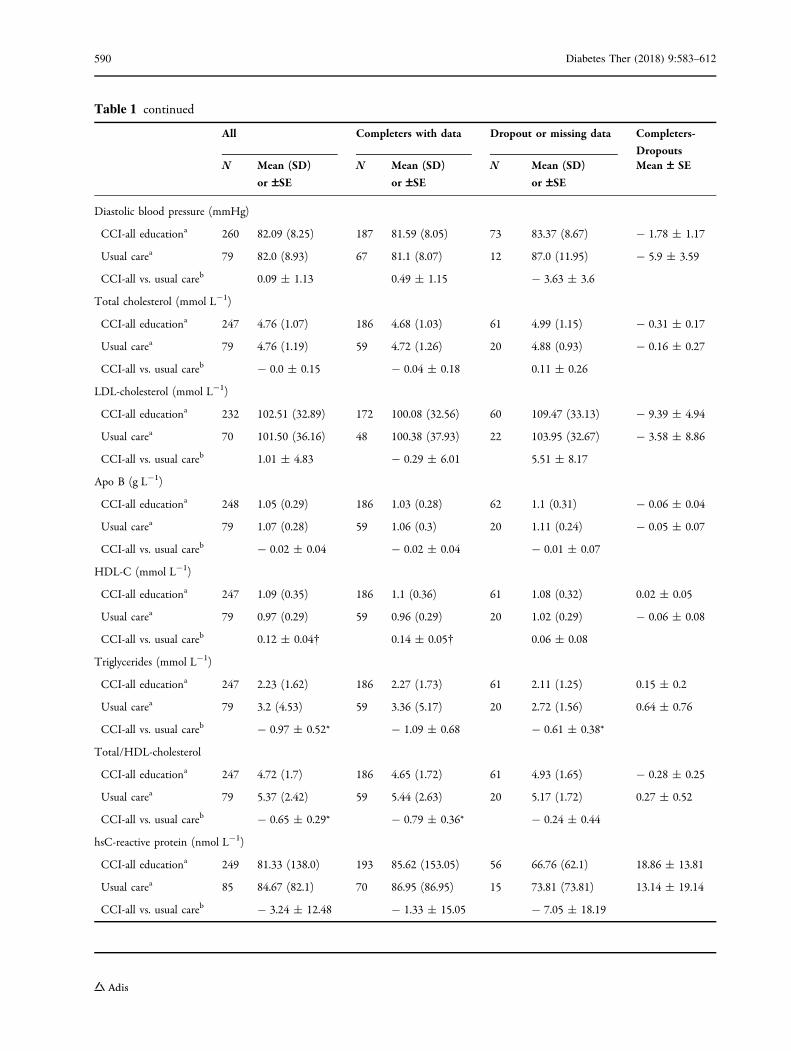
Table 1 continued
All Completers with data Dropout or missing data Completers-
DropoutsN Mean (SD)
or –SEN Mean (SD)
or –SEN Mean (SD)
or –SEMean – SE
Diastolic blood pressure (mmHg)
CCI-all educationa 260 82.09 (8.25) 187 81.59 (8.05) 73 83.37 (8.67) - 1.78 ± 1.17
Usual carea 79 82.0 (8.93) 67 81.1 (8.07) 12 87.0 (11.95) - 5.9 ± 3.59
CCI-all vs. usual careb 0.09 ± 1.13 0.49 ± 1.15 - 3.63 ± 3.6
Total cholesterol (mmol L-1)
CCI-all educationa 247 4.76 (1.07) 186 4.68 (1.03) 61 4.99 (1.15) - 0.31 ± 0.17
Usual carea 79 4.76 (1.19) 59 4.72 (1.26) 20 4.88 (0.93) - 0.16 ± 0.27
CCI-all vs. usual careb - 0.0 ± 0.15 - 0.04 ± 0.18 0.11 ± 0.26
LDL-cholesterol (mmol L-1)
CCI-all educationa 232 102.51 (32.89) 172 100.08 (32.56) 60 109.47 (33.13) - 9.39 ± 4.94
Usual carea 70 101.50 (36.16) 48 100.38 (37.93) 22 103.95 (32.67) - 3.58 ± 8.86
CCI-all vs. usual careb 1.01 ± 4.83 - 0.29 ± 6.01 5.51 ± 8.17
Apo B (g L-1)
CCI-all educationa 248 1.05 (0.29) 186 1.03 (0.28) 62 1.1 (0.31) - 0.06 ± 0.04
Usual carea 79 1.07 (0.28) 59 1.06 (0.3) 20 1.11 (0.24) - 0.05 ± 0.07
CCI-all vs. usual careb - 0.02 ± 0.04 - 0.02 ± 0.04 - 0.01 ± 0.07
HDL-C (mmol L-1)
CCI-all educationa 247 1.09 (0.35) 186 1.1 (0.36) 61 1.08 (0.32) 0.02 ± 0.05
Usual carea 79 0.97 (0.29) 59 0.96 (0.29) 20 1.02 (0.29) - 0.06 ± 0.08
CCI-all vs. usual careb 0.12 ± 0.04� 0.14 ± 0.05� 0.06 ± 0.08
Triglycerides (mmol L-1)
CCI-all educationa 247 2.23 (1.62) 186 2.27 (1.73) 61 2.11 (1.25) 0.15 ± 0.2
Usual carea 79 3.2 (4.53) 59 3.36 (5.17) 20 2.72 (1.56) 0.64 ± 0.76
CCI-all vs. usual careb - 0.97 ± 0.52* - 1.09 ± 0.68 - 0.61 ± 0.38*
Total/HDL-cholesterol
CCI-all educationa 247 4.72 (1.7) 186 4.65 (1.72) 61 4.93 (1.65) - 0.28 ± 0.25
Usual carea 79 5.37 (2.42) 59 5.44 (2.63) 20 5.17 (1.72) 0.27 ± 0.52
CCI-all vs. usual careb - 0.65 ± 0.29* - 0.79 ± 0.36* - 0.24 ± 0.44
hsC-reactive protein (nmol L-1)
CCI-all educationa 249 81.33 (138.0) 193 85.62 (153.05) 56 66.76 (62.1) 18.86 ± 13.81
Usual carea 85 84.67 (82.1) 70 86.95 (86.95) 15 73.81 (73.81) 13.14 ± 19.14
CCI-all vs. usual careb - 3.24 ± 12.48 - 1.33 ± 15.05 - 7.05 ± 18.19
590 Diabetes Ther (2018) 9:583–612
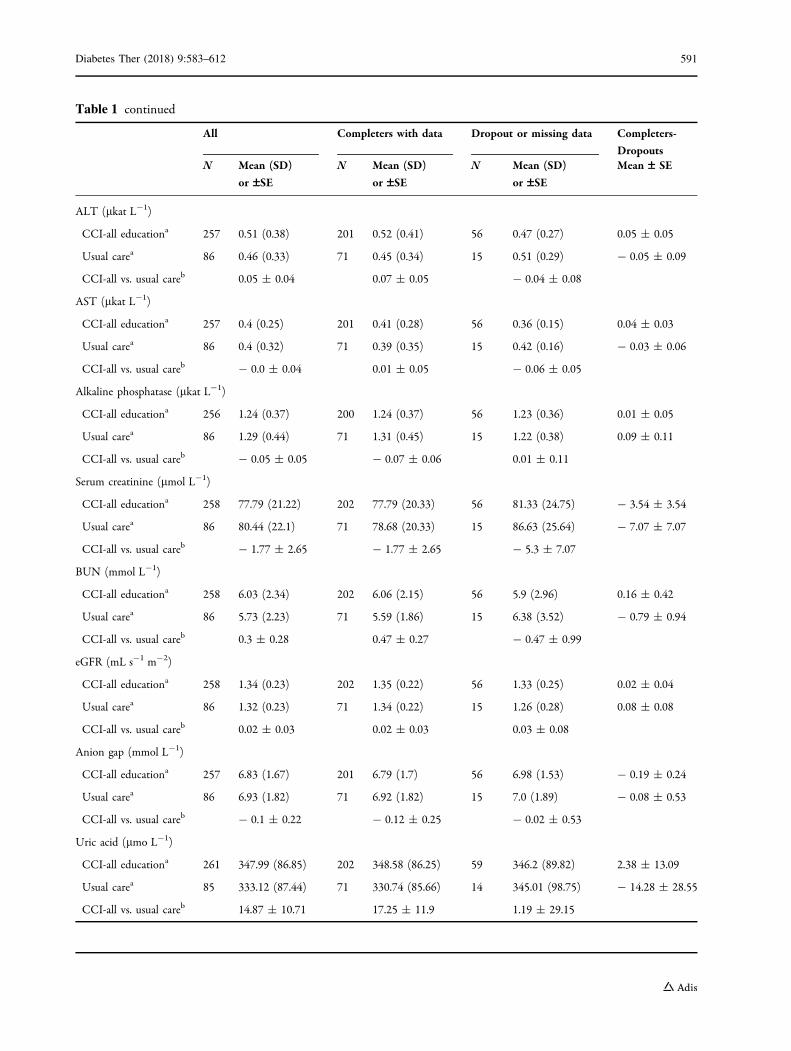
Table 1 continued
All Completers with data Dropout or missing data Completers-
DropoutsN Mean (SD)
or –SEN Mean (SD)
or –SEN Mean (SD)
or –SEMean – SE
ALT (lkat L-1)
CCI-all educationa 257 0.51 (0.38) 201 0.52 (0.41) 56 0.47 (0.27) 0.05 ± 0.05
Usual carea 86 0.46 (0.33) 71 0.45 (0.34) 15 0.51 (0.29) - 0.05 ± 0.09
CCI-all vs. usual careb 0.05 ± 0.04 0.07 ± 0.05 - 0.04 ± 0.08
AST (lkat L-1)
CCI-all educationa 257 0.4 (0.25) 201 0.41 (0.28) 56 0.36 (0.15) 0.04 ± 0.03
Usual carea 86 0.4 (0.32) 71 0.39 (0.35) 15 0.42 (0.16) - 0.03 ± 0.06
CCI-all vs. usual careb - 0.0 ± 0.04 0.01 ± 0.05 - 0.06 ± 0.05
Alkaline phosphatase (lkat L-1)
CCI-all educationa 256 1.24 (0.37) 200 1.24 (0.37) 56 1.23 (0.36) 0.01 ± 0.05
Usual carea 86 1.29 (0.44) 71 1.31 (0.45) 15 1.22 (0.38) 0.09 ± 0.11
CCI-all vs. usual careb - 0.05 ± 0.05 - 0.07 ± 0.06 0.01 ± 0.11
Serum creatinine (lmol L-1)
CCI-all educationa 258 77.79 (21.22) 202 77.79 (20.33) 56 81.33 (24.75) - 3.54 ± 3.54
Usual carea 86 80.44 (22.1) 71 78.68 (20.33) 15 86.63 (25.64) - 7.07 ± 7.07
CCI-all vs. usual careb - 1.77 ± 2.65 - 1.77 ± 2.65 - 5.3 ± 7.07
BUN (mmol L-1)
CCI-all educationa 258 6.03 (2.34) 202 6.06 (2.15) 56 5.9 (2.96) 0.16 ± 0.42
Usual carea 86 5.73 (2.23) 71 5.59 (1.86) 15 6.38 (3.52) - 0.79 ± 0.94
CCI-all vs. usual careb 0.3 ± 0.28 0.47 ± 0.27 - 0.47 ± 0.99
eGFR (mL s-1 m-2)
CCI-all educationa 258 1.34 (0.23) 202 1.35 (0.22) 56 1.33 (0.25) 0.02 ± 0.04
Usual carea 86 1.32 (0.23) 71 1.34 (0.22) 15 1.26 (0.28) 0.08 ± 0.08
CCI-all vs. usual careb 0.02 ± 0.03 0.02 ± 0.03 0.03 ± 0.08
Anion gap (mmol L-1)
CCI-all educationa 257 6.83 (1.67) 201 6.79 (1.7) 56 6.98 (1.53) - 0.19 ± 0.24
Usual carea 86 6.93 (1.82) 71 6.92 (1.82) 15 7.0 (1.89) - 0.08 ± 0.53
CCI-all vs. usual careb - 0.1 ± 0.22 - 0.12 ± 0.25 - 0.02 ± 0.53
Uric acid (lmo L-1)
CCI-all educationa 261 347.99 (86.85) 202 348.58 (86.25) 59 346.2 (89.82) 2.38 ± 13.09
Usual carea 85 333.12 (87.44) 71 330.74 (85.66) 14 345.01 (98.75) - 14.28 ± 28.55
CCI-all vs. usual careb 14.87 ± 10.71 17.25 ± 11.9 1.19 ± 29.15
Diabetes Ther (2018) 9:583–612 591
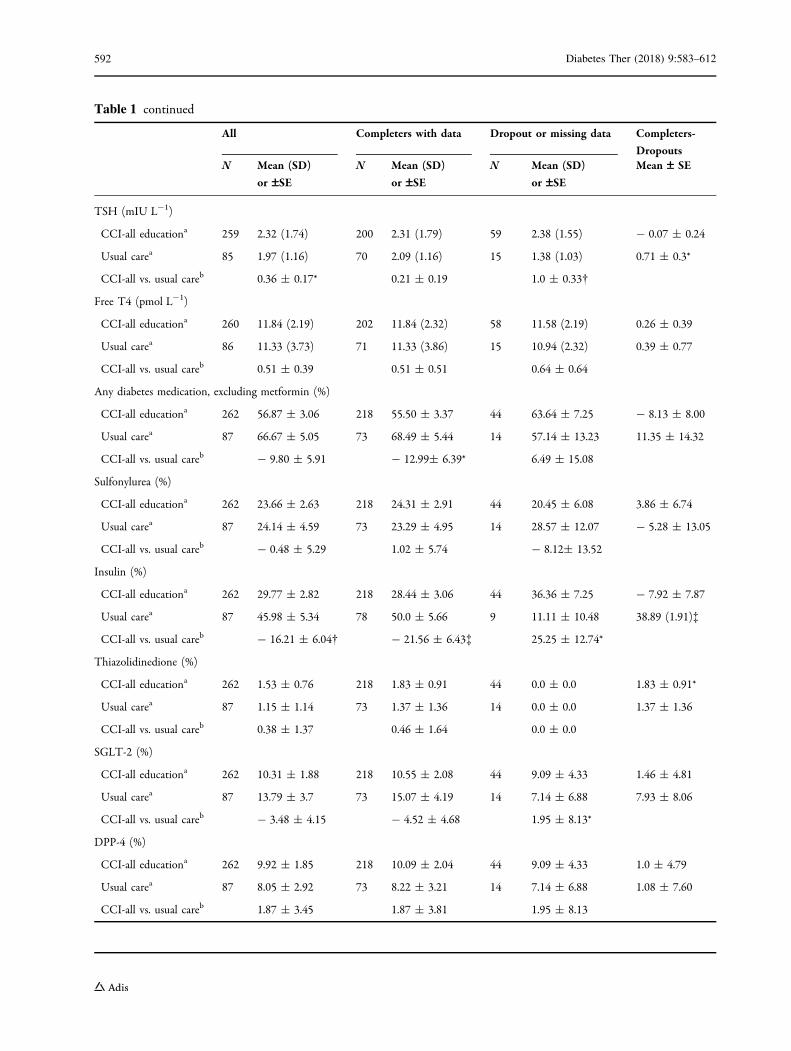
Table 1 continued
All Completers with data Dropout or missing data Completers-
DropoutsN Mean (SD)
or –SEN Mean (SD)
or –SEN Mean (SD)
or –SEMean – SE
TSH (mIU L-1)
CCI-all educationa 259 2.32 (1.74) 200 2.31 (1.79) 59 2.38 (1.55) - 0.07 ± 0.24
Usual carea 85 1.97 (1.16) 70 2.09 (1.16) 15 1.38 (1.03) 0.71 ± 0.3*
CCI-all vs. usual careb 0.36 ± 0.17* 0.21 ± 0.19 1.0 ± 0.33�
Free T4 (pmol L-1)
CCI-all educationa 260 11.84 (2.19) 202 11.84 (2.32) 58 11.58 (2.19) 0.26 ± 0.39
Usual carea 86 11.33 (3.73) 71 11.33 (3.86) 15 10.94 (2.32) 0.39 ± 0.77
CCI-all vs. usual careb 0.51 ± 0.39 0.51 ± 0.51 0.64 ± 0.64
Any diabetes medication, excluding metformin (%)
CCI-all educationa 262 56.87 ± 3.06 218 55.50 ± 3.37 44 63.64 ± 7.25 - 8.13 ± 8.00
Usual carea 87 66.67 ± 5.05 73 68.49 ± 5.44 14 57.14 ± 13.23 11.35 ± 14.32
CCI-all vs. usual careb - 9.80 ± 5.91 - 12.99± 6.39* 6.49 ± 15.08
Sulfonylurea (%)
CCI-all educationa 262 23.66 ± 2.63 218 24.31 ± 2.91 44 20.45 ± 6.08 3.86 ± 6.74
Usual carea 87 24.14 ± 4.59 73 23.29 ± 4.95 14 28.57 ± 12.07 - 5.28 ± 13.05
CCI-all vs. usual careb - 0.48 ± 5.29 1.02 ± 5.74 - 8.12± 13.52
Insulin (%)
CCI-all educationa 262 29.77 ± 2.82 218 28.44 ± 3.06 44 36.36 ± 7.25 - 7.92 ± 7.87
Usual carea 87 45.98 ± 5.34 78 50.0 ± 5.66 9 11.11 ± 10.48 38.89 (1.91)�
CCI-all vs. usual careb - 16.21 ± 6.04� - 21.56 ± 6.43� 25.25 ± 12.74*
Thiazolidinedione (%)
CCI-all educationa 262 1.53 ± 0.76 218 1.83 ± 0.91 44 0.0 ± 0.0 1.83 ± 0.91*
Usual carea 87 1.15 ± 1.14 73 1.37 ± 1.36 14 0.0 ± 0.0 1.37 ± 1.36
CCI-all vs. usual careb 0.38 ± 1.37 0.46 ± 1.64 0.0 ± 0.0
SGLT-2 (%)
CCI-all educationa 262 10.31 ± 1.88 218 10.55 ± 2.08 44 9.09 ± 4.33 1.46 ± 4.81
Usual carea 87 13.79 ± 3.7 73 15.07 ± 4.19 14 7.14 ± 6.88 7.93 ± 8.06
CCI-all vs. usual careb - 3.48 ± 4.15 - 4.52 ± 4.68 1.95 ± 8.13*
DPP-4 (%)
CCI-all educationa 262 9.92 ± 1.85 218 10.09 ± 2.04 44 9.09 ± 4.33 1.0 ± 4.79
Usual carea 87 8.05 ± 2.92 73 8.22 ± 3.21 14 7.14 ± 6.88 1.08 ± 7.60
CCI-all vs. usual careb 1.87 ± 3.45 1.87 ± 3.81 1.95 ± 8.13
592 Diabetes Ther (2018) 9:583–612
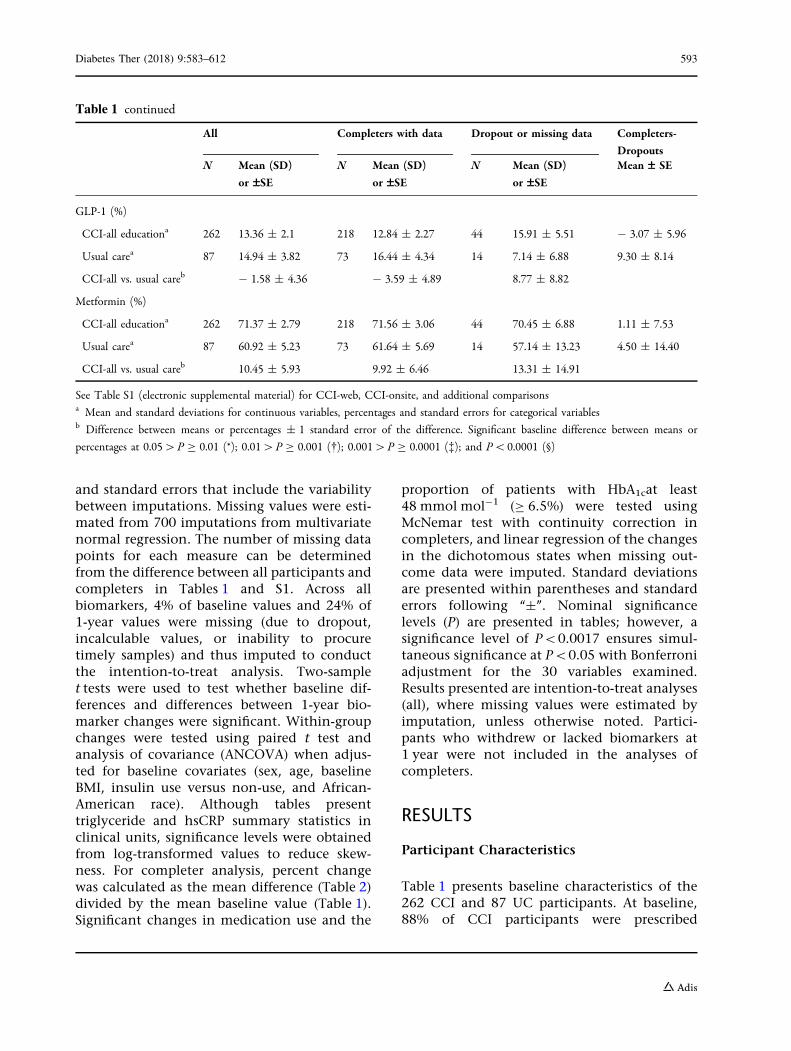
and standard errors that include the variabilitybetween imputations. Missing values were esti-mated from 700 imputations from multivariatenormal regression. The number of missing datapoints for each measure can be determinedfrom the difference between all participants andcompleters in Tables 1 and S1. Across allbiomarkers, 4% of baseline values and 24% of1-year values were missing (due to dropout,incalculable values, or inability to procuretimely samples) and thus imputed to conductthe intention-to-treat analysis. Two-samplet tests were used to test whether baseline dif-ferences and differences between 1-year bio-marker changes were significant. Within-groupchanges were tested using paired t test andanalysis of covariance (ANCOVA) when adjus-ted for baseline covariates (sex, age, baselineBMI, insulin use versus non-use, and African-American race). Although tables presenttriglyceride and hsCRP summary statistics inclinical units, significance levels were obtainedfrom log-transformed values to reduce skew-ness. For completer analysis, percent changewas calculated as the mean difference (Table 2)divided by the mean baseline value (Table 1).Significant changes in medication use and the
proportion of patients with HbA1cat least48 mmol mol-1 (C 6.5%) were tested usingMcNemar test with continuity correction incompleters, and linear regression of the changesin the dichotomous states when missing out-come data were imputed. Standard deviationsare presented within parentheses and standarderrors following ‘‘±’’. Nominal significancelevels (P) are presented in tables; however, asignificance level of P\0.0017 ensures simul-taneous significance at P\0.05 with Bonferroniadjustment for the 30 variables examined.Results presented are intention-to-treat analyses(all), where missing values were estimated byimputation, unless otherwise noted. Partici-pants who withdrew or lacked biomarkers at1 year were not included in the analyses ofcompleters.
RESULTS
Participant Characteristics
Table 1 presents baseline characteristics of the262 CCI and 87 UC participants. At baseline,88% of CCI participants were prescribed
Table 1 continued
All Completers with data Dropout or missing data Completers-
DropoutsN Mean (SD)
or –SEN Mean (SD)
or –SEN Mean (SD)
or –SEMean – SE
GLP-1 (%)
CCI-all educationa 262 13.36 ± 2.1 218 12.84 ± 2.27 44 15.91 ± 5.51 - 3.07 ± 5.96
Usual carea 87 14.94 ± 3.82 73 16.44 ± 4.34 14 7.14 ± 6.88 9.30 ± 8.14
CCI-all vs. usual careb - 1.58 ± 4.36 - 3.59 ± 4.89 8.77 ± 8.82
Metformin (%)
CCI-all educationa 262 71.37 ± 2.79 218 71.56 ± 3.06 44 70.45 ± 6.88 1.11 ± 7.53
Usual carea 87 60.92 ± 5.23 73 61.64 ± 5.69 14 57.14 ± 13.23 4.50 ± 14.40
CCI-all vs. usual careb 10.45 ± 5.93 9.92 ± 6.46 13.31 ± 14.91
See Table S1 (electronic supplemental material) for CCI-web, CCI-onsite, and additional comparisonsa Mean and standard deviations for continuous variables, percentages and standard errors for categorical variablesb Difference between means or percentages ± 1 standard error of the difference. Significant baseline difference between means or
percentages at 0.05[P C 0.01 (*); 0.01[P C 0.001 (�); 0.001[P C 0.0001 (�); and P\0.0001 (§)
Diabetes Ther (2018) 9:583–612 593
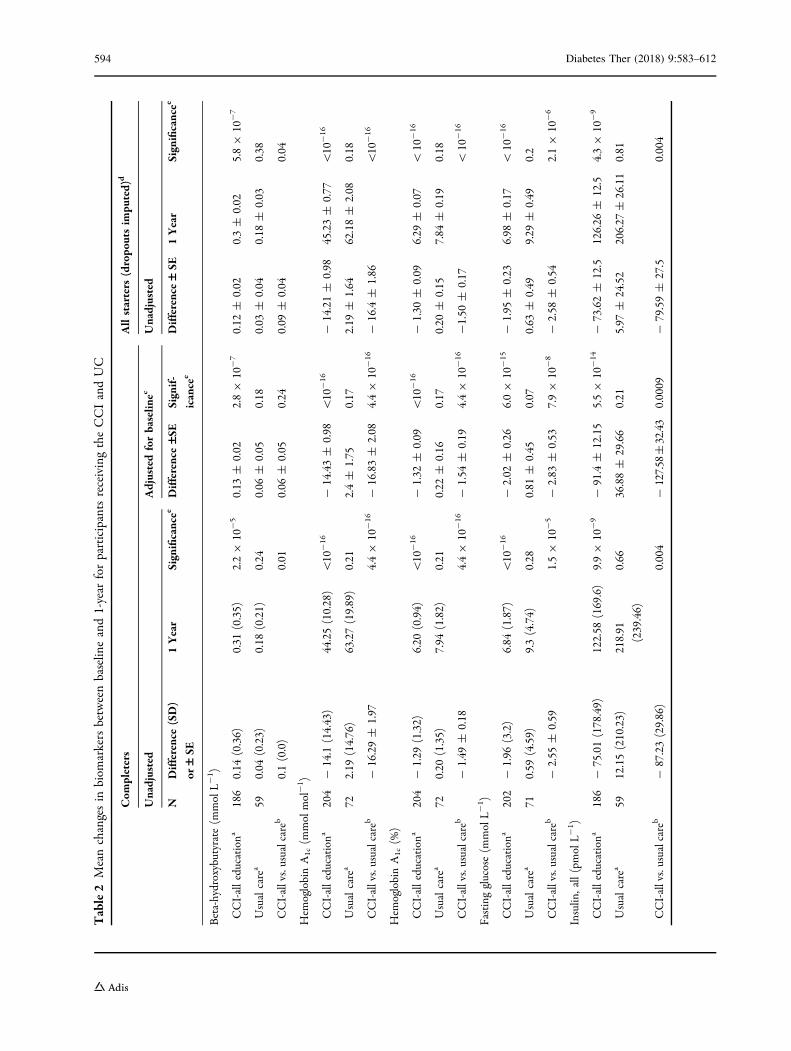
Table2
Meanchangesin
biom
arkersbetweenbaselin
eand1-year
forparticipantsreceivingtheCCIandUC
Com
pleters
Allstarters
(dropo
utsim
puted)
d
Unadjusted
Adjustedforbaselin
ecUnadjusted
NDifference(SD)
or–SE
1Year
Significancee
Difference–S
ESignif-
icance
e
Difference–SE
1Year
Significancee
Beta-hydroxybutyrate(m
molL-1 )
CCI-alleducationa
186
0.14
(0.36)
0.31
(0.35)
2.29
10-5
0.13
±0.02
2.89
10-7
0.12
±0.02
0.3±
0.02
5.89
10-7
Usualcarea
590.04
(0.23)
0.18
(0.21)
0.24
0.06
±0.05
0.18
0.03
±0.04
0.18
±0.03
0.38
CCI-allvs.usualcareb
0.1(0.0)
0.01
0.06
±0.05
0.24
0.09
±0.04
0.04
Hem
oglobinA1c(m
molmol-1 )
CCI-alleducationa
204
-14.1
(14.43)
44.25(10.28)
\10
-16
-14.43±
0.98
\10
-16
-14.21±
0.98
45.23±
0.77
\10
-16
Usualcarea
722.19
(14.76)
63.27(19.89)
0.21
2.4±
1.75
0.17
2.19
±1.64
62.18±
2.08
0.18
CCI-allvs.usualcareb
-16.29±
1.97
4.49
10-16
-16.83±
2.08
4.49
10-16
-16.4
±1.86
\10
-16
Hem
oglobinA1c(%
)
CCI-alleducationa
204
-1.29
(1.32)
6.20
(0.94)
\10
-16
-1.32
±0.09
\10
-16
-1.30
±0.09
6.29
±0.07
\10
-16
Usualcarea
720.20
(1.35)
7.94
(1.82)
0.21
0.22
±0.16
0.17
0.20
±0.15
7.84
±0.19
0.18
CCI-allvs.usualcareb
-1.49
±0.18
4.49
10-16
-1.54
±0.19
4.49
10-16
-1.50
±0.17
\10
-16
Fastingglucose(m
molL-
1 )
CCI-alleducationa
202
-1.96
(3.2)
6.84
(1.87)
\10
-16
-2.02
±0.26
6.09
10-15
-1.95
±0.23
6.98
±0.17
\10
-16
Usualcarea
710.59
(4.59)
9.3(4.74)
0.28
0.81
±0.45
0.07
0.63
±0.49
9.29
±0.49
0.2
CCI-allvs.usualcareb
-2.55
±0.59
1.59
10-5
-2.83
±0.53
7.99
10-8
-2.58
±0.54
2.19
10-6
Insulin
,all(pmolL-
1 )
CCI-alleducationa
186
-75.01(178.49)
122.58
(169.6)
9.99
10-9
-91.4
±12.15
5.59
10-14
-73.62±
12.5
126.26
±12.5
4.39
10-9
Usualcarea
5912.15(210.23)
218.91
(239.46)
0.66
36.88±
29.66
0.21
5.97
±24.52
206.27
±26.11
0.81
CCI-allvs.usualcareb
-87.23(29.86)
0.004
-127.58
±32.43
0.0009
-79.59±
27.5
0.004
594 Diabetes Ther (2018) 9:583–612
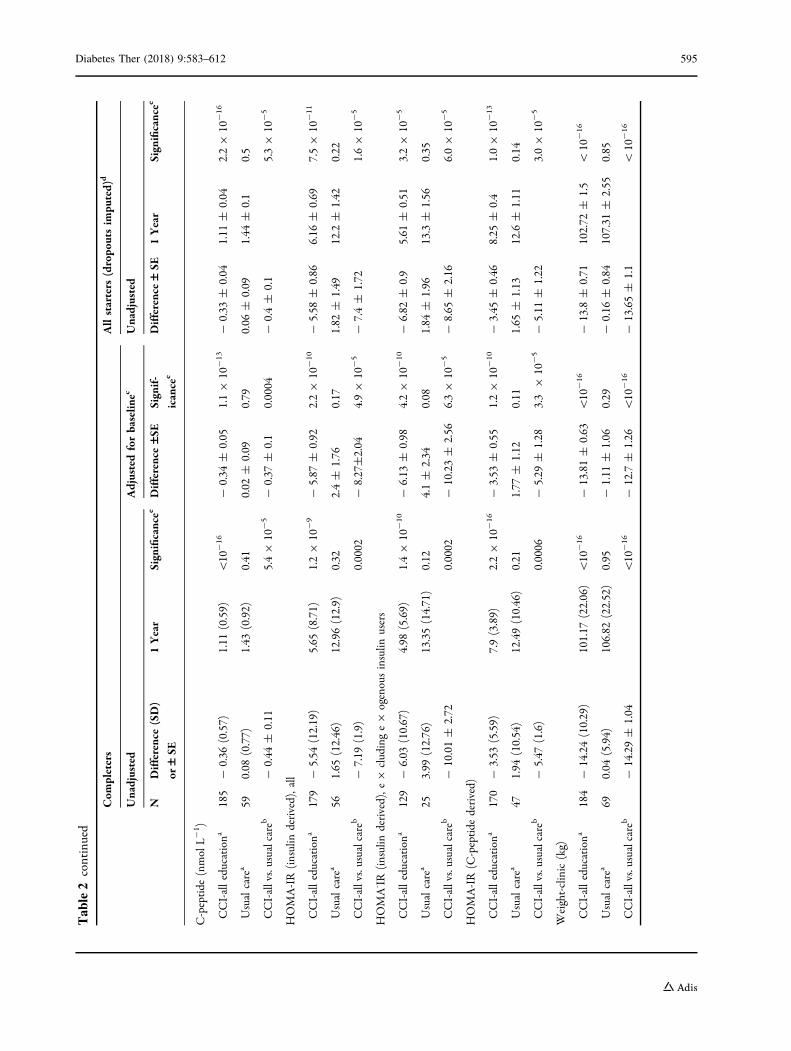
Table2
continued
Com
pleters
Allstarters
(dropo
utsim
puted)
d
Unadjusted
Adjustedforbaselin
ecUnadjusted
NDifference(SD)
or–SE
1Year
Significancee
Difference–S
ESignif-
icance
e
Difference–SE
1Year
Significancee
C-peptide
(nmolL-
1 )
CCI-alleducationa
185
-0.36
(0.57)
1.11
(0.59)
\10
-16
-0.34
±0.05
1.19
10-13
-0.33
±0.04
1.11
±0.04
2.29
10-16
Usualcarea
590.08
(0.77)
1.43
(0.92)
0.41
0.02
±0.09
0.79
0.06
±0.09
1.44
±0.1
0.5
CCI-allvs.usualcareb
-0.44
±0.11
5.49
10-5
-0.37
±0.1
0.0004
-0.4±
0.1
5.39
10-5
HOMA-IR(insulin
derived),all
CCI-alleducationa
179
-5.54
(12.19)
5.65
(8.71)
1.29
10-9
-5.87
±0.92
2.29
10-10
-5.58
±0.86
6.16
±0.69
7.59
10-11
Usualcarea
561.65
(12.46)
12.96(12.9)
0.32
2.4±
1.76
0.17
1.82
±1.49
12.2
±1.42
0.22
CCI-allvs.usualcareb
-7.19
(1.9)
0.0002
-8.27±2.04
4.99
10-5
-7.4±
1.72
1.69
10-5
HOMA- IR(insulin
derived),e
9cludinge9
ogenousinsulin
users
CCI-alleducationa
129
-6.03
(10.67)
4.98
(5.69)
1.49
10-10
-6.13
±0.98
4.29
10-10
-6.82
±0.9
5.61
±0.51
3.29
10-5
Usualcarea
253.99
(12.76)
13.35(14.71)
0.12
4.1±
2.34
0.08
1.84
±1.96
13.3
±1.56
0.35
CCI-allvs.usualcareb
-10.01±
2.72
0.0002
-10.23±
2.56
6.39
10-5
-8.65
±2.16
6.09
10-5
HOMA-IR(C
-peptide
derived)
CCI-alleducationa
170
-3.53
(5.59)
7.9(3.89)
2.29
10-16
-3.53
±0.55
1.29
10-10
-3.45
±0.46
8.25
±0.4
1.09
10-13
Usualcarea
471.94
(10.54)
12.49(10.46)
0.21
1.77
±1.12
0.11
1.65
±1.13
12.6
±1.11
0.14
CCI-allvs.usualcareb
-5.47
(1.6)
0.0006
-5.29
±1.28
3.3
910
-5
-5.11
±1.22
3.09
10-5
Weight-clinic(kg)
CCI-alleducationa
184
-14.24(10.29)
101.17
(22.06)
\10
-16
-13.81±
0.63
\10
-16
-13.8
±0.71
102.72
±1.5
\10
-16
Usualcarea
690.04
(5.94)
106.82
(22.52)
0.95
-1.11
±1.06
0.29
-0.16
±0.84
107.31
±2.55
0.85
CCI-allvs.usualcareb
-14.29±
1.04
\10
-16
-12.7
±1.26
\10
-16
-13.65±
1.1
\10
-16
Diabetes Ther (2018) 9:583–612 595
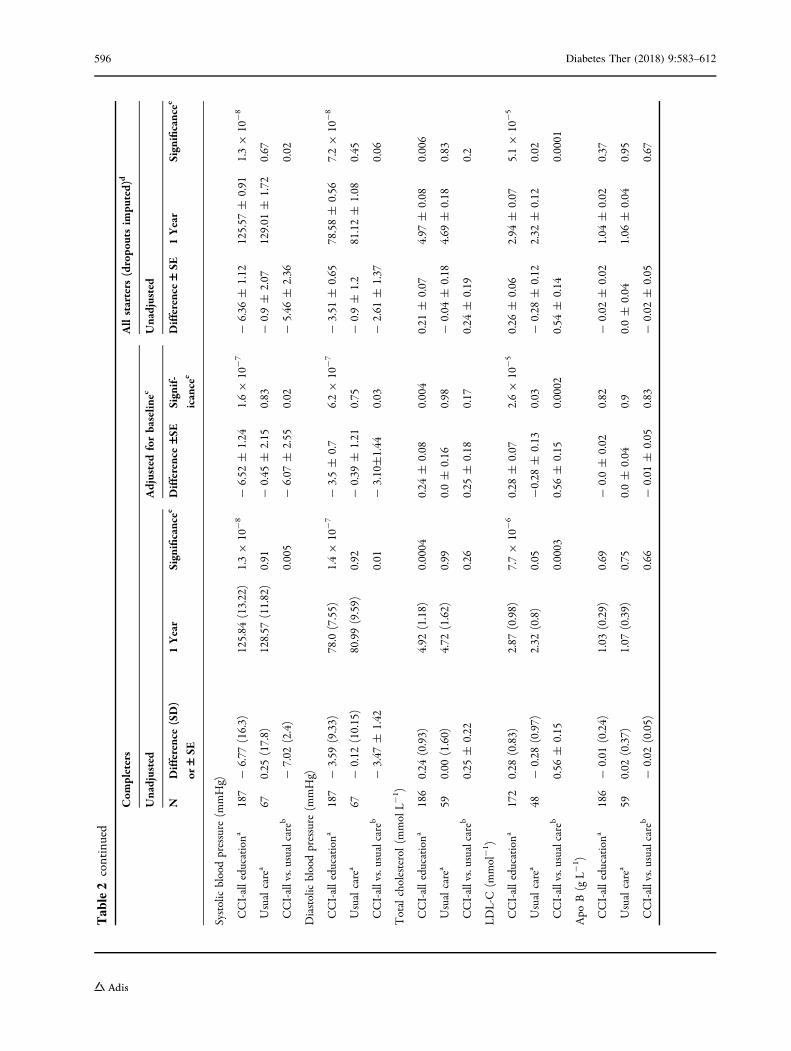
Table2
continued
Com
pleters
Allstarters
(dropo
utsim
puted)
d
Unadjusted
Adjustedforbaselin
ecUnadjusted
NDifference(SD)
or–SE
1Year
Significancee
Difference–S
ESignif-
icance
e
Difference–SE
1Year
Significancee
Systolicbloodpressure
(mmHg)
CCI-alleducationa
187
-6.77
(16.3)
125.84
(13.22)
1.39
10-8
-6.52
±1.24
1.69
10-7
-6.36
±1.12
125.57
±0.91
1.39
10-8
Usualcarea
670.25
(17.8)
128.57
(11.82)
0.91
-0.45
±2.15
0.83
-0.9±
2.07
129.01
±1.72
0.67
CCI-allvs.usualcareb
-7.02
(2.4)
0.005
-6.07
±2.55
0.02
-5.46
±2.36
0.02
Diastolicbloodpressure
(mmHg)
CCI-alleducationa
187
-3.59
(9.33)
78.0
(7.55)
1.49
10-7
-3.5±
0.7
6.29
10-7
-3.51
±0.65
78.58±
0.56
7.29
10-8
Usualcarea
67-
0.12
(10.15)
80.99(9.59)
0.92
-0.39
±1.21
0.75
-0.9±
1.2
81.12±
1.08
0.45
CCI-allvs.usualcareb
-3.47
±1.42
0.01
-3.10±1.44
0.03
-2.61
±1.37
0.06
Totalcholesterol(m
molL-
1 )
CCI-alleducationa
186
0.24
(0.93)
4.92
(1.18)
0.0004
0.24
±0.08
0.004
0.21
±0.07
4.97
±0.08
0.006
Usualcarea
590.00
(1.60)
4.72
(1.62)
0.99
0.0±
0.16
0.98
-0.04
±0.18
4.69
±0.18
0.83
CCI-allvs.usualcareb
0.25
±0.22
0.26
0.25
±0.18
0.17
0.24
±0.19
0.2
LDL-C
(mmol-1 )
CCI-alleducationa
172
0.28
(0.83)
2.87
(0.98)
7.79
10-6
0.28
±0.07
2.69
10-5
0.26
±0.06
2.94
±0.07
5.19
10-5
Usualcarea
48-
0.28
(0.97)
2.32
(0.8)
0.05
-0.28
±0.13
0.03
-0.28
±0.12
2.32
±0.12
0.02
CCI-allvs.usualcareb
0.56
±0.15
0.0003
0.56
±0.15
0.0002
0.54
±0.14
0.0001
Apo
B(g
L-1 )
CCI-alleducationa
186
-0.01
(0.24)
1.03
(0.29)
0.69
-0.0±
0.02
0.82
-0.02
±0.02
1.04
±0.02
0.37
Usualcarea
590.02
(0.37)
1.07
(0.39)
0.75
0.0±
0.04
0.9
0.0±
0.04
1.06
±0.04
0.95
CCI-allvs.usualcareb
-0.02
(0.05)
0.66
-0.01
±0.05
0.83
-0.02
±0.05
0.67
596 Diabetes Ther (2018) 9:583–612
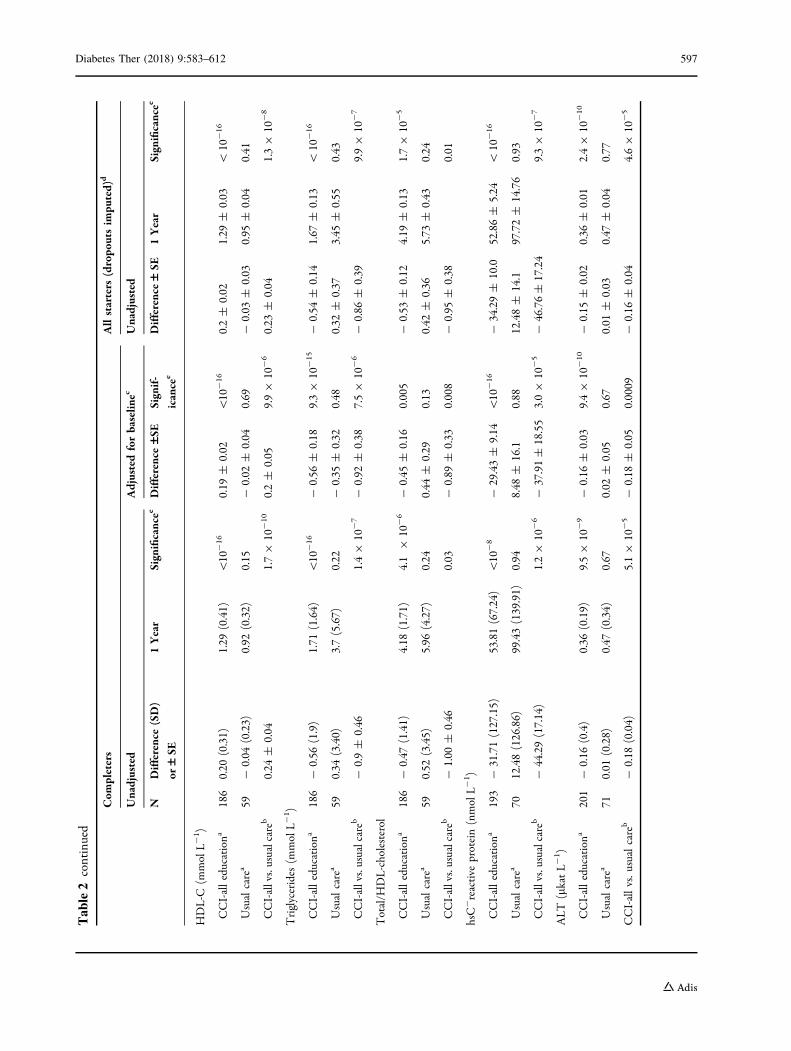
Table2
continued
Com
pleters
Allstarters
(dropo
utsim
puted)
d
Unadjusted
Adjustedforbaselin
ecUnadjusted
NDifference(SD)
or–SE
1Year
Significancee
Difference–S
ESignif-
icance
e
Difference–SE
1Year
Significancee
HDL-C
(mmolL-
1 )
CCI-alleducationa
186
0.20
(0.31)
1.29
(0.41)
\10
-16
0.19
±0.02
\10
-16
0.2±
0.02
1.29
±0.03
\10
-16
Usualcarea
59-
0.04
(0.23)
0.92
(0.32)
0.15
-0.02
±0.04
0.69
-0.03
±0.03
0.95
±0.04
0.41
CCI-allvs.usualcareb
0.24
±0.04
1.79
10-10
0.2±
0.05
9.99
10-6
0.23
±0.04
1.39
10-8
Triglycerides
(mmolL-
1 )
CCI-alleducationa
186
-0.56
(1.9)
1.71
(1.64)
\10
-16
-0.56
±0.18
9.39
10-15
-0.54
±0.14
1.67
±0.13
\10
-16
Usualcarea
590.34
(3.40)
3.7(5.67)
0.22
-0.35
±0.32
0.48
0.32
±0.37
3.45
±0.55
0.43
CCI-allvs.usualcareb
-0.9±
0.46
1.49
10-7
-0.92
±0.38
7.59
10-6
-0.86
±0.39
9.99
10-7
Total/H
DL-cholesterol
CCI-alleducationa
186
-0.47
(1.41)
4.18
(1.71)
4.1
910
-6
-0.45
±0.16
0.005
-0.53
±0.12
4.19
±0.13
1.79
10-5
Usualcarea
590.52
(3.45)
5.96
(4.27)
0.24
0.44
±0.29
0.13
0.42
±0.36
5.73
±0.43
0.24
CCI-allvs.usualcareb
-1.00
±0.46
0.03
-0.89
±0.33
0.008
-0.95
±0.38
0.01
hsC-reactive
protein(nmolL-
1 )
CCI-alleducationa
193
-31.71(127.15)
53.81(67.24)
\10
-8
-29.43±
9.14
\10
-16
-34.29±
10.0
52.86±
5.24
\10
-16
Usualcarea
7012.48(126.86)
99.43(139.91)
0.94
8.48
±16.1
0.88
12.48±
14.1
97.72±
14.76
0.93
CCI-allvs.usualcareb
-44.29(17.14)
1.29
10-6
-37.91±
18.55
3.09
10-5
-46.76±
17.24
9.39
10-7
ALT
(lkatL-
1 )
CCI-alleducationa
201
-0.16
(0.4)
0.36
(0.19)
9.59
10-9
-0.16
±0.03
9.49
10-10
-0.15
±0.02
0.36
±0.01
2.49
10-10
Usualcarea
710.01
(0.28)
0.47
(0.34)
0.67
0.02
±0.05
0.67
0.01
±0.03
0.47
±0.04
0.77
CCI-allvs.u
sualcareb
-0.18
(0.04)
5.19
10-5
-0.18
±0.05
0.0009
-0.16
±0.04
4.69
10-5
Diabetes Ther (2018) 9:583–612 597
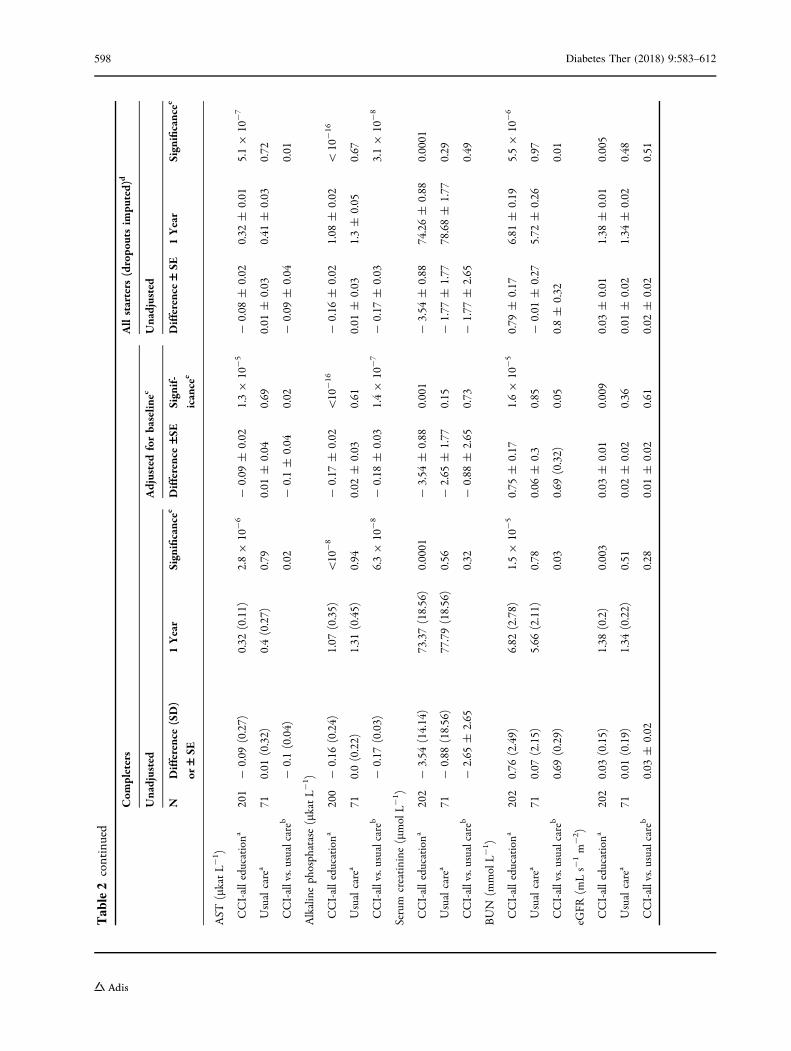
Table2
continued
Com
pleters
Allstarters
(dropo
utsim
puted)
d
Unadjusted
Adjustedforbaselin
ecUnadjusted
NDifference(SD)
or–SE
1Year
Significancee
Difference–S
ESignif-
icance
e
Difference–SE
1Year
Significancee
AST
(lkatL-
1 )
CCI-alleducationa
201
-0.09
(0.27)
0.32
(0.11)
2.89
10-6
-0.09
±0.02
1.39
10-5
-0.08
±0.02
0.32
±0.01
5.19
10-7
Usualcarea
710.01
(0.32)
0.4(0.27)
0.79
0.01
±0.04
0.69
0.01
±0.03
0.41
±0.03
0.72
CCI-allvs.usualcareb
-0.1(0.04)
0.02
-0.1±
0.04
0.02
-0.09
±0.04
0.01
Alkalinephosphatase(lkatL-
1 )
CCI-alleducationa
200
-0.16
(0.24)
1.07
(0.35)
\10
-8
-0.17
±0.02
\10
-16
-0.16
±0.02
1.08
±0.02
\10
-16
Usualcarea
710.0(0.22)
1.31
(0.45)
0.94
0.02
±0.03
0.61
0.01
±0.03
1.3±
0.05
0.67
CCI-allvs.usualcareb
-0.17
(0.03)
6.39
10-8
-0.18
±0.03
1.49
10-7
-0.17
±0.03
3.19
10-8
Serum
creatinine
(lmolL-
1 )
CCI-alleducationa
202
-3.54
(14.14)
73.37(18.56)
0.0001
-3.54
±0.88
0.001
-3.54
±0.88
74.26±
0.88
0.0001
Usualcarea
71-
0.88
(18.56)
77.79(18.56)
0.56
-2.65
±1.77
0.15
-1.77
±1.77
78.68±
1.77
0.29
CCI-allvs.usualcareb
-2.65
±2.65
0.32
-0.88
±2.65
0.73
-1.77
±2.65
0.49
BUN
(mmolL-
1 )
CCI-alleducationa
202
0.76
(2.49)
6.82
(2.78)
1.59
10-5
0.75
±0.17
1.69
10-5
0.79
±0.17
6.81
±0.19
5.59
10-6
Usualcarea
710.07
(2.15)
5.66
(2.11)
0.78
0.06
±0.3
0.85
-0.01
±0.27
5.72
±0.26
0.97
CCI-allvs.usualcareb
0.69
(0.29)
0.03
0.69
(0.32)
0.05
0.8±
0.32
0.01
eGFR
(mLs-
1m
-2 )
CCI-alleducationa
202
0.03
(0.15)
1.38
(0.2)
0.003
0.03
±0.01
0.009
0.03
±0.01
1.38
±0.01
0.005
Usualcarea
710.01
(0.19)
1.34
(0.22)
0.51
0.02
±0.02
0.36
0.01
±0.02
1.34
±0.02
0.48
CCI-allvs.usualcareb
0.03
±0.02
0.28
0.01
±0.02
0.61
0.02
±0.02
0.51
598 Diabetes Ther (2018) 9:583–612
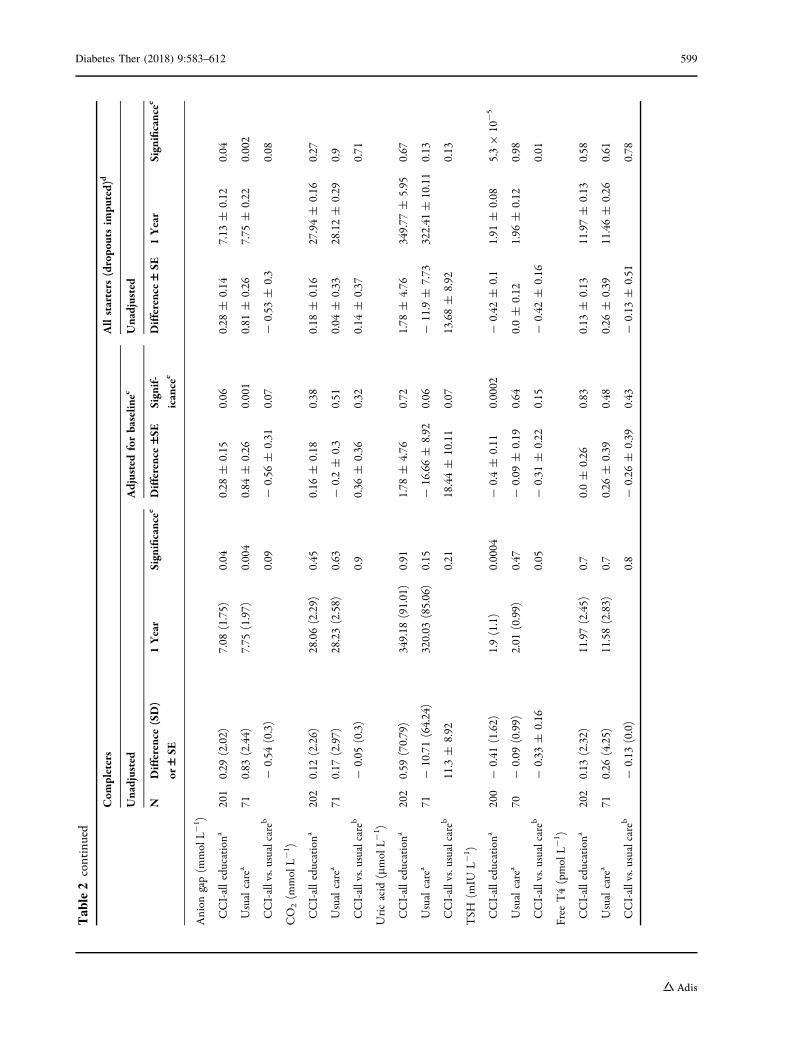
Table2
continued
Com
pleters
Allstarters
(dropo
utsim
puted)
d
Unadjusted
Adjustedforbaselin
ecUnadjusted
NDifference(SD)
or–SE
1Year
Significancee
Difference–S
ESignif-
icance
e
Difference–SE
1Year
Significancee
Anion
gap(m
molL-
1 )
CCI-alleducationa
201
0.29
(2.02)
7.08
(1.75)
0.04
0.28
±0.15
0.06
0.28
±0.14
7.13
±0.12
0.04
Usualcarea
710.83
(2.44)
7.75
(1.97)
0.004
0.84
±0.26
0.001
0.81
±0.26
7.75
±0.22
0.002
CCI-allvs.usualcareb
-0.54
(0.3)
0.09
-0.56
±0.31
0.07
-0.53
±0.3
0.08
CO
2(m
molL-1 )
CCI-alleducationa
202
0.12
(2.26)
28.06(2.29)
0.45
0.16
±0.18
0.38
0.18
±0.16
27.94±
0.16
0.27
Usualcarea
710.17
(2.97)
28.23(2.58)
0.63
-0.2±
0.3
0.51
0.04
±0.33
28.12±
0.29
0.9
CCI-allvs.usualcareb
-0.05
(0.3)
0.9
0.36
±0.36
0.32
0.14
±0.37
0.71
Uricacid
(lmolL-
1 )
CCI-alleducationa
202
0.59
(70.79)
349.18
(91.01)
0.91
1.78
±4.76
0.72
1.78
±4.76
349.77
±5.95
0.67
Usualcarea
71-
10.71(64.24)
320.03
(85.06)
0.15
-16.66±
8.92
0.06
-11.9
±7.73
322.41
±10.11
0.13
CCI-allvs.usualcareb
11.3
±8.92
0.21
18.44±
10.11
0.07
13.68±
8.92
0.13
TSH
(mIU
L-1 )
CCI-alleducationa
200
-0.41
(1.62)
1.9(1.1)
0.0004
-0.4±
0.11
0.0002
-0.42
±0.1
1.91
±0.08
5.39
10-5
Usualcarea
70-
0.09
(0.99)
2.01
(0.99)
0.47
-0.09
±0.19
0.64
0.0±
0.12
1.96
±0.12
0.98
CCI-allvs.usualcareb
-0.33
±0.16
0.05
-0.31
±0.22
0.15
-0.42
±0.16
0.01
Free
T4(pmolL-1 )
CCI-alleducationa
202
0.13
(2.32)
11.97(2.45)
0.7
0.0±
0.26
0.83
0.13
±0.13
11.97±
0.13
0.58
Usualcarea
710.26
(4.25)
11.58(2.83)
0.7
0.26
±0.39
0.48
0.26
±0.39
11.46±
0.26
0.61
CCI-allvs.usualcareb
-0.13
(0.0)
0.8
-0.26
±0.39
0.43
-0.13
±0.51
0.78
Diabetes Ther (2018) 9:583–612 599
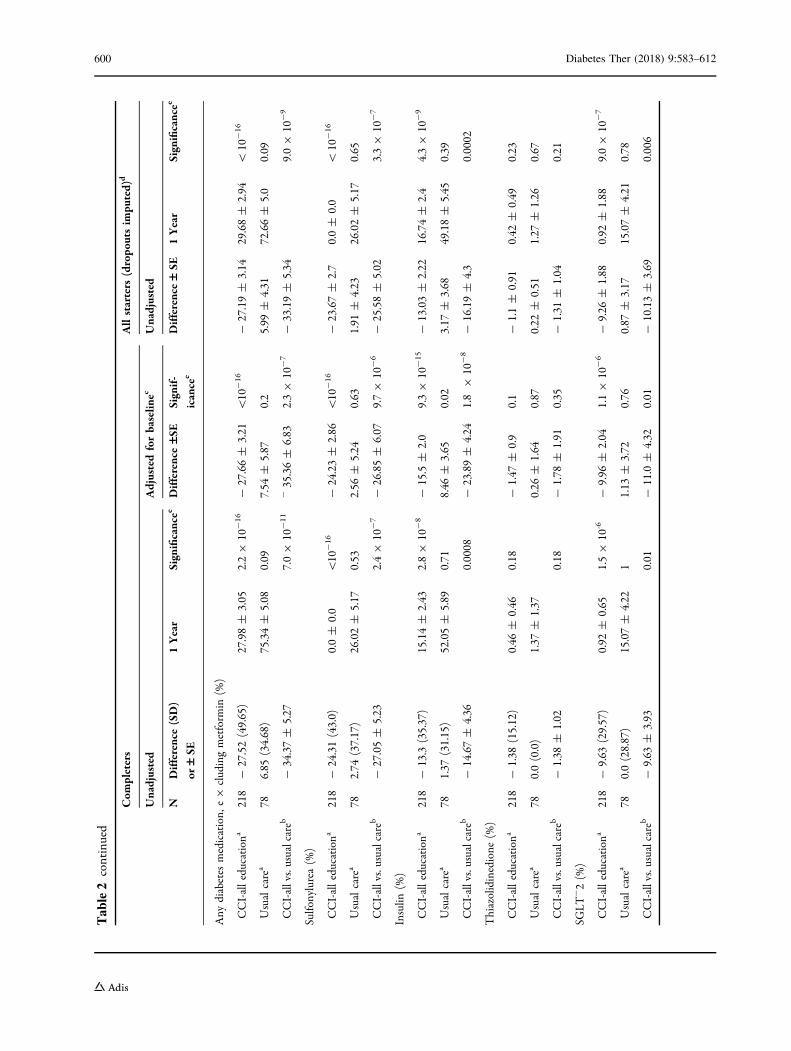
Table2
continued
Com
pleters
Allstarters
(dropo
utsim
puted)
d
Unadjusted
Adjustedforbaselin
ecUnadjusted
NDifference(SD)
or–SE
1Year
Significancee
Difference–S
ESignif-
icance
e
Difference–SE
1Year
Significancee
Any
diabetes
medication,
e9
cludingmetform
in(%
)
CCI-alleducationa
218
-27.52(49.65)
27.98±
3.05
2.29
10-16
-27.66±
3.21
\10
-16
-27.19±
3.14
29.68±
2.94
\10
-16
Usualcarea
786.85
(34.68)
75.34±
5.08
0.09
7.54
±5.87
0.2
5.99
±4.31
72.66±
5.0
0.09
CCI-allvs.usualcareb
-34.37±
5.27
7.09
10-11
-35.36±
6.83
2.39
10-7
-33.19±
5.34
9.09
10-9
Sulfo
nylurea(%
)
CCI-alleducationa
218
-24.31(43.0)
0.0±
0.0
\10
-16
-24.23±
2.86
\10
-16
-23.67±
2.7
0.0±
0.0
\10
-16
Usualcarea
782.74
(37.17)
26.02±
5.17
0.53
2.56
±5.24
0.63
1.91
±4.23
26.02±
5.17
0.65
CCI-allvs.usualcareb
-27.05±
5.23
2.49
10-7
-26.85±
6.07
9.79
10-6
-25.58±
5.02
3.39
10-7
Insulin
(%)
CCI-alleducationa
218
-13.3
(35.37)
15.14±
2.43
2.89
10-8
-15.5
±2.0
9.39
10-15
-13.03±
2.22
16.74±
2.4
4.39
10-9
Usualcarea
781.37
(31.15)
52.05±
5.89
0.71
8.46
±3.65
0.02
3.17
±3.68
49.18±
5.45
0.39
CCI-allvs.usualcareb
-14.67±
4.36
0.0008
-23.89±
4.24
1.8
910
-8
-16.19±
4.3
0.0002
Thiazolidinedione
(%)
CCI-alleducationa
218
-1.38
(15.12)
0.46
±0.46
0.18
-1.47
±0.9
0.1
-1.1±
0.91
0.42
±0.49
0.23
Usualcarea
780.0(0.0)
1.37
±1.37
0.26
±1.64
0.87
0.22
±0.51
1.27
±1.26
0.67
CCI-allvs.usualcareb
-1.38
±1.02
0.18
-1.78
±1.91
0.35
-1.31
±1.04
0.21
SGLT-2(%
)
CCI-alleducationa
218
-9.63
(29.57)
0.92
±0.65
1.59
10-6
-9.96
±2.04
1.19
10-6
-9.26
±1.88
0.92
±1.88
9.09
10-7
Usualcarea
780.0(28.87)
15.07±
4.22
11.13
±3.72
0.76
0.87
±3.17
15.07±
4.21
0.78
CCI-allvs.usualcareb
-9.63
±3.93
0.01
-11.0
±4.32
0.01
-10.13±
3.69
0.006
600 Diabetes Ther (2018) 9:583–612
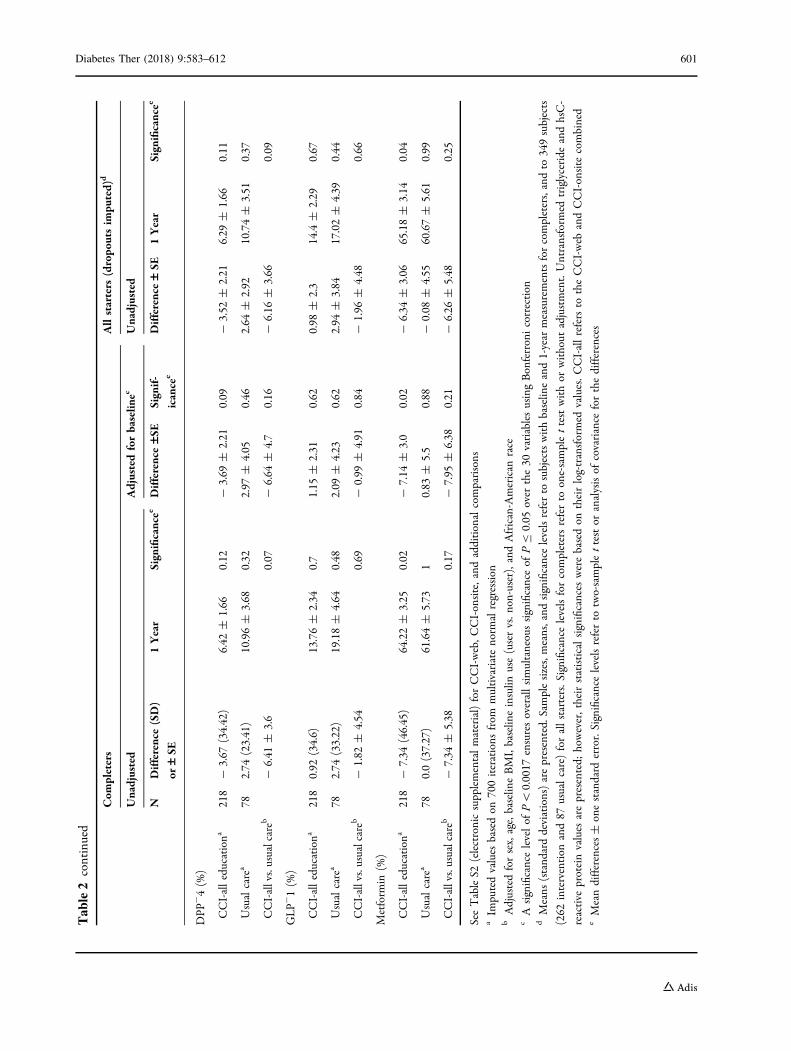
Table2
continued
Com
pleters
Allstarters
(dropo
utsim
puted)
d
Unadjusted
Adjustedforbaselin
ecUnadjusted
NDifference(SD)
or–SE
1Year
Significancee
Difference–S
ESignif-
icance
e
Difference–SE
1Year
Significancee
DPP
-4(%
)
CCI-alleducationa
218
-3.67
(34.42)
6.42
±1.66
0.12
-3.69
±2.21
0.09
-3.52
±2.21
6.29
±1.66
0.11
Usualcarea
782.74
(23.41)
10.96±
3.68
0.32
2.97
±4.05
0.46
2.64
±2.92
10.74±
3.51
0.37
CCI-allvs.usualcareb
-6.41
±3.6
0.07
-6.64
±4.7
0.16
-6.16
±3.66
0.09
GLP-
1(%
)
CCI-alleducationa
218
0.92
(34.6)
13.76±
2.34
0.7
1.15
±2.31
0.62
0.98
±2.3
14.4
±2.29
0.67
Usualcarea
782.74
(33.22)
19.18±
4.64
0.48
2.09
±4.23
0.62
2.94
±3.84
17.02±
4.39
0.44
CCI-allvs.usualcareb
-1.82
±4.54
0.69
-0.99
±4.91
0.84
-1.96
±4.48
0.66
Metform
in(%
)
CCI-alleducationa
218
-7.34
(46.45)
64.22±
3.25
0.02
-7.14
±3.0
0.02
-6.34
±3.06
65.18±
3.14
0.04
Usualcarea
780.0(37.27)
61.64±
5.73
10.83
±5.5
0.88
-0.08
±4.55
60.67±
5.61
0.99
CCI-allvs.usualcareb
-7.34
±5.38
0.17
-7.95
±6.38
0.21
-6.26
±5.48
0.25
SeeTableS2
(electronicsupplementalmaterial)forCCI-web,C
CI-onsite,and
additionalcomparisons
aIm
putedvalues
basedon
700iterations
from
multivariatenorm
alregression
bAdjustedforsex,age,baselin
eBMI,baselin
einsulin
use(uservs.n
on-user),and
African-American
race
cAsignificancelevelof
P\
0.0017
ensuresoverallsimultaneoussignificanceof
PB
0.05
over
the30
variablesusingBonferronicorrection
dMeans
(stand
arddeviations)arepresented.Samplesizes,means,and
significancelevelsreferto
subjectswithbaselin
eand1-year
measurementsforcompleters,andto
349subjects
(262
intervention
and87
usualcare)forallstarters.S
ignificance
levelsforcompletersreferto
one-samplettestwithor
without
adjustment.Untransform
edtriglyceride
andhsC-
reactive
proteinvalues
arepresented;
however,theirstatisticalsignificances
werebasedon
theirlog-transformed
values.C
CI-allrefersto
theCCI-web
andCCI-onsite
combined
eMeandifferences±
onestandard
error.Significancelevelsreferto
two-samplettestor
analysisof
covariance
forthedifferences
Diabetes Ther (2018) 9:583–612 601
diabetes medication (57% were prescribed adiabetes medication other than metformin,30% prescribed insulin) and 93% were obese.Eighty-seven percent of participants in UC atbaseline were prescribed diabetes medication(46% prescribed insulin), and 82% were obese.Forty-four participants (16.8%) withdrew fromthe CCI, 22 from each education delivery mode.Baseline characteristics of CCI dropouts did notdiffer significantly from the 218 completersexcept none of the five thiazolidinedione userswere dropouts (Table 1). At baseline, character-istics of CCI participants who self-selected web-based versus on-site education were not signifi-cantly different after accounting for multiplecomparisons (see Table S1 in the electronicsupplementary material). Compared to the 78UC participants who completed the study, thenine that withdrew tended to be older (58 ver-sus 52 years old), had lower TSH, and fewer wereprescribed insulin, SGLT-2, DPP-4, GLP-1, orblood pressure medications (Table 1).
Effectiveness
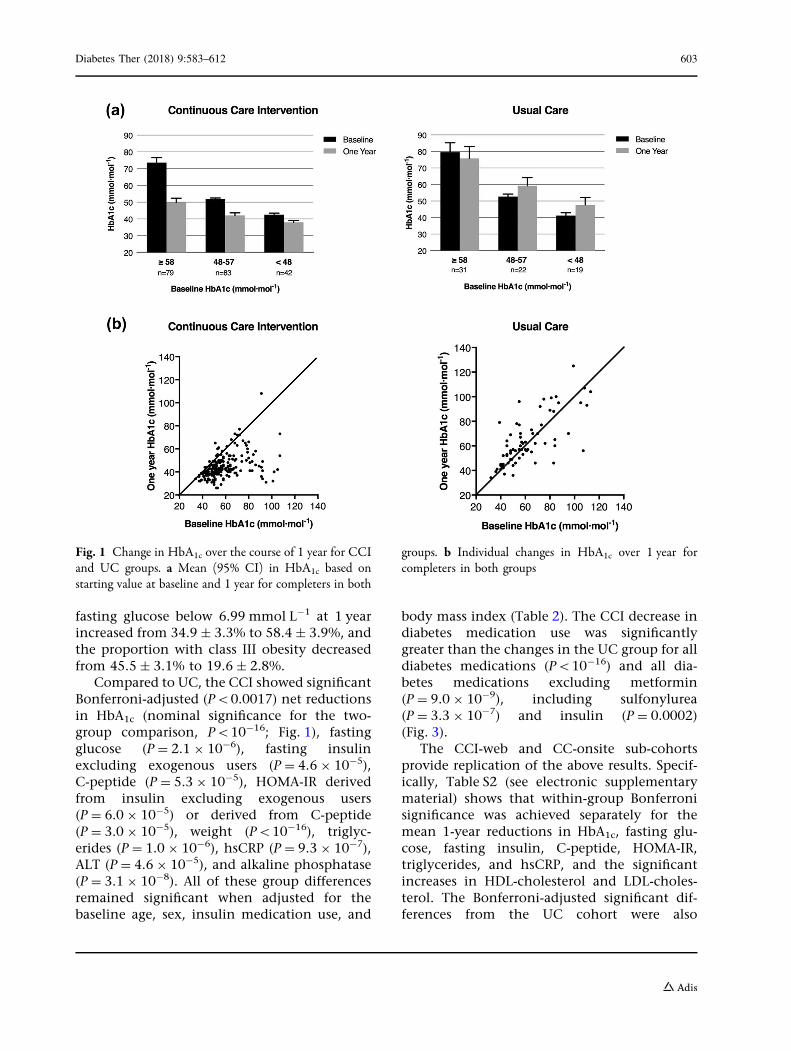
Table 2 presents mean 1-year changes inbiomarkers. In the CCI, HbA1c was significantlyreduced 17%, from 60 ± 1.0 mmol mol-1
(7.6 ± 0.09%) at baseline to 45 ± 0.8 mmolmol-1 (6.3 ± 0.07%) after 1 year (nominal sig-nificance P\1.0 9 10-16; Fig. 1). Eighty-fivepercent (174/204) of CCI participants complet-ing 1-year HbA1c testing observed a declinegreater than 2.2 mmol mol-1 ([0.2%) in themeasure. When adjusted for multiple compar-isons, significant within-CCI reductions wereobserved in fasting glucose (- 22%, P\1.0 9
10-16), fasting insulin (- 43%, P = 6.7 9 10-16),C-peptide (- 23%, P = 2.2 9 10-16), HOMA-IRderived from fasting insulin excluding exoge-nous users (- 55%, P = 3.2 9 10-5), HOMA-IRderived from C-peptide (- 29%, P = 1.0 9
10-13), weight from clinic measurements(- 12%, P\1.0 9 10-16), weight from homescales (- 13%, P\1.0 9 10-16, Fig. 2), triglyc-erides (- 24%, P\1.0 9 10-16), high-sensitivityC-reactive protein (- 39%, P\1.0 9 10-16),ALT (- 30%, P = 2.4 9 10-10), AST (- 21%,P = 5.1 9 10-7), and alkaline phosphatase
(- 13%, P\1.0 9 10-16). HDL-cholesterolincreased 18% (P\1.0 9 10-16) and calculatedLDL-cholesterol increased 10% (P = 5.1 9 10-5)while apolipoprotein B (ApoB) concentrationwas unchanged (P = 0.37) for participants in theCCI. There were no significant differences inmean biomarker changes between CCI-web andCCI-onsite (see Table S2 in the electronic sup-plementary material). In contrast to the CCI,patients enrolled in UC for 1 year showed noBonferroni-adjusted significant change for anyof the biomarkers measured (Table 2).
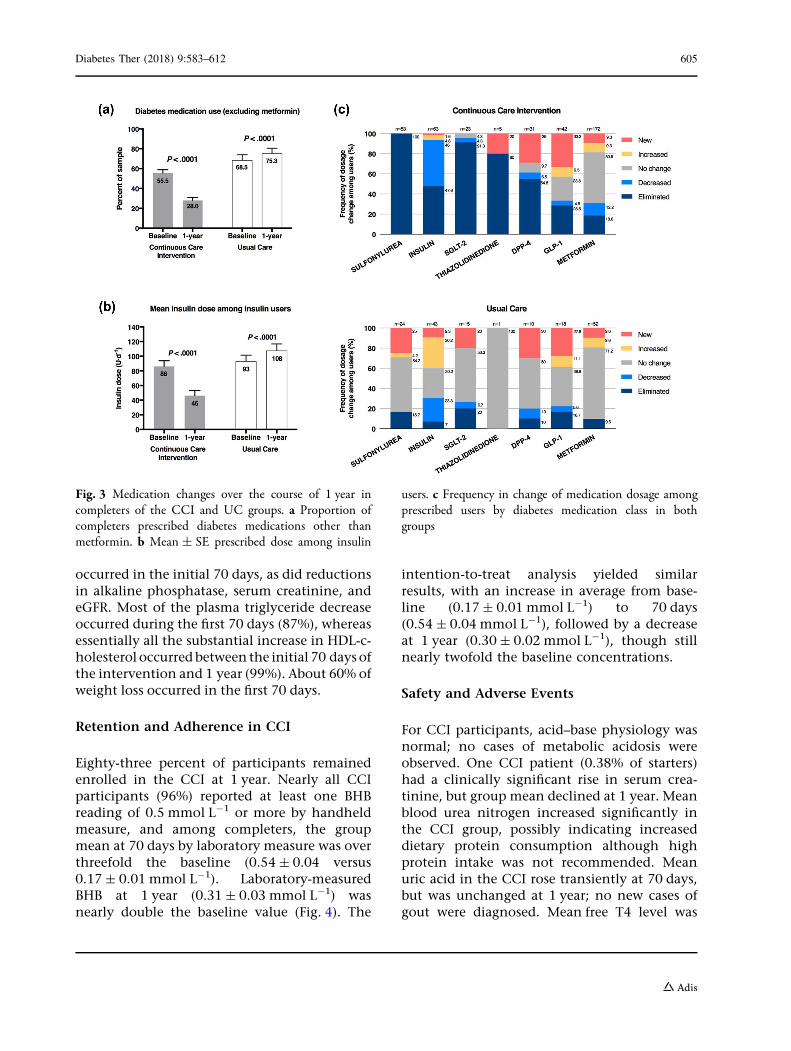
Following 1 year of CCI, usage of all diabetesmedications combined (excluding metformin)was reduced significantly (56.9 ± 3.1% to 29.7± 3.0%, P\1.0 9 10-16) through decreasedprescriptions for DPP-4 (9.9–6.3%, P = 0.11),insulin (29.8–16.7%, P = 4.3 9 10-9), SGLT-2inhibitors (10.3–0.9%, P = 9 9 10-7), sulfony-lureas (23.7–0%, P\1.0 9 10-16), and thiazo-lidinediones (1.5–0.4%, P = 0.23) (Fig. 3). GLP-1prescriptions were statistically unchanged(13.4% at baseline to 14.4% at 1 year, P = 0.67),and metformin decreased slightly (71.4–65.0%,P = 0.04) for CCI participants. Forty percent(31/78) of CCI participants who began the studywith insulin prescriptions (average dose of64.2 units) eliminated the medication, whilethe remaining 60% (47/78) of insulin usersreduced daily dosage from 105.2 to 53.8 units(P\0.0001). Patients enrolled in UC for 1 yearshowed no Bonferroni-adjusted significantchange for prescription of medication. For the34 UC participants that continued using insu-lin, the average daily dose increased from 96.0to 111.9 units.
The proportion of participants in the totalimputed CCI group with HbA1cbelow 48 mmolmol-1 (\6.5%) increased from 19.5 ± 2.4% to69.8 ± 3.1%. Of those in the CCI with HbA1c
reported at 1 year, 72% (147/204) achievedHbA1c below 48 mmol mol-1 (6.5%) and 60.3%(123/204) of participants achieved HbA1c below48 mmol mol-1 (\6.5%) while taking no dia-betes medication or only metformin. Of thosein the CCI with HbA1c below 48 mmol mol-1
(\6.5%) at 1 year, 42.3% (52/123) were pre-scribed no diabetes medication and 57.7% (71/123) were prescribed metformin only. The pro-portion of the total imputed CCI group with
602 Diabetes Ther (2018) 9:583–612
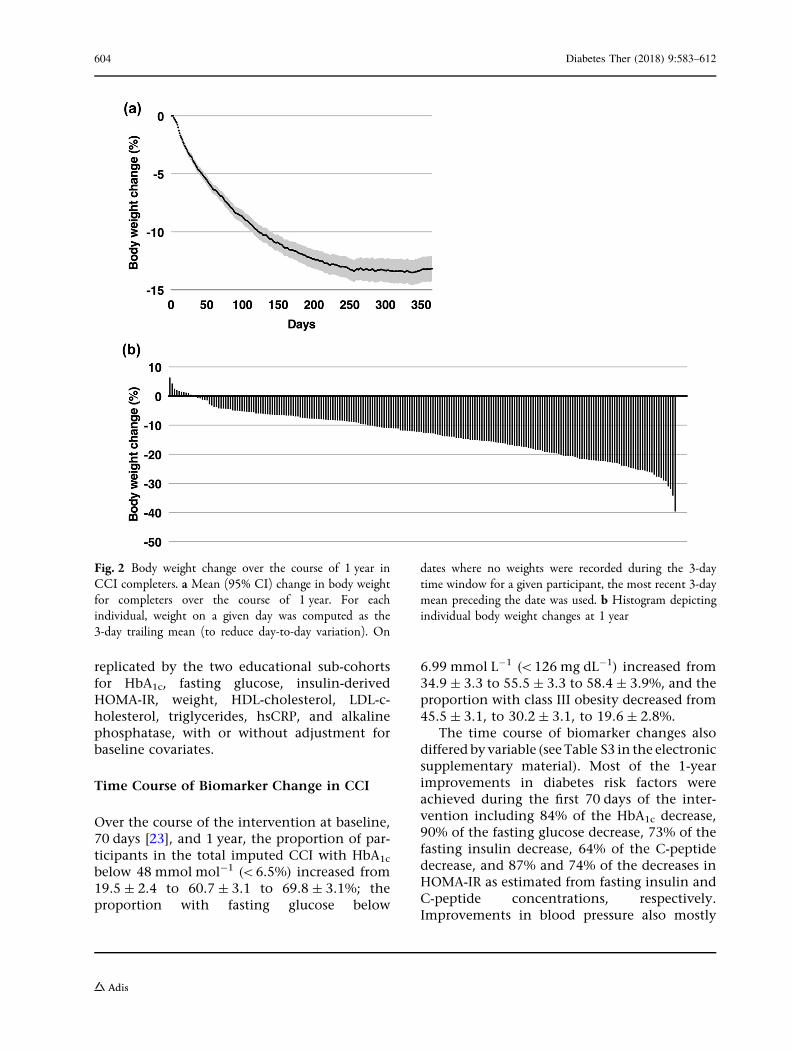
fasting glucose below 6.99 mmol L-1 at 1 yearincreased from 34.9 ± 3.3% to 58.4 ± 3.9%, andthe proportion with class III obesity decreasedfrom 45.5 ± 3.1% to 19.6 ± 2.8%.
Compared to UC, the CCI showed significantBonferroni-adjusted (P\0.0017) net reductionsin HbA1c (nominal significance for the two-group comparison, P\10-16; Fig. 1), fastingglucose (P = 2.1 9 10-6), fasting insulinexcluding exogenous users (P = 4.6 9 10-5),C-peptide (P = 5.3 9 10-5), HOMA-IR derivedfrom insulin excluding exogenous users(P = 6.0 9 10-5) or derived from C-peptide(P = 3.0 9 10-5), weight (P\10-16), triglyc-erides (P = 1.0 9 10-6), hsCRP (P = 9.3 9 10-7),ALT (P = 4.6 9 10-5), and alkaline phosphatase(P = 3.1 9 10-8). All of these group differencesremained significant when adjusted for thebaseline age, sex, insulin medication use, and
body mass index (Table 2). The CCI decrease indiabetes medication use was significantlygreater than the changes in the UC group for alldiabetes medications (P\10-16) and all dia-betes medications excluding metformin(P = 9.0 9 10-9), including sulfonylurea(P = 3.3 9 10-7) and insulin (P = 0.0002)(Fig. 3).
The CCI-web and CC-onsite sub-cohortsprovide replication of the above results. Specif-ically, Table S2 (see electronic supplementarymaterial) shows that within-group Bonferronisignificance was achieved separately for themean 1-year reductions in HbA1c, fasting glu-cose, fasting insulin, C-peptide, HOMA-IR,triglycerides, and hsCRP, and the significantincreases in HDL-cholesterol and LDL-choles-terol. The Bonferroni-adjusted significant dif-ferences from the UC cohort were also
Fig. 1 Change in HbA1c over the course of 1 year for CCIand UC groups. a Mean (95% CI) in HbA1c based onstarting value at baseline and 1 year for completers in both
groups. b Individual changes in HbA1c over 1 year forcompleters in both groups
Diabetes Ther (2018) 9:583–612 603
replicated by the two educational sub-cohortsfor HbA1c, fasting glucose, insulin-derivedHOMA-IR, weight, HDL-cholesterol, LDL-c-holesterol, triglycerides, hsCRP, and alkalinephosphatase, with or without adjustment forbaseline covariates.
Time Course of Biomarker Change in CCI
Over the course of the intervention at baseline,70 days [23], and 1 year, the proportion of par-ticipants in the total imputed CCI with HbA1c
below 48 mmol mol-1 (\6.5%) increased from19.5 ± 2.4 to 60.7 ± 3.1 to 69.8 ± 3.1%; theproportion with fasting glucose below
6.99 mmol L-1 (\126 mg dL-1) increased from34.9 ± 3.3 to 55.5 ± 3.3 to 58.4 ± 3.9%, and theproportion with class III obesity decreased from45.5 ± 3.1, to 30.2 ± 3.1, to 19.6 ± 2.8%.
The time course of biomarker changes alsodiffered by variable (see Table S3 in the electronicsupplementary material). Most of the 1-yearimprovements in diabetes risk factors wereachieved during the first 70 days of the inter-vention including 84% of the HbA1c decrease,90% of the fasting glucose decrease, 73% of thefasting insulin decrease, 64% of the C-peptidedecrease, and 87% and 74% of the decreases inHOMA-IR as estimated from fasting insulin andC-peptide concentrations, respectively.Improvements in blood pressure also mostly
Fig. 2 Body weight change over the course of 1 year inCCI completers. a Mean (95% CI) change in body weightfor completers over the course of 1 year. For eachindividual, weight on a given day was computed as the3-day trailing mean (to reduce day-to-day variation). On
dates where no weights were recorded during the 3-daytime window for a given participant, the most recent 3-daymean preceding the date was used. b Histogram depictingindividual body weight changes at 1 year
604 Diabetes Ther (2018) 9:583–612
occurred in the initial 70 days, as did reductionsin alkaline phosphatase, serum creatinine, andeGFR. Most of the plasma triglyceride decreaseoccurred during the first 70 days (87%), whereasessentially all the substantial increase in HDL-c-holesterol occurredbetween the initial 70 days ofthe intervention and 1 year (99%). About 60% ofweight loss occurred in the first 70 days.
Retention and Adherence in CCI
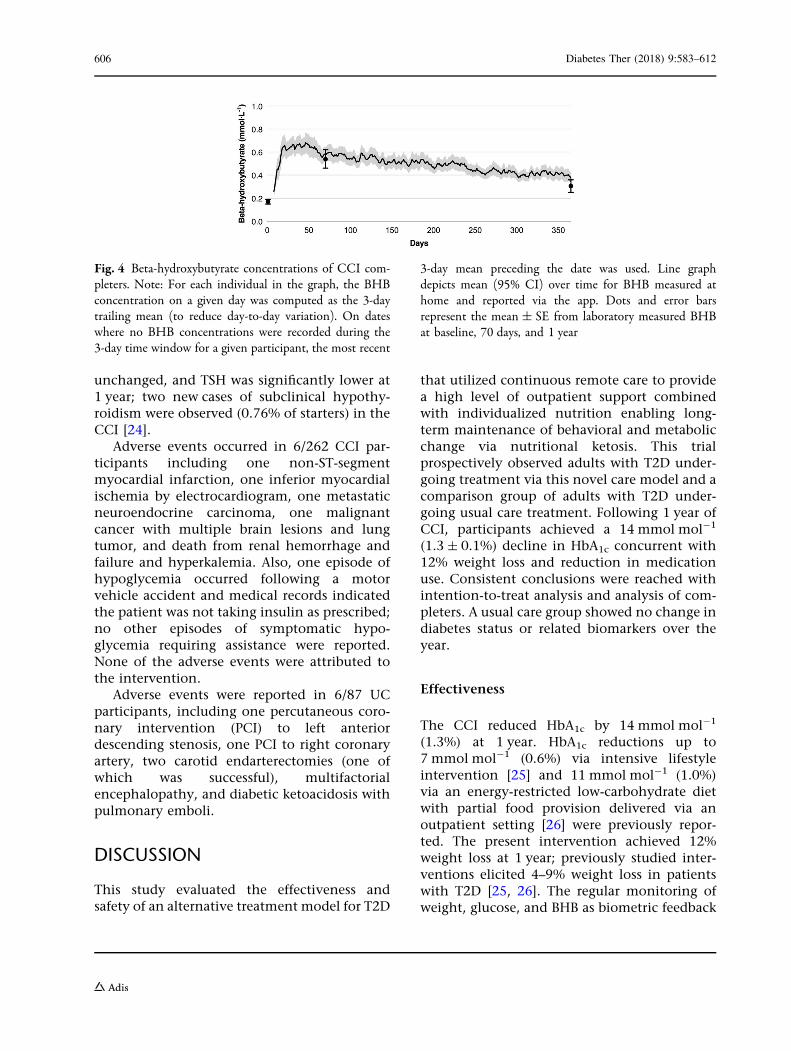
Eighty-three percent of participants remainedenrolled in the CCI at 1 year. Nearly all CCIparticipants (96%) reported at least one BHBreading of 0.5 mmol L-1 or more by handheldmeasure, and among completers, the groupmean at 70 days by laboratory measure was overthreefold the baseline (0.54 ± 0.04 versus0.17 ± 0.01 mmol L-1). Laboratory-measuredBHB at 1 year (0.31 ± 0.03 mmol L-1) wasnearly double the baseline value (Fig. 4). The
intention-to-treat analysis yielded similarresults, with an increase in average from base-line (0.17 ± 0.01 mmol L-1) to 70 days(0.54 ± 0.04 mmol L-1), followed by a decreaseat 1 year (0.30 ± 0.02 mmol L-1), though stillnearly twofold the baseline concentrations.
Safety and Adverse Events
For CCI participants, acid–base physiology wasnormal; no cases of metabolic acidosis wereobserved. One CCI patient (0.38% of starters)had a clinically significant rise in serum crea-tinine, but group mean declined at 1 year. Meanblood urea nitrogen increased significantly inthe CCI group, possibly indicating increaseddietary protein consumption although highprotein intake was not recommended. Meanuric acid in the CCI rose transiently at 70 days,but was unchanged at 1 year; no new cases ofgout were diagnosed. Mean free T4 level was
Fig. 3 Medication changes over the course of 1 year incompleters of the CCI and UC groups. a Proportion ofcompleters prescribed diabetes medications other thanmetformin. b Mean ± SE prescribed dose among insulin
users. c Frequency in change of medication dosage amongprescribed users by diabetes medication class in bothgroups
Diabetes Ther (2018) 9:583–612 605
unchanged, and TSH was significantly lower at1 year; two new cases of subclinical hypothy-roidism were observed (0.76% of starters) in theCCI [24].
Adverse events occurred in 6/262 CCI par-ticipants including one non-ST-segmentmyocardial infarction, one inferior myocardialischemia by electrocardiogram, one metastaticneuroendocrine carcinoma, one malignantcancer with multiple brain lesions and lungtumor, and death from renal hemorrhage andfailure and hyperkalemia. Also, one episode ofhypoglycemia occurred following a motorvehicle accident and medical records indicatedthe patient was not taking insulin as prescribed;no other episodes of symptomatic hypo-glycemia requiring assistance were reported.None of the adverse events were attributed tothe intervention.
Adverse events were reported in 6/87 UCparticipants, including one percutaneous coro-nary intervention (PCI) to left anteriordescending stenosis, one PCI to right coronaryartery, two carotid endarterectomies (one ofwhich was successful), multifactorialencephalopathy, and diabetic ketoacidosis withpulmonary emboli.
DISCUSSION
This study evaluated the effectiveness andsafety of an alternative treatment model for T2D
that utilized continuous remote care to providea high level of outpatient support combinedwith individualized nutrition enabling long-term maintenance of behavioral and metabolicchange via nutritional ketosis. This trialprospectively observed adults with T2D under-going treatment via this novel care model and acomparison group of adults with T2D under-going usual care treatment. Following 1 year ofCCI, participants achieved a 14 mmol mol-1
(1.3 ± 0.1%) decline in HbA1c concurrent with12% weight loss and reduction in medicationuse. Consistent conclusions were reached withintention-to-treat analysis and analysis of com-pleters. A usual care group showed no change indiabetes status or related biomarkers over theyear.
Effectiveness
The CCI reduced HbA1c by 14 mmol mol-1
(1.3%) at 1 year. HbA1c reductions up to7 mmol mol-1 (0.6%) via intensive lifestyleintervention [25] and 11 mmol mol-1 (1.0%)via an energy-restricted low-carbohydrate dietwith partial food provision delivered via anoutpatient setting [26] were previously repor-ted. The present intervention achieved 12%weight loss at 1 year; previously studied inter-ventions elicited 4–9% weight loss in patientswith T2D [25, 26]. The regular monitoring ofweight, glucose, and BHB as biometric feedback
Fig. 4 Beta-hydroxybutyrate concentrations of CCI com-pleters. Note: For each individual in the graph, the BHBconcentration on a given day was computed as the 3-daytrailing mean (to reduce day-to-day variation). On dateswhere no BHB concentrations were recorded during the3-day time window for a given participant, the most recent
3-day mean preceding the date was used. Line graphdepicts mean (95% CI) over time for BHB measured athome and reported via the app. Dots and error barsrepresent the mean ± SE from laboratory measured BHBat baseline, 70 days, and 1 year
606 Diabetes Ther (2018) 9:583–612
for participant, health coach, and medical pro-vider may have provided behavior reinforce-ment. Further, it seems plausible that thismulticomponent care model allowed for greaterimprovements compared to interventions thatprovided a subset of components. A recent pri-mary care-led weight management interventionutilizing a 3–5 month VLCD resulted in a10 mmol mol-1 (0.9%) reduction in HbA1c and10% weight loss at 1 year; 46% of participantsachieved HbA1c below 48 mmol mol-1 (\6.5%)while taking no medications [27]. While only25% of participants in the present investigationachieved this measure of diabetes remission, theprotocol for the present investigation discon-tinued metformin prescription only because ofcontraindication, intolerance, or patientrequest given its efficacy for T2D preventionand recommended use in certain populations[7]. An additional 35% of participants in thepresent investigation were able to attain HbA1c
below 48 mmol mol-1 (\6.5%) while takingonly metformin. The longer duration of T2Dand baseline insulin prescription to 30% ofparticipants might be factors influencing theproportion of participants in which glycemiccontrol medications could be discontinued inthis investigation.
HbA1c improved concurrent with medicationreductions prescribed for blood glucose-lower-ing. For each medication class, the sum per-centage of eliminations and reductions ofprescriptions at 1 year exceeded that observed at70 days [23]. Improved glycemic control via apredominantly pharmaceutical approach hasdemonstrated paradoxical increased cardiovas-cular risk [28]. Tight glycemic control can elicitsymptomatic hypoglycemia [29] or weight gain[30], neither of which was observed in CCI.Thus, it is likely the treatment method by whichglycemic control is achieved (e.g., pharmaco-logical, surgery, lifestyle intervention) isimportant to health outcomes and risk.
Most changes in HbA1c, glucose, insulin,C-peptide, and HOMA-IR occurred in the first70 days with further improvement observed at1 year. While the mechanism for improvedinsulin sensitivity in ketosis is not fully under-stood, early improvements in HbA1c andHOMA-IR indicate rapid restoration of liver and
peripheral insulin sensitivity and are consistentwith improvements observed within 2 weeks ofketosis when measured by euglycemic hyperin-sulinemic clamp [13]. Utilization of blood BHBfor self-monitoring with reinforcement by clin-icians may have contributed to sustained HbA1c
improvement. Further, BHB acts as a signalingmolecule, reducing inflammation and oxidativestress [14, 15]; therefore, mild ketonemia maybenefit multiple organs and systems. Withappropriate dietary formulation, benefits ofnutritional ketosis are observed in mouse mod-els of longevity and health span [31, 32]. Par-ticipant mean BHB levels are of similarmagnitude to those observed with SGLT-2inhibitor treatment (* 0.5 mmol L-1) [33].Recent trials [5, 34] demonstrate cardiovascularbenefits to two SGLT-2 inhibitors; mild ketosiswas postulated as a mechanism [33]. Nutri-tionally achieved ketosis may have long-termcardiovascular benefits without the pharma-ceutical risk profile [34]. Further, presence ofglucose and palmitate has been associated withbeta cell apoptosis [35]. Given the reducedlevels of glucose and palmitate observed duringnutritional ketosis [36], it is plausible thatketosis might play a role in attenuating glucol-ipotoxicity-induced beta cell death.
Beyond achieving improved glycemic con-trol concurrent with medication and weightreductions, the CCI had broad positive impacton blood pressure, liver enzymes, hsCRP,triglycerides, and HDL-C. Elevated ALT, AST,and ALP are associated with non-alcoholic fattyliver disease and non-alcoholic steatohepatitis[37]; these enzymes were significantly reducedwith intervention. Rapid reduction in triglyc-erides and gradual rise in HDL-C observed fol-lowing CCI are consistent with previouslystudied carbohydrate-restricted interventionsand carbohydrates are well known to increasetriglycerides [38]. Of the 108 CCI completerswith elevated baseline triglycerides(C 1.69 mmol L-1), 54% were in normal rangeat 1 year. Rise in LDL-C at 1 year, occurring withsignificant triglyceride decrease, was expected asthere is less exchange via cholesteryl estertransfer protein [39]. However, this exchangewould not affect particle number and ApoB wasunchanged, suggesting an overall neutral
Diabetes Ther (2018) 9:583–612 607
impact on LDL lipoprotein-associated cardio-vascular risk. In epidemiological studies, uti-lization of dietary saturated fat in place ofcarbohydrate was associated with beneficialimpact on lipid profile, cardiovascular out-comes, and mortality despite higher LDL-C[40, 41]. Transiently increased total and LDLcholesterol were also associated with mobiliza-tion of adipose cholesterol stores during majorweight loss [42].
Consistent with population-level studiesthat observed very low rates of diabetes remis-sion [43], the UC group had no change in HbA1c
and other indicators of glycemic status andinsulin resistance but a net increase in diabetesmedication use. Laboratory tests were generallyunremarkable with biomarkers not changingsignificantly. The same facilities and method-ologies were used for both the CCI and UCparticipants indicating that the changesobserved in CCI participants not observed inthe UC participants are unlikely to be due tomethodological changes in clinical or labora-tory data capture.
Despite independent recruitment of the CCIand UC groups, most of their baseline charac-teristics including HbA1c and years since dia-betes diagnosis were not significantly different.To enable a comparison between the CCI andUC groups, covariate adjustment was utilized toadjust for differences in baseline characteristicsincluding sex, age, baseline BMI, baseline insu-lin use (user vs. non-user), and African-Ameri-can race. With or without baseline adjustment,the change over 1 year elicited in the CC andUC groups differ in all primary outcomes—HbA1c, medication use, and weight—and mostsecondary outcomes including lipid profile,inflammation, and liver function. In general,the favorable changes observed in the CCI werenot observed in the UC cohort. For example, ofpatients who obtained HbA1c measurements at1 year, 60% of CCI participants achieved aHbA1c below 48 mmol mol-1 (\6.5%) whiletaking no diabetes medications or metforminonly, whereas only 10% of UC participantsachieved this status.
One interpretation of these results is that thedifferences in observed outcomes over the yearare due to advantages of the CCI over usual
care. This suggests a need to incorporate car-bohydrate restriction and comprehensive, con-tinuous remote care as options in currentguidelines for patients with diabetes as evidenceaccumulates [44]. However, alternative expla-nations are possible that may account for thelarge degree of difference observed. Forinstance, patients entering the CCI wererecruited knowing that they were making acommitment to lifestyle change, while the UCparticipants were identified as recent referrals tolocal diabetes education programs and may nothave had similar motivation or expectations ofeffort as the CCI participants. However, evenwhen motivation is controlled for uponrecruitment as an inclusion criterion for par-ticipation, additional factors may play a role inretention as evidenced by a recent study withrandomization [45]. Also, the CCI and UCcohorts may also have differed in baselinecharacteristics that were not captured such associoeconomic status.
Additionally, the treatment intensity of thetwo cohorts was not equal. The UC participantshad one or more meetings with a registereddietitian and were under the medical supervi-sion of their primary care provider or endocri-nologist with periodic medical visits. Incontrast, the CCI participants received a com-prehensive and individualized continuousremote care intervention (and in one subgroup,the addition of on-site group classes). A moreintensive intervention might have deliveredsomewhat better results than the investigation’sUC group. For instance, a recent in-persongroup-based intervention for weight loss in T2Dadults reduced HbA1c by 3 mmol mol-1 (0.3%)and weight by 4.0% after a year and medica-tions were reduced in 26% of participants [46].Future research might compare interventions ofsimilar intensity with different treatmentstrategies to begin to understand the contribu-tion of each component of the intervention tothe overall effect.
Adherence to CCI
Eighty-three percent of CCI participants wereretained through 1 year; patient perceived
608 Diabetes Ther (2018) 9:583–612
benefits of favorable health outcomes, individ-ualized continuity of care, relationship withhealth coach, ongoing education, biometricfeedback, and peer support may have aidedretention. Most participants achieved nutri-tional ketosis during CCI and maintained ele-vated BHB at 1 year, indicating sustainabilityand was possibly enabled by the novel use ofblood BHB as daily biofeedback for adherence.
Safety of CCI
No episodes of ketoacidosis, no hypo- or hyper-glycemic events requiring assistance, and noadverse eventswere attributable to theCCI.Withimprovements or no change in liver, kidney, andthyroid function, safety of the interventionappears favorable. The absence of hypoglycemicevents requiring assistance despite relativelytight glucose control may be due to the carefulmedical provider prescription management,especially rapid downward titration of insulinand sulfonylurea preventing hypoglycemia fol-lowing dietary changes. Additionally, elevatedBHB may have offered protection against hypo-glycemic events, as starvation-adapted humanswith elevated BHB have demonstrated fullpreservation of central nervous system functiondespite profound hypoglycemia induced byexogenous insulin [47].
Study Strengths and Weaknesses
Prior studies have demonstrated favorableimprovements in T2D status following carefullymanaged ketogenic diets as case series [48] or insmall short-term randomized trials [45]. Thisstudy’s strengths include its prospective design,large cohort, high retention, duration, replica-tion of findings between the CCI-onsite andCCI-web groups, and the collection of multipletime points in the intervention group allowingassessment of how biomarkers changed overtime. This study also included participants pre-scribed insulin and with long-standing T2D,which were often exclusion criteria for priorstudies. The means of recruitment, outpatientsetting, and lack of food provision may enhancethe real-world application of this study.
Weaknesses of this study include that itoccurred at a single site and participants weremostly Caucasian. Socioeconomic and psy-chosocial status and genetics data were notcollected. The study was not of sufficient sizeand duration to measure hard endpoints (e.g.,mortality). Future trials could include a multi-site randomized controlled trial with greaterracial and ethnic diversity, broader age range,and greater disease severity.
CONCLUSIONS
This study demonstrated that a T2D interven-tion combining technology-enabled continu-ous remote care with individualized care plansencouraging nutritional ketosis can signifi-cantly reduce HbA1c, medication use, andweight within 70 days [23], and that these out-comes can be maintained or improved through1 year. Most intervention participants withHbA1c reported at 1 year achieved glycemiccontrol in the sub-diabetes range with either nomedication or the use of metformin alone.Related health parameters improved includingblood pressure, lipid-lipoprotein profile,inflammation, and liver function. Ongoingresearch will determine the continued sustain-ability, effectiveness, and safety of thesebehavioral and metabolic changes.
ACKNOWLEDGEMENTS
The authors thank the participants for theircommitment to health and advancing scientificknowledge. Special thanks to IUH staff, espe-cially Monica Keyes, Danielle Wharff, PattiMcKee, Joni Anderson, and Zachary Roberts, fortheir excellent patient care, as well as RachelBolden, Sydney Rivera, and Deklin Veenhuizen,who supported study logistics. We appreciatethe health coaches who worked one-on-onewith participants to help them achieve theirgoals—Brent Creighton PhD, Theresa Link RD,Bobbie Glon RN, and Marcy Abner RD. We aregrateful for Roxie McKee and her staff at IndianaUniversity Health Arnett Laboratory Servicesand Dave Gibson and Jennifer L. Powers and
Diabetes Ther (2018) 9:583–612 609
their staff at Washington University CLCS fortheir roles in sample analysis, as well as TerynSapper and staff from the Volek Laboratory atOhio State University for their assistance withsample storage and transportation logistics.
Funding. Sponsorship for this study andarticle processing charges were funded by VirtaHealth Corp., San Francisco, CA, USA.
Authorship. All named authors meet theInternational Committee of Medical JournalEditors (ICMJE) criteria for authorship for thisarticle, take responsibility for the integrity ofthe work as a whole, and have given theirapproval for this version to be published. Con-tributions: conceptualization and methodol-ogy, Sarah J. Hallberg, Amy L. McKenzie, WayneW. Campbell, Tamara Hazbun, Brittanie M.Volk, James P. McCarter, Stephen D. Phinney,and Jeff S. Volek; formal analysis, Paul Williams;investigation, Sarah J. Hallberg, Amy L.McKenzie, Tamara Hazbun, Brittanie M. Volk;Writing-Original Draft, Amy L. McKenzie, PaulWilliams, James P. McCarter; writing-reviewand editing, Sarah J. Hallberg, Amy L. McKen-zie, Paul Williams, Nasir H. Bhanpuri, Anne L.Peters, Wayne W. Campbell, Tamara Hazbun,Brittanie M. Volk, James P. McCarter, StephenD. Phinney, Jeff S. Volek; visualization, Amy L.McKenzie, Paul Williams, Nasir H. Bhanpuri,Stephen D. Phinney. All authors had full accessto all of the data in this study and take completeresponsibility for the integrity of the data andaccuracy of the data analysis.
Disclosures. Virta Health Corp. funded thisresearch study. Sarah J. Hallberg is an employeeof Virta Health Corp. and has been offered stockoptions. Amy L. McKenzie is an employee ofVirta Health Corp. and has been offered stockoptions. Nasir H. Bhanpuri is an employee ofVirta Health Corp. and has been offered stockoptions. Brittanie M. Volk is an employee ofVirta Health Corp. and has been offered stockoptions. James P. McCarter is an employee ofVirta Health Corp. and has been offered stockoptions. Stephen D. Phinney is an employee ofVirta Health Corp. and has been offered stockoptions. Stephen D. Phinney is a founder of
Virta Health Corp. Jeff S. Volek is also a founderof Virta Health Corp. Paul Williams is a paidconsultant of Virta Health Corp. Anne L. Petershas been an advisory board member or hasconsulted for Abbott Diabetes Care, Bec-ton–Dickinson, Bigfoot, Boehringer Ingelheim,Dexcom, Eli Lilly and Company, Janssen, Lexi-con, Medscape, Merck, Novo Nordisk, sanofi,and Science 37, and has been on the Speaker’sBureau for NovoNordisk in the last year. WayneW. Campbell and Tamara Hazbun have nothingto disclose.
Compliance with Ethics Guidelines. Allprocedures performed in studies involvinghuman participants were in accordance withthe ethical standards of the institutional and/ornational research committee and with the 1964Helsinki declaration and its later amendmentsor comparable ethical standards. Informedconsent was obtained from all individual par-ticipants included in the study.
Data Availability. The data sets analyzedduring the current study are available from thecorresponding author on reasonable request.
Open Access. This article is distributedunder the terms of the Creative CommonsAttribution-NonCommercial 4.0 InternationalLicense (http://creativecommons.org/licenses/by-nc/4.0/), which permits any non-commercial use, distribution, and reproductionin any medium, provided you give appropriatecredit to the original author(s) and the source,provide a link to the Creative Commons license,and indicate if changes were made.
REFERENCES
1. NCD Risk Factor Collaboration (NCD-RisC).Worldwide trends in diabetes since 1980: a pooledanalysis of 751 population-based studies with 4.4million participants. Lancet. 2016;387(10027):1513–30.
2. Stokes A, Preston SH. Deaths attributable to dia-betes in the united states: comparison of datasources and estimation approaches. PLoS One.2017;12(1):e0170219.
610 Diabetes Ther (2018) 9:583–612
3. Gregg EW, Chen H, Wagenknecht LE, et al. Asso-ciation of an intensive lifestyle intervention withremission of type 2 diabetes. JAMA.2012;308(23):2489–96.
4. Marso SP, Daniels GH, Brown-Frandsen K, et al.Liraglutide and cardiovascular outcomes in type 2diabetes. N Engl J Med. 2016;375(4):311–22.
5. Zinman B, Wanner C, Lachin JM, et al. Empagli-flozin, cardiovascular outcomes, and mortality intype 2 diabetes. N Engl J Med.2015;373(22):2117–28.
6. Schauer PR, Bhatt DL, Kirwan JP, et al. Bariatricsurgery versus intensive medical therapy for dia-betes—3-year outcomes. N Engl J Med.2014;370(21):2002–13.
7. American Diabetes Association. Standards of medi-cal care in diabetes—2018. Diabetes Care.2018;41(Supplement 1):S1–172.
8. Handelsman Y, Henry RR, Bloomgarden ZT, et al.American Association of Clinical Endocrinologistsand American College of Endocrinology positionstatement on the association of SGLT-2 inhibitorsand diabetic ketoacidosis. Endocr Pract.2016;22(6):753–62.
9. Mottalib A, Sakr M, Shehabeldin M, Hamdy O.Diabetes remission after nonsurgical intensive life-style intervention in obese patients with type 2diabetes. J Diabetes Res. 2015;2015(2):1–4.
10. Tobias DK, Chen M, Manson JE, Ludwig DS, WillettW, Hu FB. Effect of low-fat diet interventions versusother diet interventions on long-term weightchange in adults: a systematic review and meta-analysis. Lancet Diabetes Endocrinol.2015;3(12):968–79.
11. Chaudhry ZW, Doshi RS, Mehta AK, et al. A sys-tematic review of commercial weight loss pro-grammes’ effect on glycemic outcomes amongoverweight and obese adults with and without type2 diabetes mellitus. Obes Rev. 2016;17(8):758–69.
12. Bistrian BR, Blackburn GL, Flatt JP, Sizer J, Scrim-shaw NS, Sherman M. Nitrogen metabolism andinsulin requirements in obese diabetic adults on aprotein-sparing modified fast. Diabetes.1976;25(6):494–504.
13. Boden G, Sargrad K, Homko C, Mozzoli M, Stein TP.Effect of a low-carbohydrate diet on appetite, bloodglucose levels, and insulin resistance in obesepatients with type 2 diabetes. Ann Intern Med.2005;142(6):403–11.
14. Shimazu T, Hirschey MD, Newman J, et al. Sup-pression of oxidative stress by b-hydroxybutyrate,
an endogenous histone deacetylase inhibitor. Sci-ence. 2013;339(6116):211–4.
15. Youm Y-H, Nguyen KY, Grant RW, et al. The ketonemetabolite b-hydroxybutyrate blocks NLRP3inflammasome–mediated inflammatory disease.Nat Med. 2015;21(3):263–9.
16. Yancy WS, Olsen MK, Guyton JR, Bakst RP, West-man EC. A low-carbohydrate, ketogenic diet versusa low-fat diet to treat obesity and hyperlipidemia: arandomized, controlled trial. Ann Intern Med.2004;140(10):769–77.
17. Westman EC, Yancy WS, Mavropoulos JC, Mar-quart M, McDuffie JR. The effect of a low-carbohy-drate, ketogenic diet versus a low-glycemic indexdiet on glycemic control in type 2 diabetes mellitus.Nutr Metab. 2008;5(1):36.
18. Nielsen JV, Joensson EA. Low-carbohydrate diet intype 2 diabetes: stable improvement of bodyweightand glycemic control during 44 months follow-up.Nutr Metab. 2008;5(1):14–6.
19. Saslow LR, Kim S, Daubenmier JJ, et al. A random-ized pilot trial of a moderate carbohydrate dietcompared to a very low carbohydrate diet in over-weight or obese individuals with type 2 diabetesmellitus or prediabetes. PLoS One. 2014;9(4):1–11.
20. Bazzano LA, Hu T, Reynolds K, et al. Effects of low-carbohydrate and low-fat diets. Ann Intern Med.2014;161(5):309–18.
21. Wagner EH, Austin BT, Davis C, Hindmarsh M,Schaefer J, Bonomi A. Improving chronic illnesscare: translating evidence into action. Health Aff.2001;20(6):64–78.
22. Institute of Medicine. Dietary reference intakes forenergy, carbohydrate. Fiber, fat, fatty acids,cholesterol, protein, and amino acids. Washington:The National Academies Press; 2005. p. 1–1357.
23. McKenzie A, Hallberg S, Creighton BC, et al. Anovel intervention including individualized nutri-tional recommendations reduces hemoglobin A1clevel, medication use, and weight in type 2 dia-betes. JMIR Diabetes. 2017;2(1):e5.
24. Chubb SAP, Davis WA, Inman Z, Davis TME.Prevalence and progression of subclinicalhypothyroidism in women with type 2 diabetes: theFremantle Diabetes Study. Clin Endocrinol (Oxf).2005;62(4):480–6.
25. The Look AHEAD Research Group. Reduction inweight and cardiovascular disease risk factors inindividuals with type 2 diabetes: one-year results ofthe look AHEAD trial. Diabetes Care.2007;30(6):1374–83.
Diabetes Ther (2018) 9:583–612 611
26. Tay J, Luscombe-Marsh ND, Thompson CH, et al.Comparison of low- and high-carbohydrate dietsfor type 2 diabetes management: a randomizedtrial. Am J Clin Nutr. 2015;102(4):780–90.
27. Lean ME, Leslie WS, Barnes AC, et al. Primary care-led weight management for remission of type 2diabetes (DiRECT): an open-label, cluster-ran-domised trial. Lancet. 2017. https://doi.org/10.1016/S0140-6736(17)33102-1
28. The ACCORD Study Group. Long-term effects ofintensive glucose lowering on cardiovascular out-comes. N Engl J Med. 2011;364(9):818–28.
29. Action to Control Cardiovascular Risk in DiabetesStudy Group, Gerstein HC, Miller ME, Byington RP,Goff DC, Bigger JT. Effects of intensive glucoselowering in type 2 diabetes. N Engl J Med.2008;358(24):2545–59.
30. Henry RR, Gumbiner B, Ditzler T, Wallace P, LyonR, Glauber HS. Intensive conventional insulintherapy for type II diabetes. Metabolic effects dur-ing a 6-mo outpatient trial. Diabetes Care.1993;16(1):21–31.
31. Roberts MN, Wallace MA, Tomilov AA, et al. Aketogenic diet extends longevity and healthspan inadult mice. Cell Metabolism. 2017;26(3):539–46.
32. Newman JC, Covarrubias AJ, Zhao M, et al. Keto-genic diet reduces midlife mortality and improvesmemory in aging mice. Cell Metab.2017;26(3):547–8.
33. Ferrannini E, Mark M, Mayoux E. CV protection inthe EMPA-REG outcome trial: a ‘‘thrifty substrate’’hypothesis. Diabetes Care. 2016;39(7):1108–14.
34. Neal B, Perkovic V, Mahaffey KW, et al. Canagli-flozin and cardiovascular and renal events in type 2diabetes. N Engl J Med. 2017;377(7):644–57.
35. El-Assaad W, Buteau J, Peyot M-L, et al. Saturatedfatty acids synergize with elevated glucose to causepancreatic b-cell death. Endocrinology.2003;144(9):4154–63.
36. Forsythe CE, Phinney SD, Feinman RD, et al. Lim-ited effect of dietary saturated fat on plasma satu-rated fat in the context of a low carbohydrate diet.Lipids. 2010;45(10):947–62.
37. Younossi ZM, Gramlich T, Matteoni CA, Boparai N,McCullough AJ. Nonalcoholic fatty liver disease inpatients with type 2 diabetes. Clin GastroenterolHepatol. 2004;2(3):262–5.
38. Gardner CD, Kiazand A, Alhassan S, et al. Com-parison of the Atkins, Zone, Ornish, and LEARNdiets for change in weight and related risk factorsamong overweight premenopausal women. JAMA.2007;297(9):969–77.
39. Barter PJ, Brewer HB, Chapman MJ, Hennekens CH,Rader DJ, Tall AR. Cholesteryl ester transfer protein:a novel target for raising HDL and inhibitingatherosclerosis. Arterioscler Thromb Vasc Biol.2003;23(2):160–7.
40. Dehghan M, Mente A, Zhang X, et al. Associationsof fats and carbohydrate intake with cardiovasculardisease and mortality in 18 countries from fivecontinents (PURE): a prospective cohort study.Lancet. 2017;390(10107):2050–62.
41. Mente A, Dehghan M, Rangarajan S, et al. Associa-tion of dietary nutrients with blood lipids andblood pressure in 18 countries: a cross-sectionalanalysis from the PURE study. Lancet DiabetesEndocrinol. 2017;5(10):774–87.
42. Phinney SD, Tang AB, Waggoner CR, Tezanos-PintoRG, Davis PA. The transient hypercholesterolemiaof major weight loss. Am J Clin Nutr.1991;53(6):1404–10.
43. Karter AJ, Nundy S, Parker MM, Moffet HH, HuangES. Incidence of remission in adults with type 2diabetes: the diabetes & aging study. Diabetes Care.2014;37(12):3188–95.
44. Noakes TD, Windt J. Evidence that supports theprescription of low-carbohydrate high-fat diets: anarrative review. Br J Sports Med. 2017;51(2):133–9.
45. Saslow LR, Mason AE, Kim S, et al. An onlineintervention comparing a very low-carbohydrateketogenic diet and lifestyle recommendations ver-sus a plate method diet in overweight individualswith type 2 diabetes: a randomized controlled trial.J Med Internet Res. 2017;19(2):e36.
46. O’Neil PM, Miller Kovach K, Tuerk PW, et al. Ran-domized controlled trial of a nationally availableweight control program tailored for adults withtype 2 diabetes. Obesity. 2016;24(11):2269–77.
47. Drenick EJ, Alvarez LC, Tamasi GC, Brickman AS.Resistance to symptomatic insulin reactions afterfasting. J Clin Invest. 1972;51(10):2757–62.
48. Dashti HM, Mathew TC, Khadada M, et al. Benefi-cial effects of ketogenic diet in obese diabetic sub-jects. Mol Cell Biochem. 2007;302(1–2):249–56.
612 Diabetes Ther (2018) 9:583–612