Embed Size (px)
Citation preview

Institute of Plant Biology
University of Fribourg (Switzerland)
Effect of sulfur deficiency on the resistance of oilseed rape to
fungal pathogens and expression profiling of the glutathione S-
transferase family of Arabidopsis thaliana.
Thesis
Presented at the Faculty of Sciences of the University of Fribourg (Switzerland)
to obtain the degree of Doctor rerum naturalium
by
Pierre-Henri Dubuis
from Savièse/VS (Switzerland)
Thesis No. 1442
Imprimerie
Fribourg 2004
Accepté par la Faculté des Sciences de l’Université de Fribourg (Suisse) sur la
proposition des Prof. Enrico Martinoia et Prof. Jean-Pierre Métraux.
Fribourg, le 2 avril 2004
Le Directeur de thèse : Le Doyen :
Prof. Felix Mauch Prof. Dionys Baeriswyl
Abstract……………………………………………………………………………... 2
Résumé……………………………………………………………………………… 3
Chapter 1 : General introduction………………………………………………… 4
Chapter 2 : Increased disease susceptibility of sulfur deficient oilseed rape is caused by a loss of antifungal potential…………………………………………. 14
1. Abstract………………………………………………………………………….. 15
2. Introduction……………………………………………………………………… 16
3. Materials and Methods…………………………………………………………... 18
4. Results……………………………………………………………………………. 20
5. Discussion……………………………………………………………………….. 28
6. References……………………………………………………………………….. 30
Chapter 3: Transcriptome of Arabidopsis gene families related to secondarymetabolism differentiates responses to groups of abiotic and biotic stressors. 33
1. Summary………………………………………………………………………… 35
2. Introduction……………………………………………………………………… 36
3. Results and discussion…………………………………………………………… 39
5. Experimental procedures………………………………………………………… 47
6. References………………………………………………………………………... 51
7. Tables and figures………………………………………………………………... 57
Chapter 4: Subcellular localisation and functional analysis of the phi class glutathione S-transferase AtGSTF8……………………………………………… 65
1. Abstract………………………………………………………………………….. 66
2. Introduction……………………………………………………………………… 67
3. Materials and Methods…………………………………………………………... 69
4. Results……………………………………………………………………………. 71
5. Discussion……………………………………………………………………….. 76
6. References……………………………………………………………………….. 78
Chapter 5: Concluding remarks………………………………………………….. 80
Thanks……………………………………………………………………………….. 83
1

Abstract
The reduction of S02 atmospheric pollution in the early nineties caused sulfur-deficiency problems in the
agriculture of northern Europe. Sulfur is essential for plant development and sulfur containing compounds
such as sulfur rich antifungal proteins, phytoalexins and glucosinolates play an important role in plant
defense against pathogens. Sulfur starved Brassica napus with no visible symptoms showed a strong
decrease in total sulfur and glutathione content and an increased susceptibility to the blackleg fungus
Leptosphaeria maculans, to the generalist necrotroph Botrytis cinerea and to the oomycete Phytophthorabrassicae. To test the cause of this increased susceptibility, a methanol extract containing secondary
metabolites and a water extract of soluble proteins of plants grown with and without sulfur fertilization
were used in fungal growth inhibition tests. MeOH extract of normally grown plants showed strong
antifungal activity and this activity was almost totally lost in extracts of S-starved plants. Plants
preinoculated with B. cinerea did not contain an increased antifungal potential indicating that
phytoalexins do not contribute to this activity. The loss of antifungal activity correlated with a strong
reduction of the glucosinolate content of the methanol extract suggesting that the reduced level of
glucosinolates might be the cause of the reduction of the antifungal potential. However, no causal link
could yet be demonstrated. The general loss of fitness of sulfur-starved plants could play an additional
important role in the reduction of resistance.
Plant secondary metabolism significantly contributes to defense against adverse environmental cues. To
investigate stress-induced alterations at the transcriptional level, a DNA array (MetArray) harboring gene-
specific probes was established, which combined Arabidopsis thaliana effector gene families encoding
enzymes acting consecutively in secondary metabolism and defense reactions. It contained the complete
set of genes encoding 109 secondary product glycosyltransferases and 63 glutathione-utilizing enzymes
along with 62 cytochrome P450 monooxygenases and 28 ABC transporters. Their transcriptome was
monitored in different organs of unstressed plants and in shoots in response to herbicides, UV-B radiation,
endogenous stress hormones, and pathogen infection. A principal component analysis based on the
transcription of these effector gene families defined distinct responses. Methyl jasmonate and ethylene
treatment was separated from a group combining reactions towards two sulfonylurea herbicides, salicylate
and an avirulent strain of Pseudomonas syringae. The responses to the herbicide bromoxynil and UV-B
radiation were separate from both groups. A few genes were diagnostic in their specific response to two
herbicide classes used. Interestingly, a subset of genes induced by P. syringae was not responsive to the
applied stress hormones. In addition, small groups of comprehensively induced effector genes may be part
of defense mechanisms activated by several converging pathways. The differentiating expression patterns
detected by the MetArray provide a framework of information regarding the function of individual genes
and argue against widely redundant functions within the large gene families analyzed.
Plant glutathione S-transferases are multifunctional enzymes encoded by a large gene family containing
47 members in Arabidopsis thaliana. A member of the Phi class GST, AtGSTF8 (At2g47730), is
upregulated by various treatments including oxidative stress and exhibits GSH-peroxidase activity. The
chloroplastic localisation of GSTF8 was demonstrated by expressing a fusion protein consisting of the
predicted GSTF8 signal pepetide and GFP in transgenic Arabidopsis. Analysis of the GST family
indicated that GSTF8 is the only chlorplastic GST in Arabidopsis, making it a promissing candidate for
functional analysis. To this end, GSTF8 over-expressing transgenic lines were produced and a T-DNA
insertion knock out mutant was isolated from the SALK-collection. However, no change in phenotype
could be seen under normal growth condition and under conditions of oxidative stresses conditions like
treatments with hydrogen peroxide and the herbicide paraquat. This indicates that GSTF8 is either not
involved in protection from oxidative stress in chloroplasts or, alternatively, that in addition to GSTF8
other mechanisms contribute to this protection.
2
Resumé La réduction de la pollution atmosphérique due au dioxyde de soufre a provoqué au début des années nonante
des problèmes de carence de soufre dans les champs principalement au nord de l’europe. Le soufre est un
macroélément essentiel pour le développement de la plante. Des composés soufrés tels que des protéines riches
en soufre, des phytoalexines et des glucosinolates, jouent un rôle important dans les mécanismes de défense.
Des plants de colza carencés en soufre, mais ne montrant aucun symptôme visible, présentaient une forte
réduction de leur teneur en soufre total et en glutathion. Ces plantes montraient aussi une augmentation de leur
susceptibilité au pathogène de la nécrose du collet, Leptosphaeria maculans, au nécrotrophe généraliste
Botrytis cinerea ainsi qu’à l’oomycète Phytophthora brassicae. Dans le but d’analyser les causes de cette
augmentation de susceptibilité nous avons testé le potentiel antifongique d’un extrait protéique et d’un extrait
au méthanol contenant des métabolites secondaires. Ces extraits ont été obtenus à partir de colza cultivé avec et
sans soufre, et préalablement induit ou non au moyen d’une inoculation avec Botrytis cinerea. L’extrait
méthanolique obtenu à partir de plantes normales avait une activité antifongique qui était presque entièrement
perdue dans le même extrait obtenu à partir de colza carencé en soufre. Cette perte d’activité antifongique
corrélait avec une forte réduction du contenu en glucosinolates de l’extrait. Ceci suggère que la réduction du
contenu en glucosinolates pourrait être la cause de la réduction du potentiel antifongique. Toutefois aucun lien
de causalité n’a encore pu être démontré. L’affaiblissement général des plantes carencées pourrait aussi jouer
un rôle additionnel dans la diminution de leur résistance aux pathogènes fongiques.
Le métabolisme secondaire des végétaux contribue significativement à la défense de la plante contre divers
stress environnementaux. Pour étudier les changements transcriptionels des gènes d’Arabidopsis thalianaimpliqués dans les mécanismes de détoxification nous avons développé un « DNA array » (MetArray)
contenant des sondes spécifiques pour chaque membre des familles de gènes impliquées dans les étapes
successives de détoxification. Le MetArray contient des sondes pour la totalité des gènes codant pour des
glycosyltransférases, pour 63 enzymes utilisant du glutathion ainsi que 62 cytochrome P450 monooxygénases
et 28 ABC transporteurs. Leur expression a été analysée dans les différents organes de la plante ainsi que dans
les feuilles suite à divers traitements tel que herbicides, irradiation avec des UV-B, hormones endogènes liées à
la réponse au stress et infection avec un pathogène. Une analyse en composante principale basée sur le
transcriptome de ces familles de gènes détermine des réponses distinctes. Les traitements avec le méthyl-
jasmonate et l’éthylène forment un groupe. Le traitement avec l’acide salicylique deux herbicides sulfonylurée
et l’inoculation avec une souche avirulente de Pseudomonas syringae en forment un autre. Enfin la réponse au
bromoxynil un herbicide, et le traitement avec des UV-B forment un troisième groupe clairement séparé. Il faut
relever un groupe de gènes qui était induit par le pathogène P. syringae mais qui ne montrait aucune réponse
aux trois hormones liées aux voies de signalisation. De plus un petit groupe de gènes qui pourrait jouer un rôle
dans les mécanismes de défense était régulé par diverses voies de signalisation convergentes. La régulation
différenciée des divers gènes contredit l’hypothèse d’une grande redondance fonctionnelle dans ce quatre
grandes familles de gènes.
Les glutathion S-transférases (GST) sont des enzymes multifonctionnels qui sont codés par une famille de
gènes. Le génome d’Arabidopsis thaliana contient 47 glutathion S-transférases. Une GST de la classe phi,
GSTF8 (At2g47730) est induite par divers traitements dont le stress oxydatif et possède une forte activité GSH-
peroxydase. Nous avons montré que GSTF8 était localisée dans le chloroplaste en fusionnant le peptide signal
de GSTF8 avec une protéine fluorescente (GFP). Comme GSTF8 est la seule GST présente dans le chloroplaste
et qu’elle possède une activité GSH-peroxidase, elle constitue un candidat idéal pour une analyse fonctionnelle.
Pour ce faire, une lignée transgénique surexprimant GSTF8 a été produite et un mutant insertionel (T-DNA) a
été isolé. Toutefois aucun changement phénotypique n’a été observé aussi bien en croissance normale qu’après
traitements avec du peroxyde d’hydrogène et du paraquat, induisant tout deux un stress oxydatif. Ceci indique
que GSTF8 n’est soit pas impliqué dans la protection contre le stress oxydatif, soit qu’en plus de GSTF8
d’autres mécanismes contribuent à cette protection.
3

Chapter 1
General Introduction
4
General Introduction
1.1 The importance of sulfur for plant nutrition
Sulfur is one of the six macronutrients needed for proper plant development. Even if sulfur is only 3%
to 5% as abundant as nitrogen in plants, it plays essential roles in various important mechanisms such
as Fe/S clusters in enzymes, vitamin cofactors, glutathione in redox homeostasis and detoxification of
xenobiotics (Leustek et al., 2000; Saito, 2000). Reduced sulfur incorporated in cysteine and
methionine amino acids plays essential roles in catalytic centers and disulfide bridges of proteins
(Hell, 1997). Sulfur is taken up from the soil by plants in form of sulfate by specific transporters. This
sulfate is then reduced to be incorporated in cysteine and subsequently in methionine. Organic bound
sulfur is mainly reduced to sulfide, but oxidised sulfur is also found in plants, a good example being
the sulfolipids of the chloroplast membranes (Hell, 1997). Plant posses different specific
sulfotransferases that catalyse the esterification of sulfate with secondary compounds and proteins.
Sulfur is a mobile nutrient that can move rapidly downward through the soil, especially through sandy
surface layers. This easy leaching ability of sulfate leads to problems because an important part of the
sulfur present in fertilizers may end up in ground water where it causes environmental problems such
as eutrophication of aquatic ecosystems or a reduction in the quality of drinking water. In humid
regions most of the sulfur in the surface soil is associated with organic matter. Sulfur deficiencies are
less frequent in high organic matter soils, because the sulfur constantly mineralizes from the organic
matter. However, under intensive crop production, the breakdown of organic matter and subsequent
release of sulfate by microorganisms may not be rapid enough to meet the increased demands driven
by high yields. Furthermore, the mineralization efficiency is dependent on environmental factors such
as soil type, microorganisms present, temperature and humidity.
1.2. Reduction of sulfur dioxide pollution and occurence of sulfur deficiency in crops
The breeding of higher yield crop plants lead to increased need for sulfur in farming. This went
unnoticed for a long time because during the same period sulfur deposition caused by atmospheric
pollution by the burning of S-containing fossil fuels increased steadily (Hell and Hillebrand, 2001). In
the second part of the 20th century atmospheric pollution with sulfur dioxide became a problem for
industrialised countries. The major anthropogenic sources of the emission of sulfur dioxide were
thermal power plants producing electricity from high sulfur containing coal or heating oils, industrial
boilers and non ferrous metal smelters. Natural source of sulfur dioxide such as volcanoes or marine
algae can account for 25% to 65% of the total emission (www.ourplanet.com). Domestic coal burning
and vehicles can also contribute to high local ambient concentrations of sulfur dioxide. Atmospheric
pollution with sulfur dioxide has two main consequences: acid rain and health problems. Acid rains
has negative effects on aquatic ecosystems and lead to the so called “forest die back” in the eighties.
During the London fog of 1952, the so called “peasouper” smog, levels of SO2 reached 3500μ/m3
(average over 48 hours) in the city centre, and remained high for a period of 5 days leading to the
death of 4’000 people. Furthermore, in 2000 in large Chinese cities smog caused the premature death
of about of 50’000 people. A recent study in Hong Kong demonstrated that pollution resulting from
sulfur-rich fuels has an effect on death rates, especially respiratory and cardiovascular deaths (Hedley
et al., 2002). In response to these pollution problems in the mid-eighties, international treaties legally
enforced the drastic reduction of SO2 emissions (Helsinki protocol 1979). Heavy investments by
5
power station operators in desulfurization equipment and use of S-poor fuels have cut sulfur pollution
in Europe and North America by as much as 80 percent. As an unforeseen consequence of the
reduction of sulfur dioxide pollution in recent years, an increased frequency of sulfur deficiency has
been observed in several crops mainly in northern Europe. It was realised that sulfur may become a
factor limiting yield and crop quality in agriculture (Dämmgen et al., 1998; Eriksen and Mortensen,
1999). A solution to the S-deficiency in agricultural crop production is the application of fertilizer
containing sulfur. As sulfate is easily leached out by rain the tendency could be to over fertilize with
sulfur which in turn would lead to ground water pollution.
Sulfur is used in agriculture since the antiquity for its protective effect against pests and diseases.
Foliar application of sulfur was observed to boost the growth of crops (Pezet et al., 1986; Schnug,
1996). Positive correlation between S-fertilisation and enhanced disease resistance against fungal
pathogens was observed in the field (Davidson and Goss, 1972; Schnug, 1996). However, for a long
time sulfur was not regarded as a limiting factor for crop production.
1.3 Oilseed rape as model plant
The Brassicaceae family consists of hundreds of species containing important cultivated crops and
wild species. The genome of Brassica napus contains n=19 chromosomes which is a combination of
the parental genomes of Brassica rapa (n=10) and Brassica oleracea (n=9). B. napus is mainly
known as oilseed rape (B. napus subspecies oleifera) but also as the horticultural crop rutabaga or
swede (B. napus subspecies rapifera) (Cheung et al., 1997). Breeding for B. napus varieties
containing no erucic acid (0 varieties) and low glucosinolate content in seed (00 = double low
varieties) was performed in the seventies to avoid the antinutritional and goitrogenic effect of seed
meal on mammals. Erucic acid was believed to cause cardio-vascular diseases. Hydrolysis of
progoitrin and epi-progoitrin gives rise to dagradation products, oxazolidine-2-thiones which have a
wide range of adverse effects such as goitrogenic effects and liver toxicity making its use in pork and
poultry feeding unsuitable (Fenwick et al., 1983; Fahey et al., 2001). On the other hand in the last 20
years new evidence of the putative protective role of glucosinolate against cancer has accumulated
(Fahey et al., 2001). Glucosinolates, are thioglucosides reported to be part of the plant defense
mechanism against fungi and insects (Osbourn, 1996; Blake-Kalff et al., 1998). Isothiocyanates
derived from the degradation of many glucosinolates discourage feeding by generalist insects, attract
specislist insects and are toxic to bacterial and fungal pathogens (Mithen et al., 1986; Giamoustaris
and Mithen, 1997; Manici et al., 1997)
The production of oilseed rape has increased significantly in the last twenty years (Howlett et al.,
2001). In Switzerland the production of oilseed rape has increased in the nineties and stabilised in
recent years to about 50’000t/year (www.agirinfo.com). Oilseed rape is an ideal model to study sulfur
deficiency in plants because of its high demand for sulfur (making it particularly sensitive to S-
deficiency) and its genetic proximity to Arabidopsis thaliana (Zhao et al., 1997; Blake-Kalff et al.,
1998; Schmidt et al., 2001).
1.4 Description of the pathogens used in the study
Of the phytopathogenic fungi known to affect rapeseed, the loculoascomycete fungi Leptosphaeriamaculans (Desm.) Ces. & de Not (anamorph: Phoma lingam) (Tode ex Fr.) (Desm.) causes the
highest economic losses of this crop worldwide (Howlett et al., 2001). Since chemical protection is
6

difficult and costly, genetic resistance has become an important measure of disease control. Disease
caused by L. maculans is initiated when sexual ascospores or asexual pycnidiospores land on a
susceptible oilseed rape plant (Howlett et al., 2001). The disease is usually monocyclic and epidemics
are generally initiated by airborne ascospores. Infection can also arise from infected seed, stubble and
rain splashed conidia (West et al., 2001). When the ascospore or pycnidiospore germinates, hyphae
infect the plant through stomate openings or through wounds. After colonizing intercellular spaces in
the spongy mesophyll of the leaf lamina, the fungus reaches the vascular bundle and spreads down
the petiole eventually invading the stem cortex and causing the stem canker symptom. The initial
infection and the intercellular systemic phase of growth occurs in a biotrophic mode but behind the
expanding hyphal front the interaction becomes necrotrophic (Hammond et al., 1985; Hammond and
Lewis, 1986, 1987). The lifecycle is completed when new ascospores are generated in the
necrotrophic regions caused by the fungus (Bohman, 2001). Only partial resistance exist in the
important oilseed crops, B. napus, B. rapa, and in the different cabbage crops (B. oleracea) (reviewed
in (Howlett et al., 2001) and (West et al., 2001)). Little is presently known about underlying
molecular mechanisms that make plants resistant to L. maculans. Some studies have been performed
of the response of B. napus to L. maculans inoculations and Hammond and Lewis (1986) reported the
deposit of lignin-like structures and calcium accumulation. Additionally, (Roussel et al., 1999)
showed that avirulent isolates induce HR and that the lumen of vessels in the HR area was occluded
by fibrillar-like material. Further experiments have shown that pathogenesis related proteins
accumulate differently in resistant and susceptible plants (Dixelius, 1994).
Botrytis cinerea Pers.: Fr.: (teleomorph Botryotinia fuckeliana (de Bary) Whetz. is an ascomycete,
classified among the inoperculated Discomycetes, order of Leotiales and the Sclerotiniaceae family.
B. cinerea, commonly named grey mould, is a characteristic necrotrophic pathogen that has a very
broad host range with more than 250 potential host plants (MacFarlane, 1968) including economically
important crops such as cereal crops, fruits, vegetables, and flowering plants. Phytophthora brassicae
(previousely P. porri) is an oomycete infecting a wide range of Brassicacea plants including Brassicanapus and Arabidopsis thaliana (Roetschi et al., 2001). Phytophthora species cause agronomically
important diseases including the well known potato late blight and soybean root rot (Kamoun, 2003).
1.5 The “green liver” concept
The ability of plants to detoxify naturally occurring toxic substances and low molecular xenobiotics
was modelled in the concept referred to as the “green liver” (Sandermann, 1992, 1994; Coleman et
al., 1997). It comprises four sequential steps. In phase I the hazardous molecule is activated by either
hydrolases or oxidases such as P-450 cytochrome oxidase. This activation results in the introduction
of functional carboxyl- or hydroxyl-groups or in the exposition of such groups. Activated molecules
are better available for further steps in the detoxification process. In phase II the activated molecules
are conjugated to a highly polar molecule like glucose, malonate, sulfate or glutathione. This
conjugation is catalyzed by enzyme families such as glucosyltransferases or glutathione S-
transferases. Tagging harmful molecules with glucose or glutathione changes their physico-chemical
properties and often strongly reduces their toxicity. In phase III the conjugated molecule is exported
by specific transporters in an energy dependant manner from the cytosol to the vacuole or the
apoplast. Examples of these transporters are multi-drug-resistance-associated-proteins (MRPs) that
are member of the superfamily of the ATB-binding-cassette (ABC) transporters (Kolukisaoglu et al.,
2002). Phase IV includes all the possible further processing, degradation and recycling reactions. For
some compounds the detoxification process ends with the compartementation (step III) but for other
molecules further metabolic steps take place in the vacuole.
7

1.6 The role of glutathione for plants in stress conditions
Glutathione is a tripeptide �-glutamyl-cysteinyl-glycine (GSH) containing a sulfhydryl group which is
highly reactive (Rennenberg, 1982). GSH is synthesized from glutamate, cysteine and glycine in two
sequential ATP-dependent reactions catalyzed by �-glutamylcysteine sythase and glutathione
synthase. These enzymes are present both in the cytosol and in the chloroplast. GSH represent the
major non-protein thiol in plant cells and is a storage form of reduced sulfur (Hell, 1997). GSH
concentration is estimated to be between 300 and 1300 nmol/g FW in most tissues (Schnug et al.,
1995). Beside its role as a central compound in the sulfur metabolism, GSH plays various important
roles in the plant such as direct antioxidant, regeneration of ascorbate, redox buffering and as a
precursor of phytochelatins (Noctor and Foyer, 1998). Phytochelatins are small peptides formed by �-
glutamyl-cysteinyl repeats used by the plant to chelate and detoxify heavy metals (Cobbett and
Goldsbrough, 2002). The high reactivity and water solubility of GSH makes it an ideal molecule to
protect the plant against various stresses including oxidative stress, xenobiotic molecules and heavy
metals (Xiang et al., 2001). Furthermore, GSH is used by glutathione S-transferases to tag
electrophilic molecules including many xenobiotics (see 1.4 and 1.6).
1.7 Glutathione S-transferases are multifunctional enzymes
Glutathione S-transferases (GSTs; EC 2.5.1.18) form a large and diverse family of multifunctional,
dimeric enzymes that catalyze the conjugation of GSH to a large variety of lipophilic compounds
with electrophilic centers. GSTs are present in bacteria, fungi, animals and plants. They were first
discovered in animals due to their important role in drug metabolism and detoxification (Wilce and
Parker, 1994). Their presence in plants was first recorded in maize where a GST was shown to be
responsible for the detoxification of the herbicide triazine (Timmerman, 1989; Dixon et al., 2002).
GSTs are abundant proteins and constitute more than one percent of the soluble proteins fraction in
maize leaves (Marrs, 1996). GST protein have a molecular weight of an approximatively 25 kDa.
Homo and heterodimers can form thus increasing the diversity of GST dimers to be found in planta.
GSTs are typically encoded by large gene families (Marrs, 1996; McGonigle et al., 2000; Wagner et
al., 2002). GSTs have been extensively studied in animals, and mammalian GSTs are classified in
different families such as Alpha, Mu and Pi classes involved in drug detoxification (Wilce and
Parker, 1994). Sigma class GSTs are implicated in prostaglandin synthesis (Rowsey et al., 2001).
Theta and Zeta class have members both in plants and animals. A prokaryote-specific beta class was
discovered in bacteria and a delta class is specific to insects (Rossjohn et al., 1998; Chelvanayagam et
al., 2001). The most numerous plant GST classes Phi and Tau are plant specific and their sequences
are significantly different from the animal GSTs. We can now take advantage of the full genome
sequence of Arabidopsis thaliana to understand the organisation of the GSTs in higher plants. The
Arabidopsis genome contains 47 GSTs genes divided in four classes Phi (F), Tau (U), Theta (T) and
Zeta (Z) sharing only limited sequence similarity (Edwards et al., 2000; Wagner et al., 2002). GST are
often present in the form of gene clusters or tandem repeats. This situation seems to result from gene
duplication events during the evolution. Indeed, only a quarter of these genes are found to be single
genes (Wagner, 2001). Expression and regulation studies of GSTs in plant have shown that their
regulation is highly variable. Furtermore GST function does not correspond to the classification based
on sequence similarity (McGonigle et al., 2000; Wagner et al., 2002).
Plant GSTs were intensively studied with regard to their role in herbicide detoxification. The function
of GSTs is generally believed to be the detoxification of both xenobiotics and endogenous toxic
8
compounds (Marrs, 1996). Surprisingly only few potential endogenous substrates have been found
raising the questions of what is the real in vivo role of GSTs and what are their natural substrates.
From an evolutionary point of view it is difficult to understand how enzymes could develop which are
highly specific for xenobiotics of human origin that are present in the environment for only very
limited time (Sandermann, 1994). One explanation is that GSTs have evolved to remove hazardous
substances of natural origin, such as toxins from pathogens or allelopathic substances from
competitor plants. From this point of view the xenobiotics from human origin might only be similar
to those compounds and be detoxified by GSTs as a side activity. However, in recent years some
experimental data described natural substrates of GSTs. The first report was that the aquatic plant
Ceratophyllum demersum was able conjugate enzymatically glutathione to the toxin microcystin-LR,
an inhibitor of protein phosphatases produced by Cyanobacteria (Pflugmacher et al., 1998). Further
putative natural substrates for GSTs are the phytoalexins medicarpin (Li et al., 1997) and some
isothiocyanates (Kolm et al., 1995). Some GSTs were also shown to catalyse the glutathione
dependant isomerisation in the catabolism of tyrosine (Dixon et al., 2000). An interesting link
between hormon metabolism and GSTs has been revealed by the observation that some auxin- and
cytokinin-binding proteins are GSTs (Zettl et al., 1994; Bilang and Sturm, 1995; Gonneau et al.,
1998). Furthermore, GSTs can act as glutathione peroxidase (Cummins et al., 1999; Wagner et al.,
2002). Our knowledge of natural substrates of GSTs is still very limited but non transferase activities
such as isomerase, peroxidase or binding of hormones can give insight in new roles for GST.
1.8 Aim of the thesis
This thesis work was divided into three main topics. The first part was the investigation of the effect
of sulfur-deficiency on plant resistance to fungal pathogens. Sulfur deficiency in the field leads to
yield reduction and increased disease impact. We build a controlled test system for Brassica napus to
demonstrate that sulfur starvation decreased the resistance of oilseed rape to three different fungal
pathogens. Arabidopsis thaliana and Brassica napus are both members of the Brassicaceae family
and exhibit extensive homology to each other at the DNA sequence level (Bancroft, 2001; Schmidt et
al., 2001). One goal of our study was to grow Arabidopsis thaliana under S-starvation condition to
take advantage of the tools available for this model plant and transfer the knowledge later to B. napus.
However, we were not able to obtain nicely growing S-starved A. thaliana plants at rosette stage.
When S-starved, A. thaliana plants always showed symptoms of senescence. Therefore the initial
plan to use A. thaliana as a model plant was abandoned. In order to investigate the possible causes of
the enhanced disease susceptibility of B. napus and to determine which compound could be
responsible for it, we have investigated the antifungal potential of two plant extracts, a methanol
extrac containing secondary metabolites and a protein containing extract.
The second part was the study of the expression profiling of the whole set of Arabidopsis thalianaglutathione S-transferases. Glutathione S-transferases are members of multigene families. To study
the expression of the 47 GSTs of Arabidopsis thaliana we have developed a nylon membrane based
macroarray with gene specific probes for each GST. This work was done in collaboration with three
other groups and the so-called MetArray focused on the analysis of the transcriptome of three
additional gene families all involved in secondary metabolism and detoxification: cytochrome P450
monooxygenase, glycosiltransferases and ABC transporters. One goal was to learn more about the
organ specific expression of the four gene families. In a second step we were interested to monitor
their expression in leaves under different abiotic and biotic stress conditions and treatment with stress
hormones.
9

The third part describes the functional analysis of GSTF8. We first wanted to confirm that GSTF8
was as predicted from its sequence localized in the chloroplast and that it was the only chloroplastic
GST in Arabidospsis thaliana. Information on the peroxidase activity of GSTF8 and its upregulation
after oxidative stress lead to the hypothesis that GSTF8 could act as GSH-peroxidase in the
chloroplast. Because of the functional redundancy in large gene families functional analysis of the
GSTs is difficult (Wagner, 2001). Nevertheless because of its unique chloroplastic localisation,
GSTF8 appeard to be a good candidate for functional analysis.
10

References
Bancroft I (2001) Duplicate and diverge: the evolution of plant genome microstructure. Trends in
Genetics 17: 89-93
Bilang J, Sturm A (1995) Cloning and characterisation of a glutathione S-transferase that can be
photolabeled with 5-azido-indole-acetic acid. Plant Physiology 109: 253-260
Blake-Kalff MMA, Harrison KR, Hawkesford MJ, Zhao FJ, McGrath SP (1998) Distribution of
sulfur within oilseed rape leaves in response to sulfur deficiency during vegetative growth. Plant
Physiology 118: 1337-1344
Bohman S (2001) Molecular studies of Arabidopsis and Brassica with focus on resistance to
Leptosphaeria maculans. Swedish University of Agricultural Sciences, Uppsala
Chelvanayagam G, Parker MW, Board PG (2001) Fly fishing for GSTs: a unified nomenclature for
mammalian and insect glutathione transferases. Chemico-Biological Interactions 133: 256-260
Cheung WY, Champagne G, Hubert N, Landry BS (1997) Comparison of the genetic maps of Brassicanapus and Brassica oleracea. Theoretical and Applied Genetics 94: 569-582
Cobbett C, Goldsbrough P (2002) Phytochelatins and metallothioneins: Roles in heavy metal
detoxification and homeostasis. Annual Review of Plant Biology 53: 159-182
Coleman JOD, Blake-Kalff MMA, Davies TGE (1997) Detoxification of xenobiotics by plants:
chemical modification and vacuolar compartimentation. Trends in Plant Science 2: 144-151
Cummins I, Cole DJ, Edwards R (1999) A role for glutathione transferases functioning as glutathione
peroxidases in resistance to multiple herbicides in black-grass. Plant Journal 18: 285-292
Dämmgen U, Walker K, Grünhage L, Jäger H-L (1998) The atmospheric sulfur cycle. In E Schnug, ed,
Sulfur in agroecosystems. Kluwer Academic Publishers, Dordrecht, pp 75-114
Davidson RM, Goss RL (1972) Effects of P, S, N, lime, chlordane, and fungicides on ophiobolus patch
disease of turf. Plant Disease Reporter 56: 565-&
Dixelius C (1994) Presence of the pathogenesis-related protein-2, protein-Q and protein-S in stressed
Brassica napus and Brassica nigra plantlets. Physiological and Molecular Plant Pathology 44: 1-8
Dixon DP, Cole DJ, Edwards R (2000) Characterisation of a zeta class glutathione transferase from
Arabidopsis thaliana with a putative role in tyrosine catabolism. Archives of Biochemistry and
Biophysics 384: 407-412
Dixon DP, Lapthorn A, Edwards R (2002) Plant glutathione transferases. Genome Biology 3
Edwards R, Dixon DP, Walbot V (2000) Plant glutathione S-transferases: enzymes with multiple
functions in sickness and in health. Trends in Plant Science 5: 193-198
Eriksen J, Mortensen JV (1999) Soil sulphur status following long-term annual application of animal
manure and mineral fertilizers. Biology and Fertility of Soils 28: 416-421
Fahey JW, A.T. Z, Talalay P (2001) The chemical diversity and distribution of glucosinolates and
isothiocyanates among plants. Phytochemistry 56: 5-51
Fenwick GR, Heaney RK, Mullin WJ (1983) Glucosinolates and their breakdown products in food and
food plants. Crc Critical Reviews in Food Science and Nutrition 18: 123-201
Giamoustaris A, Mithen R (1997) Glucosinolates and disease resistance in oilseed rape (Brassica napus
ssp oleifera). Plant Pathology 46: 271-275
Gonneau J, Mornet R, Laloue M (1998) A Nicotiana plumbaginifolia protein labeled with an azido
cytokinin agonist is a glutathione S-transferase. Physiologia Plantarum 103: 114-124
Hammond KE, Lewis BG (1986) The timing and sequence of events leading to stem canker disease in
populations of Brassica napus var oleifera in the field. Plant Pathology 35: 551-564
Hammond KE, Lewis BG (1987) The establishment of systemic infection in leaves of oilseed rape by
Leptosphaeria maculans. Plant Pathology 36: 135-147
Hammond KE, Lewis BG, Musa TM (1985) A systemic pathway in the infection of oilseed rape plants
by Leptosphaeria maculans. Plant Pathology 34: 557-565
11

Hedley AJ, Wong CM, Thach TQ, Ma S, Lam TH, Anderson HR (2002) Cardiorespiratory and all-
cause mortality after restrictions on sulphur content of fuel in Hong Kong: an intervention study.
Lancet 360: 1646-1652
Hell R (1997) Molecular physiology of plant sulfur metabolism. Planta 202: 138-148
Hell R, Hillebrand H (2001) Plant concepts for mineral acquisition and allocation. Current Opinion in
Biotechnology 12: 161-168
Howlett BJ, Idnurm A, Pedras MSC (2001) Leptosphaeria maculans, the causal agent of blackleg
disease of Brassicas. Fungal Genetics and Biology 33: 1-14
Kamoun S (2003) Molecular genetics of pathogenic oomycetes. Eukaryotic Cell 2: 191-199
Kolm RH, Danielson H, Zhang Y, Talalay P, Mannervick B (1995) Isothiocyanates as substrates for
human glutathione transferases: structure-activity studies. Biochemical Journal 311: 453-459
Kolukisaoglu HU, Bovet L, Klein M, Eggmann T, Geisler M, Wanke D, Martinoia E, Schulz B
(2002) Family business: the multidrug-resistance related protein (MRP) ABC transporter genes in
Arabidopsis thaliana. Planta 216: 107-119
Leustek T, Martin MN, Bick JA, Davies JP (2000) Pathways and regulation of sulfur metabolism
revealed through molecular and genetic studies. Annual Review of Plant Physiology and Plant
Molecular Biology 51: 141-165
Li ZS, Alfenito M, Rea PA, Walbot V, Dixon RA (1997) Vacuolar uptake of the phytoalexin medicarpin
by the glutathione conjugate pump. Phytochemistry 45: 689-693
MacFarlane HH (1968) Plant host-pathogen index to volumes 1-40 (1922-1961). In CM Institute, ed,
Review of Applied Mycology, Kew, p Viii + 820pp.
Manici LM, Lazzeri L, Palmieri S (1997) In vitro fungitoxic activity of some glucosinolates and their
enzyme-derived products toward plant pathogenic fungi. Journal of Agricultural and Food
Chemistry 45: 2768-2773
Marrs KA (1996) The functions and regulation of glutathione S-transferases in plants. Annu. Rev. Plant
Physiol. Plant Mol. Biol. 47: 127-158
McGonigle B, Keezler SJ, Lau SMC, Koeppe MK, O'Keffe DP (2000) A genomic approach to the
comprehensive analysis of the glutathione S-transferase gene family in soybean and maize. Plant
Physiology 124: 1105-1120
Mithen RF, Lewis BG, Fenwick GR (1986) Invitro activity of glucosinolates and their products against
Leptosphaeria maculans. Transactions of the British Mycological Society 87: 433-440
Noctor G, Foyer CH (1998) Ascorbate and glutathione: Keeping active oxygen under control. Annual
Review of Plant Physiology and Plant Molecular Biology 49: 249-279
Osbourn AE (1996) Preformed antimicrobial compounds and plant defense against fungal attack. Plant
Cell 8: 1821-1831
Pezet R, Zuccaroni P, Beffa T (1986) Soufre élémentaire:mode d'action fongicide et rôle chez les
plantes. La Défense des Végétaux 239: 3-16
Pflugmacher S, Wiegand C, A. O, Beattie KA, Krause E, Codd GGA, Steinberg CEW (1998)
Identification of an enzymatically formed glutathione conjugate of the cyanobacterial hepatotoxin
microcystin-LR: the first step of the detoxification. Biochim. Biophys. Acta 1425: 527-533
Rennenberg H (1982) Glutathione metabolism and possible biological roles in higher plants.
Phytochemistry 21: 2771-2781
Roetschi A, Si-Ammour A, Belbahri L, Mauch F, Mauch-Mani B (2001) Characterization of an
Arabidopsis-Phytophthora pathosystem: resistance requires a functional PAD2 gene and is
independent of salicylic acid, ethylene and jasmonic acid signalling. Plant Journal 28: 293-305
Rossjohn J, Polekhina G, Feil SC, Allocati N, Masulli M, DiLlio C, Parker MW (1998) A mixed
disulfide bond in bacteria glutathione transferase: functional and evolutionary implications.
Structure 6: 721-734
Roussel S, Nicole M, Lopez F, Renard M, Chevre AM, Brun H (1999) Cytological investigation of
resistance to Leptosphaeria maculans conferred to Brassica napus by introgressions originating
from B. juncea or B. nigra B genome. Phytopathology 89: 1200-1213
12

Rowsey IR, Thomson AM, Flanagan JU, Murdock PR, Moore GBT, Meyer DJ, Murphy GJ, SmithSA, Hayes JD (2001) Mammalian class sigma glutathione S-transferases: catalytic properties and
tissue-specific expression of human and rat GSH-dependent prostaglandin D2 synthases.
Biochemical Journal 359: 507-516
Saito K (2000) Regulation of sulfate transport and synthesis of sulfur- containing amino acids. Current
Opinion in Plant Biology 3: 188-195
Sandermann H (1992) Plant metabolism of xenobiotics. Trends in Biochemical Sciences 17: 82-84
Sandermann H (1994) Higher plant metabolism of xenobiotics: the "green liver" concept.
Pharmacogenetics 4: 225-241
Schmidt R, Acarkan A, Boivin K (2001) Comparative structural genomics in the Brassicaceae family.
Plant Physiology and Biochemistry 39: 253-262
Schnug E (1996) Significance of sulphur for the nutritional and technological quality of domesticated
plants. In WJ Cram, De Kok, L. J., Stulen, I., Brunold, C. and Rennenberg, H., ed, Sulfur
metabolismus in higher plants - molecular, ecophysiological and nutritional aspects. Backhuys
Publishers, Leiden, The Netherlands
Schnug E, Haneklaus S, Borchers A, Polle A (1995) Relations between sulfur supply and glutathione
and ascorbate concentrations in Brassica napus. Zeitschrift Fur Pflanzenernahrung Und
Bodenkunde 158: 67-69
Timmerman KP (1989) Molecular characterization of corn glutathione S-transferase isozymes involved
in herbicide detoxication. Physiologia Plantarum 77: 465-471
Wagner U (2001) The glutathione S-transferase gene family in Arabidopsis thaliana L. PhD Thesis.
University of Fribourg, Fribourg
Wagner U, Edwards R, Dixon DP, Mauch F (2002) Probing the diversity of the arabidopsis glutathione
S- transferase gene family. Plant Molecular Biology 49: 515-532
West JS, Kharbanda PD, Barbetti MJ, Fitt BDL (2001) Epidemiology and management of
Leptosphaeria maculans (phoma stem canker) on oilseed rape in Australia, Canada and Europe.
Plant Pathology 50: 10-27
Wilce MCJ, Parker MW (1994) Structure and function of glutathione S-transferases. Biochim. Biophys.
Acta 1205: 1-18
Xiang CB, Werner BL, Christensen EM, Oliver DJ (2001) The biological functions of glutathione
revisited in Arabidopsis transgenic plants with altered glutathione levels. Plant Physiology 126: 564-574
Zettl R, Schell J, Palme K (1994) Photoaffinity labeling of Arabidopsis thaliana plasma membrane
vesicles by 5-azido[7-3H] indole-3-acetic acid: Identification of a glutahione s-transferase.
Proceedings of the National Academy of Sciences of the United States of America 91: 689-693
Zhao FJ, Bilsborrow PE, Evans EJ, McGrath SP (1997) Nitrogen to sulfur ratio in rapeseed and in
rapeseed protein and its use in diagnosing sulfur deficiency. J Plant Nutr 20: 549-558
13

Chapter 2
Increased disease susceptibility of sulfur deficient oilseed rape is caused by a loss of antifungal potential
14

Increase disease susceptibility of sulfur deficient oilseed rape is caused by a loss of antifungal potential
Pierre-Henri Dubuis1, Cristina Marazzi2, Erich Städler2 and Felix Mauch1
1Department of Biology, University of Fribourg, Pérolles, 1700 Fribourg, Switzerland 2Eidg. Forschungsanstalt, Postfach 185, CH-8820 Wädenswil, Switzerland
Abstract
The reduction of S02 atmospheric pollution in the early nineties caused sulfur-deficiency
problems in the agriculture of northern Europe. Sulfur is essential for plant development and
sulfur containing compounds such as sulfur rich antifungal proteins, phytoalexins and
glucosinolates play an important role in plant defense against pathogens. Sulfur deficient plants
with no visible symptoms showed a strong decrease in total sulfur and glutathione content and an
increased susceptibility to the blackleg fungus Leptosphaeria maculans, to the generalist
necrotroph Botrytis cinerea and to the oomycete Phytophthora brassicae. To test the cause of this
increased susceptibility, a methanol extract containing secondary mrtabolites and a water extract
of soluble proteins of plants grown with and without sulfur fertilization were used in fungal
growth inhibition tests. The methanol extract of normaly fertilized plants had antifungal activity
against a variety of fungal pathogens and this activity was almost totally lost in extracts of S-
starved plants. Plants preinoculated with B. cinerea did not contain an increased antifungal
potential indicating that phytoalexins do not contribute to this activity. The loss of antifungal
activity correlated with a strong reduction of the glucosinolate content of the methanol extract
suggesting that the reduced level of glucosinolates might be the cause of the reduction of the
antifungal potential. However, by testing different glucosinolates for antifungal activity no causal
link could be demonstrated.
Keywords: sulfur, nutrition, sulfur starvation, disease resistance, antifungal potential, glucosinolates,
isothiocyanates, Brassica napus.
15

Introduction
Sulfur is one of the essential macroelements for plant life with numerous biological functions
(Leustek et al., 2000). Sulfur is taken up by plants in its inorganic sulphate form from the soil or
sulfur dioxide and hydrogen sulphide gases from the atmosphere. In the initial step of the biological
sulfur cycle, plants assimilate and reduce sulphate to sulphide and then incorporate it into cysteine,
the first organic molecule carrying reduced sulfur. Cysteine is further converted to methionine. Sulfur
is contained in a variety of cellular components and plays critical biochemical roles in a number of
cellular processes, such as redox cycle, detoxification of heavy metals and xenobiotics, and
metabolism of secondary products. (Saito, 2000; Nikiforova et al., 2003).
Intensive farming and yield raising in crop production has increased the demand for sulfur in the last
decades, but this went unnoticed in industrialized contries because of pollution by atmospheric
deposition of SO2 produced by burning of S-containing fossil fuels. In the second part of the 20th
century air pollution with sulfur dioxide became a major concern. Thermal power plants burning high
sulfur coal or heating oil are generally the main sources of anthropogenic sulfur dioxide emissions
worldwide, followed by industrial boilers, and non ferrous metal smelters, although there are natural
sources of sulfur dioxide (accounting for 25-65 percent of total SO2 emission) such as volcanoes
(www.ourplanet.com). Emissions from domestic coal burning and SO2 from vehicles can also
contribute to high local atmospheric concentrations of sulfur dioxide. Pollution resulting from sulfur-
rich fuels has an effect on death rates, especially respiratory and cardiovascular deaths (Hedley et al.,
2002) and was the major source of acid rains. In response to this problem in the mid-eighties
governments of developed countries took policies to legally enforce the drastic reduction of SO2
emissions (Helsinki protocol 1979). As an unexpected outcome of the reduction of sulfur dioxide
pollution in recent years an increased frequency of sulfur deficiency has been observed in several
crops mainly in northern Europe. Sulfur may become a factor limiting yield and crop quality in
agriculture (Dämmgen et al., 1998; Eriksen and Mortensen, 1999).
It has been known since the antiquity that sulfur has protective effects against pests and diseases.
Most of the knowledge is however restricted to the external effect of foliar applied sulfur. Less is
known about soil supplied sulfur which has a strong influence on plant resistance by directly
stimulating biochemical processes in primary and secondary metabolism (Pezet et al., 1986; Schnug,
1996). Field observations pointed at positive correlation between S-fertilisation and enhanced disease
resistance against fungal pathogens (Davidson and Goss, 1972; Schnug, 1996). This lead to the
question, whether sulfate availability could be a limiting factor for the ability of plants to respond to
fungal infection.
In recent years oilseed rape (Brassica napus L.) has become the major oil crop in the EU and one of
the major three oil crops worldwide (Howlett et al., 2001). Oilseed rape is particularly sensitive to S
deficiency because it has a high demand for S. Oilseed rape produces seeds with a large yield of
protein with relatively large quantities of S-containing amino acids (Zhao et al., 1997; Blake-Kalff et
al., 1998) and the plants require S for the synthesis of glucosinolates, a group of thioglucoside
compounds reported to be part of the plant defense mechanism against fungi and insects (Blake-Kalff
et al., 1998). In Switzerland the production of oilseed rape has increased in the nineties and stabilises
in recent years to about 50’000t/years (www.agirinfo.com).
Of the phytopathogenic fungi known to affect rapeseed, Leptosphaeria maculans (anamorph: Phomalingam) causes the highest economic losses of this crop worldwide (Howlett et al., 2001). Botrytis
16

cinerea (teleomorph Botryotinia fuckeliana ) commonly named grey mould, is a characteristic
necrotrophic pathogen that has a very broad host range with more than 250 potential host plants
(MacFarlane, 1968) including economically important crops such as cereals, fruits, vegetables, and
flowering plants. B. cinerea is not a problem on rape but it was used in our study as a non specialized
ubiquitous pathogen to compare it to the specialized L. maculans. Phytophthora brassicae (formerly
P. porri) is an oomycete infecting a wide range of Brassicacea plants including B. napus and
Arabidopsis thaliana. In our study we have used a strain expressing a green fluorescent protein as a
quantitative marker (Si-Ammour et al., 2003).
The effect of S-starvation on the resistance of oilseed rape to three different pathogens was analysed.
Taken together our results show a clear influence of the S-nutritional status of the plant on its
resistance to disease. To find out which mechanism could be responsible for the decrease resistance
of sulfur deficient plants, the antifungal potential of a MeOH extracts containing secondary
metabolites and extracts of water-soluble proteins were tested. The MeOH extract of normal plants
showed antifungal activity against a number of phytopathogenic fungi. This activity was lost in
extracts of S-deficient plants. The loss of antifungal activity correlated with a strong reduction in
glucosinolates conten., However, we were not able to link the reduction of antifungal activity to the
reduction of a particular glucosinolate or derived isothiocyanate.
17
Materials and Methods
Organisms and growth condition
Seeds of Brassica napus cv Bienvenu (0) and cv Express (00) were obtained from the Swiss federal
agricultural research station of plant production of Changins. Seeds were sown on vermiculite and
watered first with tap water and after 10 days once with half strength Hoagland nutritive solutions
containing sulfur (Hoagland and Martin, 1950). After 15 days the seedlings were transferred to pots
containing quartz sand (diameter 12 cm) and further watered with 0.5x Hoagland solution with or
without addition of sulfate in form of MgSO4. For the S-deficient plants the MgSO4 was replaced by
equimolar amount of MgCl2, and among micro salts CuCl2, MnCl2 and ZnCl2 were used instead of
CuSO4, MnSO4 and ZnSO4. Plants were grown in a growth chamber at 20°C 16h light / 18°C 8h dark
cycle.
Leptosphaeria maculans (anamorph: Phoma lingam) and Cladosporium sp isolates were obtained
from the Swiss federal agricultural research station of plant production of Changins and grown on
Potato Dextrose Agar (PDA, Difco, Detroit, USA) containing 25 μg/ml of aureomycin
(chlortetracycline hydrochloride, Rectolab SA, Servion, Switzerland). L. maculans’ pycnidiospores
production was induced by growing colonies for 14 days at 15°C under 12h black light (OSRAM
L3673 BLB)/12h dark cycle. Pycnidiospores were harvested according to (Hammond et al., 1985).
The ascomycete Botrytis cinerea isolates BMM and Pellier were isolated from geranium and vine,
respectively and grown on Potato Dextrose Agar (Difco, Detroit USA). Conidia from 14 days old
well sporulating colonies were harvested in distilled water containing 0.2% (v/v) Tween-20. The
oomycete Phytophthora brassicae isolate 155 expressing constitutively a green fluorescent protein
(GFP) was grown on V8 agar (Si-Ammour et al., 2003).
Inoculation protocols
Leaves of 5 to 6 week old plants, at growth stage 2.4 - 2.5 of the scale devised by (Harper and
Berkenkamp, 1975), were inoculated with the different pathogens. For L. maculans 10 μl of a spore
suspension (106 spores/ml) in water with 0.2% Tween-20 was applied to the leaves after wounding
with a needle. Plants were incubated for 5 days in 100% HR in a glass chamber, and then the lids
were removed. Lesion size was measured at 12 and/or 21 dpi. For B. cinerea 10 μl of a spore
suspension (104 spores /ml) in water with 0.2% Tween-20 was applied to the leaves after wounding
with a needle. Plants were incubated at 100% HR and lesions size was measured at 4 or 5 dpi. Agar
plugs taken from the margins of an expanding colony of P. brassicae were applied to the leaves after
wounding with a needle. Plants were then incubated in 100% HR for 7 days for lesions size
measurement. Four days after infection GFP fluorescence was determined (Si-Ammour et al., 2003).
The experiments were repeated threetimes. For each repetition 32 independent measurements were
done for L. maculans, and 16 independent measurements for B. cinerea and P. brassicae.
Measurement of total sulfur and glutathione
For total S content, leaves of 6 week old B. napus cv Bienvenu plants were dried for 48h at 65°C and
then ground to fine powder with a mixer (Moulinex, type Y91). Two independent batches of plants
were then mixed for analysis. Total S was determined using a Philips PW2400 X-ray fluorescence
(X-RF) spectrometer under constant Helium flux, at the University of Lausanne according to (Schnug
18

and Haneklaus, 1992). Total GSH content of 6 week old B. napus plants cv Bienvenu was determined
according to (Harms et al., 2000). Frozen leaf material (60mg) was homogenised to a fine powder and
extracted for 15 min in 600 μl 0.1 N HCl at 4°C. After centrifugation (20 min, 14000g, 4°C), 120 μl
of the supernatant were added to 200 μl of 0.2 M 2-(cyclohexylamino) ethanesulfonic acid (pH 9.3).
Reduction of total disulfides was performed by adding 10 μl 9 mM bis-2-mercaptoethylsulfone in 200
mM Tris-HCl, 5 mM EDTA (pH 8). After 40 min at room temperature, free thiols were labelled with
20 μl 15 mM monobromobimane in acetonitrile and incubated for 15 min in the dark at room
temperature. The reaction was stopped by adding 250 μl 15% HCl. The samples were analysed by
HPLC (Harms et al., 2000).
Plant extractions and glucosinolates analysis
MeOH extracts (Griffiths et al., 2001) were used to quantify the glucosinolates content of the plant
and in growth inhibition tests. For glucosinolate determination 20 μl aliquots were analysed by
HPLC. The analytical column used was equipped with a Lichrospher (100 RP 18, 5 μm, 4 x 250
mm). The binary mobile phase system was composed of distilled water (A) and water : acetonitrile,
80 : 20 (B). The analysis was run with the following gradient program: 0 to 45 min linear gradient 0
to 100% B and then held for 5 min on 100% B. The flow rate was 1 ml/min and the detection of
desulfoglucosinolates was monitored with an UV/VIS detector at 230 nm.
For protein extraction rape leaves (5g fresh weight) were ground in liquid nitrogen with a mortar and
pestle. The resulting powder was extracted with 2.5 vol of 50 mM Tris/HCl pH 7.5 containing 1 mM
phenylmethylsulfonyl fluoride (PMSF). Insoluble material was removed by centrifugation at 10’000g
for 20 min. Protein were precipitated with ammonium sulfate (95% saturation) at 0°C for 2 h. The
proteins were collected by centrifugation (20’000g, 20 min) and resuspended in 2 ml 10mM Tris/HCl
pH 7.5. The extracts were desalted using Sephadex G-25 columns and filtered successively through a
0.45 and 0.22 μm membrane filters prior to application in the bioassays. For bioassays of plants after
induction of defense mechanisms, detached leaves of six week old plants were wounded with a needle
and inoculated with B. cinerea at a concentration of 3 x 10³ spores/ml. After 60 hours the leaves were
extracted with MeOH as described previously.
Bioassays
Fungal spores were harvested from well sporulating colonies on PDA plates and were resuspended in
half-strength PDB (potato dextrose broth, Difco, Detroit, USA). The concentration of the spores
suspensions was adjusted to 2 to 4 x 10⁵ spores/ml. 0.5 ml from the freshly prepared spores’
suspensions was spread on 9 cm PDA Petri dishes. The plates were incubated 24h at 18°C to allow
the spores to germinate. At this time, 5 mm diameter sterile paper filter discs were laid on the agar
surface and 40 μl of the solution to be tested was applied to the discs. After additional 48 to 72 hours
incubation at 18°C the inhibition zones were measured and pictures were taken from the plates. For
each treatment three repetitions with 5 replicates were done with two different extracts. For pure
molecule bioassays 40μl of isothiocyanate (Fluka, Buchs, Switzerland) at concentration of 1mM and
10μM were applied to Petri dishes inoculated with Cladosporium sp. For sinigrin degradation
products 10mM sinigrin (Carl Roth AG, Karlsruhe, Germany) in 0.33M KPO4 buffer was incubated
with 5 units myrosinase (thioglucoside glucohydrolase, Sigma Chemicals, St Louis, USA) 1 hour at
25°C. For each treatment three repetitions with 5 replicates were done. Pathogen growth inhibition
tests in microtiter plates were done according to (Berrocal-Lobo et al., 2002).
19
Results
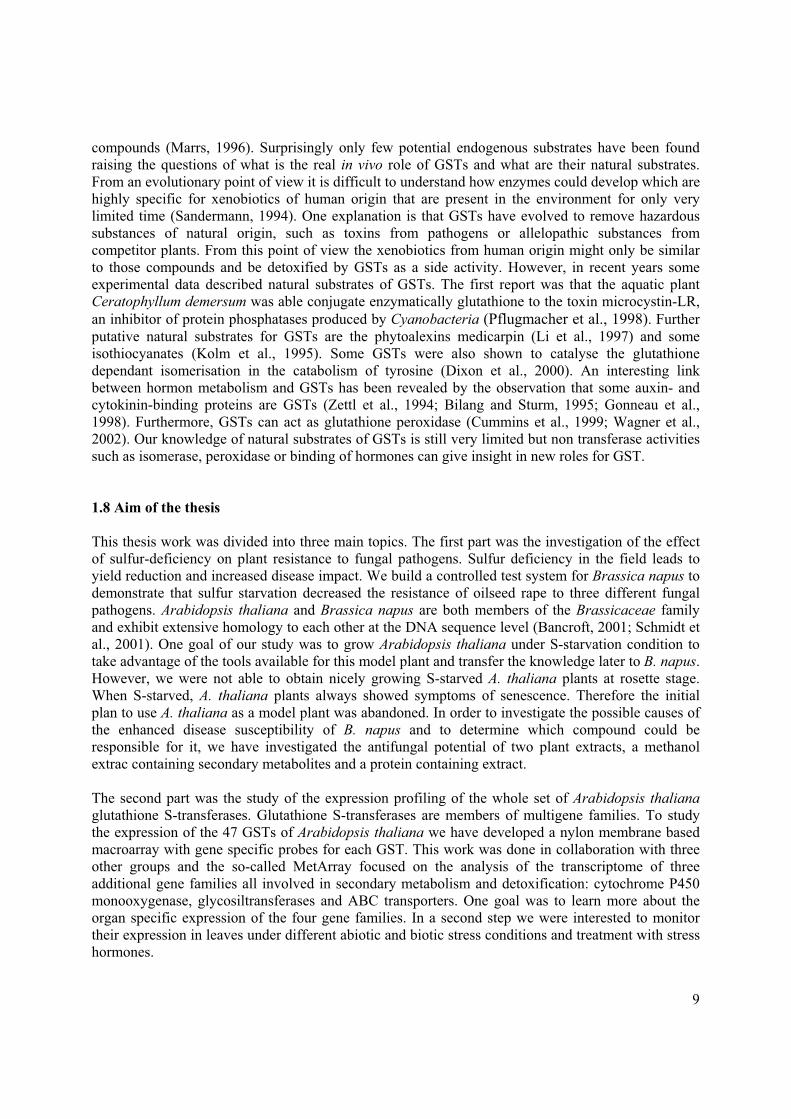
In the field sulfur deficient plants often show only weak or no obvious visible symptoms at all but the
effect of this S-deficiency on yield and disease resistance can nevertheless be important. To produce
controlled sulfur deficiency, two rape varieties, Brassica napus cv Bienvenu and B. napus cv Express,
were sawn on vermiculite and watered once after 10 days with sulfur containing Hoagland nutritive
solution. After 15 days they were transferred to quartz sand and watered during 3 to 4 weeks with
Hoagland nutritive solution with or without addition of sulfur. After 5 to 6 weeks at the time of
pathogen inoculation the S-starved plants did not show any visible sign of S-deficiency and looked
healthy. At this time point plant grown on full nutritive solution (Figure 1A) looked very similar and
were impossible to distinguish from S-starved plants (Figure 1B). However, when starved for eight
weeks younger leaves started to exhibit strong S-deficiency symptoms (Figure 1C). The chlorosis
spread over intercostal areas with anthocyan accumulation while the zones along the veins remainded
green (Haneklaus and Schnug, 1992).
A B
C
Figure1. Growth phenotype of S-deficient B. napus.A) Six week B. napus plants grown on quartz sandfertilized with Hoagland solution containing MgSO4and B) without sulfate fertilization. No S-deficiencysymptoms are visible at this point. C) After 8 weeksof S-starvation plants showed clear symptoms of S-deficiency.
To confirm that plants fertilized with the solution without sulfur were indeed S-deficient, total sulfur
and glutathione content were measured at the time of inoculation (Table 1). Sulfur starved plants even
if they showed no visible symptoms, contained only 9.8% of total sulfur and 6.3% of GSH compared
to normal plants. Plants grown on soil were included in our analysis to as comparison for plants
growing in normal field conditions. Plants grown on sulfur containing Hoagland nutritive solution
showed about 20% reduction in total sulfur content and about 60% reduction in total GSH content.
20

With the XRF analysis method used to determine total sulfur content it was also possible to obtain the
plant content for Fe, Ca, Mg, K and P. We observed no significant difference for Ca, Mg and P. K
was reduced in sulfur starved plants by about 40% and Fe was below detection level in all samples
(data not shown).
Table 1. Total sulfur and GSH content of leaves of six week old B. napus and five week old A.thaliana plants grown on soil or on quartz sand with or without S fertilization.
B. napus A. thaliana
Total S GSH total Total S GSH total
(% of DW) (nmol/gFW ±SE) (% of DW) (nmol/gFW ±SE)
Soil 1.30 140.0 ± 18.3 0.79 54.0 ± 2.6
Sand/Hoagland +S 1.02 59.1 ± 7.5 0.74 154.9 ± 5.6
Sand/Hoagland -S 0.10 3.7 ± 1.0 0.75 147.9 ± 14.9
At the beginning of our study we have tried to grow Arabidopsis thaliana plants under the same
conditions as rape to take advantage of the tools available for this model plant and then transfer the
knowledge to B. napus. However, we were not able to obtain nicely growing sulfur deficient
Arabidopsis plants. A. thaliana was very efficient in obtaining nutriment and showed a normal S
content under the same S-starving condition as rape (Table 1). It only exhibited a 25% growth
reduction in biomass production. After intensive washing of the quartz sand S-deficient Arabidopsis
plants were obtained, but these plants did not grow properly. Already after 2 weeks, they started to
show clear signs of senescence in form of yellowing and anthocyan production. Thus, Arabidopsis
proved to be unsuitable for our experimental goals.
To study the effect of sulfur nutrition on plant disease resistance three pathogens were tested.
Leptosphaeria maculans a specific pathogen of Brassica which is considered as a facultative
necrotroph since the pathogen initially grows biotrophically, in the intercellular space without causing
cell death. In a later phase, it promotes necrosis and can live saprophytically on dead plant material
(Hammond et al., 1985; Hammond and Lewis, 1987). Botrytis cinerea is a very broad host range
necrotrophic ascomycete. The hemibiotrophic oomycete Phytophthora brassicae is able to infect
many crucifers including B. napus. Five different isolates of L. maculans and two isolates of
B. cinerea exhibiting diverse aggressiveness were screened to find for both fungi a moderate
aggressive isolate on normal plants. Cultivar Bienvenu was challenged with both L. maculans and B.cinerea. However due to its high resistance level to L. maculans cultivar Express was only inoculated
with B. cinerea.
Figure 2A shows pictures of typical lesions triggered by each pathogen on leaves of B. napus grown
with and without sulfur fertilization. For all three pathogens lesion size is clearly affected by the
sulfur status of the plant. With both L. maculans and B. cinerea on control plants the necrotic lesion
was surrounded by a black circle which defined clearly the end of the lesion. In S-starved plants this
black circle was generally missing and the lesion expanded broadly.
21

A L. maculans B. cinerea P. brassicaew
ith S
w
ithou
t S
0
2
4
6
8
10
12
14
16
18Bwith S
Lesi
on s
ize
in m
m (m
ean±
SE
) without S
P. brassicaeL. maculans B. cinerea B. cinereacv. Expresscv. Bienvenu cv. Express cv. Bienvenu
Figure 2. Disease resistance tests of fertilized and S-deficient B. napus plants. A) Disease symptoms on leaves of 6 week old B. napus caused by inoculation withLeptosphaeria maculans (21dpi), Botrytis cinerea (4dpi) and Phytophthora brassicae(7dpi). B) Summary of statistical analysis of the lesions size measurement. Theexperiments were repeated threefold and 32 independent measurements were donefor L. maculans, and 16 independent measurements for B. cinerea and P. brassicae.
22

Figure 2B shows the effect of the sulfur status of B. napus cv Express and cv Bienvenu on disease
susceptibility against the three pathogens. At 21 dpi lesions caused by L. maculans on S-deficient B.napus cv Bienvenu leaves were 1.9 times larger than in normally fertilised plants. In control plants
lesion size remained the same between 12 dpi and 21 dpi whereas it still continued to increase in S-
starved plants (data not shown). More pronounced differences were observed with B. cinerea in both
B. napus cv Express and cv Bienvenu. In the cultivar Express lesions were at 4 days post inoculation
about 24 times larger in sulfur starved plants compared to the controls. In the cultivar Bienvenu this
difference was reduced to about 3.7 fold. Finally compared to control plants the disease lesions
caused by Phytophthora brassicae were 3.3 times larger in the plants that lack adequate S-nutrition.
To quantify the fungal development by another method, we have used an isolate of P. brassicae that
is expressing green fluorescent protein (GFP) as a quantitative marker (Si-Ammour et al., 2003). This
fluorescent isolate makes it possible to quantify the pathogen biomass by measuring GFP
fluorescence. Figure 3 shows that uninfected leaves (black area) had a base line fluorescence due to
chlorophyll autofluorescence of 467 relative units for the control plants and 317 relative units for the
S-starved plants. This reduction in autofluorescence indicates a reduction in chlorophyll content of S-
starved plants. The fluorescence level was only slightly increased to 644 relative units in control
plants inoculated with P. brassicae expressing GFP (black area) indicating that P. brassicae did
hardly colonize these plants. In contrast, in inoculated S-deficient plants the fluorescence strongly
increased to 1172 relative units. After subtraction of the background fluorescence there was a 4.8 fold
increase in GFP fluorescence levels between normally fertilized plants and S-deficient plants
indicating that S-deficient plants were much more susceptible towards P. brassicae.
0
200
400
600
800
1000
1200
1400
with S without SFluo
resc
ence
inre
lativ
e un
its (m
ean+
SE)
Figure 3. GFP fluorescence of differently fertilized B. napus cv
Express infected with P. brassicae constitutively expressing
GFP. Black area shows the level of autofluoresence of the
chloroplasts. White area shows the GFP fluorescence caused by
the spread of the P. brassicae.
23

Our results demonstrate that S-deficiency negatively affects disease resistance of B. napus. The
increase in susceptibility could be caused by the specific effect of S-deficient on the accumulation of
one or more S-containing defense compounds. To further analyse this hypothesis, we have tested
extracts from normal and S-deficient plants for their antifungal potential.
A total methanol extract used to quantify the glucosinolates from control plants was found to inhibit
the in vitro growth of the four fungal pathogens. L. maculans, B. cinerea, Cladosporium sp and
Penicillium sp as indicated in form of growth inhibition zones around the applied extract (Figure 4A).
A similar extract from plants suffering S-deficiency had no or very little effect on all four fungi
tested. Figure 4B shows that the inhibition zone caused by extracts from S-fertilised plants is in
comparison to S-deficient plants 6.6 times larger for L. maculans, 6.8 times larger for B. cinerea, 12
times larger for Cladosporium and 25 times larger for Penicillium. Figure 4C shows the effect of the
MeOH extracts on the growth of the phytopathogenic bacterium Pseudomonas syringae pv tomato, of
B. cinerea and of Penicillium sp assayed in liquid culture in microtiter plates. Growth was measured
as an increase in absorbance at 490 nm. Methanol extracts from S-deficient plants had 5.4 times lower
antibacterial activity than extracts from control plants. The reduction in antifungal potential was 2.2
fold for B. cinerea and 2.5 fold for Penicillium. To test if the antifungal potential was increased
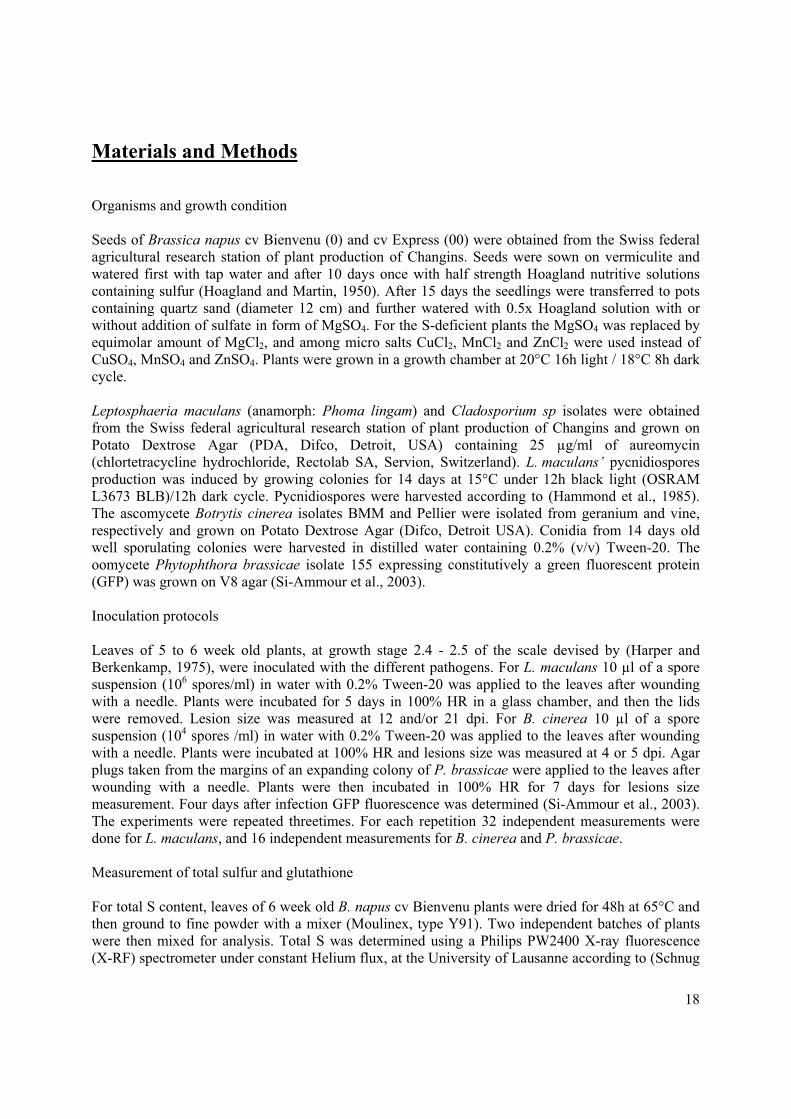
following inoculation due to induced metabolites such as phytoalexins, MeOH extracts of B. cinerea
inoculated B. napus leaves were analysed in fungal growth inhibition test. The plants were extracted
60 hours after inoculation. Figure 5 shows no significant difference in antifungal potential between
extracts of inoculated or control plants leading to the conclusion that the antifungal potential is due to
phytoanticipins and not phytoalexins. Furthermore, no inhibition was observed with protein extracts
from both control and S-starved plants, challenged or not with B. cinerea as a pathogen to induce
defense responses.
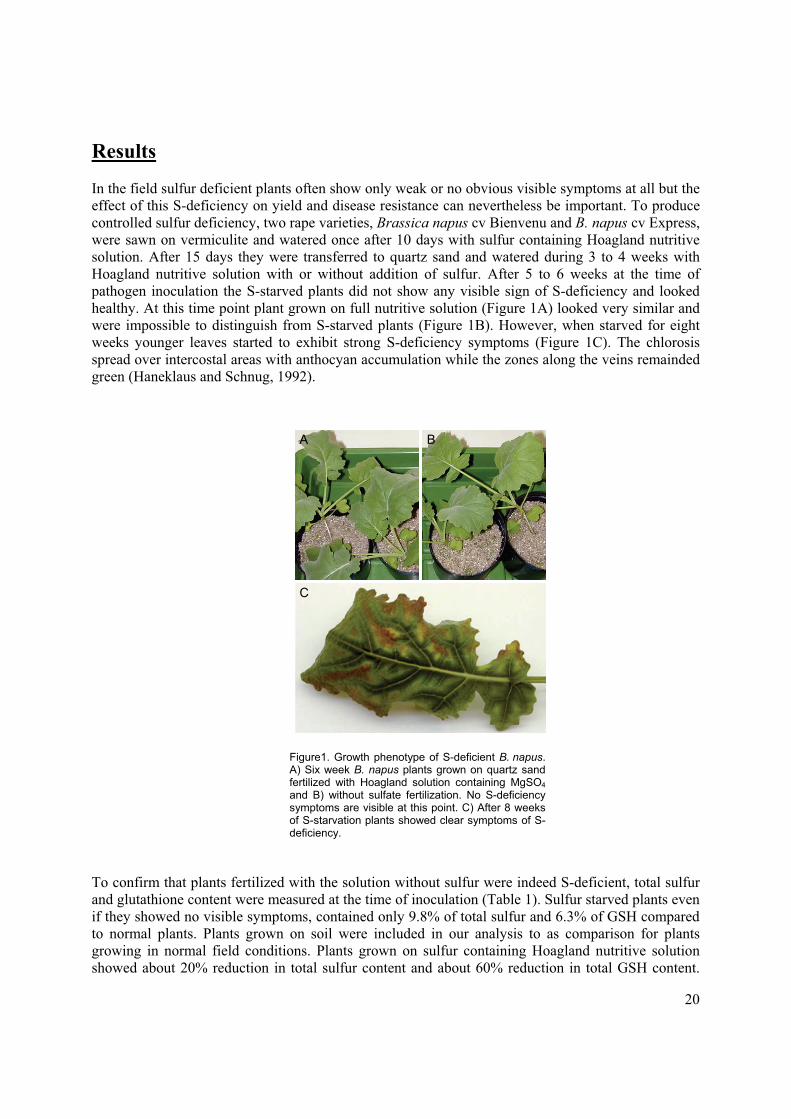
Figure 6 shows the quantification of four groups of GSL: alkene-, indolyl-, thioalkyl- and aromatic-
GSLs. Table 2 shows the list of individual GSLs measured and the group to which they belong. The
alkene GSLs group contains progoitrin, sinigrin, napoleiferin, gluconapin and glucobrassicanapin.
The indolyl GSLs group includes glucobrassicin and neoglucobrassicin. The thioalkyl GSLs group
comprises glucoiberin, sulphoraphene and glucoiberverin. The aromatic GSLs group contains
gluconasturiin. The reduction of GSLs content in S-deficient plants is 14 times for indolyl GSLs, 18
times for aromatic GSL, 21 times for thioalkyl GSLs and 85 times for alkene GSLs. Thus, S-deficient
had a dramatic negative effect on the glucosinolate content. There is a good correlation between
reduced glucosinolates levels and reduced antifungal and antibacterial activity of the glucosinolate
containing MeOH extract. To test the hypothesis that GSLs could be responsible for the antifungal
potential of the MeOH extract, eight different commercially available isothiocyanates (ITC): methyl-
ITC, ethyl-ITC, allyl-ITC, tert-butyl-ITC, phenyl-ITC, methoxyphenyl-ITC, 2-phenylethyl-ITC,
benzyl-ITC and the degradation product of the GSL sinigrin were tested for their antifungal potential
on agar plates against Cladosporium (Table 2). None of the eight ITC and sinigrin degradation
products show antifungal activity even at very high concentration of 1mM (data not shown). It
remains an open question whether the degradation products of the many other GSLs of B. napus
possess direct antifungal activity.
24

Lm Bc1 2 21
A 5 5
33 44
C. sp P. sp21 2 1
55
3
25
5
7
9
11
13
15
17
19
L. maculans B. cinerea Cladosporiumsp
Penicillium spInhi
bitio
n si
zein
mm
(mea
n+S
E)
0
0.05
0.1
0.15
0.2
0.25
P. syringae B. cinerea Penicillium spAbs
orba
nce
at49
0nm
(mea
n+SE
)
B
C
Figure 4. Antimicrobial activity of MeOH extracts from fertilized and S-deficient B.napus plants. A) Growth inhibition of Leptosphaeria maculans (Lm), Botrytis cinerea(Bc), Cladosporium sp (C. sp) and Penicillium sp (P. sp). 1 and 2 are extracts of plants grown without sulfur fertilization; 3 and 4 are extracts of plants grown withsulfur fertilization. 2 and 4 are 10-times diluted compared to 1 and 3, respectively. 5corresponds to a control. B) Quantitative analysis of the growth inhibition tests. C) Inhibitory effect of the MeOH extracts on the growth of the bacteria P. syringae pvtomato and on B. cinerea and Penicillium sp. The test organisms were grown inliquid culture in microtiter plates. Quantification was done by measurement ofabsorbance at 490 nm. Each value is the average of five measurements. Theexperiments were repeated threefold.
34 4
+ S
- S
+ S
- S
5
7
9
11
13
15
17
19
Ctrl Preinoculated Ctrl W
Inhi
bitio
n si
zein
mm
(mea
n+S
E)
+ S
- S
Figure 5. MeOH extracts of preinoculated plants do
not have increased antifungal potential. Ctrl
corresponds to extracts from non inoculated plants,
Preinoculated represents extracts from plants
inoculated with B. cinerea 60 hour prior to extraction.
Ctrl W correspond to extracts of non inoculated plants
from which the GSLs content was analysed (see
Figure 6).
0
1
2
3
4
5
6
alkenes indolyl0.00
0.05
0.10
0.15
0.20
thioalkyl aromatic
+ S + S
Glu
cosi
no
late
s co
nte
nt
(mm
ole
s/k
g)
- S - S
Figure 6. Quantification of glucosinolate concentration in MeOH
extracts of normal and S-deficient B. napus. The analysed individual
glucosinolates were grouped into 4 groups according to their chemical
features (see Table 2). Each group of GSL shows strong reduction in of
S-deficient plants. Reduction is 85x for alkene, 14x for indolyl, 21x for
thioalkyl and 18x for aromatic GSL.
26

Table 2. List of glucosinolates measured in B. napus cv Express leaves and isothiocyanates
(ITC) tested in bioassays. The individual GSLs analysed were grouped according to their
structural similarities: A = alkene, B = aromatic, I = indolyl and T = thioalkyl.
Glucosinolates analysed
common name chemical name group
progoitrin 2(R)-2-hydroxy-3butenyl Dsinigrin 2-propenyl Dnapoleiferin 2-hydroxy-4-pentenyl Dgluconapin 3-butenyl Dglucobrassicanapin 4-pentenyl Dgluconasturtiin 2-phenylethyl Gglucobrassicin indole-3-ylmethyl Ineoglucobrassicin 1-methoxyindol-3-ylmethyl Iglucoiberin 3-(methylsulfinyl)propyl Asulforaphene 4-methylsulfinyl-3-butenyl Aglucoberverin 3-methylthio)propyl A
ITCs tested in bioassays corresponding GSL
allyl-ITC allyl-GSLbenzyl-ITC glucotropaeolinethyl-ITC glucolepidiin3-methoxyphenyl-ITC methoxyphenyl-GSLmethyl-ITC glucocapparinphenylethyl-ITC gluconasturtiinphenyl-ITC phenyl-GSLter-butyl-ITC butyl-GSL
27

Discussion
Sulfur is part of a wide variety of cellular components and plays critical roles in a number of cellular
processes, such as structural and regulatory roles via protein disulfide bridges, or biochemical roles
like electron transport in Fe/S-clusters, redox cycle, detoxification of heavy metals and xenobiotics,
and metabolism of secondary products (Hell, 1997; Saito, 2000). The major part of reduced sulfur is
channelled from cysteine into methionine, Fe/S clusters, vitamin cofactors and proteins (Hell and
Hillebrand, 2001). Under S-deficient growth conditions plants try to acclimate by synthesizing high-
affinity sulfate transporters that function in the efficient uptake of external sulfur and reallocation of
internal sulfur sources (Takahashi et al., 1997; Leustek et al., 2000; Saito, 2000). In recent many
products of the plant’s response to pathogen turned out to be S-containing compounds like the
phytoalexins and glucosinolates of crucifers or the sulfur rich antifungal peptides (Vignutelli et al.,
1998; Tierens et al., 2001). The reduction of atmospheric sulfur pollution lead to S-deficiency in the
field and had a negative impact on yield and pathogen resistance. In this study we focused on the
effect of S-deficient on plant disease resistance.
Taken together our results showed clearly that oilseed rape plants grown under S-deficiency
conditions exhibited enhanced disease susceptibility (Figure 2). This was true for all pathogens tested,
for the specialized L. maculans and the ubiquitous pathogens B. cinerea and P. brassicae and for the
two B. napus cultivars Express and Bienvenu. The enhanced disease susceptibility is apparently
caused by a general mechanism because the change in susceptibility was not pathogen or cultivar
specific. Field experiments pointed at a positive correlation between S-fertilisation and disease
resistance of oilseed rape against fungal pathogens but no causal link was demonstrated (Schnug,
1996). There are two main ways to explain why S-deficient plants become more susceptible to
pathogens. First, the increased susceptibility is caused by the specific effect of S-deficiency on the
accumulation of S-containing defense compounds such as phytoalexins, glucosinolates and cysteine-
rich antifungal polypeptides which play a determinant role in pathogen resistance. Second, S-
deficiency leads to a general fitness reduction and a global weakening of the plant that causes general
susceptibility to stress.
In our study MeOH extracts of control plants showed antifungal activity with four different fungal
pathogens and this activity was almost completely lost in MeOH extracts of S-deficient plants.
Furthermore, the antifungal potential was not increased by activation of induced defense mechanism.
This means that the responsible compounds are phytoanticipins present in healthy plants before
infection and not phytoalexins induced after infection. Interestingly, the reduced antifungal activity of
extracts from S-deficient plants correlated with a strong reduction in GSLs content. Upon tissue
damage GSLs enter in contact with the enzyme myrosinase (thioglucoside glucohydrolase, EC
3.2.3.1) and the unstable alglycone generated by the action of myrosinase may then form various
degradation products, including isothiocyanates, nitriles and thiocaynates, all of which are highly
reactive compounds (Mithen et al., 1986; Osbourn, 1996). The major breakdown products generated
in leaves of Brassica are isothiocyanates. GSL hydrolysis products have been demonstrated to be
toxic towards a range of fungi in vitro, including pathogens and non-pathogens of Brassica. The
mechanism of toxicity is not known (Mari et al., 1993; Manici et al., 1997; Hashem and Saleh, 1999).
A number of pathogens of Brassica, such as L. maculans (Mithen et al., 1986) Peronosporaparasitica (Greenhalgh and Mitchell, 1976) Mycosphaerella brassicae (Hartill and Sutton, 1980) and
Alternaria sp (Milford et al., 1989), have been shown to be sensitive to at least some glucosinolate
breakdown products. It has also been suggested that indolyl GSLs breakdown products may function
as precursors to a class of indole phytoalexins that are induced in Brassica (Rouxel et al., 1989).
28
However, it is unclear whether there is any relationship between resistance of fungi to GSLs and
ability to cause disease. Although inoculation with L. maculans elicited changes in the leaf indolyl-
GSL profiles, no correlation was found between degree of resistance to the fungus and the level of
GSLs (Wretblad and Dixelius, 2000). The role of GSLs in blackleg resistance has previously been
studied, but the relevance of these coumpunds remained still unclear. Early studies correlated sinigrin
content with resistance to L. maculans (Mithen et al., 1987). High GSL levels have been associated
with resistance of oilseed rape and Indian mustard to L. maculans (Mithen and Magrath, 1992) and
with resistance of cabbages to P. parasitica (Greenhalgh and Mitchell, 1976). However, in studies of
crosses of B. napus lines with high and low GSLs levels in their leaves, resistance to L. maculans and
GSLs profiles did not cosegregate (Mithen and Magrath, 1992). Further studies with B. napus lines
that had contrasting GSLs profiles indicated that high levels of GSLs are unlikely to confer greater
resistance to L. maculans in oilseed rape (Giamoustaris and Mithen, 1997). Furthermore P. lingam
was shown to efficiently degrade the aliphatic GLSs sinigrin, progoitrin and gluconapin as well as
aromatic GSLs sinalbin (Wu and Meijer, 1999). This high number of GSLs in B. napus makes it
difficult to assess the antifungal activity of individual GSL. In addition, the nature of the breakdown
products depends on the structure of the GSLs, the type of myrosinase present, and other factors, like
pH, temperature, metal ion concentrations, and protein cofactors (Osbourn, 1996). It is therefore
difficult, simply by assessing the relative amounts of specific GSLs present in the host plant, to
predict which toxic products a pathogen is likely to encounter. Our tests with a limited number of
pure isothiocyanates and the degradation products of sinigrin showed that none of the tested GSLs
derived molecules exhibited antifungal activity. Apparentely some other compounds including other
GSLs appear to be responsible for the antifungal activity present in MeOH extracts of S-fertilized
plants. This means that some other molecules, not tested yet, are responsible for the antifungal
activity.
In conclusion we demonstrated that sulfur deficiency increases the susceptibility of oilseed rape
plants to fungal pathogens. S-deficient plants appear to lack one or more antifungal phytoanticipins.
The increase in susceptibility correlates with the reduction of GSLs, but no causal relationship was
demonstrated because none of the isothiocyanates or degradation products of sinigrin tested showed
antifungal activity. The second hypothesis of a general weakening of the plant could still play an
additional important role in the decrease of resistance of S-starved oilseed rape.
Aknowledgment
We thank Marianne Sutter (University of Bern, Switzerland) for the help with the GSH analysis and
Prof. H. Pfeifer and J-C. Lavanchy (University of Lausanne, Switzerland) for the total sulfur analysis.
We thank Peter Frei, Daniel Gindrat and Katia Gindro (RAC, Nyon, Switzerland) for kindly
providing the different strains of Leptosphaeria maculans and Cladosporium sp. This project was part
of the COST 829 Action and was financially supported by a grant of the Swiss Federal Office for
Education and Science.
29

References
Berrocal-Lobo M, Segura A, Moreno M, Lopez G, Garcia-Olmedo F, Molina A (2002) Snakin-2,
an antimicrobial peptide from potato whose gene is locally induced by wounding and
responds to pathogen infection. Plant Physiology 128: 951-961
Blake-Kalff MMA, Harrison KR, Hawkesford MJ, Zhao FJ, McGrath SP (1998) Distribution of
sulfur within oilseed rape leaves in response to sulfur deficiency during vegetative growth.
Plant Physiology 118: 1337-1344
Dämmgen U, Walker K, Grünhage L, Jäger H-L (1998) The atmospheric sulfur cycle. In E
Schnug, ed, Sulfur in agroecosystems. Kluwer Academic Publishers, Dordrecht, pp 75-114
Davidson RM, Goss RL (1972) Effects of P, S, N, lime, chlordane, and fungicides on ophiobolus
patch disease of turf. Plant Disease Reporter 56: 565-&
Eriksen J, Mortensen JV (1999) Soil sulphur status following long-term annual application of
animal manure and mineral fertilizers. Biology and Fertility of Soils 28: 416-421
Giamoustaris A, Mithen R (1997) Glucosinolates and disease resistance in oilseed rape (Brassicanapus ssp oleifera). Plant Pathology 46: 271-275
Greenhalgh JR, Mitchell ND (1976) Involvement of flavor volatiles in resistance to downy mildew
of wild and cultivated forms of Brassica oleracea. New Phytologist 77: 391-398
Griffiths D, Deighton N, Birch A, Patrian B, Baur R, Städler E (2001) Identification of
glucosinolates on the leaf surface of plants from the Cruciferae and other closely related
species. Phytochemistry 57: 693-700
Hammond KE, Lewis BG (1987) The establishment of systemic infection in leaves of oilseed rape
by Leptosphaeria maculans. Plant Pathology 36: 135-147
Hammond KE, Lewis BG, Musa TM (1985) A systemic pathway in the infection of oilseed rape
plants by Leptosphaeria maculans. Plant Pathology 34: 557-565
Haneklaus S, Schnug E (1992) Macroscopic symptomatology of sulfur deficiency symptoms in
Brassica napus. Phyton-Annales Rei Botanicae 32: 55-58
Harms K, von Ballmoos P, Brunold C, Hofgen R, Hesse H (2000) Expression of a bacterial serine
acetyltransferase in transgenic potato plants leads to increased levels of cysteine and
glutathione. Plant Journal 22: 335-343
Harper FR, Berkenkamp B (1975) Revised growth-stage key for Brassica campestris and B. napus.
Canadian Journal of Plant Science 55: 657-657
Hartill WFT, Sutton PG (1980) Inhibition of germination of Mycosphaerella brassicicola
ascospores on young cabbage and cauliflower leaves. Annals of Applied Biology 96: 153-161
Hashem FA, Saleh MM (1999) Antimicrobial components of some Cruciferae plants (Diplotaxisharra Forsk. and Erucaria microcarpa Boiss.). Phytotherapy Research 13: 329-332
Hedley AJ, Wong CM, Thach TQ, Ma S, Lam TH, Anderson HR (2002) Cardiorespiratory and
all-cause mortality after restrictions on sulphur content of fuel in Hong Kong: an intervention
study. Lancet 360: 1646-1652
Hell R (1997) Molecular physiology of plant sulfur metabolism. Planta 202: 138-148
Hell R, Hillebrand H (2001) Plant concepts for mineral acquisition and allocation. Current Opinion
in Biotechnology 12: 161-168
Hoagland DR, Martin JC (1950) Availability of potassium to crops in relation to replaceable and
nonreplaceable potassium and to effects of cropping and organic matter. Soil Science Society
of America Proceedings 15: 272-278
Howlett BJ, Idnurm A, Pedras MSC (2001) Leptosphaeria maculans, the causal agent of blackleg
disease of Brassicas. Fungal Genetics and Biology 33: 1-14
30

Leustek T, Martin MN, Bick JA, Davies JP (2000) Pathways and regulation of sulfur metabolism
revealed through molecular and genetic studies. Annual Review of Plant Physiology and Plant
Molecular Biology 51: 141-165
MacFarlane HH (1968) Plant host-pathogen index to volumes 1-40 (1922-1961). In CM Institute,
ed, Review of Applied Mycology, Kew, p Viii + 820pp.
Manici LM, Lazzeri L, Palmieri S (1997) In vitro fungitoxic activity of some glucosinolates and
their enzyme-derived products toward plant pathogenic fungi. Journal of Agricultural and
Food Chemistry 45: 2768-2773
Mari M, Iori R, Leoni O, Marchi A (1993) In-vitro activity of glucosinolate-derived
isothiocyanates against postharvest fruit pathogens. Annals of Applied Biology 123: 155-164
Milford GFJ, Fieldsend JK, Porter AJR, Rawlinson CJ, Evans EJ, Bilsborrow P (1989) Changes
in Glucosinolate concentrations during the vegetative growthof single- and doublelow
cultivars of winter oilseed rape. In MFB Dale, AM Dewar, RJ Froud-Williams, H T.J., DG
Jones, BL Rea, eds, Production and Protection of Oilseed Rape and Other Brassica Crops,
Vol 23, Warwick, UK, pp 83-90
Mithen RF, Lewis BG, Fenwick GR (1986) Invitro activity of glucosinolates and their products
against Leptosphaeria maculans. Transactions of the British Mycological Society 87: 433-
440
Mithen RF, Lewis BG, Heaney RK, Fenwick GR (1987) Resistance of leaves of Brassica species
to Leptosphaeria maculans. Transactions of the British Mycological Society 88: 525-531
Nikiforova V, Freitag J, Kempa S, Adamik M, Hesse H, Hoefgen R (2003) Transcriptome
analysis of sulfur depletion in Arabidopsis thaliana: interlacing of biosynthetic pathways
provides response specificity. Plant Journal 33: 633-650
Osbourn AE (1996) Preformed antimicrobial compounds and plant defense against fungal attack.
Plant Cell 8: 1821-1831
Pezet R, Zuccaroni P, Beffa T (1986) Soufre élémentaire:mode d'action fongicide et rôle chez les
plantes. La Défense des Végétaux 239: 3-16
Rouxel T, Sarniguet A, Kollmann A, Bousquet JF (1989) Accumulation of a phytoalexin in
Brassica spp in relation to a hypersensitive reaction to Leptosphaeria maculans.
Physiological and Molecular Plant Pathology 34: 507-517
Saito K (2000) Regulation of sulfate transport and synthesis of sulfur- containing amino acids.
Current Opinion in Plant Biology 3: 188-195
Schnug E (1996) Significance of sulphur for the nutritional and technological quality of domesticated
plants. In WJ Cram, De Kok, L. J., Stulen, I., Brunold, C. and Rennenberg, H., ed, Sulfur
metabolismus in higher plants - molecular, ecophysiological and nutritional aspects.
Backhuys Publishers, Leiden, The Netherlands
Schnug E, Haneklaus S (1992) Sulfur and light-element determination in plant-material by X- Ray-
Fluorescence spectroscopy. Phyton-Annales Rei Botanicae 32: 123-126
Si-Ammour A, Mauch-Mani B, Mauch F (2003) Quantification of induced resistance against
Phytophthora species expressing GFP as a vital marker: beta-aminobutyric acid but not BTH
protects potato and Arabidopsis from infection. Molecular Plant Pathology 4: 237-248
Takahashi H, Yamazaki M, Sasakura N, Watanabe A, Leustek T, Engler JD, Engler G, VanMontagu M, Saito K (1997) Regulation of sulfur assimilation in higher plants: A sulfate
transporter induced in sulfate-starved roots plays a central role in Arabidopsis thaliana.
Proceedings of the National Academy of Sciences of the United States of America 94: 11102-
11107
Tierens K, Thomma BPH, Brouwer M, Schmidt J, Kistner K, Porzel A, Mauch-Mani B, Cammue BPA, Broekaert WF (2001) Study of the role of antimicrobial glucosinolate-
31

derived isothiocyanates in resistance of arabidopsis to microbial pathogens. Plant Physiology
125: 1688-1699
Vignutelli A, Wasternack C, Apel K, Bohlmann H (1998) Systemic and local induction of an
Arabidopsis thionin gene by wounding and pathogens. Plant Journal 14: 285-295
Wretblad S, Dixelius C (2000) B-genome derived resistance to Leptosphaeria maculans in near
isogenic Brassica napus lines is independent of glucosinolate profile. Physiologia Plantarum
110: 461-468
Wu X-M, Meijer J (1999) In vitro degradation of intact glucosinolates by phytophathogenic fungi of
Brassica. In Proceedings of the 10th International Rapeseed Congress, Canberra
Zhao FJ, Bilsborrow PE, Evans EJ, McGrath SP (1997) Nitrogen to sulfur ratio in rapeseed and in
rapeseed protein and its use in diagnosing sulfur deficiency. J Plant Nutr 20: 549-558
32

Chapter 3
Transcriptome of Arabidopsis gene families related to secondary metabolism differentiates responses to
groups of abiotic and biotic stressors
33

Transcriptome of Arabidopsis gene families related to secondary metabolism differentiates responses to groups of abiotic and biotic stressors
Sabine Glombitza1,#, Pierre-Henri Dubuis2,#, Oliver Thulke1, Gerhard Welzl1, Lucien Bovet3,4, Michael
Götz1, Matthias Affenzeller1, Birgit Geist1, Alain Hehn5, Carole Asnaghi5, Dieter Ernst1, Harald K.
Seidlitz1, Enrico Martinoia3,o, Daniele Werck-Reichhart5, Felix Mauch2 and Anton R. Schäffner1,*
1Insitute of Biochemical Plant Pathology, Institute of Biomathematics and Biometry, and Institute of Soil Ecology,
Department of Environmental Engineering, GSF - National Research Center for Environment and Health, D-85764
Neuherberg, Germany, 2Départment de Biologie, Université de Fribourg, CH-1700 Fribourg, Switzerland, 3Laboratoire de Physiologie Végétale, Institute de Botanique, University of Neuchâtel, CH-2007 Neuchâtel,
Switzerland, 4Institute of Plant Sciences, University of Bern, CH-3013 Bern, Switzerland, and 5Department of Plant Stress Response, Institute of Plant Molecular Biology, CNRS-UPR2357, Université Louis
Pasteur, F-67083 Strasbourg Cedex, France
# contributed equally to this work
o Present address: Plant Biology - Molecular Plant Physiology, University of Zurich, CH-8008 Zurich,SwitzerlandThe online version of this article contains supplementary material.* For correspondence:Anton R. SchäffnerGSF - National Research Center for Environment and Health, Institute of Biochemical Plant Pathology, D-85764 Neuherberg, Germanyphone: +49-89-3187-2930; fax: +49-89-3187-2726; email: [email protected]
34
SummaryPlant secondary metabolism significantly contributes to defensive measures against adverse
environmental cues. To investigate stress-induced alterations at the transcriptional level of
underlying genes, a DNA array (MetArray) harboring gene-specific probes was established,
which combined Arabidopsis thaliana effector gene families encoding enzymes acting
consecutively in secondary metabolism and defense reactions. It contained the complete set of
genes encoding 109 secondary product glycosyltransferases and 63 glutathione-utilizing enzymes
along with 62 cytochrome P450 monooxygenases and 28 ABC transporters. Their transcriptome
was monitored in different organs of unstressed plants and in shoots in response to herbicides,
UV-B radiation, endogenous stress hormones, and pathogen infection. A principal component
analysis based on the transcription of these effector gene families defined distinct responses.
Methyl jasmonate and ethylene treatment was separated from a group combining reactions
towards two sulfonylurea herbicides, salicylate and an avirulent strain of Pseudomonas syringae.
The responses to the herbicide bromoxynil and UV-B radiation were separate from both groups.
A few genes were diagnostic in their specific response to two herbicide classes used.
Interestingly, a subset of genes induced by P. syringae was not responsive to the applied stress
hormones. In addition, small groups of comprehensively induced effector genes may be part of
defense mechanisms activated by several converging pathways. The differentiating expression
patterns detected by the MetArray provide a framework of information regarding the function of
individual genes and argue against widely redundant functions within the large gene families
analyzed.
35

Introduction
Plants feature an enormous variety of small organic, secondary metabolites, which possess diverse
protective, defensive or signaling functions. Accordingly, many enzyme activities encoded by
large gene families are involved in the biosynthesis, modification and compartmentation of these
compounds. These gene families are assumed to have evolved to provide a broad diversification of
similar biochemical reactions and flexibility of plant responses to different environmental
conditions (Pichersky and Gang, 2000). Our laboratories are aiming at elucidating the function of
selected gene families related to plant secondary metabolism, in particular with respect to their role
as effector genes in plant xenobiotic metabolism and pathogen defense. This study is focused on
analyzing the transcriptome of four gene families that cover different steps in secondary
metabolism: oxidation by cytochrome P450 monooxygenases (CYP), conjugation with UDP-
activated carbohydrates by secondary metabolite glycosyltransferases (UGT), conjugation with the
tripeptide glutathione by glutathione transferases (GST), and eventually compartmentation via
ATP-binding-cassette transporters (ABC transporters). Importantly, these enzyme classes are often
acting consecutively in the synthesis of secondary compounds and in detoxification reactions.
Products of CYP-catalyzed reactions are substrates for transferases such as UGTs and GSTs thus
leading to tagged molecules, which may be transported to the vacuole or excreted by ATP-driven
export pumps (Coleman et al., 1997; Jones and Vogt, 2001; Kreuz et al., 1996; Martinoia et al., 2002; Sandermann, 1994; Wagner et al., 2002).
CYP genes form one of the largest families with 246 genes and 26 pseudo-genes annotated in
Arabidopsis (Werck-Reichhart et al., 2002). Catalytic functions of CYPs are extremely diverse and
usually result from the activation of molecular oxygen and insertion of one oxygen atom into a
lipophilic substrate to produce a compound that can be further processed (Mansuy, 1998; Werck-
Reichhart and Feyereisen, 2000). Plant CYPs are involved in the synthesis of precursors of polymers,
pigments, signaling and defense molecules and the hydroxylation or dealkylation of exogenously
applied compounds (Chapple, 1998; Kahn and Durst, 2000; Werck-Reichhart et al., 2002; Schuler
and Werck-Reichhart, 2003).
CYPs are defined by a common structural fold and only three strictly conserved amino acids (Graham
and Peterson, 1999; Werck-Reichhart and Feyereisen, 2000). Sequence identity among plant CYPs is
variable ranging from below 20% to higher than 95% in highly duplicated sub-families forming
clusters of up to 13 genes at the same locus. By far the largest CYP clade is usually referred to as
plant specific class A including mainly enzymes of secondary metabolism. Four to six other clades,
referred to as Non-A CYPs, are related to animal or microbial enzymes involved in lipid, sterol or
large isoprenoid metabolism (Paquette et al., 2000; Werck-Reichhart et al., 2002). The function of
more than 80% of the Arabidopsis CYP genes is unknown.
Limited information is available on the expression of CYP genes, except for a few genes with a
characterized function (Bell-Lelong et al., 1997; Mizutani et al., 1997; Kubigsteltig et al., 1999;
Mathur et al., 1998; Mikkelsen et al., 2003; Nair et al., 2002). Several CYPs were transcriptionally
activated with dual developmental and stress responsive control (for review: Werck-Reichhart et al., 2002). The first attempt at a more systematic analysis of CYP expression in Arabidopsis using
microarray technology was recently reported (Xu et al., 2001). This analysis highlighted the problems
caused by the use of non-gene-specific probes that was to be circumvented in our analysis.
UGTs transfer carbohydrate residues onto small organic compounds to regulate their activity, toxicity
or amenability to transport. Many of these compounds such as phytoalexins, cell wall precursors and
36

plant hormones are important for plant defense, cellular homeostasis and signaling. UGTs constitute a
large gene family of 120 members including eight putative pseudogenes annotated in A. thaliana Columbia (Paquette et al., 2003). They are defined via a conserved amino acid domain in the C-
terminal region. Based on a phylogenetic alignment 14 A. thaliana UGT groups A to N were
compiled (Jones and Vogt, 2001; Li et al., 2001). There is only very limited information on the
function of individual UGTs. A systematic analysis of the substrate properties using recombinantly
expressed proteins has been initiated. In vitro, Group E and L UGTs were shown to glucosylate
indole-3-acetic or salicylic acid as well as hydroxycinnamate derivatives (Jackson et al., 2001; Lim etal., 2001, 2002; Milkowski et al., 2000). UGTs may display a reduced substrate specificity and rather
be regioselective accepting certain chemical substructures (Jones and Vogt, 2001). Importantly,
interfering side-activities towards xenobiotic substrates have been described for recombinant
Arabidopsis group E and L enzymes (Messner et al., 2003). The function of several UGTs in
flavonoid glycosylation has been studied in other plant species (for review: Jones and Vogt, 2001).
Information on the expression patterns or transcriptional regulation of Arabidopsis UGTs is almost
completely lacking. Indole-3-acetic acid glucosyltransferase AtUGT84B1 was found to be
preferentially expressed in apical regions, whereas AtUGT73B5 was induced during superoxide-
dependent cell death (Jackson et al., 2001, 2002; Mazel and Levine, 2002).
Similarly to UGTs, GSTs have been implicated in the detoxification of endogenous and xenobiotic
compounds and in plant secondary metabolism (Edwards et al., 2000; Marrs, 1996). GSTs are a
family of multifunctional, dimeric enzymes that catalyze the conjugation of the tripeptide glutathione
to a large variety of lipophilic compounds with electrophilic centers. Plant GSTs are encoded by large
and diverse gene families. The 47 Arabidopsis GSTs are divided on the basis of sequence similarity
into the phi, tau, theta and zeta classes (Dixon et al., 2002; Edwards et al., 2000; McGonigle et al., 2000; Wagner et al., 2002). A fifth class of GST-like genes (lambda), which does not possess
glutathione transferase activity (Dixon et al., 2002), was not included in this study. Considering the
high number of plant specific phi and tau GSTs, relatively little is known about their roles in the
metabolism of plants. Some members have demonstrated roles in herbicide detoxification (Edwards
and Dixon, 2000; Marrs, 1996). Phi and tau GSTs catalyze the glutathione-tagging of secondary
metabolites including phytoalexins and isothiocyanates, function as glutathione peroxidases and have
non-catalytic roles as flavonoid-binding proteins (Dixon et al., 2002; Edwards et al., 2000). Some of
these GSTs appear to have roles as auxin- and cytokinin-binding proteins, as components of UV-
inducible cell signaling pathways (Loyall et al., 2000) or as potential regulators of apoptosis
(Kampranis et al., 2000; for review: Dixon et al., 2002). Theta and zeta GSTs have homologs in
animals and fungi. Zeta GSTs catalyze an important glutathione-dependent isomerization step in the
catabolism of tyrosine (Dixon et al., 2000). Theta GSTs may be mainly active as glutathione
peroxidases reducing organic hydroperoxides produced during oxidative stress (Dixon et al., 1999;
Edwards et al., 2000; Wagner et al., 2002). In agreement with their postulated function in stress
protection, the expression of several GSTs is enhanced upon exposure of plants to various stress
situations including exposure to ozone, hydrogen peroxide, signaling molecules, heavy metals, heat
shock, dehydration, wounding, senescence, biotic elicitors and microbial infection (for review: Marrs,
1996; Wagner et al., 2002).
Because of the important nature of glutathione-dependent reactions in plant stress responses a
complete set of additional glutathione-utilizing enzymes from Arabidopsis was included in this study:
eight glutathione peroxidases (AtGPX), six glyoxalases (AtGLX) and two glutathione reductases
(AtGR). GPXs catalyze the GSH-dependent reduction of hydrogen peroxide and organic
hydroperoxides. GPX expression is induced in many stress situations and GPXs are important to
protect cells against oxidative damage (Mullineaux et al., 1998; Roxas et al., 1997). The glyoxalase
37

system converts 2-oxoaldehydes into the corresponding 2-hydroxy acids via a glutathionated
intermediate. The process involves two consecutive reactions mediated by glyoxalase I (GLXI,
lactoylglutathione lyase) and glyoxalase II (GLXII, hydroxyacylglutathione hydrolase). The primary
substrate appears to be methylglyoxal, a cytotoxic compound mainly formed as a by-product of
glycolysis (Thornalley, 1990). GRs catalyze the conversion of oxidized to reduced glutathione using
NADPH as an electron donor and play a major role in maintaining the reduced to oxidized
glutathione balance (Noctor et al., 2002).
Finally, ABC transporters are involved in compartmentation of both endogenous metabolites and
catabolites and in detoxification of xenobiotic conjugates. They are characterized by the presence of
specific transmembrane and signature ATP-binding cassette domains. Arabidopsis harbors 105
predicted members, which is about twice the number found in the human genome (Martinoia et al., 2002). 54 members are full-size transporters containing two ATPase and two transmembrane domains
each. These include 15 MRPs (multidrug resistance related protein), 15 PDRs (pleiotropic drug
resistance protein) and 22 PGPs (P-glycoprotein). AtAOH1 (ABC1 homolog) and AtPMP(peroxisomal ABC transporter homolog) are distinct full-size members whereas there are 51
additional half-size ABC transporters. The nomenclature of MRP, PDR, and PGP transporters is
based on Martinoia et al. (2002); for AtAOH1 and half-size ABC transporters the classification by
Sánchez-Fernández et al. (2001) was used. A few members have been localized to different
membranes. AtMRP2 was inserted in the tonoplast, whereas PGP and PDR members were located to
the plasma membrane (for review: Davies and Coleman, 2000; Martinoia et al., 2002; Sánchez-
Fernández et al., 2001).
Studies with AtMRP1 to AtMRP4 (Tommasini et al., 1997; Sánchez-Fernández et al., 1998) showed
that transcript levels of AtMRP3 are highly increased after the addition of primisulfuron and three
other herbicides. Interestingly, AtMRP3 can also partially complement YCF1-deficient yeast for
cadmium tolerance (Tommasini et al., 1998), and is enhanced after cadmium exposure (Bovet et al., 2003). Furthermore, two stress-inducible PDR-type ABC transporters from Nicotiana species were
identified. NtPDR1 was induced by elicitors as well as methyl jasmonate but not by ABA and
salicylic acid (Sasabe et al., 2002). Expression of NpABC1 was enhanced by plant-derived fungicides
that may be excreted by this transporter to attack a fungal invador (Jasinski et al., 2001). SpTUR2,
another PDR-like transporter of Spirodela polyrrhiza was highly induced by ABA and low
temperature (Smart and Fleming, 1996). Thus, these few biochemical and expression studies support
the idea that ABC transporters might be involved in plant defense.
The present study was to initiate the joint functional analyses of these gene families aiming at
identifying differential recruitment of individual members and groups of co-regulated genes in
response to abiotic and biotic stressors. These included herbicides belonging to two different classes,
UV-B irradiation, the endogenous stress hormones salicylic acid, ethylene, and methyl jasmonate, as
well as infection with the avirulent bacterial pathogen Pseudomonas syringae pv. tomato DC3000
(avrRpt2). A DNA array, named MetArray, for parallel expression profiling of 265 members of these
gene families was established by designing gene-specific probes from their 3´-regions.
38

Results & Discussion
Gene families and generation of probes
Genes belonging to large families are often highly homologous, particularly within their coding
regions. Therefore, target sequences for hybridization to genes associated with secondary metabolism
were selected from their 3´-ends including untranslated regions. Probes were designed and checked
using a semi-automatic, web-based algorithm (Affenzeller et al., in preparation). Briefly, the
specificity of probes was first tested via BLAST analyses against the whole A. thaliana genome
sequence. In addition, FASTA sequence comparisons with all predicted A. thaliana ORFs of the
MIPS database including 500 nt extensions at both ends were performed. These analyses identified
any possible cross-hybridization with annotated genes. However, further analyses eliminated most of
these potential conflicts when considering the relative orientation of genes and experimental cDNA
sequences. Nevertheless, in a few cases it was not possible to exclude any cross-reactivity due to
densely packed genes in tail-to-tail orientation or to the high homology of the genes. In agreement
with Xu et al. (2001) probes exhibiting a homology of at most 70% over a stretch of 70 nt were
regarded as highly specific; a considerable cross-hybridization was indicated for probes with more
than 85% homology over 100 nt.
Genome-wide sets of gene-specific probes for 109 Arabidopsis UGTs including five putative
pseudogenes, all 47 GSTs, eight GPX, six GLX, and two GR were designed. In addition, two subsets
were chosen from Arabidopsis genes encoding CYP and ABC transporters. A group of 62 genes out
of 246 predicted CYP members was selected for this study. Genes were arbitrarily chosen to include
members fulfilling any of the following criteria: known function, high EST frequency, a sample of A
and non-A type CYP genes, and a sample of genes belonging to highly duplicated subfamilies.
Twenty-six out of 54 ABC transporters were randomly selected on the basis of known full-length
members at the beginning of this project. The set contained nine MRP-, eight PGP-, eight PDR-type
genes and the single ABC-1 homolog AtAOH1. Two different half ABC transporter genes were
arbitrarily chosen (AtTAP1, AtWBC3). The phylogenetic relationships of the gene families
represented on the MetArray are shown in Figure 1.
Information concerning all probe sequences, bioinformatic analyses and specificity can be accessed at
mips.gsf.de/proj/thal/primerDesign/index.html. The results are summarized in Suppl. Tab. 1; specific
comments regarding 35 out of 271 probes are highlighted to indicate a possible cross-reactivity. Since
these bioinformatic analyses pinpointed any potential conflict, e.g. the highly homologous pairs
AtGSTF2/ AtGSTF3 and AtGSTF6/ AtGSTF7, a targeted examination by an independent technique
can be specifically approached.
Organ distribution of transcripts
The MetArray was used to obtain comprehensive information about the organ-specific expression
patterns of these gene families in roots, rosette leaves, stems, inflorescences and immature siliques.
This knowledge will provide a framework for assessing the functions and possible redundancies of
these genes.
Ubiquitously and often highly expressed genes were detected among all gene families (Fig. 1a-g).
Most remarkable was the high and constitutive expression of most glyoxalases, glutathione reductases
and glutathione peroxidases as well as many glutathione transferases (Fig. 1c, d, e). Among the
39

glutathione peroxidases AtGPX1 and AtGPX3 showed the highest transcription in all organs, whereas
the closely related AtGPX6 could not be detected in any tissue (Fig. 1c). All glyoxalases except
AtGLX-II.1 were expressed at a high level in all organs (Fig. 1d). A few out of 47 Arabidopsis
glutathione transferases were highly and ubiquitously transcribed. This mostly pertained to members
from closely related subgroups, such as the tau GSTs AtGSTU5, AtGSTU13, AtGSTU19, AtGSTU20and the phi members AtGSTF2, AtGSTF8, AtGSTF9, and AtGSTF10. In contrast, transcripts of highly
related members were not detected or differentially expressed (Fig. 1b). Among the CYP, UGT and
ABC transporter genes only single members were constitutively expressed at a higher level, e.g.AtCYP73A5, AtCYP51A2, AtCYP81H1, AtCYP98A9, AtUGT72B1, AtUGT74C1, AtUGT80A2,
AtUGT83A1, AtUGT89B1, AtMRP11 or AtPDR8. These high and wide-spread expression patterns
might indicate constitutive functions. Nevertheless, it was interesting to note that a few of these genes
were further enhanced in response to different stimuli, e.g. AtGPX1, AtGPX3, AtGPX4, AtGR2,
AtGSTF2, AtGSTF10, AtGSTU19, AtUGT80A2, AtCYP71B28, AtCYP73A5, or AtPDR8 (see below;
Tab. 1, 2, 3).
Assuming that gene products within highly homologous subfamilies have at least related biochemical
functions, the expression analyses supported both potentially redundant functions by similar
expression patterns and diversity by organ-specific transcription. Highly related members of the large
UGT subgroup L (Ross et al., 2001; Fig. 1f: UGT74B1 – UGT84A4) showed widely overlapping
expression patterns, which could indicate redundant functions. However, using recombinant enzymes
many of these UGTs had been shown to exhibit differential substrate preferences (Jackson et al., 2001; Lim et al., 2001, 2002). Similarly, the overlapping expression patterns of AtGSTU16/
AtGSTU17/ AtGSTU18, of AtGPX1/ AtGPX3 or of AtGR1/ AtGR2 (Fig. 1b, c, e) would be in
agreement with redundant functions within the respective groups. However, they differed in their
stress responsiveness (see below). Several genes belonging to highly related branches displayed non-
redundant expression patterns per se, e.g. AtUGT71C, AtUGT76E, and AtUGT79B branches,
AtGSTF11/ AtGSTF12, theta AtGST and several tau AtGST subgroups, AtGPX2/ AtGPX7, or AtPDR1/
AtPDR6/ AtPDR7/ AtPDR8. Finally, at least a single member out of small UGT groups with at most
three members was ubiquitously expressed in all tissues, e.g. AtUGT78D1 (group F), AtUGT83A1 (I),
AtUGT86A2 (K), or AtUGT92A1 (M; groups according to Ross et al., 2001) (Fig. 1f).
CYP genes seemed to have a much stronger on/off control than most other genes (Fig. 1a). This
might reflect a tighter control of gene expression, possibly related to the higher substrate specificity
and their functions as rate limiting steps in many pathways. Among the other gene families studied
there were only a few examples that showed similar control. Restricted expression patterns were
observed for AtUGT71C1, AtUGT72E2, members of the AtUGT76B subgroup, several AtGSTUmembers, or AtPDR7 and AtPDR11 (Fig. 1).
These observations support the functional significance of the diversity provided by many subgroups
and individual members within these gene families and argue against true redundant functions. This
analysis greatly extended the knowledge on the organ-specific expression within these genes families.
In most cases previous information on the expression pattern of single genes was in agreement with
the array expression analysis. However, when comparing the array data with other existing
information it is important to bear in mind that developmental and environmental differences may
contribute to discrepancies. A technical difference could account for the observation that the array
expression levels in leaves tended to be lower. To exclude a dilution of the total RNA by ample
organellar rRNAs, RNA samples were quantified prior to hybridizations based on 25S/ 18S rRNA
fluorescence (Experimental procedures). Nevertheless, a considerable dilution of transcripts by high
40
amounts of photosynthetic gene mRNAs may still affect hybridization in a different way than RT-
PCR analyses.
In accordance with Northern and promoter-reporter analyses (Bell-Lelong et al., 1997; Mizutani etal., 1998) AtCYP73A5 was a highly expressed CYP gene showing highest levels in roots and stems.
This pattern is in agreement with its essential role as cinnamate 4-hydroxylase acting upstream in the
phenylpropanoid pathway in the biosynthesis of lignin, flavonoids and other phenolic compounds.
Another CYP gene showing high constitutive expression in most plant organs was AtCYP51A2. It
encodes 14_-demethylase having a housekeeping role in the biosynthesis of steroids. Interestingly,
AtUGT80A2, which glucosylates sterols in vitro (Warnecke et al., 1997), appeared to be co-expressed
as one of the highest and ubiquitously transcribed UGT genes. The prevalent expression and role of
AtCYP51A2 over that of the related AtCYP51A1 is in agreement with the observation that AtCYP51A2antisense plants were strongly compromised in their growth and development (Kushiro et al., 2001).
AtCYP79Bs and AtCYP83B1 coding for enzymes catalyzing different steps in the synthesis of
glucosinolates were co-ordinately expressed at their highest levels in roots. The expression profiles of
AtCYP83B1 and AtCYP76C1 were in complete agreement with that previously observed by RNA blot
analysis (Mizutani et al., 1998). High expression of AtCYP79B2 in roots was reported by Mikkelsen
et al. (2000), however, the MetArray did not detect the lower levels in other organs.
Knowledge of the organ-specific expression patterns of UGT and GST genes was almost completely
lacking. The expression of an indole-acetic acid glucosyltransferase AtUGT84B1 in siliques was in
agreement with RT-PCR analyses showing strong signals in siliques along with weak expression in
inflorescences and roots (Jackson et al., 2001). A more extended comparison was possible with
recently published RT-PCR analyses of the MRP and PDR subgroups of ABC transporters
(Kolukisaoglu et al., 2002; van den Brûle and Smart, 2002). In a qualitative manner, the MetArray
expression patterns matched most of the reported RT-PCR data. Variations in developmental stages
and growth conditions as well as technical differences (see above) may account for quantitative
discrepancies such as the high expression of AtMRP5 observed in immature siliques (Fig. 1g) in
contrast to Kolukisaoglu et al. (2002). It might reflect slight developmental shifts since AtMRP5-
promoter reporter plants indicated that AtMRP5 was highly upregulated during the early stage of
grain filling (Klein and Martinoia, unpublished).
Additional examples comparing array data and independent analyses are provided as supplementary
information (Suppl. Tab. 2).
Principal component analysis of transcriptional responses to chemical, biological and physicalchallenges
Gene families acting in secondary metabolism may be involved as effector genes in response to
diverse environmental cues. Therefore, the MetArray was used to monitor transcriptional changes in
response to a spectrum of abiotic and biotic stimuli and to elucidate both stress-specific responses and
overlapping crosstalks. The analyses were focused on the reaction of A. thaliana leaves 24 hours after
application of the stimuli. As chemical stressors two different classes of herbicides were chosen (Fig.
2). Bromoxynil [BXN], a photosystem II targeting herbicide and two different sulfonylurea
herbicides, primisulfuron [PRI] and prosulfuron [PRO], interfering with the biosynthesis of branched
amino acids were sprayed at sublethal doses. UV-B irradiation [UVB] was used as a physical stressor
41

provoking oxidative damage and defense reactions (Surplus et al., 1998). Infection by the avirulent
bacterial pathogen, Pseudomonas syringae pv. tomato DC3000 (avrRpt2) [PSavir] was included as a
biological stressor. Finally, plants were treated with the three plant stress hormones salicylic acid
[SA], ethylene [ETH] and methyl jasmonate [MeJA] (Dong, 1998; Kunkel and Brooks, 2002). Only
those genes were kept for further analyses, whose expression was detected in at least three treatments
or showed a greater than 2-fold change in at least one condition. This measure reduced the number of
genes from 265 to 134 (Suppl. Tab. 4). The complete set of data including replica experiments can be
accessed as supplementary data (Suppl. Tab. 5, 6).
To identify differences between and correlations among the transcriptional responses to the various
stimuli the data were subjected to a principal component analysis (PCA; Fig. 3). Transcriptional
reactions after treatment with the signal molecules MeJA and ETH gave one highly correlated group.
Responses to SA were associated with an independent group that included genes induced by the
avirulent P. syringae pv. tomato DC 3000 (avrRpt2) [PSavir]. Interestingly, this group also contained
genes responsive to two different sulfonylurea herbicides, primisulfuron and prosulfuron. The
response patterns established by treatment with another herbicide, bromoxynil or UV-B radiation
were different from both groups (Fig. 3). Although the correlation of UVB and bromoxynil was less
significant in the PCA, it could indicate the defense against oxidative damage, which is common to
both stressors. The UVB experiment, however, differed from all other treatments because it was
designed to analyze the long-term effects on plants grown in the presence of UV-B (Götz et al., in
preparation).
The separation of the ETH and MeJA response from the reaction to PSavir and SA was not surprising
per se. Several genetic analyses and gene expression studies revealed a mutually antagonistic nature
of the SA-dependent and jasmonate- or ethylene-dependent defense pathways but also substantial
overlap between these different signaling pathways (for review: Kunkel and Brooks, 2002). However,
it is important to emphasize that the correlations demonstrated here were based on a small, non-biased
set of effector gene families related to secondary metabolism lacking classical marker genes for these
pathways like pathogenesis-related proteins or components of signaling cascades (Dong, 1998;
Kunkel and Brooks, 2002). Thus, the enormous genetic diversity of secondary metabolism may
endow the plant with the ability to recruit differential consortia of effector genes in response to
various stimuli. Nevertheless, responses to different biotic and abiotic stimuli may also converge as
indicated by the co-induction of genes by several inputs (see below).
A subset of genes was extracted from the PCA that most significantly contributed to the
differentiation or association of stress responses (Fig. 4; Experimental procedures). Among these
genes two small subgroups were co-induced by several stimuli indicating their involvement in
comprehensive reactions. Both groups identify effector genes that are likely to be activated by
converging, yet differentiating defense pathways.
One group comprised genes that were not induced or even repressed by ethylene or methyl jasmonate
but activated by several other stimuli (Fig. 4; yellow group). This group contained several distinct
members of the CYP and UGT families as well as AtGLX-II.1, AtGSTF8, and AtGPX7. All genes
except the putative salicylate-glucosyltransferase AtUGT74F2 (Lim et al., 2002) encoded enzymes of
so far unknown biochemical or physiological functions. Another group combined genes that were
widely induced by sulfonylurea herbicides, pathogen inoculation and the three stress hormones SA,
MeJA and ETH. In contrast, no enhancement was found after BXN application and UV-B irradiation
(Fig. 4, blue group). In addition to AtCYP98A9, AtCYP72A8, AtGSTZ1, AtUGT86A1, and AtPDR8,
this group also contained AtCYP71B15, AtGSTF2, AtGSTF6, and AtGSTF7. The latter genes are
42

distinct members of subfamilies that were found to be associated with the yellow group. Therefore,
these expression patterns do indicate different functions fulfilled by homologous members in a
specific context instead of redundancy.
The induction of AtGSTF2 and of the homologous AtGSTF6 and ATGSTF7 by several stress signals
had been already described (Maleck et al., 2000: ERD11 = AtGSTF6, GST11 = AtGSTF7; Wagner etal., 2002). Parallel RT-PCR analyses revealed that both AtGSTF6 and AtGSTF7 were regulated in a
similar way whereas only AtGSTF2, but not the homologous AtGSTF3, was responsive to multiple
stimuli (Tab. 4). The biological functions of these GSTs and most other genes of this group are not
known. AtGSTZ1 encodes a maleylacetone isomerase catalyzing a key step in the catabolism of
tyrosine that was induced by MeJA and pathogens (Dixon et al., 2000; Wagner et al., 2002). The
activation in additional stress situations as demonstrated here could indicate its role in protein
degradation during plant stress response. AtCYP71B15 that also fell into this group encodes a step in
the biosynthesis of camalexin. Thus, elevation of this phytoalexin could be part of a general stress
response. The inclusion of AtCYP72A8 and AtCYP98A9 as well as of an ABC transporter AtPDR8within this group provided a first hint to their multiple involvements in plant stress responses.
Differential response to herbicides
As indicated by the PCA the responses to two sulfonylurea compounds, primisulfuron and
prosulfuron, were clearly distinct from the reaction to bromoxynil. A number of genes comprising
members of all families were specifically induced by either herbicide class (Tab. 1; Suppl. Tab. 5).
Several genes were induced by primisulfuron and prosulfuron but not responsive to bromoxynil. With
the exception of the specifically induced AtGSTU24, AtUGT74E2, AtUGT75B1, and AtUGT86A1(see
below), all other genes of this group were also responsive to other stressors. AtGR2 was activated by
sulfonylureas in contrast to its isoform AtGR1 that is also expressed in leaves (Tab. 1, Fig. 1).
Sulfonylureas enhanced the transcription of AtCYP71B15, involved in phytoalexin biosynthesis, and
AtCYP76C2 (Tab. 1). Both CYPs had been previously characterized as pathogen-inducible genes
(Godiard et al., 1998; Zhou et al., 1999). In addition to AtCYP81D8, AtUGT73C5, and AtUGT87A2,
which were not known to be stress-related, this group also contained the stress-responsive genes
AtGSTF2, AtGSTF6, AtGSTF7 and AtPDR8 (Tab. 1; Fig. 4). PDR-type ABC transporters might be
involved in defense and detoxification, which had been indicated for three homologous members
from other plant species (Jasinski et al., 2001; Sasabe et al., 2002; Smart and Fleming, 1996; van den
Brûle et al., 2002). Similarly, the known induction of the ABC transporter AtMRP3 by sulfonylureas
(Tommasini et al., 1997) was confirmed by this analysis.
Only three genes were identified that are specifically induced by bromoxynil in comparison to
sulfonylureas, the ABC transporter AtTAP1, the highly and ubiquitously expressed glutathione
peroxidase AtGPX3 and the glucosyltransferase AtUGT75D1. Neither AtGPX3 nor AtUGT75D1 were
responsive to treatment with the three stress hormones or pathogen infection (Suppl. Tab. 4).
Interestingly, recombinant AtUGT75D1 was shown to glucosylate the xenobiotic compound 2,4,5-
trichlorophenol (Messner et al., 2003). AtGPX3 could be specifically involved in antagonizing
oxidative damage that occurred as a result of inhibition of photosystem electron transport by BXN.
Distinct members of this family were up-regulated by PSavir in both SA-dependent (AtGPX7) and
SA-independent manners (AtGPX1, AtGPX4; Tab. 2, see below). No function has yet been assigned
to AtTAP1 that shares homology with a mammalian ATP-dependent peptide translocator involved in
antigen presentation (Sánchez-Fernández et al., 2001).
43
A single gene, AtUGT74F2, was found to be co-induced by both chemical classes of herbicides as
well as by pathogen treatment and SA application (Tab. 1, 2, 4; Fig. 4). Furthermore, its wound-
inducibility has been recently described by Cheong et al. (2002; gene AAB64024). In vitro studies
using recombinant enzymes showed that AtUGT74F2 is able to glucosylate SA by preferentially
forming its glucose ester (Lim et al., 2002). A highly related second enzyme, AtUGT74F1 that
specifically catalyzes the formation of SA-2-O-glucoside in vitro was neither induced by BXN nor
the sulfonylureas (Suppl. Tab. 5). Thus, a specific pathway glucosylating SA might be induced by
these herbicides. BXN is also an inhibitor of cinnamate 4-hydroxylase that may trigger the
accumulation of SA (Schalk et al., 1997; Schoch et al., 2002). Thereby, the induction of AtUGT74F2could be part of an SA detoxification mechanism.
Genes directly involved in the detoxification of these xenobiotic compounds may be included among
the induced transcripts. In particular, transferases genes that are not responsive to other treatments
may be candidates. These include AtGSTU24, AtUGT74E2, AtUGT75B1 and AtUGT86A1 (Tab. 1;
Suppl. Tab. 4). The role of the induced UGT genes deserves further investigation because
glucosylation is known to be involved in the detoxification of both herbicide classes (Schaller et al., 1992; Klein et al., 1996; Kreuz and Martinoia, 1999). Recombinantly expressed AtUGT75B1
catalyzed the glucosylation of benzoic acid and hydroxy derivatives thereof (Lim et al., 2002).
Finally, this analysis defined two groups of genes that are suitable to distinguish the response to
sulfonylurea compounds and bromoxynil. Individual effector genes were associated with reactions of
the plant towards different classes of exogenous chemicals.
Differential responses to plant stress hormones and bacterial infection
Inoculation by the avirulent pathogen Pseudomonas syringae pv. tomato DC3000 (avrRpt2) induces
SA-dependent gene expression in A. thaliana (Maleck et al., 2000). PCA showed that this correlation
was also reflected at the level of effector gene families related to plant secondary metabolism. It was
clearly distinct from the reaction to ETH and MeJA (Fig. 3). The latter hormones are known to
activate overlapping signaling pathways (Kunkel and Brooks, 2002; Penninckx et al., 1998; Xu et al., 1994).
The transcriptional changes of several genes were responsible for these correlations. The ABC
transporter AtMRP3, the putative salicylic acid glucosyltransferase AtUGT74F2, and two genes with
unknown roles, AtCYP71B28 and AtGPX7, were activated by PSavir and SA in contrast to ETH and
MeJA, which could even repress the expression of the two latter genes (Tab. 2). On the other hand,
the expression of three genes with unknown functions, AtUGT71C3, AtUGT85A5 and AtAOH1 was
altered by ETH and MeJA but non-responsive to SA or pathogen infection (Tab. 2).
However, a number of these effector genes exhibited other co-induction patterns. This provided
further evidence for alternative crosstalks among defense signaling pathways (for review: Kunkel and
Brooks, 2002) and identified specific effector genes as targets. First, AtCYP71B15, AtGSTF2,
AtGSTF6, and AtGSTF7, which had been already identified as comprehensively induced effector
genes, were coordinately enhanced (Tab. 2; Fig. 4). Second, the Pseudomonas-responsive
AtCYP72A8, AtGSTZ1 and AtGSTF10 were co-induced by either ETH or MeJA but not by SA (Tab.
2). Schenk et al. (2000) had previously described similar correlations among the different signaling
pathways mostly based on known stress-responsive and signaling components. In contrast, the
transcriptome of effector genes also reflected such responses and crosstalks in this study.
44
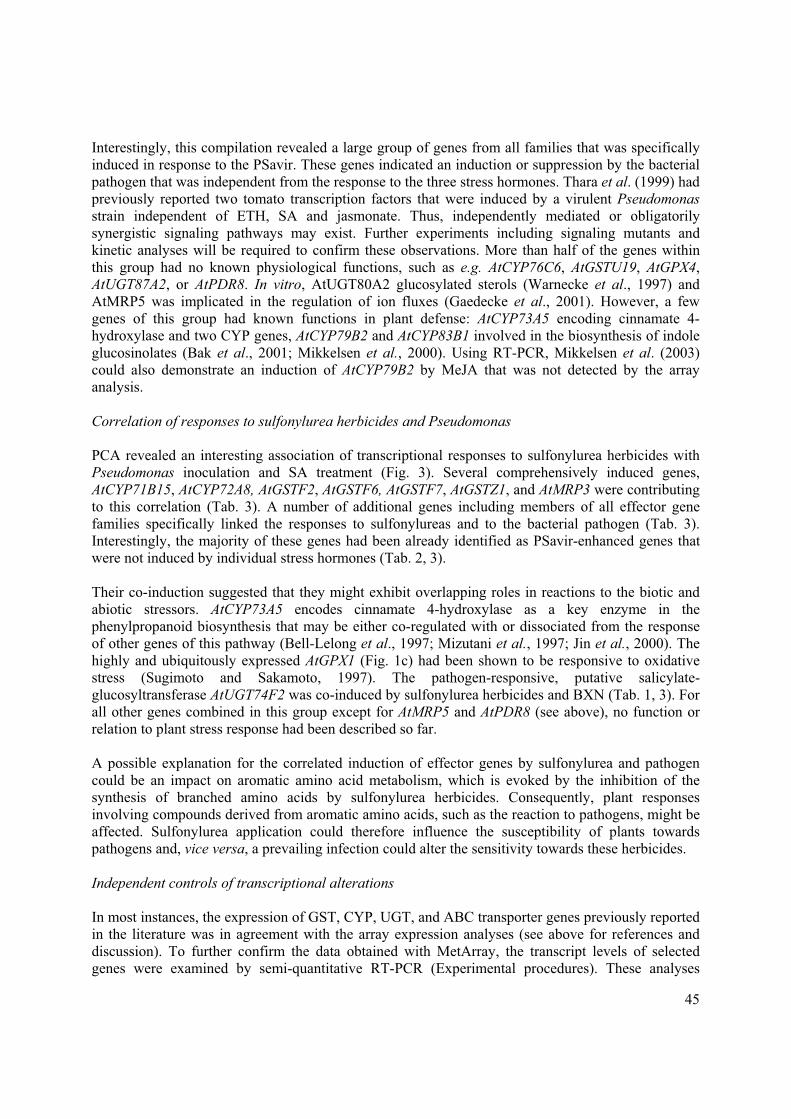
Interestingly, this compilation revealed a large group of genes from all families that was specifically
induced in response to the PSavir. These genes indicated an induction or suppression by the bacterial
pathogen that was independent from the response to the three stress hormones. Thara et al. (1999) had
previously reported two tomato transcription factors that were induced by a virulent Pseudomonasstrain independent of ETH, SA and jasmonate. Thus, independently mediated or obligatorily
synergistic signaling pathways may exist. Further experiments including signaling mutants and
kinetic analyses will be required to confirm these observations. More than half of the genes within
this group had no known physiological functions, such as e.g. AtCYP76C6, AtGSTU19, AtGPX4,
AtUGT87A2, or AtPDR8. In vitro, AtUGT80A2 glucosylated sterols (Warnecke et al., 1997) and
AtMRP5 was implicated in the regulation of ion fluxes (Gaedecke et al., 2001). However, a few
genes of this group had known functions in plant defense: AtCYP73A5 encoding cinnamate 4-
hydroxylase and two CYP genes, AtCYP79B2 and AtCYP83B1 involved in the biosynthesis of indole
glucosinolates (Bak et al., 2001; Mikkelsen et al., 2000). Using RT-PCR, Mikkelsen et al. (2003)
could also demonstrate an induction of AtCYP79B2 by MeJA that was not detected by the array
analysis.
Correlation of responses to sulfonylurea herbicides and Pseudomonas
PCA revealed an interesting association of transcriptional responses to sulfonylurea herbicides with
Pseudomonas inoculation and SA treatment (Fig. 3). Several comprehensively induced genes,
AtCYP71B15, AtCYP72A8, AtGSTF2, AtGSTF6, AtGSTF7, AtGSTZ1, and AtMRP3 were contributing
to this correlation (Tab. 3). A number of additional genes including members of all effector gene
families specifically linked the responses to sulfonylureas and to the bacterial pathogen (Tab. 3).
Interestingly, the majority of these genes had been already identified as PSavir-enhanced genes that
were not induced by individual stress hormones (Tab. 2, 3).
Their co-induction suggested that they might exhibit overlapping roles in reactions to the biotic and
abiotic stressors. AtCYP73A5 encodes cinnamate 4-hydroxylase as a key enzyme in the
phenylpropanoid biosynthesis that may be either co-regulated with or dissociated from the response
of other genes of this pathway (Bell-Lelong et al., 1997; Mizutani et al., 1997; Jin et al., 2000). The
highly and ubiquitously expressed AtGPX1 (Fig. 1c) had been shown to be responsive to oxidative
stress (Sugimoto and Sakamoto, 1997). The pathogen-responsive, putative salicylate-
glucosyltransferase AtUGT74F2 was co-induced by sulfonylurea herbicides and BXN (Tab. 1, 3). For
all other genes combined in this group except for AtMRP5 and AtPDR8 (see above), no function or
relation to plant stress response had been described so far.
A possible explanation for the correlated induction of effector genes by sulfonylurea and pathogen
could be an impact on aromatic amino acid metabolism, which is evoked by the inhibition of the
synthesis of branched amino acids by sulfonylurea herbicides. Consequently, plant responses
involving compounds derived from aromatic amino acids, such as the reaction to pathogens, might be
affected. Sulfonylurea application could therefore influence the susceptibility of plants towards
pathogens and, vice versa, a prevailing infection could alter the sensitivity towards these herbicides.
Independent controls of transcriptional alterations
In most instances, the expression of GST, CYP, UGT, and ABC transporter genes previously reported
in the literature was in agreement with the array expression analyses (see above for references and
discussion). To further confirm the data obtained with MetArray, the transcript levels of selected
genes were examined by semi-quantitative RT-PCR (Experimental procedures). These analyses
45
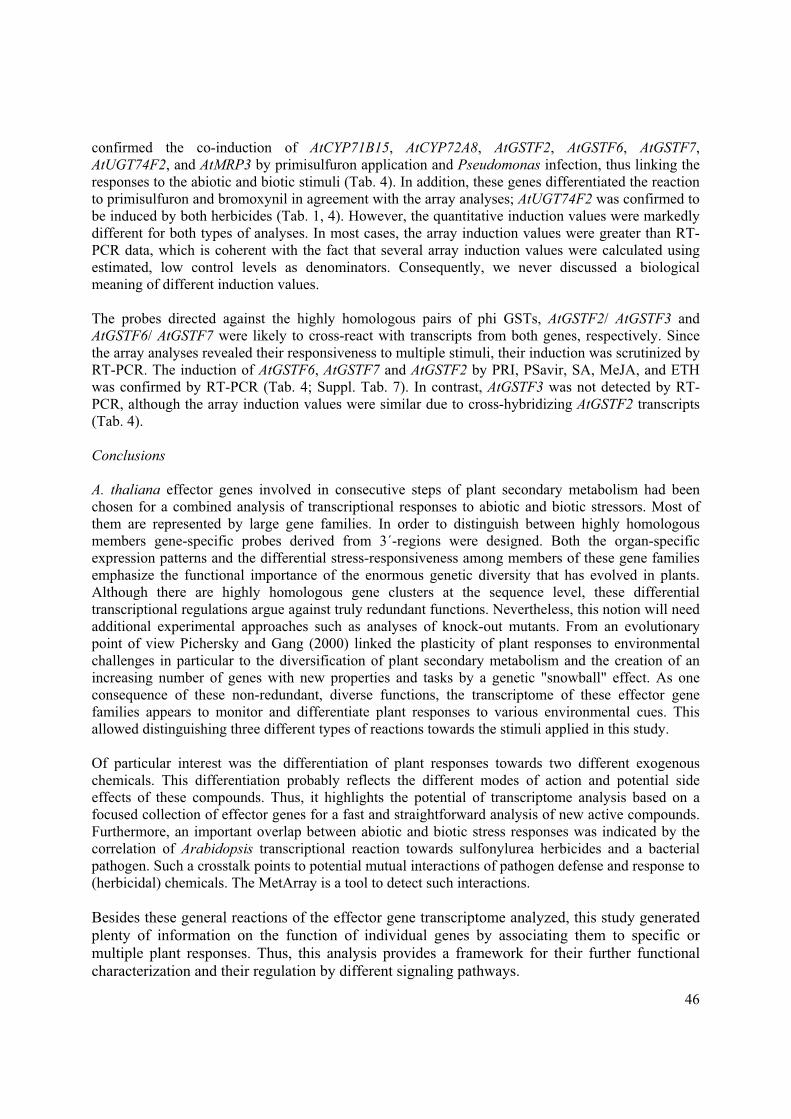
confirmed the co-induction of AtCYP71B15, AtCYP72A8, AtGSTF2, AtGSTF6, AtGSTF7,
AtUGT74F2, and AtMRP3 by primisulfuron application and Pseudomonas infection, thus linking the
responses to the abiotic and biotic stimuli (Tab. 4). In addition, these genes differentiated the reaction
to primisulfuron and bromoxynil in agreement with the array analyses; AtUGT74F2 was confirmed to
be induced by both herbicides (Tab. 1, 4). However, the quantitative induction values were markedly
different for both types of analyses. In most cases, the array induction values were greater than RT-
PCR data, which is coherent with the fact that several array induction values were calculated using
estimated, low control levels as denominators. Consequently, we never discussed a biological
meaning of different induction values.
The probes directed against the highly homologous pairs of phi GSTs, AtGSTF2/ AtGSTF3 and
AtGSTF6/ AtGSTF7 were likely to cross-react with transcripts from both genes, respectively. Since
the array analyses revealed their responsiveness to multiple stimuli, their induction was scrutinized by
RT-PCR. The induction of AtGSTF6, AtGSTF7 and AtGSTF2 by PRI, PSavir, SA, MeJA, and ETH
was confirmed by RT-PCR (Tab. 4; Suppl. Tab. 7). In contrast, AtGSTF3 was not detected by RT-
PCR, although the array induction values were similar due to cross-hybridizing AtGSTF2 transcripts
(Tab. 4).
Conclusions
A. thaliana effector genes involved in consecutive steps of plant secondary metabolism had been
chosen for a combined analysis of transcriptional responses to abiotic and biotic stressors. Most of
them are represented by large gene families. In order to distinguish between highly homologous
members gene-specific probes derived from 3´-regions were designed. Both the organ-specific
expression patterns and the differential stress-responsiveness among members of these gene families
emphasize the functional importance of the enormous genetic diversity that has evolved in plants.
Although there are highly homologous gene clusters at the sequence level, these differential
transcriptional regulations argue against truly redundant functions. Nevertheless, this notion will need
additional experimental approaches such as analyses of knock-out mutants. From an evolutionary
point of view Pichersky and Gang (2000) linked the plasticity of plant responses to environmental
challenges in particular to the diversification of plant secondary metabolism and the creation of an
increasing number of genes with new properties and tasks by a genetic "snowball" effect. As one
consequence of these non-redundant, diverse functions, the transcriptome of these effector gene
families appears to monitor and differentiate plant responses to various environmental cues. This
allowed distinguishing three different types of reactions towards the stimuli applied in this study.
Of particular interest was the differentiation of plant responses towards two different exogenous
chemicals. This differentiation probably reflects the different modes of action and potential side
effects of these compounds. Thus, it highlights the potential of transcriptome analysis based on a
focused collection of effector genes for a fast and straightforward analysis of new active compounds.
Furthermore, an important overlap between abiotic and biotic stress responses was indicated by the
correlation of Arabidopsis transcriptional reaction towards sulfonylurea herbicides and a bacterial
pathogen. Such a crosstalk points to potential mutual interactions of pathogen defense and response to
(herbicidal) chemicals. The MetArray is a tool to detect such interactions.
Besides these general reactions of the effector gene transcriptome analyzed, this study generated
plenty of information on the function of individual genes by associating them to specific or
multiple plant responses. Thus, this analysis provides a framework for their further functional
characterization and their regulation by different signaling pathways.
46

Experimental procedures
Plant growth conditions and treatments Arabidopsis thaliana Col-0 were raised on soil with about ten plants per 5x5 cm2 pot using 16 h light
periods at 23 _ 2°C. For pathogen infections plants were grown at lower density under short day light
conditions to obtain larger leaves. Leaves of control experiments and treatments were harvested in
parallel to exclude any diurnal effects. All treatments were done at the rosette stage 2 - 3 h after the
onset of the light-period and lasted 24 h except the UV-B irradiation experiment. Biologically
independent experiments were repeated three times or four times in two separate settings [UV-B]
(Suppl. Tab. 5, 6). The UV-B experiment was conducted as a long term exposure in a sun simulator.
After a precultivation period of five days, plants were exposed 19 days using a 14 h light period (PAR
1030 μmol m-2 s-1) supplemented with 10 h UV-B irradiation at 120 mW m-2 (biologically effective
weighting the spectrum according to Caldwell, 1971 and normalization at 300 nm). Control plants
were grown under glass filters, which cut off UV-B radiation (Ibdah et al., 2002). For herbicide
treatments three week-old Arabidopsis plants were sprayed with 750 μg m-2 primisulfuron-methyl, 1.5
mg m-2 prosulfuron, and 1.5 mg m-2 bromoxynil octanoate. The herbicide stock solutions had been
diluted 1 : 1000 with 0.05% (w/v) Silwet L-77 (Lehle Seeds, TX, USA) and sonified to get an even
aqueous suspension. Control plants were treated in the same way with 0.05% Silwet. There were no
visible damages at the harvest. For bacterial infections half the surface of 5 leaves from 5 week old
Arabidopsis plants were syringe-infiltrated with P. syringae pv. tomato DC3000 (avrRpt2) at a titre of
5.5 x 10⁵ colony forming units ml-1 in water. Whole leaves of inoculated and water inoculated control
plants were harvested after 24 h. Treatments with salicylic acid, methyl jasmonate and ethylene were
done as described in Wagner et al. (2002).
For analysis of organ-specific expression patterns plants were grown hydroponically (Gibeaut et al., 1997) with the addition of 0.5 g l-1 2-[N-morpholino]ethanesulfonic acid, pH adjusted to 5.4 with
phosphoric acid. Leaves and roots were harvested after 3 weeks, flowers and stems after 5 weeks,
immature siliques after 6 weeks.
Nucleic acids
Total RNA was isolated according to the method described by Chang et al. (1993; primisulfuron,
bromoxynil treatments/ organ expression/ UV-B), by Zimmerli et al. (2000; pathogen infection/
signal molecules), or by Reymond et al. (2000; prosulfuron treatment). All procedures included a
LiCl precipitation step. After spectrophotometric analyses the amounts of RNA were equalized
according to the ethidium bromide fluorescence encompassing the region of 25S to 18S rRNA bands
after gel electrophoresis.
Gene-specific probes were designed and analyzed using ProbeDesign algorithm (Affenzeller et al., in
preparation). Detailed information is accessible at mips.gsf.de/proj/thal/primerDesign/index.html
(Suppl. Tab. 1). Probes were PCR-amplified from genomic DNA and cloned into pGEM-Teasy
vector (Promega, Madison, USA).
Array production, hybridization and data acquisition
Specific DNA probes were amplified using flanking vector DNA sequences (Suppl. Tab. 8). PCR
products were concentrated using Multiscreen plates (Millipore, Bedford, MA, USA), resuspended in
47

water, and spotted in duplicate onto Hybond-N+ nylon membranes (Pharmacia, Freiburg, Germany)
using the MicroGrid robot (400 μm pins; BioRobotics, Cambridge, UK). After spotting the filters
were crosslinked (UV-Stratalinker 240, Stratagene, La Jolla, USA), denaturated and reference
hybridized with 5´-[33P]-labeled T7 oligonucleotide as described by Hauser et al. (1998).
For complex hybridizations total RNA was labeled by reverse transcription according to Hauser et al. (1998) using 30 μg RNA and 2.6 MBq of [_-33P]dATP (42.9 kBq pmol-1) or according to Ambion
Strip-EZ kit using 10 μg RNA (Ambion, Huntingdon, UK). DNA arrays were hybridized at 68oC in
5x SSC [750 mM NaCl, 75 mM trisodium citrate, pH 7], 5x Denhardt´s solution, 0.5% SDS, 100 μg
ml-1 denaturated salmon sperm DNA. After final washings at 0.2x SSC/ 0.1% SDS primary data were
acquired using a FLA-3000 image reader (Fuji, Düsseldorf, Germany) at a resolution of 50 μm and
ArrayVision software (Imaging Research Inc., Haverhill, UK). About 300 additional probes
encompassing other gene-specific probes and EST clones (Suppl. Tab. 9) were co-hybridized for
normalization based on total gene expression in each experiment (see below). All subsequent
statistical analyses such as PCA were solely based on the MetArray probe set.
Data evaluation
Primary data from each hybridization were processed and normalized using the Haruspex algorithm
(Thimm et al., 2001). The ratio of the expression values of corresponding pairs of treatment vs.control were calculated and then averaged using the replicas comprising three biologically
independent experiments. Ratios smaller than 0.5 and larger than 2.0 were regarded as significant
changes (Tab. 1, 2, 3). Signals from an hybridization that were lower than the twofold, local
background were regarded as not detectable. In order to approximate ratios of transcriptional
responses for these experiments those values were replaced by the lowest signal measured on that
filter. Thereby, changes could be approximated by division as above using these values. However,
ratios were labelled n.d. (not detectable), if transcripts were not detected in both control and
treatment. Any results, that showed contradicting changes in replicas, were eliminated and labeled
"exp" (Suppl.Tab. 4, 5, 6). If transcription was detected only in one replication, a mean value was
calculated using ratio 1.0 (no change) for the not detectable replicas unless the resulting mean values
would indicate a significant change. In the latter case, values were not taken into consideration and
labeled "o.o." (only once; Suppl.Tab.4, 5, 6). As long as all three replicas clearly indicated induction
albeit at very different levels, data were kept for further analysis and labeled “ind.” (for statistical
analysis replaced by 2.0 as a minimal induction level). Most of these higher variations included
induction ratios that were based on approximated, low control values as denominators. Accordingly,
the maximum induction values were generally limited to 16 (= 24) by assigning this value to all
inductions higher than 16 and, importantly, no emphasis was placed on the level of inductions per se.
For statistical analysis n.d., o.o., and exp. results were included as ratio 1.00 meaning no change; all
values were log-transformed to the basis 2.
For analysis of organ-specific expressions, individual sets of data were normalized as above. The
mean values, representing relative gene activities, were calculated from three biologically
independent experiments (Fig. 1; Suppl. Tab. 3). If no transcription above the twofold local
background was detected in a single experiment, zero (no detectable expression) was used for
calculation of the mean value.
48
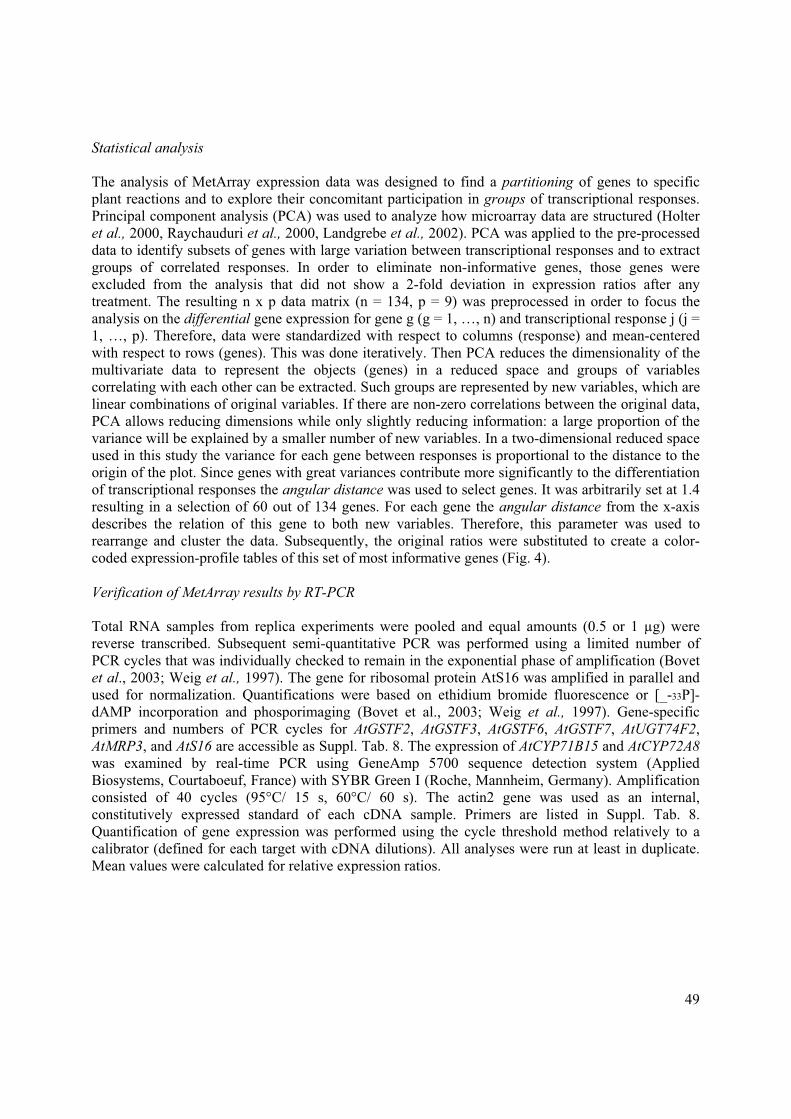
Statistical analysis
The analysis of MetArray expression data was designed to find a partitioning of genes to specific
plant reactions and to explore their concomitant participation in groups of transcriptional responses.
Principal component analysis (PCA) was used to analyze how microarray data are structured (Holter
et al., 2000, Raychauduri et al., 2000, Landgrebe et al., 2002). PCA was applied to the pre-processed
data to identify subsets of genes with large variation between transcriptional responses and to extract
groups of correlated responses. In order to eliminate non-informative genes, those genes were
excluded from the analysis that did not show a 2-fold deviation in expression ratios after any
treatment. The resulting n x p data matrix (n = 134, p = 9) was preprocessed in order to focus the
analysis on the differential gene expression for gene g (g = 1, …, n) and transcriptional response j (j =
1, …, p). Therefore, data were standardized with respect to columns (response) and mean-centered
with respect to rows (genes). This was done iteratively. Then PCA reduces the dimensionality of the
multivariate data to represent the objects (genes) in a reduced space and groups of variables
correlating with each other can be extracted. Such groups are represented by new variables, which are
linear combinations of original variables. If there are non-zero correlations between the original data,
PCA allows reducing dimensions while only slightly reducing information: a large proportion of the
variance will be explained by a smaller number of new variables. In a two-dimensional reduced space
used in this study the variance for each gene between responses is proportional to the distance to the
origin of the plot. Since genes with great variances contribute more significantly to the differentiation
of transcriptional responses the angular distance was used to select genes. It was arbitrarily set at 1.4
resulting in a selection of 60 out of 134 genes. For each gene the angular distance from the x-axis
describes the relation of this gene to both new variables. Therefore, this parameter was used to
rearrange and cluster the data. Subsequently, the original ratios were substituted to create a color-
coded expression-profile tables of this set of most informative genes (Fig. 4).
Verification of MetArray results by RT-PCR
Total RNA samples from replica experiments were pooled and equal amounts (0.5 or 1 μg) were
reverse transcribed. Subsequent semi-quantitative PCR was performed using a limited number of
PCR cycles that was individually checked to remain in the exponential phase of amplification (Bovet
et al., 2003; Weig et al., 1997). The gene for ribosomal protein AtS16 was amplified in parallel and
used for normalization. Quantifications were based on ethidium bromide fluorescence or [_-33P]-
dAMP incorporation and phosporimaging (Bovet et al., 2003; Weig et al., 1997). Gene-specific
primers and numbers of PCR cycles for AtGSTF2, AtGSTF3, AtGSTF6, AtGSTF7, AtUGT74F2,
AtMRP3, and AtS16 are accessible as Suppl. Tab. 8. The expression of AtCYP71B15 and AtCYP72A8was examined by real-time PCR using GeneAmp 5700 sequence detection system (Applied
Biosystems, Courtaboeuf, France) with SYBR Green I (Roche, Mannheim, Germany). Amplification
consisted of 40 cycles (95°C/ 15 s, 60°C/ 60 s). The actin2 gene was used as an internal,
constitutively expressed standard of each cDNA sample. Primers are listed in Suppl. Tab. 8.
Quantification of gene expression was performed using the cycle threshold method relatively to a
calibrator (defined for each target with cDNA dilutions). All analyses were run at least in duplicate.
Mean values were calculated for relative expression ratios.
49

Acknowledgements
We are indebted to Dr. Sebastian Kloska (Max-Planck-Institute of Molecular Plant Physiology,
Golm, Germany) for access to their array evaluation software Haruspex. Drs. Heidrun Gundlach and
Klaus Mayer at MIPS (GSF Research Center) kindly provided know-how and computing facilities for
the ProbeDesign algorithm. We also thank Drs. Dawn Little and Jörg Durner for critical reading. The
work was in part supported by Bayerisches Staatsministerium für Wissenschaft, Forschung und Kunst
(bayforuv) and the Swiss National Science Foundation (31-45682.95). Support of Aventis Agro to
A.H. is gratefully acknowledged.
50

References
Bak, S., Tax, F.E., Feldmann, K.A., Galbraith, D.W. and Feyereisen, R. (2001) CYP83B1, a
cytochrome P450 at the metabolic branch point in auxin and indole glucosinolate biosynthesis in
Arabidopsis. Plant Cell 13, 101-111
Batard Y., Schalk M., Pierrel M.A., Zimmerlin A., Durst F. and Werck-Reichhart D. (1997)
Regulation of the cinnamate 4-hydroxylase (CYP73A1) in Jerusalem artichoke tubers in
response to wounding and chemical treatments. Plant Physiol. 113, 951-959
Bell-Lelong, D. A., Cusumano, J. C., Meyer, K. and Chapple, C. (1997) Cinnamate-4-hydroxylase
expression in Arabidopsis. Regulation in response to development and the environment. PlantPhysiol. 113, 729-738
Bovet, L., Eggmann, T., Meylan-Bettex, M., Polier, J., Kammer, P., Marin, E., Feller, U. andMartinoia, E. (2003) Transcript levels of AtMRPs: induction of AtMRP3 after cadmium
treatments. Plant Cell Environ. 26, 371-381
Caldwell, M.M. (1971) Solar ultraviolet radiation and the growth and development of higher plants. In
Photophysiology, Vol. 6 (Giese, A.C., ed). New York: Academic Press, pp. 131-177
Chang, S., Puryear, J. and Cairney, J. (1993) A simple and efficient method for isolating RNA
from pine trees. Plant Mol. Biol. Rep. 11, 113-116
Chapple, C. (1998) Molecular genetics analysis of plant cytochrome P450-dependent
monooxygenases. Ann. Rev. Plant Physiol. Plant Mol. Biol. 49, 311-343
Cheong, Y.H., Chang, H.-S., Gupta, R., Wang, X., Zhu, T. and Luan, S. (2002) Transcriptional
profiling reveals novel interactions between wounding, pathogen, abiotic stress, and hormonal
responses in Arabidopsis. Plant Physiol. 129, 661-677
Coleman, J.O.D., Blake-Klaff, M.M.A. and Davies, T.G.E. (1997) Detoxification of xenobiotics by
plants: chemical modification and vacuolar compartmentation. Trends Plant Sci. 2, 144-151
Davies, T.G.E. and Coleman, J.O.D. (2000) The Arabidopsis thaliana ATP-binding cassette
proteins: an emerging superfamily. Plant Cell Environm. 23, 431-443
Dixon, D.P., Cole, D.J. and Edwards, R. (1999) Identification and cloning of AtGST10, members of
a novel type of plant glutathione transferases. Plant Physiol. 119, 1568
Dixon, D.P., Cole, D.J. and Edwards, R. (2000) Characterisation of a zeta class glutathione
transferase from Arabidopsis thaliana with a putative role in tyrosine catabolism. Arch.Biochem. Biophys. 384, 407-412
Dixon, D.P., Lapthorn, A. and Edwards, R. (2002) Plant glutathione transferases. Genome Biol. 3,
3004.1-3004.10
Dong, X. (1998) SA, JA, ethylene, and disease resistance in plants. Curr. Opin. Plant Biol. 1, 316-323
Edwards, R. and Dixon, D.P. (2000) The role of glutathione transferases in herbicide metabolism. In
Herbicides and their mechanism of action (Cobb, A.H. and Kirkwood, R.C., eds), Sheffield:
Sheffield Academic Press, pp. 33-71
Edwards, R., Dixon, D.P. and Walbot, V. (2000) Plant glutathione S-transferases: enzymes with
multiple functions in sickness and in health. Trends Plant Sci. 5, 193-198
Gaedeke, N., Klein, M., Kolukisaoglu, Ü., Forestier, C., Müller, A., Ansorge, M., Becker, D., Mamnun, Y., Kuchler, K., Schulz, B., Müller-Röber, B. and Martinoia, E. (2001) The
Arabidopsis thaliana ABC transporter AtMRP5 controls root development and stomata
movement. EMBO J. 20, 1875-1887
Gibeaut, D.M., Hulett, J., Cramer, G.R. and Seemann, J.R. (1997) Maximal biomass of
Arabidopsis thaliana using a simple, low-maintenance hydroponic method and favorable
environmental conditions. Plant Physiol. 115, 317-319
51

Godiard, L., Sauviac, L., Dalbin, N., Liaubet, L., Callard, D., Czernic, P. and Marco, Y. (1998)
CYP76C2, an Arabidopsis thaliana cytochrome P450 gene expressed during hypersensitive and
developmental cell death. FEBS Lett. 438, 245-249
Graham, S.E. and Peterson, J.A. (1999) How similar are P450s and what can their differences teach
us. Arch. Biochem. Biophys. 369, 24-29
Hauser, N.C., Vingron, M., Scheideler, M., Krems, B., Hellmuth, K., Entian, K.-D. and Hoheisel, J.D. (1998) Transcriptional profiling on all open reading frames of Saccharomycescerevisiae. Yeast 14, 1209-1221
Holter, N.S., Mitra, M., Maritan, A., Cieplak, M., Banavar, J.R. and Fedoroff, N.V. (2000)
Fundamental patterns underlying gene expression profiles: simplicity from complexity. Proc.Natl. Acad. Sci. USA 97, 8409-8414
Ibdah, M., Krins, A., Seidlitz, H.K., Heller, W., Strack, D. and Vogt, T. (2002) Spectral
dependence of flavonol and betacyanin accumulation in Mesembryanthemum crystallinumunder enhanced ultraviolet radiation. Plant Cell Environ. 25, 1145-1154
Jackson, R.G., Lim, E.-K., Li, Y., Kowalczyk, M., Sandberg, G., Hoggett, J., Ashford, D.A. andBowles, D.J. (2001) Identification and biochemical characterization of an Arabidopsis indole-
3-acetic acid glucosyltransferase. J. Biol. Chem. 276, 4350-4356
Jackson, R.G., Kowalczyk, M., Li Y., Higgins, G., Ross, J., Sandberg, G. and Bowles, D.J. (2002) Over-expression of an Arabidopsis gene encoding a glucosyltransferase of indole-3-
acetic acid: phenotypic characterisation of transgenic lines. Plant J. 32, 573-583
Jasinski, M., Stukkens, Y., Degand, H., Purnelle, B., Marchand-Brynaert, J. and Boutry, M.(2001) A plant plasma membrane ATP binding cassette-type transporter is involved in
antifungal terpenoid secretion. Plant Cell 13, 1095-1107
Jin, H., Cominelli, E., Bailey, P., Parr, A., Mehrtens, F., Jones, J., Tonelli, C., Weisshaar, B. andMartin, C. (2000) Transcriptional repression by AtMYB4 controls production of UV-
protecting sunscreens in Arabidopsis. EMBO J. 19, 6150-6161
Jones, P. and Vogt, T. (2001) Glycosyltransferases in secondary plant metabolism: tranquilizers and
stimulant controllers. Planta 213, 164-174
Kahn, R. and Durst, F. (2000) Function and evolution of plant cytochrome P450. Recent Adv. Phytochem. 34, 151-189
Kampranis, S.C., Damianova, R., Atallah, M., Toby, G., Kondi, G., Tsichlis, P.N. and Makris,A.M. (2000) A novel plant glutathione S-transferase/peroxidase suppresses Bax lethality in
yeast. J. Biol. Chem. 275, 29207-29216
Klein, M., Weissenbock, G., Dufaud, A., Gaillard, C., Kreuz, K. and Martinoia, E. (1996)
Different energization mechanisms drive the vacuolar uptake of a flavonoid glucoside and a
herbicide glucoside. J. Biol. Chem. 271, 29666-29671
Kolukisaoglu, Ü., Bovet, L., Klein, M., Eggmann, T., Geisler, M., Wanke, D., Martinoia, E. andSchulz, B. (2002) Family business: the multidrug-resistance related protein (MRP) ABC
transporter genes in Arabidopsis thaliana. Planta 216, 107-119
Kreuz, K., Tommasini, R. and Martinoia, E. (1996) Old Enzymes for a new Job. Plant Physiol. 111, 349-353
Kreuz, K. and Martinoia, E. (1999) Herbicide metabolism in plants: Integrated pathways of
detoxification. In: The Proceedings of the 9th International Congress on Pesticide Chemistry:
The Food-Environment Challenge. Brooks, G.T. and Roberts, T.R., eds., The Royal Society of
Chemistry, London, pp. 279-287
Kubigsteltig, I., Laudert, D. and Weiler, E.W. (1999) Structure and regulation of the Arabidopsisthaliana allene oxide synthase gene. Planta 208, 463-471
Kunkel, B.N. and Brooks, D.M. (2002) Cross talk between signalling pathways in pathogen defense.
Curr. Opin. Plant Biol. 5, 325-331
52
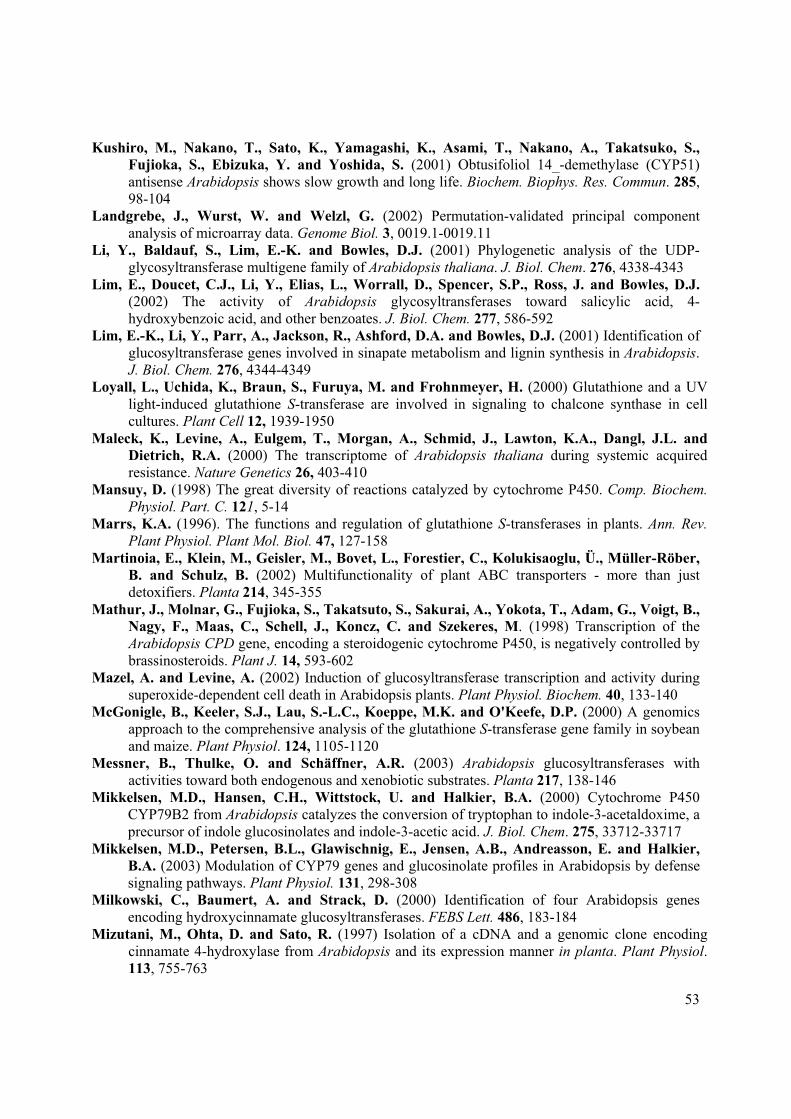
Kushiro, M., Nakano, T., Sato, K., Yamagashi, K., Asami, T., Nakano, A., Takatsuko, S.,Fujioka, S., Ebizuka, Y. and Yoshida, S. (2001) Obtusifoliol 14_-demethylase (CYP51)
antisense Arabidopsis shows slow growth and long life. Biochem. Biophys. Res. Commun. 285,
98-104
Landgrebe, J., Wurst, W. and Welzl, G. (2002) Permutation-validated principal component
analysis of microarray data. Genome Biol. 3, 0019.1-0019.11
Li, Y., Baldauf, S., Lim, E.-K. and Bowles, D.J. (2001) Phylogenetic analysis of the UDP-
glycosyltransferase multigene family of Arabidopsis thaliana. J. Biol. Chem. 276, 4338-4343
Lim, E., Doucet, C.J., Li, Y., Elias, L., Worrall, D., Spencer, S.P., Ross, J. and Bowles, D.J. (2002) The activity of Arabidopsis glycosyltransferases toward salicylic acid, 4-
hydroxybenzoic acid, and other benzoates. J. Biol. Chem. 277, 586-592
Lim, E.-K., Li, Y., Parr, A., Jackson, R., Ashford, D.A. and Bowles, D.J. (2001) Identification of
glucosyltransferase genes involved in sinapate metabolism and lignin synthesis in Arabidopsis.
J. Biol. Chem. 276, 4344-4349
Loyall, L., Uchida, K., Braun, S., Furuya, M. and Frohnmeyer, H. (2000) Glutathione and a UV
light-induced glutathione S-transferase are involved in signaling to chalcone synthase in cell
cultures. Plant Cell 12, 1939-1950
Maleck, K., Levine, A., Eulgem, T., Morgan, A., Schmid, J., Lawton, K.A., Dangl, J.L. andDietrich, R.A. (2000) The transcriptome of Arabidopsis thaliana during systemic acquired
resistance. Nature Genetics 26, 403-410
Mansuy, D. (1998) The great diversity of reactions catalyzed by cytochrome P450. Comp. Biochem.Physiol. Part. C. 121, 5-14
Marrs, K.A. (1996). The functions and regulation of glutathione S-transferases in plants. Ann. Rev. Plant Physiol. Plant Mol. Biol. 47, 127-158
Martinoia, E., Klein, M., Geisler, M., Bovet, L., Forestier, C., Kolukisaoglu, Ü., Müller-Röber,B. and Schulz, B. (2002) Multifunctionality of plant ABC transporters - more than just
detoxifiers. Planta 214, 345-355
Mathur, J., Molnar, G., Fujioka, S., Takatsuto, S., Sakurai, A., Yokota, T., Adam, G., Voigt, B.,Nagy, F., Maas, C., Schell, J., Koncz, C. and Szekeres, M. (1998) Transcription of the
Arabidopsis CPD gene, encoding a steroidogenic cytochrome P450, is negatively controlled by
brassinosteroids. Plant J. 14, 593-602
Mazel, A. and Levine, A. (2002) Induction of glucosyltransferase transcription and activity during
superoxide-dependent cell death in Arabidopsis plants. Plant Physiol. Biochem. 40, 133-140
McGonigle, B., Keeler, S.J., Lau, S.-L.C., Koeppe, M.K. and O'Keefe, D.P. (2000) A genomics
approach to the comprehensive analysis of the glutathione S-transferase gene family in soybean
and maize. Plant Physiol. 124, 1105-1120
Messner, B., Thulke, O. and Schäffner, A.R. (2003) Arabidopsis glucosyltransferases with
activities toward both endogenous and xenobiotic substrates. Planta 217, 138-146
Mikkelsen, M.D., Hansen, C.H., Wittstock, U. and Halkier, B.A. (2000) Cytochrome P450
CYP79B2 from Arabidopsis catalyzes the conversion of tryptophan to indole-3-acetaldoxime, a
precursor of indole glucosinolates and indole-3-acetic acid. J. Biol. Chem. 275, 33712-33717
Mikkelsen, M.D., Petersen, B.L., Glawischnig, E., Jensen, A.B., Andreasson, E. and Halkier,B.A. (2003) Modulation of CYP79 genes and glucosinolate profiles in Arabidopsis by defense
signaling pathways. Plant Physiol. 131, 298-308
Milkowski, C., Baumert, A. and Strack, D. (2000) Identification of four Arabidopsis genes
encoding hydroxycinnamate glucosyltransferases. FEBS Lett. 486, 183-184
Mizutani, M., Ohta, D. and Sato, R. (1997) Isolation of a cDNA and a genomic clone encoding
cinnamate 4-hydroxylase from Arabidopsis and its expression manner in planta. Plant Physiol. 113, 755-763
53

Mizutani, M., Ward, E. and Ohta, D. (1998) Cytochrome P450 superfamily in Arabidopsisthaliana: isolation of cDNAs, differential expression, and RFLP mapping of multiple
cytochromes P450. Plant Mol. Biol. 37, 39-52
Mullineaux, P.M., Karpinski, S., Jimenez, A., Cleary, S.P., Robinson, C. and Creissen, G.P. (1998) Identification of cDNAS encoding plastid-targeted glutathione peroxidase. Plant J. 13,
375-379
Nair, R.B., Xia, Q., Kartha, C.J., Kurylo, E., Hirji, R.N., Datla, R. and Selvaraj G. (2002)
Arabidopsis CYP98A3 mediating aromatic 3-hydroxylation. Developmental regulation of the
gene and expression in yeast. Plant Physiol. 130, 210-220
Noctor, G., Gomez, L., Vanacker, H. and Foyer, C.H. (2002) Interactions between biosynthesis,
compartmentation and transport in the control of glutathione homeostasis and signalling. J.Exp. Bot. 53, 1283-1304.
Page, R.D.M. (1996) TREEVIEW: An application to display phylogenetic trees on personal
computers. Comput. Appl. Biosci. 12, 357-358
Paquette, S. M., Bak, S. and Feyereisen, R. (2000) Intron-exon organization and phylogeny in a
large superfamily, the paralogous cytochrome P450 genes of Arabidopsis thaliana. DNA Cell Biol. 19, 307-317
Paquette, S. M., Møller, B.L. and Bak, S. (2003) On the origin of family 1 plant
glycosyltransferases. Phytochemistry 62, 399–413
Penninckx, I.A.M.A., Thomma, B.P.H.J., Buchala, A., Métraux, J.-P. and Broekaert, W.F.(1998) Concomitant activation of jasmonate and ethylene response pathways is required for
induction of a plant defensin gene in Arabidopsis. Plant Cell 10, 2103-2113
Pichersky, E. and Gang, D.R. (2000) Genetics and biochemistry of secondary metabolites in plants:
an evolutionary perspective. Trends Plant Sci. 5, 439-445
Raychaudhuri, S., Stuart, J. and Altman, R. (2000) Principal component analysis to summarize
microarray experiments: application to sporulation time series. In Pacific Symposium on Biocomputing, Vol. 5, pp. 455-466
Reymond, P., Weber, H., Damond, M. and Farmer, E. (2000) Differential gene expression in
response to mechanical wounding and insect feeding in Arabidopsis. Plant Cell 12, 707-720
Ross, J., Li, Y., Lim, E. and Bowles, D.J. (2001) Protein family review. Higher plant
glycosyltransferases. Genome Biol. 2, 3004.1–3004.6
Roxas, V.P., Smith, R.K., Allen, E.R. and Allen, R.D. (1997) Overexpression of glutathione S-
transferase/glutathione peroxidase enhances the growth of transgenic tobacco seedlings during
stress. Nature Biotechnology 15, 988-991
Sánchez-Fernández, R., Ardiles-Díaz, W., van Montagu, M., Inzé, D. and May, M.J. (1998)
Cloning and expression analyses of AtMRP4, a novel MRP-like gene from Arabidopsisthaliana. Mol. Gen. Genet. 258, 655-662
Sánchez-Fernández, R., Davies, T.G.E., Coleman, J.O.D. and Rea, P.A. (2001) The Arabidopsisthaliana ABC protein superfamily, a complete inventory. J. Biol. Chem. 276, 30231-30244
Sandermann, H.Jr. (1994) Higher plant metabolism of xenobiotics: the ´green liver´concept.
Pharmacogenetics 4, 225-241
Sasabe, M., Toyoda, K., Shiraishi, T., Inagaki, Y., Ichinose, Y. (2002) cDNA cloning and
characterization of tobacco ABC transporter: NtPDR1 is a novel elicitor-responsive gene. FEBSLett. 518, 164-168
Schalk, M., Pierrel, M.A., Zimmerlin, A., Batard, Y., Durst, F. and Werck-Reichhart, D. (1997)
Xenobiotics: substrates and inhibitors of the plant P450s. Env. Sci. Pollution Res. 4, 229-234
Schaller, B., Schneider, B. and Schütte, R.H. (1992) Metabolism of the herbicide bromoxynil in
Hordeum vulgare and Stellaria media. Z. Naturforsch. 47c, 126-131
54

Schenk, P.M., Kazan, K., Wilson, I., Anderson, J.P., Richmond, T., Somerville, S.C. andManners, J.M. (2000) Coordinated plant defense responses in Arabidopsis revealed by
microarray analysis. Proc. Natl. Acad. Sci. USA 97, 11655-11660
Schoch, G.A., Nikov, G.N., Alworth, W.L. and Werck-Reichhart, D. (2002) Chemical inactivation
of the cinnamate 4-hydroxylase allows for the accumulation of salicylic acid in elicited cells.
Plant Physiol. 130, 1022-1031
Schuler, M.A. and Werck-Reichhart, D. (2003) Functional genomics of P450s. Ann. Rev. Plant Phys. Plant Mol. Biol. in press.
Smart, C.C. and Fleming, A.J. (1996) Hormonal and environmental regulation of a plant PDR5-like
ABC transporter. J. Biol. Chem. 271, 19351-19357
Sugimoto, M. and Sakamoto, W. (1997) Putative phospholipid hydroperoxide glutathione
peroxidase gene from Arabidopsis thaliana induced by oxidative stress. Genes Genet. Syst. 72,311-316
Surplus, S.L., Jordan, B.R., Murphy, A.M., Carr, J.P., Thomas, B. and A.-H.-Mackerness, S. (1998) Ultraviolet-B-induced responses in Arabidopsis thaliana: role of salicylic acid and
reactive oxygen species in the regulation of transcripts encoding photosynthetic and acidic
pathogenesis-related proteins. Plant Cell Environ. 21, 685-694
Thara, V.K., Tang, X., Gu, Y.Q., Martin, G.B. and Zhou, J.M. (1999) Pseudomonas syringae pv
tomato induces the expression of tomato EREBP-like genes Pti4 and Pti5 independent of
ethylene, salicylate and jasmonate. Plant J. 20, 475-483
Thimm, O., Essigmann, B., Kloska, S., Altmann, T. and Buckhout, T.J. (2001) Response of
Arabidopsis to iron deficiency stress as revealed by microarray analysis. Plant Physiol. 127,
1030-1043
Thompson, J.D., Higgins, D.G. and Gibson, T.J. (1994) CLUSTAL W: improving the sensitivity of
progressive multiple sequence alignment through sequence weighting, position-specific gap
penalties and weight matrix choice. Nucleic Acids Res. 22, 4673-4680
Thornalley, P.J. (1990) The glyoxalase system: new developments towards functional
characterization of a metabolic pathway fundamental to biological life. Biochem J. 269, 1-11
Tommasini, R., Vogt, E., Fromentau, M., Hörtensteiner, S., Matile, P., Amrhein, N. and Martinoia, E. (1998) An ABC-transporter of Arabidopsis thaliana has both glutathione-
conjugate and chlorophyll catabolite transport activity. Plant J. 13, 773-780
Tommasini, R., Vogt, E., Schmid, J., Fromentau, M., Amrhein, N. and Martinoia, E. (1997)
Differential expression of genes coding for ABC transporters after treatment of Arabidopsisthaliana with xenobiotics. FEBS Lett. 411, 206-210
van den Brûle, S., Müller, A., Fleming, A.J. and Smart, C.C. (2002) The ABC transporter
SpTUR2 confers resistance to the antifungal diterpene sclareol. Plant J. 30, 649-662
van den Brûle, S. and Smart, C.C. (2002) The plant PDR family of ABC transporters. Planta 216,
95–106
Wagner, U., Edwards, R., Dixon, D.P. and Mauch, F. (2002) Probing the diversity of the
Arabidopsis glutathione S-transferase gene family. Plant Mol. Biol. 49, 515-532
Warnecke, D. C., Baltrusch, M., Buck, F., Wolter, F.P. and Heinz, E. (1997) UDP-glucose:sterol
glucosyltransferase: cloning and functional expression in Escherichia coli. Plant Mol. Biol. 35,
597-603
Weig, A., Deswarte, C. and Chrispeels, M.J. (1997) The major intrinsic protein family of
Arabidopsis has 23 members that form three distinct groups with functional aquaporins in each
group. Plant Physiol. 114, 1347-1357
Werck-Reichhart, D., Hehn, A. and Didierjean, L. (2000) Cytochromes P45O for engineering
herbicide tolerance. Trends Plant Sci. 5, 116-123
55

Werck-Reichhart, D. and Feyereisen, R. (2000) Cytochrome P450: a success story. Genome Biol. 1, 3003.1-3003.0
Werck-Reichhart, D., Bak, S. and Paquette, S. (2002) Cytochromes P450. In The Arabidopsis Book(Somerville, C.R. and Meyerowitz, E.M., eds). Rockville, MD: American Society of Plant
Biologists, Rockville, doi/10.1199/tab.0028 http://www.aspb.org/publications/arabidopsis/
Xu, W., Bak, S., Decker, A., Paquette, S.M., Feyereisen, R. and Galbraith, D.W. (2001)
Microarray-based analysis of gene expression in very large gene families: the cytochrome P450
gene superfamily of Arabidopsis thaliana. Gene 272, 61-74
Xu, Y., Chang, P.F.L., Liu, D., Narasimhan, M. L., Raghothama, K. G., Hasegawa, P.M. and Bressan, R.A. (1994) Plant defense genes are synergistically induced by ethylene and methyl
jasmonate. Plant Cell 6, 1077-1085
Zhou, N., Tootle, T.L., Glazebrook, J. (1999) Arabidopsis PAD3, a gene required for camalexin
biosynthesis encodes a putative cytochrome P450 monooxygenase. Plant Cell 11, 2419-2428
Zimmerli, L., Jakab, G., Metraux, J.-P. and Mauch-Mani, B. (2000) Potentiation of pathogen-
specific defense mechanisms in Arabidopsis by _-aminobutyric acid. Proc. Natl. Acad. Sci. USA 97, 12920-12925
56

Tables and figures
Table 1 Genes differentially responsive to sulfonylurea herbicides and bromoxynil in A.thaliana
leaves. Numbers indicate expression ratios after treatments vs. controls (Experimental procedures).
Significant inductions are displayed on white background, non-responsive situations are underlaid in
dark-grey, unclear results in grey.
Gene PRI24 PRO24 PRI36 BXN24
Responsive to sulfonylureaCYP71B15 16.0 ind. 16.0 0.69*
CYP81D8 5.2 7.8 9.1 1.2* GSTF61
GSTF716.0
5.2
11.2
16.0
2.4
2.2
0.74
0.67
UGT73C5 2.9 6.9 2.1 1.5 UGT74E2 12.5 7.4 4.1 n.d. UGT87A2 4.0 2.9 2.8 1.5 GR2 3.4 12.6 2.1 1.0 MRP3 10.2 16.0 7.0 0.51
CYP76C2 6.3 2.9 n.c. 1.3* GSTF2 6.6 ind. 1.7 0.59
GSTU24 3.7 9.8 n.d. n.d. UGT75B1 3.2 2.8 1.1 1.7 UGT86A1 3.9 2.1 n.d. n.d. PDR8 6.4 6.2 1.6 1.0*
Responsive to sulfonylurea and BXNUGT74F2 8.0 4.0 n.c. 4.3
Responsive to BXN
GPX3 0.65 0.54 1.13 2.5
UGT75D1 0.86 1.0 0.94 3.7
TAP1 1.4* n.d. n.c. 8.2
1 the highly homologous AtGSTF6/AtGSTF7 may cross-hybridize/ independent analyses showed that both genes are
responsive to sulfonylureas
* mean expression value includes replica where no expression was detected; n.d. not detected; n.c. not clear due to
conflicting data in replica hybridizations; ind. unambiguous induction but strong difference in replica experiments, see
Supplementary data and Experimental procedures.
57

Table 2 Genes responsive to ethylene, methyl jasmonate, salicylic acid and bacterial infection.
Numbers indicate expression ratios after treatments vs. controls (Experimental procedures).
Significant inductions are displayed on white background, non-responsive situations are underlaid in
dark-grey, reductions in black, and unclear results in grey.
1 probe may cross-hybridize with homologous
member, which showed similar reaction. 2 the highly homologous AtGSTF6/ AtGSTF7
may cross-hybridize.
* mean expression value includes replica where
no expression was detected; n.d. not detected;
n.c. not clear due to conflicting data in replica
hybridizations.
Gene ETH MeJA SA PSavir
Responsive to PSavir/ SA vs. ETH/ MeJACYP71B28 0.20 0.26 5.4 3.6
GPX7 0.88 0.40 3.1 7.0
MRP3 1.6 0.69 2.4 5.4
UGT71C3/C41 2.3 2.0 0.81 0.87*
UGT85A5 0.31 0.46 0.80 n.d.
AOH1 3.0 2.3 1.5 1.2*
Coordinate inductionCYP71B15 11.4 13.6 6.7 16.0
GSTF2 4.9 4.5 2.7 15.1
GSTF62
GSTF723.3
2.3
2.4
1.6
6.9
3.3
16.0
9.7
Responsive to PSavir and ETH/ MeJACYP72A8 4.9 1.7* 1.2* 4.2
GSTZ1 2.6 1.3 1.6 4.3
GSTF10 1.9 2.7 1.1 2.3
Responsive to PSavir, not to ETH, MeJA, SACYP73A5 1.1 0.88 1.5 2.9
CYP76C6/C41 0.58 0.85 1.6 4.3
CYP79B2 n.d. n.d. n.d. 16.0
CYP81D8 1.2 0.82 0.90 2.2
CYP83B1 1.5 1.9 1.5 2.4
GSTU16 1.6 0.55 1.3 3.5
GSTU19 1.8 1.1 1.3 9.2
GLX-II.3 1.1 0.92 0.73 4.6
GPX1 1.2 1.2 1.5 14.6
GPX4 1.4 0.91 1.4 3.9
UGT74F2 n.c. 1.6 1.9 4.2
UGT80A2 1.1 0.75 0.83 3.1
UGT85A1 1.6 0.82 0.78 8.1
UGT87A2 1.9 1.2 1.9 5.3
UGT88A1 1.3 0.58 1.7 0.49
UGT89B1 1.6 0.64 0.95 0.39
MRP5 n.d. n.d. n.d. 4.2
PDR8 1.3 1.5 1.4 8.7
TAP1 0.82* 0.75* 0.99* 2.1
58
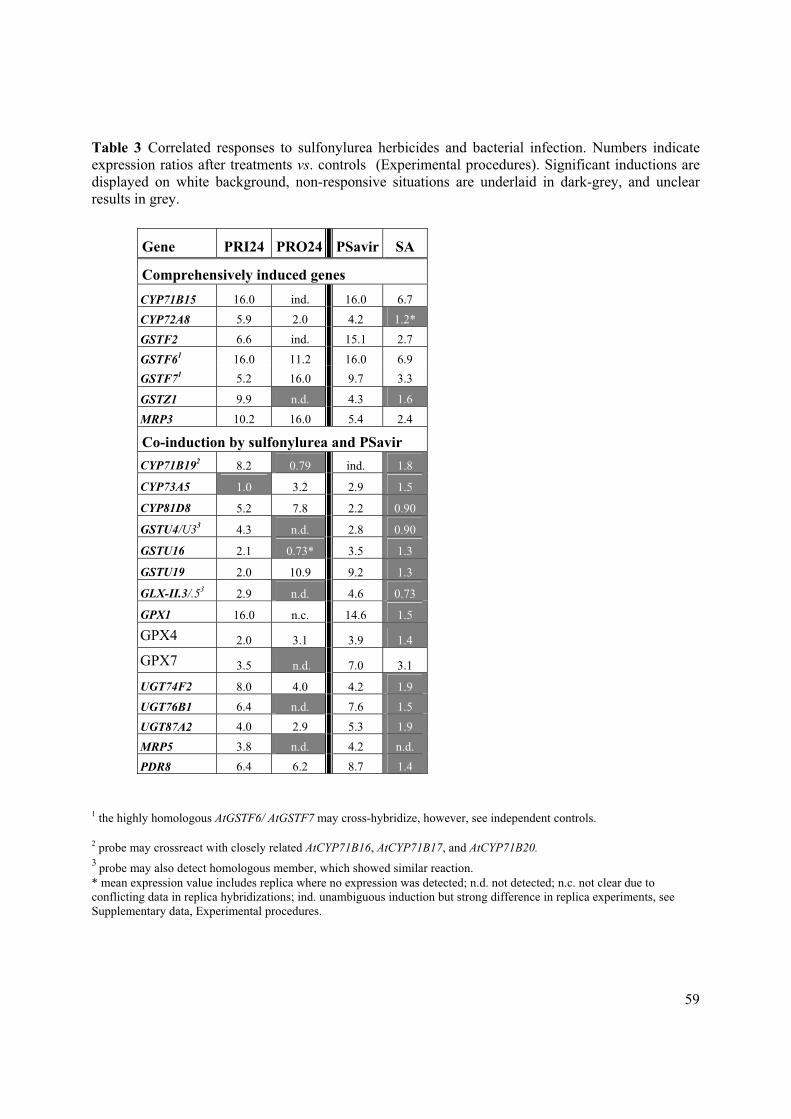
Table 3 Correlated responses to sulfonylurea herbicides and bacterial infection. Numbers indicate
expression ratios after treatments vs. controls (Experimental procedures). Significant inductions are
displayed on white background, non-responsive situations are underlaid in dark-grey, and unclear
results in grey.
Gene PRI24 PRO24 PSavir SA
Comprehensively induced genes CYP71B15 16.0 ind. 16.0 6.7
CYP72A8 5.9 2.0 4.2 1.2*
GSTF2 6.6 ind. 15.1 2.7
GSTF61
GSTF7116.0
5.2
11.2
16.0
16.0
9.7
6.9
3.3
GSTZ1 9.9 n.d. 4.3 1.6
MRP3 10.2 16.0 5.4 2.4
Co-induction by sulfonylurea and PSavirCYP71B192 8.2 0.79 ind. 1.8
CYP73A5 1.0 3.2 2.9 1.5
CYP81D8 5.2 7.8 2.2 0.90
GSTU4/U33 4.3 n.d. 2.8 0.90
GSTU16 2.1 0.73* 3.5 1.3
GSTU19 2.0 10.9 9.2 1.3
GLX-II.3/.532.9 n.d. 4.6 0.73
GPX1 16.0 n.c. 14.6 1.5
GPX4 2.0 3.1 3.9 1.4
GPX7 3.5 n.d. 7.0 3.1
UGT74F2 8.0 4.0 4.2 1.9
UGT76B1 6.4 n.d. 7.6 1.5
UGT87A2 4.0 2.9 5.3 1.9
MRP5 3.8 n.d. 4.2 n.d.
PDR8 6.4 6.2 8.7 1.4
1 the highly homologous AtGSTF6/ AtGSTF7 may cross-hybridize, however, see independent controls.
2probe may crossreact with closely related AtCYP71B16, AtCYP71B17, and AtCYP71B20.
3 probe may also detect homologous member, which showed similar reaction.
* mean expression value includes replica where no expression was detected; n.d. not detected; n.c. not clear due to
conflicting data in replica hybridizations; ind. unambiguous induction but strong difference in replica experiments, see
Supplementary data, Experimental procedures.
59

Figure legends
Fig. 1. Organ-specific transcription patterns. Expression in root (R), stem (ST), leaf (L), inflorescence
(I) and immature (green) silique (SI) tissue was examined for CYP (a) GST (b), GPX (c), GLX (d),
GR (e), UGT (f) and ABC transporter (g) gene families in A. thaliana. Normalized gene expression
values (Experimental procedures) were underlayed by grey scales to visualize differences, black and
white representing no detectable and highest expression levels, respectively. Due to size limitations
the phylogenetic distances in the trees were shortened where indicated by double slashes; see
Supplementary data for the correct distances based on ClustalW analyses.
Fig. 2. Herbicidal chemicals used for treatments. Herbicides were sprayed in sublethal doses onto
three-week-old Arabidopsis plants: primisulfuron (a), prosulfuron (b), bromoxynil octanoate (c).
Fig. 3. Principal component analysis. The statistical analysis was based on a subset of 134 genes,
which responded at least in one treatment with a 2-fold change in expression; the two components
reflect 41.3 % of the total variability of the data set (Experimental procedures).
Fig. 4. Expression patterns in response to herbicides, endogenous signal molecules, UV-B irradiation
and pathogen infection. The compilation is based on a principal component analysis. 60 out of 134
genes showing the highest variance in distingushing transcriptional responses are displayed
(Experimental procedures). Color coding of the original, log2-transformed expression ratios ranges
from intense red (larger than 2) to intense green (lower than -2), black meaning no change (ratio 0).
Numerical data and individual expression values are available as Supplementary data.
60

Fig. 1a-f
61
0.06 0.00 0.00 0.00 0.000.16 0.40 0.37 0.63 0.400.09 1.78 0.47 0.44 0.730.14 0.00 0.00 0.00 0.000.04 0.00 0.00 0.00 0.000.03 0.00 0.00 0.00 0.000.08 0.00 0.00 0.00 0.070.36 0.02 0.00 0.15 0.180.89 0.00 0.00 0.00 0.000.00 0.00 0.00 0.00 0.000.08 0.00 0.00 0.00 0.001.58 0.25 0.07 0.11 0.070.00 0.00 0.00 0.00 0.000.00 0.05 0.09 0.22 0.380.00 0.03 0.12 0.20 0.100.00 0.09 0.20 1.02 0.290.42 0.00 0.00 0.00 0.000.130.160.15 0.04 0.060.090.07 0.05 0.04 0.05
0.02 0.020.05 0.07 0.15 0.46 0.220.07 0.020.020.143.14 0.23 0.58 0.65 0.341.74 0.48 0.40 0.15 0.210.84 0.28 0.26 0.170.38 0.11 0.14 0.21 0.890.59 0.14 0.16 0.08 0.490.25 0.090.026.88 0.66 0.34 0.45 0.371.73 1.91 0.86 0.83 0.600.41 0.310.02 0.10 0.400.060.46 0.28 0.17 0.43 0.590.02 0.030.34 0.17 0.22
b
0.62 0.07 0.06 0.22 0.272.66 1.49 1.18 2.42 5.610.41 1.22 1.75 0.86 1.46
0.040.81 0.20 0.15 0.22 0.330.87 0.83 0.40 1.13 1.430.07
c
0.65 0.16 0.05 0.23 0.270.11 0.17 0.03 0.22 0.200.50 0.18 0.20 0.500.94 0.49 0.24 0.86 0.861.06 0.50 0.29 0.67 0.951.83 0.65 0.12 0.54 0.90
d
7.09 4.20 1.40 2.690.51 0.42 0.23 0.77 2.010.33 0.73 0.74 0.47 2.38
1.27 0.45 1.01 1.220.44 0.34 0.69 0.55
0.27
0.04
0.76 0.92
0.58 0.610.39
0.12
0.67
0.22 0.23 0.29 0.17 0.310.06
0.06 0.07
1.391.12 0.070.98 1.31 0.93 2.02 2.290.18 0.10 2.66 0.220.24 0.00
0.00 0.110.00
0.07 0.10
0.08
0.180.670.16
0.13 0.540.32
0.39 0.44 1.37 0.54
0.10
0.13 0.51 0.11 0.301.24
0.30
0.430.26
0.782.17 0.41 0.36 2.76 1.012.31 0.54 0.44 0.240.50 0.30 0.34 0.49
0.30 0.31 0.49 0.542.72 0.33
0.10 0.35 0.12 0.42 0.70
R ST L I SICYP73A5CYP701A3CYP86A2CYP51A1CYP51A2CYP85A1CYP90D1CYP90A1CYP90B1CYP708A2CYP708A3CYP72B1CYP72C1CYP72A8CYP72A9CYP72A7CYP72A10CYP72A14CYP72A15CYP72A11CYP72A13CYP79C1CYP79A2CYP79B2CYP79B3CYP81H1CYP81D1CYP81D3CYP81D2CYP81D8CYP81D4CYP81D5CYP81D6CYP81D7CYP81F1CYP81F3CYP81F4CYP93D1CYP705A15CYP705A22CYP76G1CYP76C3CYP76C1CYP76C2CYP76C4CYP76C5CYP76C6CYP706A2CYP706A3CYP706A7CYP706A4CYP706A5CYP706A6CYP98A8CYP98A9CYP83B1CYP71B6CYP71B19CYP71B7CYP71B15CYP71B28
a
0.06 0.10 0.06 0.44 0.820.57 0.38 0.10 0.18 1.280.08 0.05 0.06 0.09 0.140.09 0.06 0.03 0.04 0.090.03 0.03 0.02 0.04 0.000.21 0.01 0.19 0.02 0.021.51 0.00 0.00 0.00 0.000.00 0.00 0.00 0.00 0.000.05 0.39 0.91 0.34 0.490.02 0.02 0.02 0.20 0.080.03 0.26 0.21 0.22 0.300.11 0.06 0.09 0.06 0.080.06 0.00 0.01 0.03 0.050.00 0.00 0.00 0.00 0.000.12 0.00 0.00 0.00 0.000.00 0.03 0.00 0.07 0.210.00 0.00 0.00 0.01 0.050.07 0.08 0.05 0.09 0.230.15 0.07 0.00 0.11 0.191.91 0.00 0.00 0.00 0.000.16 0.04 0.05 0.05 0.070.21 0.14 0.01 0.06 0.070.03 0.00 0.00 0.00 0.010.48 0.00 0.00 0.00 0.000.10 0.12 0.02 0.00 0.090.16 0.00 0.02 0.06 0.051.45 0.00 0.00 0.00 0.000.09 0.00 0.00 0.00 0.000.17 0.00 0.00 0.00 0.000.00 0.00 0.00 0.24 0.070.08 0.00 0.00 0.00 0.000.09 0.00 0.00 0.00 0.000.05 0.00 0.00 0.00 0.000.06 0.00 0.00 0.06 0.220.11 0.00 0.00 0.00 0.000.13 0.00 0.00 0.04 0.040.08 0.00 0.00 0.07 0.100.32 0.00 0.00 0.00 0.000.82 0.00 0.04 0.00 0.000.00 0.00 0.00 0.00 0.030.00 0.00 0.00 0.03 0.070.07 0.00 0.00 0.00 0.000.06 0.09 0.02 0.02 0.020.07 0.02 0.00 0.02 0.021.30 0.37 0.34 1.57 0.600.89 0.41 0.10 0.20 0.230.47 0.00 0.02 0.03 0.160.10 0.06 0.00 0.03 0.040.57 0.69 0.19 0.33 0.340.63 0.06 0.08 0.35 0.220.02 0.00 0.00 0.01 0.020.05 0.05 0.02 0.08 0.080.08 0.05 0.04 0.10 0.110.09 0.11 0.12 0.19 0.290.00 0.01 0.02 0.07 0.110.06 0.01 0.00 0.03 0.020.00 0.00 0.00 0.00 0.060.22 0.05 0.03 0.09 0.040.00 0.00 0.00 0.00 0.000.11 0.00 0.00 0.17 0.170.04 0.00 0.00 0.07 0.270.01 0.15 0.09 0.12 0.450.10 0.00 0.00 0.00 0.000.09 0.02 0.03 0.02 0.020.00 0.00 0.02 0.00 0.020.28 0.02 0.08 0.06 0.020.10 0.01 0.00 0.12 0.040.03 0.02 0.00 0.03 0.030.00 0.00 0.07 0.00 0.000.00 0.00 0.00 0.00 0.080.55 0.04 0.00 0.26 0.440.10 0.00 0.00 0.05 0.000.12 0.00 0.09 0.22 0.040.11 0.02 0.00 0.03 0.050.08 0.23 0.31 0.55 0.120.00 0.00 0.00 0.00 0.000.00 0.00 0.00 0.00 0.000.02 0.01 0.00 0.01 0.040.01 0.00 0.00 0.00 0.000.03 0.00 0.00 0.01 0.000.06 0.04 0.06 0.11 0.140.00 0.00 0.00 0.05 0.020.00 0.00 0.00 0.00 0.000.00 0.00 0.00 0.00 0.000.14 0.05 0.06 0.09 0.100.03 0.01 0.00 0.00 0.000.09 0.00 0.00 0.00 0.010.05 0.01 0.02 0.04 0.030.11 0.05 0.00 0.04 0.090.08 0.66 1.40 1.21 0.740.29 0.23 0.19 0.76 0.400.03 0.00 0.00 0.14 0.130.11 0.08 0.06 0.09 0.070.00 0.00 0.00 0.00 0.030.01 0.00 0.00 0.08 0.010.06 0.00 0.00 0.02 0.000.08 0.00 0.00 0.00 0.020.05 0.01 0.00 0.01 0.010.00 0.00 0.00 0.15 0.340.03 0.00 0.00 0.00 0.000.18 0.05 0.00 0.16 0.120.22 0.00 0.00 0.00 0.100.02 0.08 0.08 0.39 0.170.06 0.02 0.00 0.16 0.060.07 0.03 0.03 0.03 0.070.00 0.00 0.00 0.04 0.050.09 0.05 0.27 0.00 0.070.67 0.53 0.35 1.06 0.850.00 0.04 0.00 0.00 0.14
fUGT78D1UGT72B1UGT72C1UGT72D1UGT72D2PUGT72E1UGT72E2UGT72E3UGT88A1UGT71B1UGT71B2UGT71B3PUGT71B4UGT71B5UGT71B6UGT71B7UGT71B8UGT71C4UGT71C3UGT71C1UGT71C2UGT71D1UGT71D2UGT76B1UGT76C1UGT76C2UGT76C5UGT76C3UGT76C4UGT76F1UGT76F2UGT76D1UGT76E1UGT76E2UGT76E3UGT76E10PUGT76E6UGT76E4UGT76E5UGT76E11UGT76E12UGT76E7UGT76E8PUGT76E9UGT83A1UGT74B1UGT74F1UGT74F2UGT74C1UGT74D1UGT74E1UGT74E2UGT75C1UGT75D1UGT75B1UGT75B2UGT84B1UGT84B3UGT84B2UGT84A1UGT84A2UGT84A3UGT84A4UGT85A4UGT85A5UGT85A2UGT85A1UGT85A6PUGT85A7UGT86A1UGT86A2UGT87A1UGT87A2UGT92A1UGT73D1UGT73C7UGT73C1UGT73C2UGT73C3UGT73C4UGT73C5UGT73C6UGT73B1UGT73B2UGT73B3UGT73B4UGT73B5UGT89A1PUGT89A2UGT89B1UGT89C1UGT90A1UGT90A2UGT79B1UGT79B6UGT79B9UGT79B10UGT79B11UGT79B7UGT79B8UGT79B4UGT79B5UGT79B2UGT79B3UGT91C1UGT91A1UGT91B1UGT80A2UGT80B1
R ST L I SI
0.29 0.31 0.26 0.26 0.291.23 0.47 0.11 0.82 0.83
e
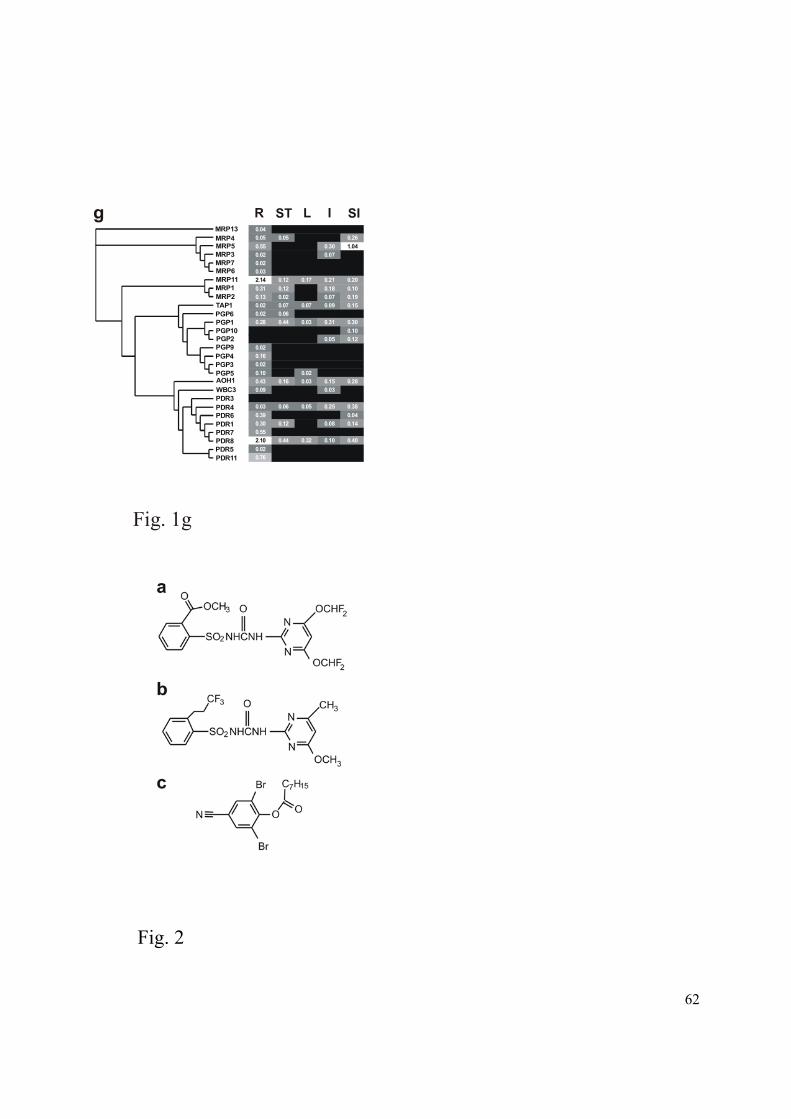
gMRP13MRP4MRP5MRP3MRP7MRP6MRP11MRP1MRP2TAP1PGP6PGP1PGP10PGP2PGP9PGP4PGP3PGP5AOH1WBC3PDR3PDR4PDR6PDR1PDR7PDR8PDR5PDR11
0.040.05 0.05 0.260.55 0.30 1.040.02 0.070.020.032.14 0.12 0.17 0.21 0.200.31 0.12 0.18 0.100.13 0.02 0.07 0.190.02 0.07 0.07 0.09 0.150.02 0.060.28 0.44 0.03 0.31 0.30
0.100.05 0.12
0.020.160.020.10 0.020.43 0.16 0.03 0.15 0.280.09 0.03
0.03 0.06 0.05 0.25 0.380.39 0.040.30 0.12 0.08 0.140.552.10 0.44 0.32 0.10 0.400.020.76
R ST L I SI
Fig. 1g
Fig. 2
62

Fig.3
-0.3 -0.1 0.0 0.1 0.2 0.3
-0.3
-0.1
0.0
0.1
0.2
0.3
Component 1
Com
pone
nt 2
ETHMeJA
SA
PRI24PRI36
PRO24
PSavir
UVBBXN24
-0.2
-0.2
-0.3 -0.1 0.0 0.1 0.2 0.3
-0.3
-0.1
0.0
0.1
0.2
0.3
Component 1
ETHMeJA
SA
PRI24PRI36
PRO24
PSavir
UVBBXN24
-0.2
63

CYP71B6UGT74F2UGT85A5CYP76C5
CYP71B28UGT76C5
GSTF8UGT72B1
GLX-II.1GPX7
CYP76C6UGT89A2CYP79B2CYP81D8
MRP3UGT74E2UGT87A2
GSTU9MRP5
UGT76B1GPX1
PDR8GSTF7GSTF6
CYP98A9GSTZ1GSTF2
UGT86A1CYP71B15
CYP72A8AOH1
GSTF10GSTU20
CYP706A4UGT71C1CYP85C6UGT91C1
UGT78D4PGSTU10
CYP81D1UGT71C4UGT71C3CYP81D4
GSTU18UGT75D1
CYP706A6UGT74C1UGT89B1UGT71B6
CYP72A15CYP708A3
UGT87A1UGT73C1UGT73D1CYP79B3
CYP72A11GPX3TAP1
GSTU17GSTU5
Fig. 4
BXN
24U
VB
PRI2
4PR
I36
PRO
24SAM
eJA
ETH
PSav
ir
64

Chapter 4
Subcellular localisation and functional analysis of the phi class glutathione S-transferase AtGSTF8
65

Subcellular localisation and functional analysis of the phi class glutathione S-transferase AtGSTF8
Pierre-Henri Dubuis and Felix Mauch
Department of Biology, University of Fribourg, Pérolles, 1700 Fribourg, Switzerland
Abstract Plant glutathione S-transferases are multifunctional enzymes encoded by a large gene family
containing 47 members in Arabidopsis thaliana. A member of the phi class GST, AtGSTF8
(At2g47730), is upregulated by various treatments including oxidative stress and exhibits GSH-
peroxidase activity. The chloroplastic localisation of GSTF8 was demonstrated by expressing a fusion
protein consisting of the predicted GSTF8 signal pepetide and GFP in transgenic Arabidopsis.
Analysis of the GST family indicated that GSTF8 is the only chlorplastic GST in Arabidopsis,
making it a promissing candidate for functional analysis. To this end, GSTF8 over-expressing
transgenic lines were produced and a T-DNA insertion knock out mutant was isolated from the
SALK-collection. Phenotypic analysis of the transgenic plants revealed no observable change under
normal growth condition and under conditions of oxidative stress like treatments with hydrogen
peroxide and the herbicide paraquat. GSTF8 appears to be either not involved in protection from
oxidative stress in chloroplasts or, alternatively, that in addition to GSTF8 other mechanisms
contribute to this protection.
Keywords: Glutathione S-transferase, GSTF8, oxidative stress, chloroplast, Arabidposis thaliana.
66
Introduction Glutathione S-transferases (GSTs; EC 2.5.1.18) constitute a family of soluble proteins with typical
molecular masses of around 25 kDa. GSTs catalyse the transfer of the tripeptide glutathione (�-
glutamyl-cysteinyl-glycine, GSH) to a substrate (R-X) containing a reactive electrophilic centre to
form a S-glutathionylated reaction product (R-SG) (Dixon et al., 2002). GSTs play critical roles in the
detoxification of xenobiotics and the protection of tissues against oxidative damage. GSTs are
important enzymes in plant responses to a number of environmental stresses including herbicides and
pathogen attack. The 47 Arabidopsis GSTs are divided on the basis of sequence similarity into phi,
tau, theta and zeta classes (Edwards et al., 2000; McGonigle et al., 2000; Dixon et al., 2002; Wagner
et al., 2002). The most plant GSTs are members of the two plant specific phi and tau classes. In
addition to the four classes of GSTs, A. thaliana contains two GST-like protein groups which contain
the GSH binding domain, but have a cysteine in place of a serine at the active site (Dixon et al.,
2002). These two groups are the GSH dependent dehydroascorbate reductase (DHARs) with 4 genes
and the Lambda GSTs (GSTL) with 2 genes. However, DHARs and GSTLs do not possess
glutathione transferase activity (Dixon et al., 2002).
The idea that GSTs have additional functions not directly linked to their ability to catalyze the
formation of GSH conjugates has gained attention with studies demonstrating that several stress-
inducible GSTs protect plants from oxidative damage by functioning as glutathione peroxidases
(Roxas et al., 1997; Cummins et al., 1999). Certain theta, phi and tau GSTs have been shown to have
glutathione peroxidase activity, with the GSTs using glutathione to catalyse the reduction of organic
hydroxyperoxides of fatty acids and nucleic acids to the corresponding monohydroxyalcohols
(Bartling et al., 1993; Cummins et al., 1999; Edwards et al., 2000). This reduction plays a central role
in preventing the degradation of organic hydroxyperoxides to cytotoxic aldehyde derivatives.
Interestingly, a further link between GSTs and oxidative-stress tolerance has been established by the
finding that when expressed in yeast, a tau GST from tomato can suppress apoptosis induced by the
Bax protein (Kampranis et al., 2000). Another catalytic role that does not involved GSH conjugation
has been demonstrated for the Arabidopsis zeta GSTs which catalyse the GSH-dependent
isomerisation of maleylacetoacetate to fumarylacetoacteate, the second to last step in tyrosine
catabolism (Dixon et al., 2000). GSTs may also function in stress tolerance through a role in cell
signaling. Induction of genes encoding enzymes of flavonoid biosynthesis in parsley by ultraviolet
light requires GSH and the expression of a specific tau GST (Loyall et al., 2000). Biochemical and
immunological investigations point to a largely cytosolic localisation for soluble GSTs in plants
(Edwards et al., 2000). Genomic analysis of the Arabidopsis GSTs reveals that only one phi GST
(GSTF8) appears to contain a clear putative plastid targeting sequence. However, experimental data
confirming this prediction is missing.
GSTF8 (previously GST6, At2g47730) was first identified as a 215 amino acid protein (Chen et al.,
1996). Further studies showed that a 48 aa putative signal peptide was missing and that the protein
was indeed 263 aa long (Wagner et al., 2002). GSTF8 expression is under tissue specific control and
is induced by treatments with auxin, salicylic acid, ethylene, methyl-jasmonate, pathogens and H2O2
(Chen et al., 1996; Chen and Singh, 1999; Wagner et al., 2002; Glombitza et al., 2004). The GSTF8
promoter contains a stress induced 20 bp ocs element (Chen et al., 1996; Chen and Singh, 1999). The
induction of GSTF8 expression by SA and H2O2 may suggest a role for GSTF8 in protection against
oxidative stress and possibly in plant-pathogen interactions. Substrate specificity profiling showed
that GSTF8 has a strong GSH-peroxidase activity and only poor GSH transferase activity (Wagner et
al., 2002).
67
In this study a fusion protein between the signal peptide of GSTF8 and GFP was used to demonstrate
that GSTF8 is targeted to the chloroplast. The expression of this gene is induced by oxidative stress
and the encoded protein has GSH-peroxidase activity. We therefore hypothesized that GSTF8
functions in the detoxification of products generated during oxidative stress in the chloroplast.
Because GSTF8 was the only GST present in the chloroplast, it appeared to be a promising candidate
for functional analysis without running into the problems of redundancy that hinders functional
analysis of the large GST family. To this end transgenic Arabidopsis overexpressing GSTF8 and a T-
DNA insertion knock out mutant in GSTF8 were isolated and tested for phenotypic changes in
response to oxidative stress.
68

Materials and Methods. Plant and bacterial growth condition
Arabidopsis thaliana accession Columbia (Col-0) plants were grown in commercial potting soil under
a 16h light cycle (18°C night and 22°C day temperature) and 60-70% relative humidity.
Pseudomonas syringae pv tomato DC3000 was grown in Luria Broth at 28°C with 25 μg/ml
rifampicin. For bacterial infection half the surface of leaves was syringe-infiltrated with at a titre of 7
x 105 colony forming units per ml in water.
Transformation vectors and transgenic lines
The DNA sequence encoding the first 59 amino acids corresponding to the putative 48 aa signal
peptide and the beginning of the predicted mature GSTF8 was amplified by PCR using the following
primers containing an additional 5’-NcoI site: F-GSTF8S, 5’- gaaccatgggagcaattcaagctcg-3’ and R-
GSTF8S, 5’-gatccatggtgggaactccgtgaacc-3’. The resulting PCR product was cloned into pGEM®-T
Easy (Promega, Madison, USA). The construct was sequenced for verification. The signal sequence
was then excised as a NcoI fragment and inserted in the NcoI site of pMON30060 (Pang et al., 1996).
The cassette including signal peptide and GFP was amplified by PCR using Expand High Fidelity
PCR system (Roche, Basel, Switzerland) with primers containing the recombination sites attB1/B2 of
the Gateway cloning system ( Invitrogen, Carlsbad, USA) F-sGFP-attB1, 5’-
ggggacaagtttgtacaaaaaagcaggctttccatgggagcaattcaagctcg-3’ and R-sGFP-attB2, 5’-
ggggaccactttgtacaagaaagctgggttcagatcttcacttgtagagttcat-3’. The purified PCR product was cloned by
recombination into the binary vector pBENDER (http://www.mpiz-koeln.mpg.de/~weisshaa/BW-
research/Vectors.html) between the CaM35S promoter and the Nos terminator (35S::signalGSTF8-
GFP::nosT). For over-expression, the GSTF8 cDNA (AF288176) was amplified by PCR using
Expand High Fidelity PCR system (Roche, Basel, Switzerland) with primers containing the
recombination sites attB1/B2 of the Gateway cloning system (Invitrogen, Carlsbad, USA): F-GSTF8-
OE-attB1, 5’-ggggacaagtttgtacaaaaaagcaggctttatgggagcaattcaagctcg-3’ and R-GSTF8-OE-attB2, 5’-
ggggaccactttgtacaagaaagctgggtgtcactactgcttctggaggtc-3’. The purified PCR product was cloned by
recombination in the binary vector pBENDER creating a 35S::GSTF8::nosT cassette. PCR was
performed on a Biometra TRIO-Thermoblock™ thermocycler (Biolabo, Châtel-St-Denis,
Switzerland) using following conditions: 94°C for 4 min followed by 32 cycles of 94°C for 15s, 55°C
[60°C for attB site containing primers] for 30s and 72°C for 1 min. Binary vectors were
electroporated into the Agrobacterium tumefaciens strain GM3101 (pMP90RK) (Koncz and Schell,
1986).
Transformation of Arabidopsis was performed by the vacuum infiltration method (Bechtold et al.,
1993). Transformants were selected on half strength Murashige and Skoog (MS) medium containing
50 μg/ml kanamycin. For the localisation of GSTF8, kanamycin-resistant plants were transferred on
soil and leaves were observed under the microscope after 3 weeks. For GSTF8 over expression,
kanamycin-resistant plants were transferred to soil for further cultivation. Screening of seeds for
kanamycin-resistant progeny was carried out in the same medium as above. A homozygous line was
used for the phenotypic tests (line 5).
A GSTF8 knock out mutant was identified in the SALK collection (SALK_039887) with the T-DNA
inserted in the third exon. The seeds were obtained from the Arabidopsis Biological Resource Center
(ABRC; www.arabidopsis.org/abrc/). T-DNA insertion location in GSTF8 was confirmed by PCR
69
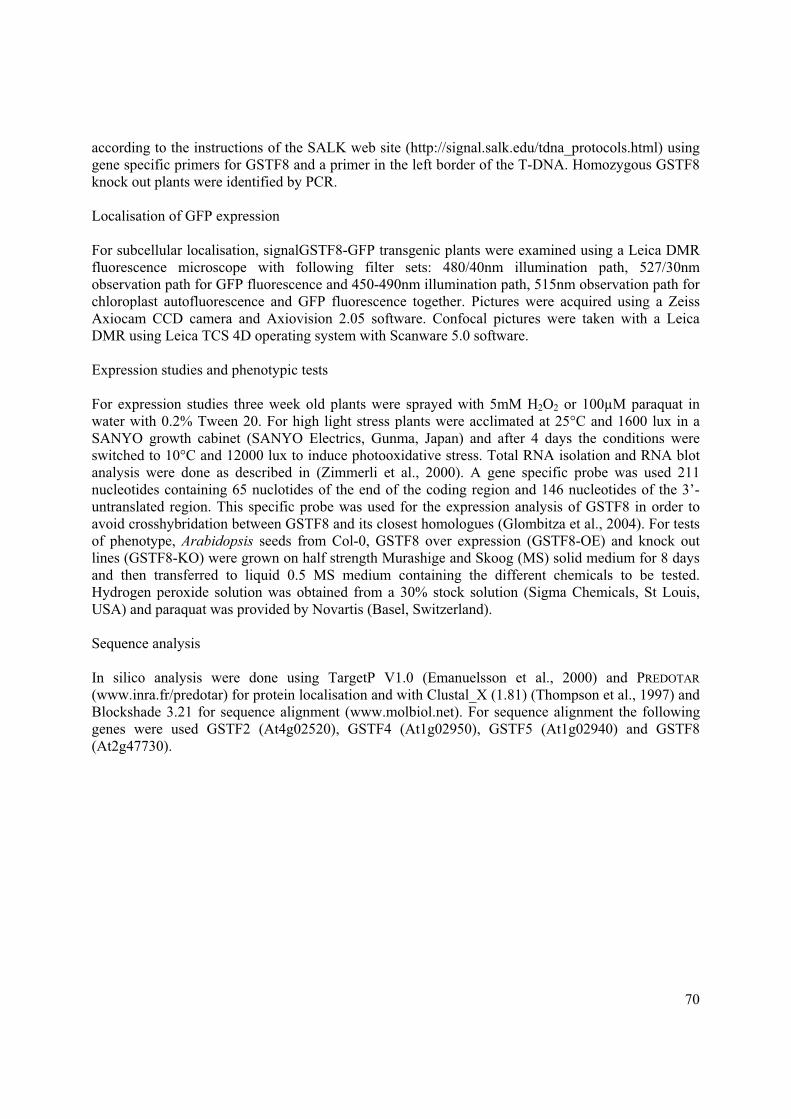
according to the instructions of the SALK web site (http://signal.salk.edu/tdna_protocols.html) using
gene specific primers for GSTF8 and a primer in the left border of the T-DNA. Homozygous GSTF8
knock out plants were identified by PCR.
Localisation of GFP expression
For subcellular localisation, signalGSTF8-GFP transgenic plants were examined using a Leica DMR
fluorescence microscope with following filter sets: 480/40nm illumination path, 527/30nm
observation path for GFP fluorescence and 450-490nm illumination path, 515nm observation path for
chloroplast autofluorescence and GFP fluorescence together. Pictures were acquired using a Zeiss
Axiocam CCD camera and Axiovision 2.05 software. Confocal pictures were taken with a Leica
DMR using Leica TCS 4D operating system with Scanware 5.0 software.
Expression studies and phenotypic tests
For expression studies three week old plants were sprayed with 5mM H2O2 or 100μM paraquat in
water with 0.2% Tween 20. For high light stress plants were acclimated at 25°C and 1600 lux in a
SANYO growth cabinet (SANYO Electrics, Gunma, Japan) and after 4 days the conditions were
switched to 10°C and 12000 lux to induce photooxidative stress. Total RNA isolation and RNA blot
analysis were done as described in (Zimmerli et al., 2000). A gene specific probe was used 211
nucleotides containing 65 nuclotides of the end of the coding region and 146 nucleotides of the 3’-
untranslated region. This specific probe was used for the expression analysis of GSTF8 in order to
avoid crosshybridation between GSTF8 and its closest homologues (Glombitza et al., 2004). For tests
of phenotype, Arabidopsis seeds from Col-0, GSTF8 over expression (GSTF8-OE) and knock out
lines (GSTF8-KO) were grown on half strength Murashige and Skoog (MS) solid medium for 8 days
and then transferred to liquid 0.5 MS medium containing the different chemicals to be tested.
Hydrogen peroxide solution was obtained from a 30% stock solution (Sigma Chemicals, St Louis,
USA) and paraquat was provided by Novartis (Basel, Switzerland).
Sequence analysis
In silico analysis were done using TargetP V1.0 (Emanuelsson et al., 2000) and PREDOTAR
(www.inra.fr/predotar) for protein localisation and with Clustal_X (1.81) (Thompson et al., 1997) and
Blockshade 3.21 for sequence alignment (www.molbiol.net). For sequence alignment the following
genes were used GSTF2 (At4g02520), GSTF4 (At1g02950), GSTF5 (At1g02940) and GSTF8
(At2g47730).
70

Results Alignment of the 47 members of the GST gene family shows that 3 GSTs, the GSTF4, GSTF5 and
GSTF8 contain extended N-terminal sequences possibly corresponding to signal peptides. Figure 1
shows an alignment of these three GSTs together with GSTF2 as a representative of the cytosolic
GSTs to indicate the position of the translational start site of most GSTs. In silico analysis of the
putative signal sequences indicated that only GSTF8 contains a putative signal peptide for
chloroplastic or mitochondrial localisation.
GSTF2 1 ------------------------------------------------MAGIKVFGHPASGSTF4 1 --------------------------MDCLQMVFKLFPNWKREAEVKKLG-YKVHGDPFSGSTF5 1 -------------MGINASHVPETCYHHCNQTFESSRQCFKWCQELARKDEYKIYGYPYSGSTF8 1 MGAIQARLPLFLSPPSIKHHTFLHSSSSNSNFKIRSNKSSSSSSSSIIMASIKVHGVPMS
GSTF2 13 IATRRVLIALHEKNLDFELVHVELKDGEHKKEPFLSRNPFGQVPAFEDGDLKLFESRAITGSTF4 34 TNTRRVLAVLHEKRLSYEPITVKLQTGEHKTEPFLSLNPFGQVPVFEDGSVKLYESRAITGSTF5 48 TNTRRVLAVLHEKGLSYDPITVNLIAGDQKKPSFLAINPFGQVPVFLDGGLKLTESRAISGSTF8 61 TATMRVLATLYEKDLQFELIPVDMRAGAHKQEAHLALNPFGQIPALEDGDLTLFESRAIT
GSTF2 73 QYIAHRYENQGTNLLQTDSKNISQYAIMAIGMQVEDHQFDPVASKLAFEQIFKSIYGLTTGSTF4 94 QYIAYVHSSRGTQLLN--LRSHETMATLTMWMEIEAHQFDPPASKLTWEQVIKPIYGLETGSTF5 108 EYIATVHKSRGTQLLN--YKSYKTMGTQRMWMAIESFEFDPLTSTLTWEQSIKPMYGLKTGSTF8 121 QYLAEEYSEKGEKLIS--QDCKKVKATTNVWLQVEGQQFDPNASKLAFERVFKGMFGMTT
GSTF2 133 DEAVVAEEEAKLAKVLDVYEARLKEFKYLAGETFTLTDLHHIPAIQYLLGTPTKKLFTERGSTF4 152 DQTIVKENEAILEKVLNIYEKRLEESRFLACNSFTLVDLHHLPNIQYLLGTPTKKLFEKRGSTF5 166 DYKVVNETEAKLEKVLDIYEERLKNSSFLASNSFTMADLYHLPNIQYLMDTHTKRMFVNRGSTF8 179 DPAAVQELEGKLQKVLDVYEARLAKSEFLAGDSFTLADLHHLPAIHYLLGTDSKVLFDSR
GSTF2 193 PRVNEWVAEITKRPASEKVQ------------GSTF4 212 SKVRKWVDEITSREAWKMACDQEKSWFNKPRNGSTF5 226 PSVRRWVAEITARPAWKRACD-VKAWYHKKKNGSTF8 239 PKVSEWIKKISARPAWAKVIDLQKQ-------
Figure 1. Alignment of GSTF2 (At4g02520), GSTF4 (At1g02950), GSTF5 (At1g02940) and GSTF8 (At2g47730). Theblack arrow indicates the translational start of most GSTs. The sequences of GSTF4, GSTF5 and GSTF8 exhibit a longer N-terminal sequence. Alignment was done with ClustalX (Thompson et al., 1997) and Blockshade 3.21programs (www.molbiol.net). Residues identical and conserved between sequences are marked with black and grey,respectively.
To experimentally confirm the chloroplastic localisation of GSTF8, a fragment of 177bp
corresponding to 59 N-terminal amino acids of the GSTF8 (At2g47730) was PCR amplified and used
to produce a fusion protein construct with green fluorescence protein as visible marker (see Figure 2
and Material and Methods). Arabidopsis Col-0 transformed with pBender-GSTF8-signal-GFP were
selected on Kanamycin and observed after 3 weeks. Figure 3 shows confocal microscopy pictures of
transgenic plants. Comparison of GFP fluorescence (Figure 3A) and chloroplast autofluorescence
(Figure 3B) demonstrated that GFP fluorescence is restricted to the chloroplasts.
71
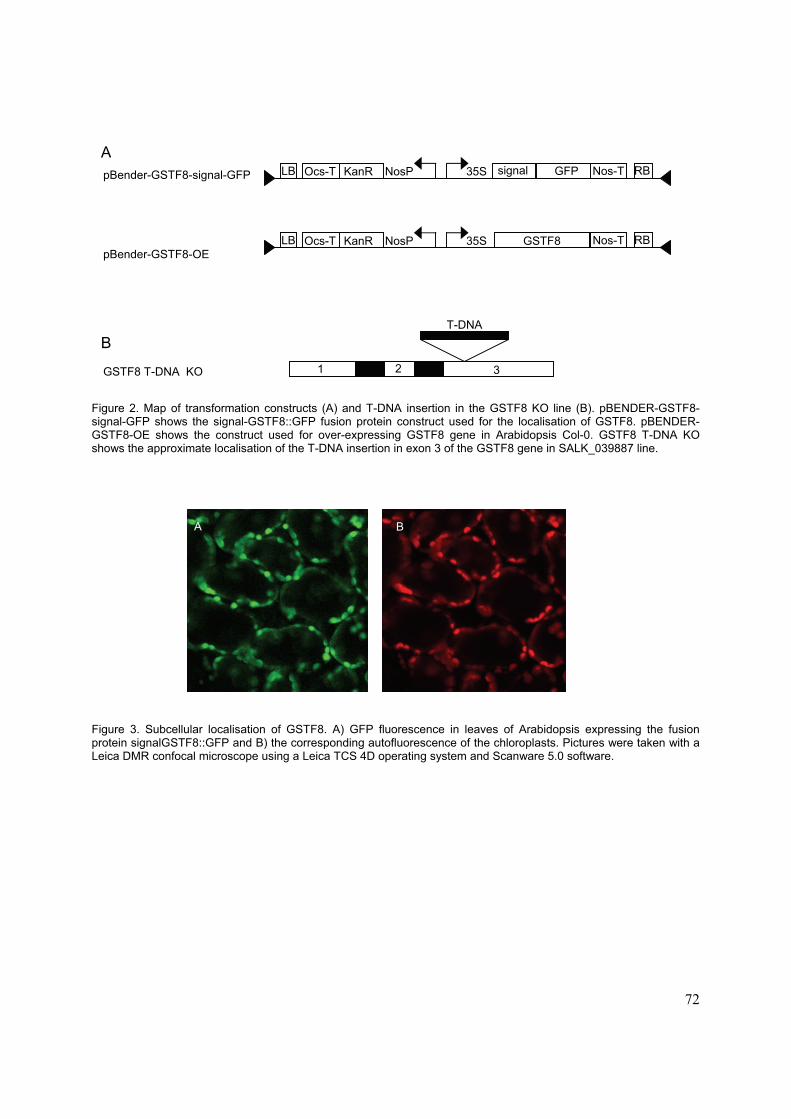
A
Figure 2. Map of transformation constructs (A) and T-DNA insertion in the GSTF8 KO line (B). pBENDER-GSTF8-signal-GFP shows the signal-GSTF8::GFP fusion protein construct used for the localisation of GSTF8. pBENDER-GSTF8-OE shows the construct used for over-expressing GSTF8 gene in Arabidopsis Col-0. GSTF8 T-DNA KO shows the approximate localisation of the T-DNA insertion in exon 3 of the GSTF8 gene in SALK_039887 line.
Figure 3. Subcellular localisation of GSTF8. A) GFP fluorescence in leaves of Arabidopsis expressing the fusionprotein signalGSTF8::GFP and B) the corresponding autofluorescence of the chloroplasts. Pictures were taken with aLeica DMR confocal microscope using a Leica TCS 4D operating system and Scanware 5.0 software.
pBender-GSTF8-signal-GFP
pBender-GSTF8-OE
GSTF8 T-DNA KO
B
35S signalNosPOcs-T KanRLB GFP Nos-T RB
35S RBLB Nos-TOcs-T KanR NosP GSTF8
T-DNA
21 3
A B
72

Figure 4A shows that the expression of GSTF8 was up regulated after treatment with 5mM H2O2 and
100μM paraquat, a herbicide interfering with photosystem I (Ye and Gressel, 2000). Hydrogen
peroxide induced a transient increase of GSTF8 already 2 hours after treatment. After treatment with
paraquat the expression of GSTF8 increased after 2 hours and was sustained over a longer period.
These results confirm that GSTF8 is up regulated under conditions of oxidative stress. However,
GSTF8 was not upregulated after high light treatment that is predicted to cause photooxidative stress
in the chloroplast.
Figure 4B shows a RNA blot of GSTF8 expression in transgenic lines. Over-expressing GSTF8-OE
plants showed diverse patterns. Some lines (lines 4, 5 and 7) show very strong expression and other
only weak expression (lines 1, 2, 3 and 6). Lines such as line number 1 showing weaker expression
than the control are indications for silencing of GSTF8 expression. For further studies we have used
the homozygous line 5 which shows strong expression. For knock-out plants homozygous lines were
isolated by PCR according to the instruction given on the SALK site
(http://signal.salk.edu/tdna_protocols.html). All homozygous GSTF8-KO plants displayed in Figure
4B (lines 8, 9 and 10) show no expression of GSTF8 24 hours after infection with Pseudomonassyringae. Inoculation with P. syringae was previousely shown to induce a strong increase in GSTF8
expression (Lieberherr et al., 2003; Glombitza et al., 2004).
A Time course
2h 4h 8h
Ctrl
H2O2
Paraquat
High light
B
GSTF8-OE GSTF8-KO
Ctrl 1 2 3 4 5 6 7 8 9 10
Figure 4. RNA blot analysis showing the expression of GSTF8 in stressed and in transgenic plants. A) Induction of GSTF8 after oxidative stress. Time course of expression of AtGSTF8 after treatment with 5mM H2O2, 100 µM paraquat and photooxidative stress (high light) by switching light from 1600 lux 25°C to 12000 lux 10°C. B) Expressionof GSTF8 in overexpressing and T-DNA knock out lines (GSTF8-KO, SALK_039887). Ctrl shows the level of
73

expression of Col-0 wild type plants. A gene specific probe was used in order to distinguish between GSTF8expression and its closest homologues (Glombitza et al., 2004). Compared to wild type Col-0 GSTF8-OE and GSTF8-KO plants grown in normal condition
displayed no visible phenotype neither in growth, flowering time and root length. Considering that
GSTF8 is the only chloroplastic GST with GSH-transferase activity in Arabidopsis, that its
expression is upregulated after oxidative stress and that it has a GSH-peroxidase activity, we
hypothesized that GSTF8 could play a role in the detoxification of reactive oxygen species produced
in the chloroplast. To test this hypothesis phenotype tests were carried out by inducing oxidative
stress using hydrogen peroxide and paraquat. Figure 5 shows 8 day old wild type, GSTF8-OE (line 5)
and GSTF8-KO (line 8) plants treated with different concentration of hydrogen peroxide or paraquat.
Hydrogen peroxide at a concentration of 4 mM induced the necrosis of cotyledons and leaves.
Paraquat at 50μM induced wilting of the leaves and small necrosis. No differences could be seen
between the wild type and the two transgenic lines.
74

75
75
Discussion Aerobic organisms and particularly plants have to deal with the production of reactive oxygen species
not only in stress conditions but also under normal growth. Free radicals are natural by-products of
biological redox reactions particularly in mitochondria and chloroplasts. Plants have evolved different
mechanisms to neutralise free radicals before they can damage lipids, proteins or nucleic acids. To
achieve this goal they use different antioxidant molecules such as ascorbate, glutathione (GSH), �-
tocopherol, carotenoids, polyamines and flavonoids (Foyer et al., 1994; Noctor and Foyer, 1998; Ye
and Gressel, 2000). They also use different enzymatic systems to scavenge directly free radials or to
recycle antioxidant molecules. Ascorbate peroxidase detoxifies mainly hydrogen peroxides.
Superoxide dismutase catalyses the transformation of O2- to H2O2. Glutathione reductase reduces
oxidised glutathione to GSH and glutathione peroxidase detoxifies organic peroxides like lipid
peroxides (Eshdat et al., 1997). Regeneration of oxidised ascorbate can be achieved by
dehydroascorbat reductase, monodehydroascorbate reductase and ferredoxin. All these antioxidant
molecules and enzymes are present in chloroplasts of higher plants
GSTF8 was first isolated as a 215 aa long protein that starts at Met49 (Chen et al., 1996). But a longer
cDNA (AF288176, (Wagner et al., 2002) suggested a 48 aa longer N-terminal sequence resulting in a
263 aa protein. This N-terminal extension was predicted to be a putative signal peptide targeting the
protein to the chloroplast. We demonstrated with the GSTF8 signal peptide fused to GFP that this
signal peptide is indeed a chloroplast targeting sequence.
The strong up regulation of GSTF8 two hours after treatment with H2O2 is consistent with previous
results (Chen et al., 1996; Chen and Singh, 1999; Desikan et al., 2001; Wagner et al., 2002). In
contrast to previous study in our work the expression of GSTF8 was monitored using a gene specific
probe. Paraquat treatment induces oxidative stress by interacting with photosystem I leading to the
formation of reactive oxygen species. These ROS induced the increase of the expression of GSTF8
already after 2 hours and the expression increased further up to 8 hours post treatment. GSTF8 was
shown to be induced by other stresses like SA, auxin, ethylene, MeJA, and pathogens (Chen et al.,
1996; Wagner et al., 2002). In our study treatment with high light did not induce the expression of
GSTF8. (Rossel et al., 2002)Rossel et al. (2002) reported the induction of the expression of GSTF8
already 10 minutes after high light treatment. They observed the highest expression one hour after
treatment and two hours after treatment the expression decreased to a low level comparable to the
level observed in our study.
Substrate specificity profiling had shown that GSTF8 has a GSH-peroxidase activity and only limited
glutathione S-transferase activity (Wagner et al., 2002). Taken together literature data and our results
showed that GSTF8 is the only GST present in the chloroplast, that it possesses a strong GSH-
peroxidase activity and that it is up regulated by oxidative stresses including pathogen attack. Our
hypothesis was that GSTF8 plays a role in the chloroplast by detoxifying reactive oxygen species
mainly lipid peroxide by its GSH-peroxidase activity.
However, GSTF8 knock out and GSTF8 over expressing plants showed no phenotype under normal
growth condition. When stressed either with hydrogen peroxide or paraquat no phenotypic difference
could be observed. The GST family is a large gene family that contains 47 members and one
explanation could be a redundant function for some othe GST. Another member could take over the
function of GSTF8, but to do so this GST has to be present in the chloroplast. We can exclude the
best candidate GSTF5 (At1g02940) as it is not expressed in leaf tissue, roots, stem, inflorescence and
76

silique.(Glombitza et al., 2004). Its expression was not detected under various stresses like herbicides,
plant hormones, pathogen attack, UV-B. Furthermore no cDNA was cloned to date and no EST was
isolated. All these data suggest that GSTF5 is not expressed. Moreover GSTF5 possesses no clear
predicted chloroplast targeting signal peptide. In conclusion it is highly unlikely that another GST
may replace GSTF8 in the chloroplast. However, some GST-like proteins, two DHARs and one
GSTL, possess a chloroplast targeting peptide and their putative role as antioxidant enzymes was
described (Dixon et al., 2002). And furthermore, Milla et al. (2003) described a chloroplastic GSH-
peroxidase present in the chloroplast (GPX1, At2g25080). In addition, all the other antioxidant
mechanisms present in the chloroplasts of higher plants described previously could make the
antioxidative role of GSTF8. As an alternative GSTF8 could play another role not linked to protection
against oxidative stress.
In conclusion we demonstrated that GSTF8 is localized in the chloroplast. GSTF8 expression is
upregulated by oxidative stress like treatment with hydrogen peroxide and the herbicide paraquat.
GSTF8-OE and GSTF8-KO transgenic plants showed no phenotypic differences to wild type neither
under normal growth conditions nor under conditions of oxidative stress. This indicates that GSTF8 is
either not involved in protection from oxidative stress in chloroplasts or, alternatively, that in addition
to GSTF8 other mechanisms contribute to this protection. The presence of various other mechanisms
of detoxification of reactive oxygen species in the chloroplast can explain the absence of visible
phenotype.
Acknowledgment We thank Riccardo Flückiger and Brigitte Mauch-Mani for help with the confocal microscope at the
University of Neuchâtel.We thank the ABRC seed center for providing the GSTF8 T-DNA insertion
line. The GFP vector pMON30060 was a gift from S. Pang (Monsanto, St Louis, USA).
77
References
Bartling DB, Radzio R, Steiner U, Weiler EW (1993) A glutathione S-transferase with glutathione-
peroxidase activity from Arabidopsis thaliana. Molecular cloning and functional
characterization. European Journal of Biochemistry 216: 579-586
Bechtold N, Ellis J, Pelletier G (1993) In Planta Agrobacterium mediated gene transfer by
infiltration of adult Arabidopsis thaliana plants. C. R. Acad. Sci. Ser. III. Sci. Vie 316: 1194-
1199
Chen WQ, Chao G, Singh KB (1996) The promoter of a H2O2-inducible, Arabidopsis glutathione
S- transferase gene contains closely linked OBF- and OBP1-binding sites. Plant Journal 10: 955-966
Chen WQ, Singh KB (1999) The auxin, hydrogen peroxide and salicylic acid induced expression of
the Arabidopsis GST6 promoter is mediated in part by an ocs element. Plant Journal 19: 667-
677
Cummins I, Cole DJ, Edwards R (1999) A role for glutathione transferases functioning as
glutathione peroxidases in resistance to multiple herbicides in black-grass. Plant Journal 18: 285-292
Desikan R, Mackerness SAH, Hancock JT, Neill SJ (2001) Regulation of the Arabidopsis
transcriptome by oxidative stress. Plant Physiology 127: 159-172
Dixon DP, Cole DJ, Edwards R (2000) Characterisation of a zeta class glutathione transferase from
Arabidopsis thaliana with a putative role in tyrosine catabolism. Archives of Biochemistry
and Biophysics 384: 407-412
Dixon DP, Davis BG, Edwards R (2002) Functional divergence in the glutathione transferase
superfamily in plants - Identification of two classes with putative functions in redox
homeostasis in Arabidopsis thaliana. Journal of Biological Chemistry 277: 30859-30869
Dixon DP, Lapthorn A, Edwards R (2002) Plant glutathione transferases. Genome Biology 3
Edwards R, Dixon DP, Walbot V (2000) Plant glutathione S-transferases: enzymes with multiple
functions in sickness and in health. Trends in Plant Science 5: 193-198
Emanuelsson O, Nielsen H, Brunak S, von Heijne G (2000) Predicting subcellular localization of
proteins based on their N-terminal amino acid sequence. Journal of Molecular Biology 300: 1005-1016
Eshdat Y, Holland D, Faltin Z, BenHayyim G (1997) Plant glutathione peroxidases. Physiologia
Plantarum 100: 234-240
Foyer CH, Descourvières P, Kunert KJ (1994) Protection against oxygen radicals: an important
defence mechanism studied in transgenic plants. Plant Cell Environ 17: 507-523
Glombitza S, Dubuis PH, Thulke O, Welzl G, Bovet L, Götz M, Affenzeller M, Geist B, Hehn A,Asnaghi C, Ernst D, Seidlitz HK, Martinoia E, Werck-Reichhart D, Mauch F, SchäffnerAR (2004) Crosstalk and differential response to abiotic and biotic stressors at the
transcroptional level of effector genes from secondary metabolism. Submitted
Kampranis SC, Damianova R, Atallah M, Toby G, Kondi G, Tsichlis PN, Makris AM (2000) A
novel plant glutathione S-transferase/peroxidase suppresses Bax lethality in yeast. Journal of
Biological Chemistry 275: 29207-29216
Koncz C, Schell J (1986) The promoter of TL-DNA gene 5 controls the tissue-specific expression of
chimaeric genes carried by a novel type of Agrobacterium binary vector. Molecular and
General Genetics 203: 383-396
Lieberherr D, Wagner U, Dubuis PH, Metraux JP, Mauch F (2003) The rapid induction of
glutathione S-transferases AtGSTF2 and AtGSTF6 by avirulent Pseudomonas syringae is the
78

result of combined salicylic acid and ethylene signaling. Plant and Cell Physiology 44: 750-
757
Loyall L, Uchida K, Braun S, Furuya M, Frohnmeyer H (2000) Glutathione and a UV light-
induced glutathione S-transferase are involved in signaling to chalcone synthase in cell
cultures. Plant Cell 12: 1939-1950
McGonigle B, Keezler SJ, Lau SMC, Koeppe MK, O'Keffe DP (2000) A genomic approach to the
comprehensive analysis of the glutathione S-transferase gene family in soybean and maize.
Plant Physiology 124: 1105-1120
Milla MAR, Maurer A, Huete AR, Gustafson JP (2003) Glutathione peroxidase genes in
Arabidopsis are ubiquitous and regulated by abiotic stresses through diverse signaling
pathways. Plant Journal 36: 602-615
Noctor G, Foyer CH (1998) Ascorbate and glutathione: Keeping active oxygen under control.
Annual Review of Plant Physiology and Plant Molecular Biology 49: 249-279
Pang SZ, DeBoer DL, Wan Y, Ye G, Layton JG, Neher MK, Armstrong CL, Fry JE, Hinchee MAW, Fromm ME (1996) An improved green fluorescent protein gene as a vital marker in
plants. Plant Physiology 112: 893-900
Rossel JB, Wilson IW, Pogson BJ (2002) Global changes in gene expression in response to high
light in Arabidopsis. Plant Physiology 130: 1109-1120
Roxas VP, Smith RK, Allen ER, Allen RD (1997) Overexpression of glutathione S-transferase
glutathione peroxidase enhances the growth of transgenic tobacco seedlings during stress.
Nature Biotechnology 15: 988-991
Thompson JD, Gibson TJ, Plewniak F, Jeanmougin F, Higgins DG (1997) The CLUSTAL_X
windows interface: flexible strategies for multiple sequence alignement aided by quality
analysis tools. Nucleic Acids Research 25: 4876-4882
Wagner U, Edwards R, Dixon DP, Mauch F (2002) Probing the diversity of the arabidopsis
glutathione S- transferase gene family. Plant Molecular Biology 49: 515-532
Ye B, Gressel J (2000) Transient, oxidant-induced antioxidant transcript and enzyme levels correlate
with greater oxidant-resistance in paraquat- resistant Conyza bonariensis. Planta 211: 50-61
Zimmerli L, Jakab C, Metraux JP, Mauch-Mani B (2000) Potentiation of pathogen-specific
defense mechanisms in Arabidopsis by beta-aminobutyric acid. Proceedings of the National
Academy of Sciences of the United States of America 97: 12920-12925
79

Chapter 5
Concluding remarks
80

Concluding remarks
In the first part we have investigated the role of sulfur nutrition for plants in relation to disease
resistance. Sulfur-deficiency of oilseed rape had a dramatic effect on plant resistance against
various pathogens such as the specific Brassica pathogen Leptosphaeria maculans, a generalist
pathogen like Botrytis cinerea and the oomycete Phytophthora brassicae infecting a wide range
of Brassicas. This was confirming observations from the field that suggested at a link between
sulfur supply and plant disease resistance. We have to keep in mind that sulfur is also very
important for the quality of crop production (Haneklaus et al., 1995; Schnug, 1996). This leads to
the conclusion that sulfur is a very important component of the plant nutrition and that we have to
pay more attention to its sufficient supply in crop production by early detection of putative
deficient soil and by adding fertilizer containing sulfur. The enhanced susceptibility of S-
deficient oilseed rape was linked to the loss of antifungal potential. The loss of antifungal
potential correlated with a dramatic reduction in the glucosinolate content. Glucosinolate
degradation products were shown to have antifungal activity (Osbourn, 1996). However all the
isothiocyanate and degradation products of sinigrin tested in our study did not exhibit antifungal
activity. To fulfil the study it could be very interesting to test the degradation products of all the
glucosinolates present in oilseed rape leaves to find out if one or more glucosinolates are indeed
responsible for the antifungal activity. An other interesting approach could be to fractionate plant
extracts and in order to purify the compound(s) responsible for the antifungal activity.
In the second part, the analysis of the transcriptome of four gene families of secondary
metabolism under various stress conditions showed that the genes were differently regulated. The
majority of the genes were neither strongly expressed nor strongly regulated. The differentiating
expression patterns provided a wide set of information regarding the individual genes and argued
against widely redundant functions among these quite large gene families. In conclusion the
MetArray constitutes a powerful tool to study the specific expression of particular members of
large gene families. However, an improvement of the technique could be to spot the gene specific
probes on glass slides in order to avoid problems of unequal cDNA spotting and radiolabelling
differences.
In the third part, we could demonstrate that GSTF8 is the only GST localised in the chloroplast
and that it expression is regulated by oxidative stress. However our hypothesis that it could play a
role in defense against oxidative stress in chloroplasts turned out to be difficult to verify. Further
interesting work would be to analyse if in GSTF8-KO and GSTF8-OE the expression levels of
other enzymes involved in reactive oxygen species detoxification are modified in comparison to
wild type. If this is the case this would be an indirect hint of a antioxidant role of GSTF8 in the
chloroplast.
81
References
Haneklaus S, Murphy DPL, Nowak G, Schnug E (1995) Effects of the timing of sulfur
application on grain yield and yield components of wheat. Zeitschrift Fur
Pflanzenernahrung Und Bodenkunde 158: 83-85
Osbourn AE (1996) Preformed antimicrobial compounds and plant defense against fungal
attack. Plant Cell 8: 1821-1831
Schnug E (1996) Significance of sulphur for the nutritional and technological quality of
domesticated plants. In WJ Cram, De Kok, L. J., Stulen, I., Brunold, C. and Rennenberg,
H., ed, Sulfur metabolismus in higher plants - molecular, ecophysiological and nutritional
aspects. Backhuys Publishers, Leiden, The Netherlands
82

Thanks
I would like to say many, many thanks to:
� Prof. Felix Mauch for giving me the opportunity to carry out an interesting thesis project
in excellent lab conditions, for his constructive criticism, for teaching me new techniques
and way of thinking and finally for the chocolate bars during the lab meetings.
� Prof. Enrico Martinoia from the University of Zürich not only for his willingness to be
part of the “Jury de thèse” but also for his constructive remarks during the meetings of the
CSOT829 Action Switzerland.
� Prof. Jean-Pierre Métraux for his willingness to be part of the “Jury de thèse” and also for
providing excellent work conditions and friendly environment in the institute.
� Dr Anthony Schaeffner from GSF Munich (Germany) for his friendly cooperation and his
kindness to host me four times in his lab and also at his home.
� Cristina Marazzi and Erich Staedler from the FAW Wädenswil for a constructive
collaboration and interesting scientific discussions.
� all the members of the Swiss COST829 Action for scientific exchange and advices.
� Marianne Sutter from the University of Bern for giving me the opportunity to do GSH
analysis in Bern.
� Prof. Hansruedi Pfeifer and Jean-ClaudeLavanchy from the University of Lausanne for
giving me the opportunity to do the X-RF analysis for total sulfur measurements.
� Riccardo Flückiger and Brigitte Mauch-Mani from the University of Neuchâtel for their
help with the confocal microscope
� all my colleagues in the lab, for their advices, their help and also their kindness and
friendship.
� the Federal Office for Education and Science for providing me with the grant to carry out
my thesis project.
83

Curriculum vitae
Last name Dubuis
First name Pierre-Henri
Date of birth April 21, 1972
Place of birth Sion, Switzerland
Citizenship Swiss
Civil status Married
Address Rue des Acacias 2
CH-1700 Fribourg
Formation
2000-2004 PhD thesis in Plant Biology at the University of Fribourg. Supervisor Prof Felix
Mauch.
1997-1999 Master in Biology at the University of Geneva. Master thesis with Dr. Roger Pezet at
the Swiss Federal Agricultural Research Station for Plant Production of Changins.
1994-1997 Bachelor in Biology at the University of Geneva.
1992-1994 Two years of economic studies at the University of St. Gallen (HSG), Graduate School
of Buisness, Economics, Law and Social Sciences.
84