Embed Size (px)
Citation preview

0
Tracking U.S. Grain, Oilseed and Related Product Exports in Mexico
CNAS 2013-01
November 2013
Flynn J. Adcock, Texas A&M AgriLife Research Juan Villa, Texas A&M Transportation Institute
Mark Welch, Texas A&M AgriLife Extension Service Jose Antonio Perez-Vidales, Texas A&M Transportation Institute
C. Parr Rosson, III, Texas A&M University
Author Contact: Flynn J. Adcock, [email protected], 979-845-8694.
USDA Contact: Delmy L. Salin, [email protected], 202-720-0833. Recommended Citation: Flynn J. Adcock, Juan Villa, Mark Welch, Jose Antonio Perez-Vidales, C. Parr Rosson, III. Tracking U.S. Grain, Oilseed and Related Product Exports in Mexico. CNAS Publication Number 2013-01. November 2013. Posted at http://cnas.tamu.edu and http://dx.doi.org/10.9752/TS144.11-2013. Acknowledgements: This work was supported by Cooperative Agreement Number 12-25-A-5555 with the Agricultural Marketing Service of the U.S. Department of Agriculture. Disclaimer: The opinions and conclusions expressed do not necessarily represent the views of the U.S. Department of Agriculture or the Agricultural Marketing Service.

i
Tracking U.S. Grain, Oilseed and Related Product Exports in Mexico
Table of Contents
List of Tables/List of Figures .......................................................................................................... ii
Executive Summary ....................................................................................................................... iii
Introduction ..................................................................................................................................... 1
Ports of Entry and Transportation Modes for U.S. Grains Exports to Mexico ............................... 4
U.S. Yellow Corn Exports to Mexico and Modal Shares of Shipments ......................................... 8
U.S. Soybean Exports to Mexico and Modal Shares of Shipments .............................................. 11
U.S. Sorghum Exports to Mexico and Modal Shares of Shipments ............................................. 13
U.S. Hard Wheat Exports to Mexico and Modal Shares of Shipments ........................................ 16
U.S. Rice Exports to Mexico and Modal Shares of Shipments .................................................... 19
U.S. Dried Distiller’s Grain Exports to Mexico and Modal Shares of Shipments ....................... 21
U.S. Soybean Meal Exports to Mexico and Modal Shares of Shipments..................................... 23
U.S. High Fructose Corn Syrup Exports to Mexico and Modal Shares of Shipments ................. 25
Selected Other Products Exports to Mexico and Modal Shares of Shipments ............................. 26
Soybean Oil, Canola Meal, Popcorn, and Sunflower Seeds .................................................... 26
Soft Wheat and White Corn ..................................................................................................... 29
Conclusion .................................................................................................................................... 30
References ..................................................................................................................................... 31
Appendix A. Map of Mexico Highway System........................................................................... 32
Appendix B. Map of Mexico by State ......................................................................................... 33

ii
Tracking U.S. Grain, Oilseed and Related Product Exports in Mexico
List of Tables
Table 1. U.S. Grain, Oilseed and Related Product Exports to Mexico, 2010-2011 ...................................... 1 Table 2. Main Ports of Entry for US Grains, Oilseeds, and Related Product Exported to Mexico, 2010/2011 ....................................................................................................................................... 6 Table 3. 2011 Rail Shipments of U.S. Yellow Corn within Mexico ............................................................ 9 Table 4. Top Origin-Destination Pairs for Rail Shipments of U.S. Yellow Corn within Mexico, 2011 .... 10 Table 5. Uses of U.S. Corn Exports to Mexico ........................................................................................... 11 Table 6. 2011 Rail Shipments of U.S. Soybeans within Mexico ................................................................ 12 Table 7. Top Origin-Destination Pairs for Rail Shipments of U.S. Soybeans within Mexico, 2011 .......... 13 Table 8. 2011 Rail Shipments of U.S. Sorghum within Mexico ................................................................. 15 Table 9. Top Origin-Destination Pairs for Rail Shipments of U.S. Sorghum within Mexico, 2011 .......... 15 Table 10. 2011 Rail Shipments of U.S. Hard Wheat within Mexico .......................................................... 17 Table 11. Top Origin-Destination Pairs for Rail Shipments of U.S. Hard Wheat within Mexico, 2011 .... 18 Table 12. Uses of U.S. Wheat Exports to Mexico ...................................................................................... 18 Table 13. Main Ports of Entry for U.S. Paddy Rice Exports to Mexico – 2011 ......................................... 19 Table 14. 2011 Rail Shipments of U.S. Rice within Mexico ...................................................................... 20 Table 15. Top Origin-Destination Pairs for Rail Shipments of U.S. Rice within Mexico, 2011 ................ 20 Table 16. 2011 Rail Shipments of U.S. DDG within Mexico..................................................................... 22 Table 17. Top Origin-Destination Pairs for Rail Shipments of U.S. DDG within Mexico, 2011 .............. 23 Table 18. Origin-Destination matrix for Soybean Meal Exports to Mexico – 2011 ................................... 23 Table 19. 2011 Rail Shipments of U.S. Soybean Meal within Mexico ...................................................... 24 Table 20. Top Origin-Destination Pairs for Rail Shipments of U.S. Soybean Meal within Mexico, 2011 ................................................................................................................... 25 Table 21. Main Ports of Entry for U.S. HFCS Exports to Mexico – 2011 ................................................. 26 Table 22. 2011 Rail Shipments of U.S. High Fructose Corn Syrup within Mexico ................................... 26 Table 23. 2011 Main Ports of Entry for Selected U.S. Exports to Mexico ................................................ 27 Table 24. 2011 Rail Shipments of Selected U.S. Products within Mexico ................................................. 28 Table 25. Main Ports of Entry for U.S. Soft Wheat Exports to Mexico – 2011 ......................................... 29 Table 26. Main Ports of Entry for U.S. White Corn Exports to Mexico – 2011......................................... 29
List of Figures
Figure 1. U.S. Grains, Oilseeds, and Related Product Exports to Mexico by Share of Volume, 2011 ............................................................................................................. 2 Figure 2. Mexican Rail Transportation System .............................................................................. 5 Figure 3. Transportation Modes for U.S. Grains, Oilseeds, and Related Product Exported to Mexico in 2011 ........................................................................................................... 7 Figure 4. Main Ports of Entry for U.S. Yellow Corn Exports to Mexico - 2011............................ 8 Figure 5. Main Ports of Entry for U.S. Soybean Exports to Mexico - 2011................................. 12 Figure 6. Main Ports of Entry for U.S. Sorghum Exports to Mexico - 2011 ................................ 14 Figure 7. Main Ports of Entry for U.S. Hard Wheat Exports to Mexico – 2011 .......................... 16 Figure 8. Main Ports of Entry for U.S. DDG from Corn Exports to Mexico - 2011 .................... 21

iii
Tracking U.S. Grain, Oilseed and Related Product Exports in Mexico
Executive Summary
What Is the Issue? U.S. grain, oilseed, and related product exports to Mexico averaged 22.2 million metric tons (mmt) per year from 2008-2012 with an average annual value of $7.3 billion. This is twenty percent more volume than the average of the early 2000s and two and a half times the value. Continued trade growth has spurred interest in how these products are transported throughout Mexico and how they are used. While much is known about the transportation and uses of U.S. grains and soybeans and related products within the United States, much less is known about how these U.S. commodities are transported within Mexico, their final destinations, and how they are used in Mexico. This study reports the destination, mode of transportation and end uses of U.S. grains, oilseeds, and related products (grain as a group) within the Mexican market. What Did the Study Find? Yellow corn, used mostly for animal feed and corn starch, is the largest volume export of these product categories, accounting for 35 percent in 2011. Soybeans, crushed for meal and oil, accounted for 13 percent, while hard wheat, used for human consumption, and grain sorghum, used for animal feeding, accounted for ten percent each. Together, these top four products accounted for 68 percent of the volume of U.S. grain and oilseeds exports to Mexico. Yellow corn also dominated export values to Mexico with 29 percent during 2011, followed by soybeans (20 percent), hard wheat (10 percent), and sorghum (8 percent). Outside these top four products, but still important, are dried distiller’s grain (DDG), high fructose corn syrup (HFCS), soybean meal, soft wheat, and rice. While most of the major products exported to Mexico have a long history of presence in the market, the emergence of DDG, HFCS, and soybean meal is relatively recent. Exports of these products to Mexico each grew more than five hundred percent since 2000. In total, fourteen product categories are covered in this report in various degrees of detail, based upon the availability of data. Four ports of entry handled 77 percent of the total U.S. grain exports by volume in 2011: Nuevo Laredo, Veracruz, Piedras Negras and Ciudad Juárez. The seaports of Progreso in Yucatan and Coatzacoalcos, as well as the land ports of Matamoros, Nogales, and Nuevo Progreso in Tamaulipas are also important gateways. Rail is the dominant mode of transport for U.S. grain entering Mexico, accounting for 14.78 mmt, or 62 percent of entry. Nearly all land ports of entry connect with a U.S. railroad with Nuevo Progreso being the only major port of entry which does not have rail access. Seaports are the second most dominant mode of entry for U.S. agricultural exports to Mexico, accounting for 8.11 mmt, or 34 percent. Based upon information from Mexican authorities, at least 42 percent of these imports leave the seaport area via rail while at least 17 percent leave via
iv
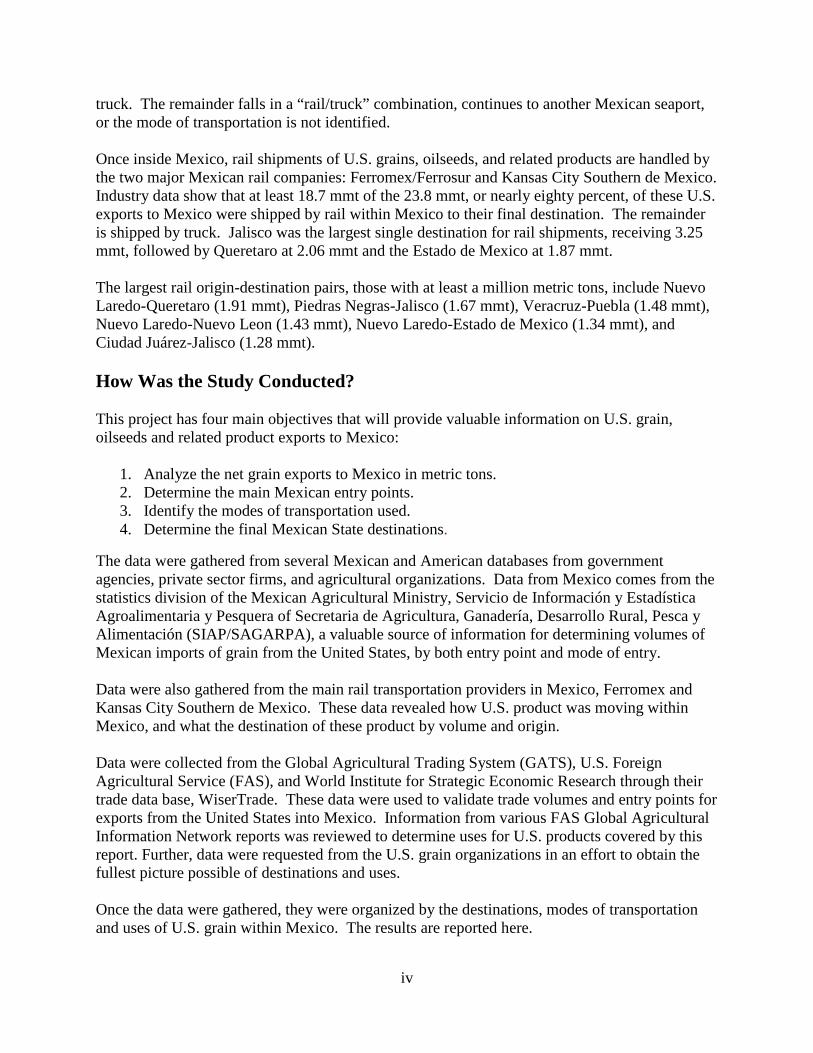
truck. The remainder falls in a “rail/truck” combination, continues to another Mexican seaport, or the mode of transportation is not identified. Once inside Mexico, rail shipments of U.S. grains, oilseeds, and related products are handled by the two major Mexican rail companies: Ferromex/Ferrosur and Kansas City Southern de Mexico. Industry data show that at least 18.7 mmt of the 23.8 mmt, or nearly eighty percent, of these U.S. exports to Mexico were shipped by rail within Mexico to their final destination. The remainder is shipped by truck. Jalisco was the largest single destination for rail shipments, receiving 3.25 mmt, followed by Queretaro at 2.06 mmt and the Estado de Mexico at 1.87 mmt. The largest rail origin-destination pairs, those with at least a million metric tons, include Nuevo Laredo-Queretaro (1.91 mmt), Piedras Negras-Jalisco (1.67 mmt), Veracruz-Puebla (1.48 mmt), Nuevo Laredo-Nuevo Leon (1.43 mmt), Nuevo Laredo-Estado de Mexico (1.34 mmt), and Ciudad Juárez-Jalisco (1.28 mmt).
How Was the Study Conducted?
This project has four main objectives that will provide valuable information on U.S. grain, oilseeds and related product exports to Mexico:
1. Analyze the net grain exports to Mexico in metric tons. 2. Determine the main Mexican entry points. 3. Identify the modes of transportation used. 4. Determine the final Mexican State destinations.
The data were gathered from several Mexican and American databases from government agencies, private sector firms, and agricultural organizations. Data from Mexico comes from the statistics division of the Mexican Agricultural Ministry, Servicio de Información y Estadística Agroalimentaria y Pesquera of Secretaria de Agricultura, Ganadería, Desarrollo Rural, Pesca y Alimentación (SIAP/SAGARPA), a valuable source of information for determining volumes of Mexican imports of grain from the United States, by both entry point and mode of entry. Data were also gathered from the main rail transportation providers in Mexico, Ferromex and Kansas City Southern de Mexico. These data revealed how U.S. product was moving within Mexico, and what the destination of these product by volume and origin. Data were collected from the Global Agricultural Trading System (GATS), U.S. Foreign Agricultural Service (FAS), and World Institute for Strategic Economic Research through their trade data base, WiserTrade. These data were used to validate trade volumes and entry points for exports from the United States into Mexico. Information from various FAS Global Agricultural Information Network reports was reviewed to determine uses for U.S. products covered by this report. Further, data were requested from the U.S. grain organizations in an effort to obtain the fullest picture possible of destinations and uses. Once the data were gathered, they were organized by the destinations, modes of transportation and uses of U.S. grain within Mexico. The results are reported here.

1
Tracking U.S. Grain, Oilseed and Related Product Exports in Mexico
Introduction
With the implementation of the North American Free Trade Agreement in 1994, trade
between Mexico and the United States has increased substantially. Between 2010 and 2011,
Mexican grain, oilseed, and related product (from this point, this product group will be referred
to as grain) imports from the United States increased 2.75 million metric tons (mmt) or 13
percent (table 1). Mexico is now the second largest grain importer in the world after Japan.
Table 1. U.S. Grain, Oilseed and Related Product Exports to Mexico, 2010 - 2011
Commodity 2010 2011
Volume (1,000 MT) % Value
($ Million) % Volume (1,000 MT) % Value
($ Million) %
Yellow Corn 7,274.9 35 $1,241.4 24 8,352.9 35 $2,343.0 29 Soybean 3,558.4 17 $1,424.3 27 3,203.0 13 $1,606.8 20 Hard Wheat 2,035.8 10 $469.4 9 2,431.9 10 $768.8 10 Sorghum 2,252.9 17 $396.6 8 2,421.9 10 $673.8 8 DDG from Corn 1,608.5 8 $273.4 5 1,811.8 8 $466.5 6 HFCS, 50-60 1,176.1 6 $356.3 7 1,420.4 6 $532.7 7 Soybean Meal 897.2 4 $290.5 6 1,172.6 5 $427.1 5 Soft Wheat 557.9 3 $118.7 2 969.6 4 $290.1 4 Rice, Paddy 773.9 4 $264.3 5 808.1 3 $270.3 3 White Corn 505.8 2 $106.0 2 589.0 2 $197.0 2 Soybean Oil, Crude 141.7 1 $127.0 2 296.3 1 $147.5 2 Milled Rice/Long Grain 54.4 <1 $31.7 1 100.9 <1 $60.7 1 Corn Meal 52.9 <1 $26.6 1 85.6 <1 $47.6 1 Corn for Popcorn 62.6 <1 $31.6 1 54.2 <1 $30.3 <1 Soybean Oil, Refined 53.3 <1 $51.9 1 39.4 <1 $53.6 1 Rape/Colza Meal 9.8 <1 $2.2 <1 35.9 <1 $7.8 <1 Other Rice (Semi-Milled) 11.2 <1 $10.3 <1 12.7 <1 $12.4 <1 Sunflower 9.5 <1 $9.4 <1 9.3 <1 $9.7 <1 Corn for Planting 6.7 <1 $18.6 <1 8.5 <1 $22.7 <1 Crude Rape/Colza Oil 6.2 <1 $5.7 <1 6.9 <1 $8.2 <1 DDG from Other Grain 7.5 <1 $1.3 <1 5.2 <1 $1.5 <1 Sunflower for Planting 0.031 <1 $1.1 <1 0.012 <1 $0.8 <1 Beet Sugar 0.000 0 $0.0 0 0.002 <1 $0.003 <1 Durum Wheat 11.2 <1 $1.6 <1 0.0 0 $0.0 0 TOTAL 21,068.4 100 $5,259.8 100 23,835.9 100 $7,979.3 100 Source: Servicio de Información Agroalimentaria y Pesquera (SIAP), SAGARPA, Mexico.
2
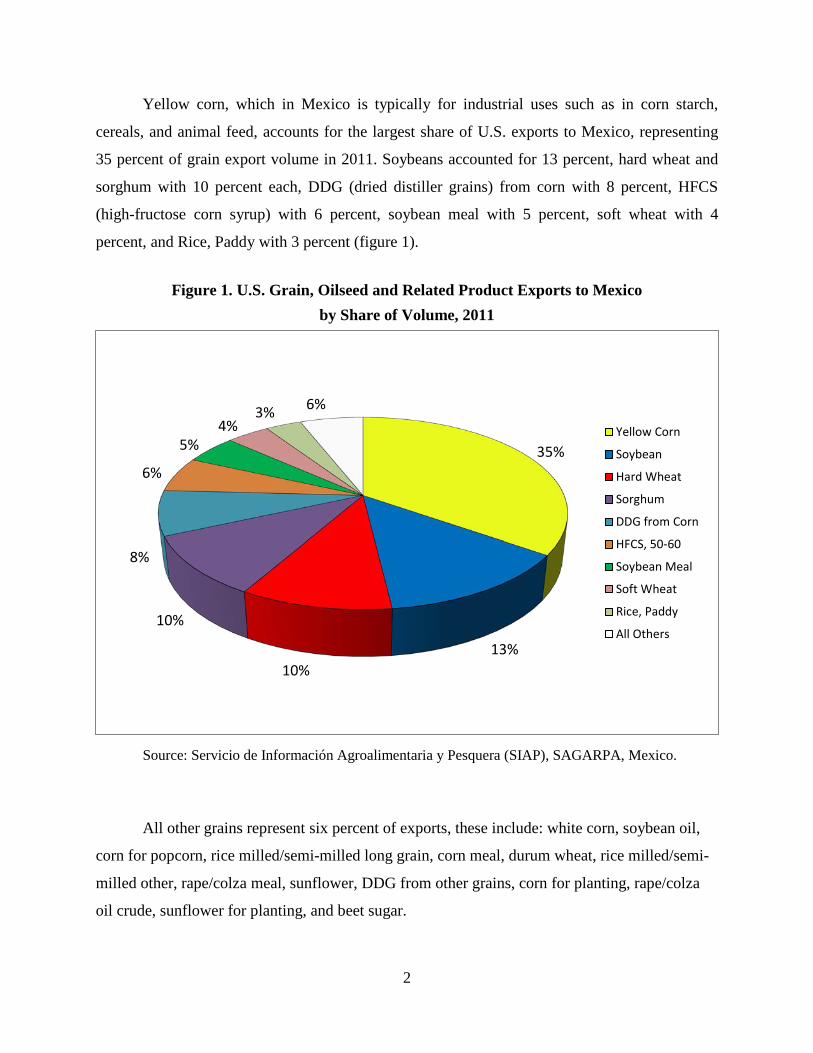
Yellow corn, which in Mexico is typically for industrial uses such as in corn starch,
cereals, and animal feed, accounts for the largest share of U.S. exports to Mexico, representing
35 percent of grain export volume in 2011. Soybeans accounted for 13 percent, hard wheat and
sorghum with 10 percent each, DDG (dried distiller grains) from corn with 8 percent, HFCS
(high-fructose corn syrup) with 6 percent, soybean meal with 5 percent, soft wheat with 4
percent, and Rice, Paddy with 3 percent (figure 1).
Figure 1. U.S. Grain, Oilseed and Related Product Exports to Mexico by Share of Volume, 2011
Source: Servicio de Información Agroalimentaria y Pesquera (SIAP), SAGARPA, Mexico.
All other grains represent six percent of exports, these include: white corn, soybean oil,
corn for popcorn, rice milled/semi-milled long grain, corn meal, durum wheat, rice milled/semi-
milled other, rape/colza meal, sunflower, DDG from other grains, corn for planting, rape/colza
oil crude, sunflower for planting, and beet sugar.
35%
13% 10%
10%
8%
6%
5% 4%
3% 6%
Yellow Corn
Soybean
Hard Wheat
Sorghum
DDG from Corn
HFCS, 50-60
Soybean Meal
Soft Wheat
Rice, Paddy
All Others

3
While much is known about processing U.S. grains and soybeans, information on
transportation modes and final market destination of these commodities in Mexico is not easily
available. This project has four main objectives that will provide valuable information on U.S.
grain exports to Mexico:
5. Analyze the net grain exports to Mexico in metric tons.
6. Determine the main Mexican entry points.
7. Identify the modes of transportation used.
8. Determine the final Mexican State destinations.
Data Description
The data used in this report was gathered from several Mexican and American databases
from government agencies, private sector firms, and agricultural organizations. Data from
Mexico comes from the statistics division of the Mexican Agricultural Ministry, Servicio de
Información y Estadística Agroalimentaria y Pesquera of Secretaria de Agricultura, Ganadería,
Desarrollo Rural, Pesca y Alimentación (SIAP/SAGARPA), which proved to be a valuable
source of information. This report also includes data from the main rail transportation providers
in Mexico. Data were also requested from the U.S. grain organizations in an effort to obtain the
fullest picture possible of destinations and uses.
After this introduction, the report includes a general description of the main ports of entry
of U.S. grain exports into Mexico and the main transportation modes used to move grain within
Mexico from ports of entry to destination. Analyses in various degrees of detail based upon data
availability were conducted of the following products:
• Yellow Corn
• Soybean
• Sorghum
• Hard Wheat
• Soybean Oil
• Corn for Popcorn
• Soft Wheat
• Paddy Rice
• Soybean Meal
• Dried Distillers Grain (DDG)
• High-Fructose Corn Syrup
• Canola Meal
• Sunflower Seeds
• White Corn

4
Ports of Entry and Transportation Modes for U.S. Grains Exports to Mexico
The Mexican transportation system that connects to the U.S. system includes land ports
of entry and ocean ports. The main land ports of entry and ocean ports are served both by
highway and rail networks. The Mexican rail system is privatized, and there are 2 main
concessionaires that operate the system: Kansas City Southern de Mexico (KCSM) and
Ferromex/Ferrosur.1
KCSM serves the following land and sea ports of entry:
• Nuevo Laredo/Laredo
• Matamoros/Brownsville
• Veracruz (Gulf Coast)
• Tampico, near Altamira (Gulf Coast)
• Lazaro Cardenas (Pacific Coast)
Ferromex/Ferrosur serves several land border crossings including:
• Piedras Negras/Eagle Pass
• Ojinaga/Presidio
• Ciudad Juárez/El Paso
• Nogales/Nogales
• Mexicali/Calexico
• Veracruz (Gulf Coast)
• Altamira (Gulf Coast)
• Coatzacoalcos (Gulf Coast)
• Guaymas (Pacific Coast)
• Mazatlan (Pacific Coast)
• Manzanillo (Pacific Coast)
1 Ferromex and Ferrosur merged and are now operating as a single company.

5
The port of Progreso in the Yucatán Peninsula has a short road connection to the
Chiapas-Mayab rail line. Figure 2 shows the main rail concessionaires and connecting land and
ocean ports. Please see Appendix A for a map of the Mexican highway system.
Figure 2. Mexican Rail Transportation System
The top four ports of entry handled 77 percent of the total U.S. grain exports by volume
in 2011: Nuevo Laredo, Veracruz, Piedras Negras, and Ciudad Juárez. Table 2 presents the
detailed breakdown by port of entry and Mexican state. Shipments data in this report are
organized and presented by Origin (Mexican entry port city) and Destination (Mexican State).
Please see Appendix B for a map of Mexico by state.

6
Table 2. Ports of Entry for U.S. Grains, Oilseeds and Related Products Exported to Mexico, 2010/2011
Border/Port Location Mexican State
Transport Mode Arriving in
Mexico
Transport Mode Leaving Mexican Customs
2010 Volume
1,000 MT
2010 Value U.S. $
(Million)
2011 Volume
1,000 MT
2011 Value U.S. $
(Million)
Nuevo Laredo Tamaulipas Rail Rail 5,008.5 $1,220.4 5,399.7 $1,726.6 Veracruz Veracruz Sea Rail/Truck 4,919.3 $1,258.9 5,367.3 $1,803.6 Piedras Negras Coahuila Rail Rail 3,255.8 $917.6 4,228.0 $1,478.2 Ciudad Juárez Chihuahua Rail Rail 3,238.4 $627.6 3,268.0 $1,036.6 Progreso Yucatán Sea Rail/Truck 1,315.7 $358.8 1,296.0 $456.6 Matamoros Tamaulipas Rail Rail 822.1 $282.3 822.7 $359.0 Coatzacoalcos Veracruz Sea Rail/Truck/Sea 724.4 $147.0 789.6 $246.0 Nogales Sonora Rail Rail 570.7 $154.1 736.2 $244.8 Nuevo Progreso Tamaulipas Truck Truck 456.4 $81.7 722.4 $202.1 Tuxpan Veracruz Sea Truck 396.9 $73.4 545.8 $166.2 Mexicali Baja California Rail Rail 121.4 $28.7 285.8 $92.1 Altamira Tamaulipas Sea Rail/Truck --- --- 53.2 $15.4 Mexicali Baja California Truck Truck 41.5 $18.5 49.9 $23.4 Lázaro Cárdenas Michoacán Sea Rail/Truck --- --- 49.7 $11.8 Reynosa Tamaulipas Truck Truck 30.9 $17.2 41.3 $24.5 Tijuana Baja California Rail Rail 38.5 $7.7 35.4 $9.9 Santa Teresa Chihuahua Truck Truck 28.7 $9.2 31.4 $11.4 Tijuana Baja California Truck Truck 29.8 $14.1 31.3 $17.8 Nogales Sonora Truck Truck 24.4 $11.3 29.1 $15.3 Nuevo Laredo Tamaulipas Truck Truck 21.4 $17.6 20.7 $19.0 Manzanillo Colima Sea Rail/Truck --- --- 12.3 $3.2 Zaragoza Chihuahua Truck Truck 6.9 $4.2 6.6 $3.5 Piedras Negras Coahuila Truck Truck 5.9 $1.1 3.6 $1.0 Ciudad Juárez Chihuahua Truck Truck 2.3 $3.0 2.5 $3.9 Matamoros Tamaulipas Truck Truck 4.4 $3.8 2.2 $3.7 Colombia Nuevo León Truck Truck 0.9 $0.9 2.0 $2.0 Ciudad Acuña Coahuila Truck Truck 2.1 $0.4 2.0 $0.6 Ciudad Camargo Tamaulipas Truck Truck 0.5 $0.1 0.9 $0.4 All Others Truck/Sea/Air Truck/Sea/Air 0.6 $0.4 0.3 $0.6 TOTAL 21,068.4 $5,259.8 23,835.9 $7,979.3 Source: Servicio de Información Agroalimentaria y Pesquera (SIAP), SAGARPA, Mexico. MT = metric tons.

7
Rail is the dominant mode of entry for U.S. grains, oilseeds and related products entering
Mexico, accounting for 14.78 mmt, or 62 percent (figure 3). Most land ports of entry through
which U.S. grains are shipped to Mexico have rail access, and products that enter via rail
continue on rail upon leaving Mexican Customs. The exceptions are Nuevo Progreso and
Reynosa in the state of Tamaulipas. Nuevo Laredo is the largest port of entry and is served by
KCSM on the Mexican side of the border and by Union Pacific (UP) and Kansas City Southern
on the U.S. side of the border. Piedras Negras is served by Ferromex on the Mexican side of the
border and UP on the U.S. side, while Ciudad Juárez is served by Ferromex in Mexico and
connects to the UP and BNSF on the U.S. side of the border.
Figure 3. Transportation Modes for U.S. Grains, Oilseeds and Products Exported to Mexico in 2011, Million Metric Tons and Percent of Share
Source: Servicio de Información Agroalimentaria y Pesquera (SIAP), SAGARPA, Mexico
Seaports are the second most dominant mode of entry for U.S. exports to Mexico,
accounting for 8.11 mmt, or 34 percent. Based upon information from Mexican rail
representatives, at least 42 percent of these imports leave the port area via rail. SIAP/SAGARPA
report at least 17 percent leave via truck. The remainder falls in a “rail/truck” combination,
continues to another Mexican seaport, or the mode of transportation is not declared. The Port of
Progreso has the highest truck movement within Mexico since it does not have a direct rail
connection and most of the grain stays in the Yucatán Peninsula for local consumption.
Only about four percent of U.S. exports of grains, oilseeds and related products enter
Mexico via truck, and they continue throughout Mexico in trucks. The main port for truck entry
is Nuevo Progreso, Tamaulipas, accounting for three-quarters of shipments, while Mexicali
accounts for 5.2 percent and Reynosa accounts for 4.3 percent.
14.78, 62%
8.11, 34%
0.95, 4%
Rail Sea TruckVolumes in Million MT

8
U.S. Yellow Corn Exports to Mexico and Modal Shares of Shipment
Yellow corn is one of the most traded grains between the United States and Mexico. The
U.S. exported 8.3 mmt of yellow corn to Mexico during 2011, 15 percent above the 7.3 mmt
exported in 2010. This grain enters Mexico mainly via rail, accounting for 72 percent entries.
Sea entries of U.S. corn into Mexico accounted for 25 percent while trucks accounted for the
remaining three percent.
The main ports of entry for this commodity are located on the border with Texas. Nuevo
Laredo is the most important port for yellow corn trade with 2.76 mmt; Ciudad Juárez on the
border with El Paso is second with 1.77 mmt. The third highest volume port of entry is
Veracruz; this seaport registered 1.30 mmt during 2011. Piedras Negras is fourth with 1.15 mmt.
The seaport of Progreso is fifth with 329.9 thousand metric tons (tmt) (figure 4). Please note that
the circles on Figure 4 and similar maps denote relative magnitudes of volume moving through
the port.
Figure 4. Main Ports of Entry for U.S. Yellow Corn Exports to Mexico - 2011
Source: Servicio de Información Agroalimentaria y Pesquera (SIAP), SAGARPA, Mexico
U.S. yellow corn entering Mexico via rail stayed on rail to their final destination while
corn entering via truck remained on trucks. Corn entering via seaport was then loaded onto rail

9
or trucks before continuing to its final destination. This is almost always the case for all U.S.
commodities entering Mexico. Detailed data provided by the U.S. rail industry follows.
For rail shipments, Querétaro is the state of destination for the highest volume of yellow
corn (1.83 mmt), followed by Jalisco 1.38 mmt, Estado de Mexico with 1.07 mmt, and Durango
with 742.4 tmt (table 3). These 4 locations account for about 69 percent of the total U.S. yellow
corn exports to Mexico. No other states received more than 374 tmt.
Table 3. 2011 Rail Shipments of U.S. Yellow Corn within Mexico, Metric Tons Origin
Destination
Mexicali Ciudad
Juarez Piedras Negras
Nogales
Coatzacoalcos
Veracruz
Nuevo Laredo Total
Aguascalientes -- -- 3,786 -- -- -- 214,035 217,821
Baja California 52,184 -- 6,613 -- -- -- -- 58,797 Chiapas -- -- -- -- 14,795 3,421 -- 18,217 Chihuahua -- 49,546 1,533 -- -- -- -- 51,080 Coahuila -- 292,580 52,049 -- -- -- 29,165 373,793
Distrito Federal -- -- 17,018 1,520 18,538 Durango -- 480,183 262,193 -- -- -- -- 742,376 Estado de Mexico -- 38,741 -- 4,581 261,960 767,505 1,072,787 Guanajuato -- 33,212 18,379 -- -- 14,078 -- 65,670
Hidalgo -- 6,888 547 -- 39,692 -- 47,127 Jalisco -- 723,747 648,397 -- -- 2,073 7,505 1,381,722 Michoacan -- 10,561 -- -- -- -- -- 10,561 Morelos -- -- -- -- -- 1,252 -- 1,252
Nayarit 272 -- -- -- -- -- -- 272 Nuevo Leon -- -- -- -- -- -- 301,815 301,815 Puebla -- -- -- -- 962 314,993 -- 315,955 Queretaro -- 104,011 20,906 -- -- -- 1,703,445 1,828,362
San Luis Potosi -- -- -- -- -- -- 153,520 153,520 Sinaloa -- -- -- 62,132 -- -- -- 62,132 Sonora -- -- -- 136,930 -- -- -- 136,930 Tabasco -- -- -- -- -- 3,591 -- 3,591
Tamaulipas -- -- -- -- -- -- 9,500 9,500 Tlaxcala -- -- -- -- 4,480 12,751 -- 17,232 Veracruz -- -- -- -- 165,115 168,216 35,910 369,241
Total 52,456 1,693,840 1,059,487 199,609 189,935 839,046 3,223,920 7,258,292 Source: Mexican Rail Industry

10
The top origin-destination rail transportation pairs can be found in Table 4. Nuevo
Laredo-Queretaro moves more than twice as much yellow corn as the second highest pair of
Nuevo Laredo-Estado de Mexico. Ciudad Juarez-Jalisco, Piedras Negras-Jalisco, and Ciudad
Juarez-Durango complete the top five pairs, which account for 60 percent of the yellow corn
trade. The top 16 of the 48 total rail origin-destination pairs account for 92.3 percent of rail
shipments.
Table 4. Top Origin-Destination Pairs for Rail Shipments of U.S. Yellow Corn within Mexico, 2011 Origin Destination Metric Tons Nuevo Laredo Queretaro 1,703,445 Nuevo Laredo Estado de Mexico 767,505 Ciudad Juarez Jalisco 723,747 Piedras Negras Jalisco 648,397 Ciudad Juarez Durango 480,183 Veracruz Puebla 314,993 Nuevo Laredo Nuevo Leon 301,815 Ciudad Juarez Coahuila 292,580 Piedras Negras Durango 262,193 Veracruz Estado de Mexico 261,960 Nuevo Laredo Aguascalientes 214,035 Veracruz Veracruz 168,216 Coatzacoalcos Veracruz 165,115 Nuevo Laredo San Luis Potosi 153,520 Nogales Sonora 136,930 Ciudad Juarez Queretaro 104,011 All Others (32 Additional Pairs)
559,647
Total 7,258,292 Source: Mexican Rail Industry
Uses of U.S. Yellow Corn Exports to Mexico
According to a March 2010 USDA Foreign Agricultural Service report, yellow corn is
mainly used to produce cornstarch, cereals, and animal feed in Mexico. About half of yellow
corn is used to feed livestock and another quarter or more is used to produce cornstarch. Cereals,
while important, account for much of the remainder of yellow corn use in Mexico with some
being used for flour and snacks. These proportions are similar to 2004 data reported by
SAGARPA, in which 54.1 percent was used for feeding, 36.5 percent for corn starch, and the

11
remainder for flour, cereals, and snacks. However, SAGARPA no longer reports these data in
the same format, so the approximations from 2010 are the most recent data on which to estimate
Mexican use of U.S. yellow corn. As a result, it is estimated that about 4.2 mmt of U.S. yellow
corn is used as animal feed, 2.1 mmt for corn starch, and the remainder for other uses (table 5).
Table 5. Uses of U.S. Corn Exports to Mexico Uses 1,000 MT Percentage
Animal Feeding 4,176.5 50
Corn Starch 2,088.2 25
Other 2,088.2 25
Total 8,352.9 100.0 Source: Servicio de Información Agroalimentaria y Pesquera (SIAP), SAGARPA, Mexico.
U.S. Soybean Exports to Mexico and Modal Shares of Shipment
The United States exported 3.2 mmt of soybeans to Mexico during 2011, down 10
percent from 3.6 mmt in 2010 (SAGARPA). As with corn, soybeans enter Mexico mainly via
rail, accounting for 67.7 percent entries. Sea entries of U.S. corn into Mexico accounted for 31.8
percent while trucks accounted for the remaining half percent. In 2011, the major entry points
within Mexico for U.S. soybeans were Piedras Negras with 845.7 tmt, followed by Veracruz
(697.8 tmt), Matamoros (643.0 tmt), Ciudad Juárez (380.3 tmt), and Nuevo Laredo (298.8 tmt)
(figure 5).
Rail transportation data collected indicates that 2.8 mmt of U.S. soybeans were
transported via rail within Mexico in 2011. This amounts to a rail modal share of 89 percent of
the total U.S. soybean exported to Mexico in 2011. The remaining 11 percent travel to their final
destination via truck. All these exports were crushed into meal and oil in Mexico. The main
destinations for U.S. soybeans via rail are Tamaulipas, which accounts for 609.0 tmt, Guanajuato
with 458.4 tmt, Hidalgo with 425.1 tmt, Coahuila with 309.4 tmt, and Jalisco with 300.0 tmt
(table 6). These top destinations represent 74 percent of the exports.
The top 12 origin-destination rail pairs accounted for 93.5 percent of Mexican rail
shipments of U. S. soybeans during 2011 (table 7). The leading pair was Nuevo Laredo-
Tamaulipas with 609.0 tmt, or all of the soybean rail shipments which stayed in Tamaulipas.
Other leading origin-destination pairs include Piedras Negras-Guanajuato (338.0 tmt), Veracruz-
Hidalgo (264.7 tmt), and Nuevo Laredo-Nuevo Leon (234.5 tmt). For rail shipments entering

12
Figure 5. Main Ports of Entry for U.S. Soybean Exports to Mexico - 2011
Source: Servicio de Información Agroalimentaria y Pesquera (SIAP), SAGARPA, Mexico
Table 6. 2011 Rail Shipments of U.S. Soybeans within Mexico, Metric Tons Origin
Destination Ciudad
Juarez Piedras Negras Veracruz
Nuevo Laredo Total
Aguascalientes -- -- -- 1,425 1,425 Chihuahua 195 -- -- -- 195 Coahuila 95,066 214,401 -- -- 309,467 Distrito Federal -- -- -- 190 190 Durango 20,756 83,233 -- -- 103,989 Guanajuato 59,958 337,994 -- 60,420 458,371 Hidalgo 40,126 119,387 264,678 950 425,141 Jalisco 143,538 156,214 -- -- 299,752
Nuevo Leon -- -- -- 234,460 234,460 Puebla -- -- 173,123 -- 173,123
San Luis Potosi -- -- -- 1,900 1,900 Tamaulipas -- -- -- 609,045 609,045
Veracruz -- -- 227,569 -- 227,569 Total 359,638 911,229 665,370 908,390 2,844,627 Source: Mexican Rail Industry

13
Mexico via rail from Laredo into Nuevo Laredo, 93 percent stay in close proximity to their entry,
whether staying in Tamaulipas or in neighboring Nuevo Leon, while grain entering through
Juarez, Piedras Negras, and Veracruz has a much more diverse distribution throughout Mexico.
U.S. Sorghum Exports to Mexico and Modal Shares of Shipment
The United States exported 2.42 mmt of sorghum to Mexico during 2011, 7.5 percent
higher than the 2.25 mmt exported in 2010 (SIAP). Most sorghum enters Mexico via seaports,
accounting for 56.7 percent entries. Rail entries of U.S. sorghum into Mexico accounted for 22.1
percent while trucks accounted for the remaining 19.7 percent. Most U.S. sorghum exports enter
Mexico through the seaport of Veracruz, accounting for 961.7 tmt of sorghum imports during
2011 (figure 6). Nuevo Progreso, across from Progreso, Texas, is the second largest point of
entry with 475.9 tmt during 2011 and is the only port of entry to use only truck entries. Other
important ports of entry are Ciudad Juárez (300.2 tmt), the seaport of Progreso in Yucatan (262.7
tmt), and Piedras Negras (143.5 tmt).
Table 7. Top Origin-Destination Pairs for Rail Shipments of U.S. Soybeans within Mexico, 2011
Origin Destination Metric Tons Nuevo Laredo Tamaulipas 609,045 Piedras Negras Guanajuato 337,994 Veracruz Hidalgo 264,678 Nuevo Laredo Nuevo Leon 234,460 Veracruz Veracruz 227,569 Piedras Negras Coahuila 214,401 Veracruz Puebla 173,123 Piedras Negras Jalisco 156,214 Ciudad Juarez Jalisco 143,538 Piedras Negras Hidalgo 119,387 Ciudad Juarez Coahuila 95,066 Piedras Negras Durango 83,233 All Others (10 Additional Pairs) 185,919 Total
2,844,627
Source: Mexican Rail Industry

14
Figure 6. Main Ports of Entry for U.S. Sorghum Exports to Mexico - 2011
Source: Servicio de Información Agroalimentaria y Pesquera (SIAP), SAGARPA, Mexico
Sorghum is used exclusively to feed animals in Mexico. According to Mexican rail
industry representatives, at least 43.5 percent of U.S. sorghum travels throughout Mexico via
rail. Thus, more than half, 56.5 percent, is transported to its final destination within Mexico via
truck. Only rail shipments will be discussed here. The top destination for U.S. sorghum exports
to Mexico was Puebla, accounting for 464.1 tmt of shipments (table 8). Other leading
destinations were Veracruz with 349.9 tmt and Jalisco with 106.8 tmt. Together, these three
destinations accounted for 87 percent of U.S. sorghum exports to Mexico transported via rail.
The top nine origin-destination pairs account for 93.2 percent of rail shipments of U.S.
sorghum within Mexico. Veracruz-Puebla (464.0 tmt) and Veracruz-Veracruz (144.1 tmt) led
the way. Closely behind was Nuevo Laredo-Veracruz with 143.5 tmt. These top three origin-
destination pairs accounted for 71 percent of rail shipments.
While truck transport origin-destination pairs are not specifically addressed here, it is
important to note that all U.S. sorghum entering Mexico at Nuevo Progreso via truck (475.9 tmt)
and Progreso, Yucatan via ocean ship (262.7 tmt) leave both port areas via truck. Further, about
310.4 tmt of sorghum entering through Veracruz is also shipped to its final destination via truck.
Truck shipments likely stay in their states of entry or very close by since rail would be more
efficient for longer distances.

15
Table 8. 2011 Rail Shipments of U.S. Sorghum within Mexico, Metric Tons Origin
Destination Ciudad Juarez
Piedras Negras
Coatzacoalcos Veracruz
Nuevo Laredo Total
Aguascalientes -- -- -- -- 4,655 4,655 Chiapas -- -- -- 268 -- 268 Chihuahua 180 -- -- -- -- 180 Distrito Federal -- -- -- 14,240 665 14,905
Durango -- -- -- -- 4,275 4,275 Estado de Mexico -- -- -- 4,610 29,070 33,680
Guanajuato -- -- -- 2,017 -- 2,017 Jalisco 22,334 77,540 -- -- 6,935 106,808 Morelos -- -- -- 7,872 -- 7,872
Nuevo Leon -- -- -- -- 18,050 18,050 Puebla -- -- -- 463,984 95 464,079 Queretaro -- -- -- -- 11,875 11,875
San Luis Potosi -- -- -- -- 20,710 20,710 Tlaxcala -- -- -- 14,240 -- 14,240 Veracruz -- -- 62,243 144,087 143,545 349,874
Total 22,514 77,540 62,243 651,319 239,875 1,053,490 Source: Mexican Rail Industry
Table 9. Top Origin-Destination Pairs for Rail Shipments of U.S. Sorghum within Mexico, 2011 Origin Destination Metric Tons Veracruz Puebla 463,984 Veracruz Veracruz 144,087 Nuevo Laredo Veracruz 143,545 Piedras Negras Jalisco 77,540 Coatzacoalcos Veracruz 62,243 Nuevo Laredo Estado de Mexico 29,070 Ciudad Juarez Jalisco 22,334 Nuevo Laredo San Luis Potosi 20,710 Nuevo Laredo Nuevo Leon 18,050 All Others (13 Additional Pairs) 71,927 Total
1,053,490
Source: Mexican Rail Industry

16
U.S. Hard Wheat Exports to Mexico and Modal Shares of Shipment
The U.S. exported 2.4 mmt of hard wheat to Mexico during 2011, up almost 20 percent
from 2.03 mmt in 2010. Seaport entries account for 55.5 percent of U.S. hard wheat exports to
Mexico with 44.5 percent entering via rail and negligible amounts entering via truck.
About 42 percent of U.S. wheat exports entered Mexico through the seaport of Veracruz.
This port registered an entry of 1.01 mmt of hard wheat during 2011 (figure 7). Veracruz is the
largest point of entry, moving twice as much volume as the second largest point of entry. Nuevo
Laredo, the second largest port by volume, registered 471.8 tmt. Rounding out the top five
during 2011 are Ciudad Juárez with 266.2 tmt, the seaport of Tuxpan with 222.8 tmt, and Piedras
Negras with 167.1 tmt.
Figure 7. Main Ports of Entry for U.S. Hard Wheat Exports to Mexico – 2011
Source: Servicio de Información Agroalimentaria y Pesquera (SIAP), SAGARPA, Mexico
Collected data for rail transportation amounted to 3.1 mmt of U.S. wheat exports to
Mexico during 2011. This is above the 2.4 mmt reported by SIAP, in large part due to the
difference between what SIAP reported for Nuevo Laredo (471.8 tmt) and what the rail industry
reported (1.24 mmt). Truck was reported by SIAP as a mode of transportation within Mexico for
minimal amounts of U.S. hard wheat, 18.6 tmt in total or about 0.8 percent.

17
The major entry points for U.S. wheat shipped by rail in this year were Nuevo Laredo at
471.8 tmt (or 1.24 mmt from the rail industry), Ciudad Juárez with 286.2 tmt, and Piedras Negras
with 167.1 tmt. Furthermore, the vast majority of the hard wheat shipped from the seaports was
shipped via rail.
The leading destination for U.S. hard wheat shipped by rail within Mexico was the city of
Mexico City (D.F.), with 619.5 tmt, followed closely by the Estado de Mexico with 604.4 tmt
(table 10). The third largest destination was state of Puebla with a total quantity of 468.9 tmt,
which was followed by Nuevo Leon at 380.6 tmt and Veracruz at 146.2 tmt. The top origin-
destination pairs were Nuevo Laredo-Estado of Mexico, Veracruz-Puebla, Nuevo Laredo-Nuevo
Leon, and Veracruz-Mexico City, and Nuevo Laredo-Mexico City (table 11). These five pairs
accounted for over sixty percent of rail shipments of U.S. wheat within Mexico, and the top 14
accounted for 85.3 percent.
Table 10. 2011 Rail Shipments of U.S. Hard Wheat within Mexico, Metric Tons Origin
Destination
Mexicali Ciudad
Juarez Piedras Negras
Nogales
Coatzacoalcos Veracruz
Nuevo Laredo Total
Aguascalientes -- -- -- -- -- 21,310 22,420 43,730 Baja California 12,893 -- 1,105 -- -- -- -- 13,998 Campeche -- -- -- 2,898 7,083 -- 9,981 Chiapas -- -- -- 7,303 32,043 -- 39,345 Chihuahua -- 48,134 -- -- -- -- 48,134 Coahuila -- 8,692 90,630 -- -- -- -- 99,322 Distrito Federal -- 7,904 -- -- 358,644 252,985 619,533 Durango -- 31,109 3,622 -- -- 2,375 37,106 Estado de Mexico -- 45,427 -- -- 81,643 477,375 604,445 Guanajuato -- 30,688 31,121 -- -- 80,355 11,970 154,134 Jalisco -- 84,813 71,796 -- -- 79,640 -- 236,250 Michoacan -- -- 34,043 -- -- 2,957 -- 36,999 Nuevo Leon -- 1,505 3,632 -- -- -- 375,440 380,577 Puebla -- 7,490 8,966 -- -- 447,563 4,845 468,864 Queretaro -- -- -- -- -- 4,039 34,295 38,334 Sonora -- -- 9,782 82,987 -- -- -- 92,770 Tlaxcala -- -- -- -- -- 14,939 -- 14,939 Veracruz -- -- -- -- -- 84,627 61,560 146,187
Total 12,893 265,762 254,697 82,987 10,200 1,214,843 1,243,265 3,084,648 Source: Mexican Rail Industry; Note: Veracruz includes the Port of Tuxpan

18
Table 11. Top Origin-Destination Pairs for Rail Shipments of U.S. Hard Wheat within Mexico, 2011 Origin Destination Metric Tons
Nuevo Laredo Estado de Mexico 477,375 Veracruz Puebla 447,563 Nuevo Laredo Nuevo Leon 375,440 Veracruz Distrito Federal 358,644 Nuevo Laredo Distrito Federal 252,985 Piedras Negras Coahuila 90,630 Ciudad Juarez Jalisco 84,813 Veracruz Veracruz 84,627 Nogales Sonora 82,987 Veracruz Estado de Mexico 81,643 Veracruz Guanajuato 80,355 Veracruz Jalisco 79,640 Piedras Negras Jalisco 71,796 Nuevo Laredo Veracruz 61,560 All Others (29 Additional Pairs) 454,590 Total
3,084,648
Source: Mexican Rail Industry
Uses of U.S. Wheat Exports to Mexico
As it is with nearly all wheat in Mexico, U.S. wheat exports to Mexico are used almost
exclusively for human consumption in Mexico. Foreign Agricultural Service reported no more
than eight percent is used for feed. If that holds for U.S. wheat in Mexico, then Table 12 shows
that 2.24 mmt was used for human consumption while 194.6 tmt was used to feed animals.
Table 12. Uses of U.S. Wheat Exports to Mexico Uses 1,000 MT Percentage
Human Consumption 2,237.3 92
Animal Feeding 194.6 8
Total 2,431.9 100
Source: Foreign Agricultural Service, USDA

19
U.S. Rice Exports to Mexico and Modal Shares of Shipment
The United States exported 808.8 tmt of paddy rice (unmilled) to Mexico during 2011.
Nearly three-quarters of U.S. paddy rice exports to Mexico, 72.5 percent, entered via seaports
while 27.5 percent entered via rail. Only 49 mt entered via truck.
The largest port of entry for U.S. paddy rice exports to Mexico was the Port of Veracruz
with 560.6 tmt, or 69 percent of total imports (table 13). Nuevo Laredo was the only other
significant Mexican port for rice imports with 176.0 tmt. All rice is used for human
consumption.
Table 13. Main Ports of Entry for U.S. Paddy Rice Exports to Mexico – 2011 Port of Entry Metric Tons Veracruz 560,565 Nuevo Laredo 175,992 Piedras Negras 39,775 Coatzacoalcos 24,982 Ciudad Juarez 6,707 Others 49 Total 808,770
Source: Servicio de Información Agroalimentaria y Pesquera (SIAP), SAGARPA, Mexico.
There was also 113.6 tmt of milled U.S. rice exported to Mexico. Thus, a total of 922.4
tmt of U.S. rice was exported to Mexico in 2011. Nuevo Laredo (43.1 tmt), Piedras Negras (32.1
tmt) and Mexicali (12.3 tmt) accounted for the bulk of these milled rice shipments.
Rail shipments of rice within Mexico account for 749.7 tmt of U.S. exports. This likely
includes both paddy rice and milled rice exports shipped within Mexico by rail. Therefore, 81.3
percent of total U.S. rice exports to Mexico continued to their final destination via rail while the
remaining 18.7 percent were transported via truck. The leading Mexican destination for U.S.
rice was Veracruz with a total quantity of 257.5 tmt (table 14). The second largest destination
was Nuevo Leon with 177.0 tmt, followed by the Estado de Mexico with 109.0 tmt and
Guanajuato with 94.3 tmt.
The top origin-destination pair for paddy rice rail shipments was Veracruz-Veracruz, with
244.5 tmt, followed by Nuevo Laredo-Nuevo Leon (177.0 tmt), Veracruz-Estado de Mexico
(85.6 tmt), and Veracruz-Puebla (81.0 tmt) (table 15). The top seven origin-destination pairs
account for 93.5 percent of rail shipments of U.S. rice within Mexico.

20
Table 15. Top Origin-Destination Pairs for Rail Shipments of U.S. Rice within Mexico, 2011 Origin Destination Metric Tons Veracruz Veracruz 244,517 Nuevo Laredo Nuevo Leon 177,030 Veracruz Estado de Mexico 85,592 Veracruz Puebla 80,960 Piedras Negras Guanajuato 57,423 Veracruz Guanajuato 36,881 Nuevo Laredo Estado de Mexico 18,450 Others (14 Additional Pairs) 48,813 Total
749,666
Source: Mexican Rail Industry
Table 14. 2011 Rail Shipments of U.S. Rice within Mexico, Metric Tons Origin
Destination
Mexicali Ciudad
Juarez Piedras Negras
Coatzacoalcos Veracruz
Nuevo Laredo Total
Baja California 917 -- -- -- -- -- 917 Chihuahua -- 279 -- -- -- -- 279 Coahuila -- -- 4,213 -- -- -- 4,213 Colima -- -- 1,354 -- -- -- 1,354 Durango -- -- 3,646 -- -- -- 3,646 Estado De Mexico -- -- 181 4,756 85,592 18,450 108,979 Guanajuato -- -- 57,423 -- 36,881 -- 94,304 Jalisco -- -- 2,909 -- -- -- 2,909
Nuevo Leon -- -- -- -- -- 177,030 177,030 Puebla -- -- -- -- 80,960 -- 80,960 Sinaloa -- 6,661 80 -- -- -- 6,741 Tabasco -- -- -- -- 8,631 -- 8,631
Veracruz -- -- -- 8,435 244,517 4,500 257,452 Yucatan -- -- -- -- -- 2,250 2,250 Total 917 6,940 69,807 13,191 456,581 202,230 749,666 Source: Mexican Rail Industry
21
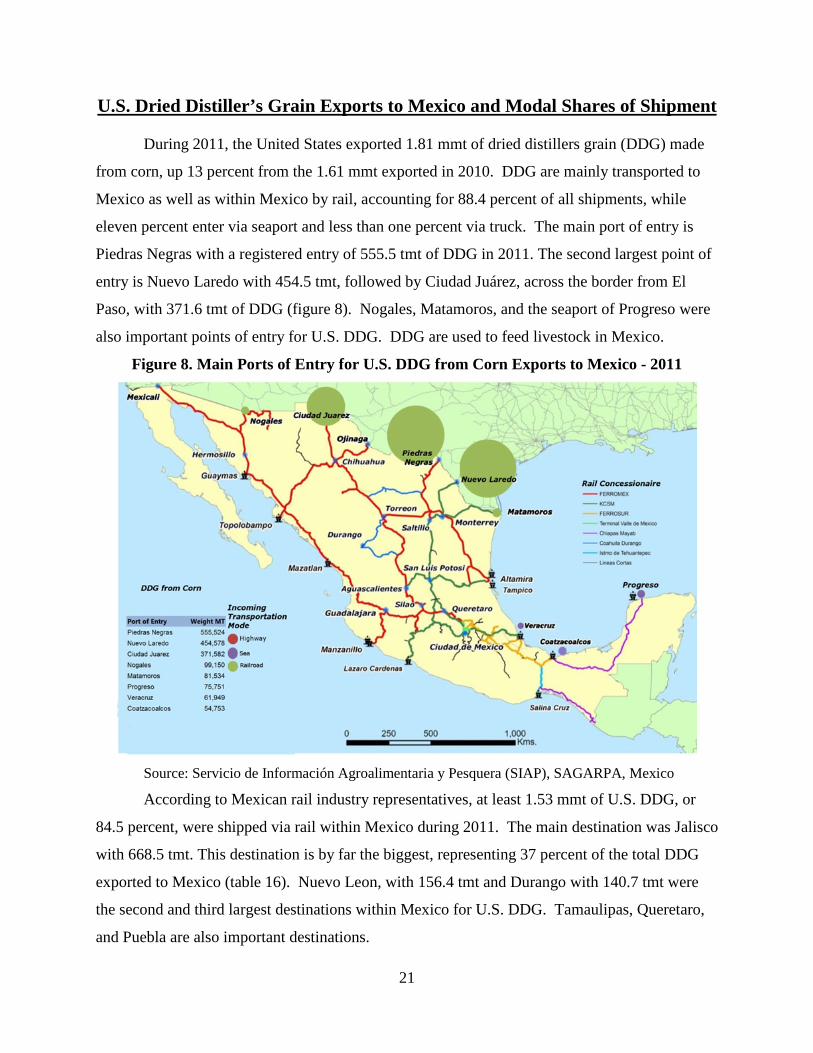
U.S. Dried Distiller’s Grain Exports to Mexico and Modal Shares of Shipment
During 2011, the United States exported 1.81 mmt of dried distillers grain (DDG) made
from corn, up 13 percent from the 1.61 mmt exported in 2010. DDG are mainly transported to
Mexico as well as within Mexico by rail, accounting for 88.4 percent of all shipments, while
eleven percent enter via seaport and less than one percent via truck. The main port of entry is
Piedras Negras with a registered entry of 555.5 tmt of DDG in 2011. The second largest point of
entry is Nuevo Laredo with 454.5 tmt, followed by Ciudad Juárez, across the border from El
Paso, with 371.6 tmt of DDG (figure 8). Nogales, Matamoros, and the seaport of Progreso were
also important points of entry for U.S. DDG. DDG are used to feed livestock in Mexico.
Figure 8. Main Ports of Entry for U.S. DDG from Corn Exports to Mexico - 2011
Source: Servicio de Información Agroalimentaria y Pesquera (SIAP), SAGARPA, Mexico
According to Mexican rail industry representatives, at least 1.53 mmt of U.S. DDG, or
84.5 percent, were shipped via rail within Mexico during 2011. The main destination was Jalisco
with 668.5 tmt. This destination is by far the biggest, representing 37 percent of the total DDG
exported to Mexico (table 16). Nuevo Leon, with 156.4 tmt and Durango with 140.7 tmt were
the second and third largest destinations within Mexico for U.S. DDG. Tamaulipas, Queretaro,
and Puebla are also important destinations.

22
Table 16. 2011 Rail Shipments of U.S. DDG within Mexico, Metric Tons Origin
Destination Mexicali Ciudad Juarez
Piedras Negras Nogales
Nuevo Laredo Total
Aguascalientes -- -- -- -- 37,430 37,430 Baja California 6,890 -- 253 -- -- 7,144 Chihuahua -- 18,497 1,339 -- -- 19,836 Coahuila -- -- 10,176 -- -- 10,176
Distrito Federal -- -- -- 8,455 8,455 Durango -- 20,290 120,202 -- 190 140,682
Estado de Mexico -- -- -- 43,225 43,225 Guanajuato -- 4,089 12,993 -- 31,065 48,147 Jalisco -- 305,542 358,642 -- 4,275 668,460 Michoacan -- 9,159 25,674 -- -- 34,833
Nuevo Leon -- -- -- -- 156,370 156,370 Puebla -- -- 1,488 -- 49,780 51,268 Queretaro -- -- 4,356 -- 66,120 70,476
San Luis Potosi -- -- -- -- 29,640 29,640 Sinaloa -- -- 1,472 53,716 -- 55,188 Sonora -- -- 1,027 38,879 -- 39,906
Tamaulipas -- -- -- -- 90,820 90,820 Tlaxcala -- -- -- -- 5,320 5,320 Veracruz -- -- -- -- 9,975 9,975 Total 6,890 357,578 537,622 92,595 532,665 1,527,351 Source: Mexican Rail Industry
Piedras Negras-Jalisco, Juarez-Jalisco, Nuevo Laredo-Nuevo Leon, and Piedras Negras-
Durango were the most common origin-destination pairs for rail shipments of U.S. DDG within
Mexico (table 17). Together, these four pairs account for 62 percent of all such rail shipments
while the top twelve origin-destination pairs account for nearly ninety percent of rail shipments
of DDG in Mexico.

23
Table 17. Top Origin-Destination Pairs for Rail Shipments of U.S. DDG within Mexico, 2011 Origin Destination Metric Tons Piedras Negras Jalisco 358,642 Ciudad Juarez Jalisco 305,542 Nuevo Laredo Nuevo Leon 156,370 Piedras Negras Durango 120,202 Nuevo Laredo Tamaulipas 90,820 Nuevo Laredo Queretaro 66,120 Nogales Sinaloa 53,716 Nuevo Laredo Puebla 49,780 Nuevo Laredo Estado de Mexico 43,225 Nogales Sonora 38,879 Nuevo Laredo Aguascalientes 37,430 Nuevo Laredo Guanajuato 31,065 Others (20 Additional Pairs) 157,560 Total
1,527,351
Source: Mexican Rail Industry
U.S. Soybean Meal Exports to Mexico and Modal Shares of Shipment
The United States exported 1.17 mmt of soybean meal to Mexico during 2011, up 30
percent from the 897.2 tmt in 2010. Nearly all of these soybean meal exports, 95.9 percent, enter
Mexico via rail, while a little over three percent enter by seaport and just 0.2 percent enters on
trucks. Three major entry points for U.S. soybean meal shipped to Mexico accounted for more
than 90 percent of the total, with Piedras Negras capturing 44 percent of the total or 518.2 tmt,
followed by Nogales with 335.1 tmt (29 percent), and Nuevo Laredo with 219.7 tmt (19 percent)
(table 18). Coatzacoalcos and Juarez are also important entry points for U.S. soybean meal into
Mexico. Soybean meal is used to feed livestock in Mexico.
Table 18. Main Ports of Entry for U.S. Soybean Meal Exports to Mexico – 2011 Port of Entry Metric Tons Piedras Negras 518,261 Nogales 335,095 Nuevo Laredo 219,729 Coatzacoalcos 45,865 Ciudad Juarez 36,028 Others 17,613 Total 1,172,592
Source: Servicio de Información Agroalimentaria y Pesquera (SIAP), SAGARPA, Mexico.

24
Rail shipments accounted for the vast majority of the intra-Mexican shipments of U.S.
soybean meal exported in 2011 as all soybean meal entering by rail and seaport continue on rail
to their final destination. Table 19 shows a total of 1.38 mmt of U.S. soybean meal shipped by
rail throughout Mexico. There are two possible reasons for this. The first is that Nuevo Laredo
data includes soybean crude oil. The second is that some of this volume is soybean meal
processed from U.S. soybeans shipped to Mexico. As a result, rail industry representatives
report about 205 tmt more in soybean meal shipments than show up in official SIAP numbers
The leading destination for U.S. soybean meal was the state of Jalisco with 358.4 tmt,
followed by Sonora with 275.6 tmt, Durango with 112.9 tmt, and Sinaloa with 104.3 tmt (table
19). These four destinations account for 62 percent of U.S. soybean meal transported by rail
within Mexico. Meanwhile, truck transportation of soybean meal is minimal at 1.8 tmt
Table 19. 2011 Rail Shipments of U.S. Soybean Meal within Mexico, Metric Tons Origin
Destination Mexicali Ciudad
Juarez Piedras Negras Nogales
Coatzacoalcos
Nuevo Laredo Total
Aguascalientes -- -- 20,134 -- -- 63,650 83,784 Baja California 8,562 -- -- -- -- 8,562 Chihuahua -- 28,093 809 -- -- -- 28,902 Coahuila 573 -- 30,865 -- -- 8,170 39,607
Distrito Federal -- -- -- -- 5,795 5,795 Durango -- -- 112,915 -- -- -- 112,915
Estado de Mexico -- -- -- -- 3,420 3,420 Guanajuato -- -- 11,204 -- -- -- 11,204 Jalisco -- -- 358,068 374 -- -- 358,442 Michoacan -- -- 21,219 -- -- -- 21,219 Nayarit -- -- 11,492 -- -- -- 11,492 Nuevo Leon -- -- 568 -- -- 65,645 66,213 Puebla -- -- -- -- 11,780 11,780 Queretaro -- -- 18,023 -- -- 66,975 84,998
San Luis Potosi -- -- -- -- 45,220 45,220 Sinaloa -- -- 7,432 96,861 -- -- 104,293 Sonora -- -- 8,785 266,830 -- -- 275,615 Tamaulipas -- -- -- -- -- 6,935 6,935 Veracruz -- -- -- -- 2,895 93,860 96,755
Total 9,135 28,093 601,513 364,065 2,895 371,450 1,377,151 Source: Mexican Rail Industry

25
The top origin-destination rail pairs for soybean meal within Mexico are Piedras Negras-
Jalisco, Nogales-Sonora, Piedras Negras-Durango, Nogales-Sinaloa, and Nuevo Laredo-
Veracruz, accounting for two-thirds of shipments (table 20). The top fourteen destinations
account for nearly 94 percent of these soybean meal shipments in Mexico.
Table 20. Top Origin-Destination Pairs for Rail Shipments of U.S. Soybean Meal within Mexico, 2011 Origin Destination Metric Tons Piedras Negras Jalisco 358,068 Nogales Sonora 266,830 Piedras Negras Durango 112,915 Nogales Sinaloa 96,861 Nuevo Laredo Veracruz 93,860 Nuevo Laredo Queretaro 66,975 Nuevo Laredo Nuevo Leon 65,645 Nuevo Laredo Aguascalientes 63,650 Nuevo Laredo San Luis Potosi 45,220 Piedras Negras Coahuila 30,865 Ciudad Juarez Chihuahua 28,093 Piedras Negras Michoacan 21,219 Piedras Negras Aguascalientes 20,134 Piedras Negras Queretaro 18,023 Others (15 Additional Pairs) 88,793 Total
1,377,151
Source: Mexican Rail Industry
U.S. High Fructose Corn Syrup Exports to Mexico and
Modal Shares of Shipment
The United States exported 1.42 mmt of high fructose corn syrup (HFCS) to Mexico
during 2011, up from 1.18 mmt in 2010. Eighty-seven percent enters Mexico via rail while 11.2
percent enter on trucks and 2.1 percent by seaport. The major entry points for U.S. HFCS
exports were Piedras Negras with 626.5 tmt, Nuevo Laredo/Laredo with 458.3 tmt, and the port
of Coatzacoalcos with 137.5 tmt or 10 percent of the total imports. These three destinations
accounted for nearly 90 percent of U.S. HFCS shipments during 2011 (table 15). HFCS is used
as an ingredient in processed food and beverage products.

26
Table 21. Main Ports of Entry for U.S. HFCS Exports to Mexico – 2011 Port of Entry Metric Tons Piedras Negras 626,493 Nuevo Laredo 458,251 Coatzacoalcos 137,546 Others 198,091 Total 1,420,380
Source: Servicio de Información Agroalimentaria y Pesquera (SIAP), SAGARPA, Mexico.
About 1.26 mmt, 89 percent, of U.S. HFCS exported to Mexico was transported within
Mexico via rail. However, only about half of these shipments, or 621.4 tmt, can be accounted for
in terms of origin-destination pairs since only one of the rail lines provided HFCS shipment data.
With Nuevo Laredo as the origin, Guanajuato received 380.4 tmt of HFCS, followed by Hidalgo
(106.1 tmt), Nuevo Leon (97.3 tmt), and Queretaro (30.0 tmt) (table 22). Also, these data
exceed the SIAP reported totals from Nuevo Laredo. Attempts to reconcile these differences
were unsuccessful.
Table 22. 2011 Rail Shipments of U.S. HFCS within Mexico, Metric Tons
Origin
Destination Nuevo Laredo
Guanajuato 380,430 Higalgo 106,110 Nuevo Leon 97,290 Queretaro 29,970 Jalisco 5,310 Yucatan 2,250 Total 621,360 Source: Mexican Rail Industry
Selected Other Products Exports to Mexico and Modal Shares of Shipment
Soybean Oil, Canola Meal, Popcorn, and Sunflower Seeds During 2011, the United States exported 335.7 tmt of soybean oil to Mexico, 35.9
tmt of canola meal, 54.2 tmt of corn for popcorn, and 9.3 tmt of sunflower seeds. Nuevo
Laredo was the main port of entry for soybean oil, mostly in crude form, followed by Juarez
and Veracruz (table 23). Piedras Negras was the leading entry point for canola meal, Juarez

27
and Nuevo Laredo were the leading entry points for popcorn, and Piedras Negras was the
leading entry point for sunflower seeds.
Table 23. 2011 Main Ports of Entry for Selected U.S. Exports to Mexico, Metric Tons Port of Entry Soybean Oil Canola Meal Popcorn Sunflower Seed Ciudad Juarez 34,267 7,184 23,736 757 Nuevo Laredo 257,373 445 14,040 1,522 Matamoros -- -- 5,833 176 Mexicali 83 -- 979 102 Piedras Negras 19,168 24,130 8,490 6,642 Rio Grande City -- -- 879 -- Tijuana 712 3,604 233 95 Veracruz 23,843 -- -- -- Other 187 526 39 28 Total 335,633 35,889 54,229 9,322 Source: SAGARPA/SIAP
Rail was the primary mode of shipment for these products as they entered Mexico –
92.4 percent for soybean oil, 99.4 percent for canola meal, 86.9 percent for popcorn, and
89.3 percent for sunflower seed. Seaport entry was the secondary entry mode for soybean
oil, accounting for 7.1 percent of shipments, while truck was the mode for 13.1 percent of
popcorn entries and 10.7 percent of sunflower seed entries.
These product categories were shipped primarily via rail within Mexico. However,
not all rail industry representatives provided data, with only Juarez and Piedras Negras
being the only two origins for which data were provided. Hidalgo and Jalisco were the
largest destinations for soybean oil (table 24). Hidalgo was served by both Juarez and
Piedras Negras while most rail shipments to Jalisco originated in Juarez.
Canola meal rail shipments to Chihuahua were mainly transported through Juarez
while shipments to Jalisco were shipped via Piedras Negras. Juarez and Piedras Negras
were both major origination points for popcorn to Mexico City and Guanajuato. Piedras
Negras was most important for sunflower seeds, with most going to Mexico City,
Guanajuato, and Jalisco.
Soybean oil is used mainly in cooking, particularly in the Hotels, Restaurants, and
Institutions (HRI), while sunflower seeds are crushed into oil and used in the production of

28
fried snack foods. Popcorn is eaten as a snack while canola meal is fed to animals, mostly
swine.
Table 24. 2011 Rail Shipments of Selected U.S. Products within Mexico, MT Soybean Oil Origin Destination Ciudad Juarez Piedras Negras Total
Estado de Mexico 4,039 758 4,797 Guanajuato -- 305 305 Hidalgo 11,420 18,820 30,240 Jalisco 15,743 2,059 17,802 Nuevo Leon -- 591 591 Sonora -- -- 86
Soybean Oil Total 31,202 22,533 53,821 Canola Meal Origin
Destination Ciudad Juarez Piedras Negras Total Chihuahua 4,901 168 5,069 Coahuila -- 166 166 Jalisco -- 7,791 7,791
Canola Meal Total 4,901 8,125 13,027 Popcorn Origin
Destination Ciudad Juarez Piedras Negras Total Distrito Federal 8,797 4,768 13,565 Estado de Mexico 163 652 815 Guanajuato 11,886 2,988 14,874 Jalisco 423 173 596 Puebla -- 228 228
Popcorn Total 21,269 8,809 30,078 Sunflower Seed Origin
Destination Ciudad Juarez Piedras Negras Total Coahuila -- 84 84 Distrito Federal 57 2,970 3,027 Estado de Mexico 91 94 186 Guanajuato -- 1,572 1,572 Hidalgo -- 84 84 Jalisco -- 932 932 Puebla 269 436 704 Queretaro -- 571 571 Zacatecas -- 95 95
Sunflower Seed Total 417 6,839 7,256 Source: Mexican Rail Industry

29
Soft Wheat and White Corn
The United States exported 969.6 tmt of soft wheat to Mexico during 2011. In contrast to
other grains exported to Mexico, most of the soft wheat enters Mexico via ocean through ports in
the Gulf of Mexico. Seaports account for the vast majority of U.S. soft wheat, 88.8 percent,
entering Mexico. The leading port of entry was Veracruz with 569.1 tmt, or 69 percent of the
total, followed by the seaport of Progreso with 117.7 tmt percent and the seaport of Tuxpan with
107.1 tmt (table 25). The leading land port was Nuevo Laredo at 57.4 tmt, or 6 percent.
Table 25. Main Ports of Entry for U.S. Soft Wheat Exports to Mexico – 2011
Port of Entry Metric Tons Veracruz 569,142 Progreso 117,672 Tuxpan 107,120 Nuevo Laredo 57,366 Others 118,280 Total 969,580
Source: Servicio de Información Agroalimentaria y Pesquera (SIAP), SAGARPA, Mexico.
The United States exported 588.9 tmt of white corn to Mexico during 2011, with 168.5
tmt or 29 percent entering Mexico through the port of Veracruz (table 23). The next largest
points of entry include Nuevo Laredo, with 78.3 tmt, Matamoros (60.8 tmt), and Progreso (59.7
tmt). About half of total U.S. white corn exports to Mexico entered via seaports with most of the
rest entering by rail. No origin-destination information was available for U.S. soft wheat or
white corn exports to Mexico.
Table 26. Main Ports of Entry for U.S. White Corn Exports to Mexico – 2011 Ports of Entry Metric Tons Veracruz 168,488 Nuevo Laredo 78,287 Matamoros 60,800 Progreso 59,702 Altamira 53,182 Coatzacolacos 52,794 Others 115,710 Total 588,963
Source: Servicio de Información Agroalimentaria y Pesquera (SIAP), SAGARPA, Mexico.

30
Virtually all soft wheat and white corn is milled into flour which is then used for human
consumption in Mexico. And even though most is shipped via rail within Mexico, no rail data
was provided by the industry.
Conclusion The United States has had a long relationship with Mexico in the trade of agricultural
products. This relationship was spurred along by the implementation of the North American
Free Trade Agreement (NAFTA). One impact of NAFTA has been that U.S. grain, oilseed, and
related product exports to Mexico continue to grow in terms of both value and volume. The
results of this study illustrate the growth in that trade.
The destination, mode of transportation and end uses of U.S. grains, oilseeds, and related
products within the Mexican market were specifically reviewed by this project. Yellow corn,
used mostly for animal feed and corn starch, is the largest volume export of these products
analyzed in this report. Soybeans, crushed for meal and oil, hard wheat, used for human
consumption, and grain sorghum, used for animal feeding, were the next largest U.S. exports.
Together, these top four products accounted for nearly seventy percent of the volume of U.S.
grain and oilseeds exports to Mexico.
Other important products are dried distiller grain (DDG) and soybean meal, used to feed
livestock, high fructose corn syrup (HFCS), used as an ingredient in process food and beverage
products, and soft wheat and rice, used almost exclusively for human consumption. Most of
these major products exported to Mexico have a long history of presence in the market; however,
the emergence of DDG, HFCS, and soybean meal is relatively recent.
Four ports of entry handled nearly eighty percent of the total U.S. grain exports by
volume in 2011: Nuevo Laredo, Veracruz, Piedras Negras and Ciudad Juárez. The seaports of
Progreso in Yucatan and Coatzacoalcos, as well as the land ports of Matamoros, Nogales, and
Nuevo Progreso in Tamaulipas are also important gateways.
Rail is the dominant mode of transportation for U.S. exports of these products entry into
Mexico and captures an even larger share of product movement within Mexico. With the help of
representatives of the two major Mexican rail companies: Ferromex/Ferrosur and Kansas City
Southern de Mexico, it was determined that the largest rail origin-destination pairs, those with at
least a million metric tons, include Nuevo Laredo-Queretaro, Piedras Negras-Jalisco, Veracruz-
Puebla, Nuevo Laredo-Nuevo Leon, Nuevo Laredo-Estado de Mexico, and Ciudad Juárez-

31
Jalisco. These six origin-destination pairs account for nearly forty percent of U.S. grains,
oilseeds, and related product exports to Mexico.
References
Adcock, Flynn J., C. Parr Rosson, III, and Alejandro Varela. Tracking U.S. Grain and Soybean
Exports in Mexico. Research Report for Cooperative Agreement between Agricultural
Marketing Service, USDA and Texas Agricultural Experiment Station, January 2007.
Foreign Agricultural Service, USDA. Global Agricultural Trading System.
www.fas.usda.gov/gats/default.aspx.
Foreign Agricultural Service, USDA. Grain and Feed Annual. GAIN Report Number MX0017,
March 12, 2010. www.fas.usda.gov.
Foreign Agricultural Service, USDA. Oilseeds and Products Annual. GAIN Report Number
MX2020, April 12, 2012. www.fas.usda.gov.
Mexican Rail Industry Representatives: Ferromex/Ferrosur and Kansas City Southern de
Mexico, Data Provided by Industry following Personal Request.
Servicio de Información y Estadística Agroalimentaria y Pesquera of Secretaria de Agricultura,
Ganadería, Desarrollo Rural, Pesca y Alimentación (SIAP/SAGARPA), Statistics Division of the
Mexican Ministry of Agriculture. Data Provided Directly by SIAP/SAGARPA following
Personal Request.

32
Appendix A
Map of Mexico Highway System
Map Generated by Texas A&M Transportation Institute

33
Appendix B
Map of Mexico by State
Map Generated by Texas A&M Transportation Institute