Embed Size (px)
Citation preview

EFFECT OF STRAIN HISTORY ON SIMULATION OF CRASHWORTHINESS OF A VEHICLE
A THESIS SUBMITTED TO THE GRADUATE SCHOOL OF NATURAL AND APPLIED SCIENCES
OF MIDDLE EAST TECHNICAL UNIVERSITY
BY
ULUĞ ÇAĞRI DOĞAN
IN PARTIAL FULFILLMENT OF THE REQUIREMENTS FOR
THE DEGREE OF MASTER OF SCIENCE IN
MECHANICAL ENGINEERING
JULY 2009

Approval of the thesis;
EFFECT OF STRAIN HISTORY ON SIMULATION OF CRASHWORTHINESS OF A VEHICLE
Submitted by ULUĞ ÇAĞRI DOĞAN in partial fulfillment of the requirements for the degree of Master of Science in Mechanical Engineering Department, Middle East Technical University by, Prof. Dr. Canan Özgen _______________ Dean, Graduate School of Natural and Applied Sciences Prof. Dr. Suha Oral _______________ Head of Department, Mechanical Engineering Prof. Dr. Mustafa Đlhan Gökler _______________ Supervisor, Mechanical Engineering Dept., METU Prof. Dr. Haluk Darendeliler _______________ Co-Supervisor, Mechanical Engineering Dept., METU Examining Committee Members: Prof. Dr. R. Orhan Yıldırım _______________ Mechanical Engineering Dept., METU Prof. Dr. Mustafa Đlhan Gökler _______________ Mechanical Engineering Dept., METU Prof. Dr. Haluk Darendeliler _______________ Mechanical Engineering Dept., METU Prof. Dr. Kemal Đder _______________ Mechanical Engineering Dept., METU Assoc. Prof. Dr. Uğur Polat _______________ Civil Engineering Dept., METU
Date: _______________

iii
I hereby declare that all information in this document has been obtained and presented in accordance with academic rules and ethical conduct. I also declare that, as required by these rules and conduct, I have fully cited and referenced all material and results that are not original to this work.
Name, Last name :
Signature :

iv
ABSTRACT
EFFECT OF STRAIN HISTORY ON SIMULATION OF CRASHWORTHINESS OF A VEHICLE
Doğan, Uluğ Çağrı
M.S., Department of Mechanical Engineering
Supervisor
Co-Supervisor
: Prof. Dr. Mustafa Đlhan Gökler
: Prof. Dr. Haluk Darendeliler
July 2009, 71 pages
In this thesis the sheet metal forming effects such as plastic strain and thickness
changes in the crash have been investigated by numerical analysis.
The sheet metal forming histories of the components of the load path that absorbs the
highest energy during a frontal crash have been considered. To find out the particular
load path, the frontal crash analysis of Ford F250 Pickup has been performed at 56
kph into a rigid wall with finite element analysis without considering the forming
history. The sheet metal forming simulations have been realized for each structural
component building up the particular load path. After forming histories have been
acquired, plastic strain and thickness distributions have been transferred to the frontal
crash analysis. The frontal crash analysis of Ford F250 Pickup has been repeated by
including these to introduce the effect of forming on crash response of the vehicle.
v
The results of the simulations with and without forming effect have been compared
with the physical crash test results to evaluate the sheet metal forming effect on the
overall crash response. The results showed that with forming history the crash
response of the vehicle and deformations of the particular components have been
changed and the maximum deceleration pulse transferred to the passenger
compartment has decreased. It has seen that a good agreement with physical test
results has been achieved.
Keywords: Sheet Metal Forming, Forming to Crash, Forming History, Crash
Response, Internal Absorbed Energy
vi
ÖZ
GERĐNĐM GEÇMĐŞĐNĐN ARAÇ ÇARPMA DAYANIKLILIĞI
SĐMÜLASYONLARI ÜZERĐNDEKĐ ETKĐSĐ
Doğan, Uluğ Çağrı
Yüksek Lisans, Makina Mühendisliği Bölümü
Tez Yöneticisi
Ortak Tez Yöneticisi
: Prof. Dr. Mustafa Đlhan Gökler
: Prof. Dr. Haluk Darendeliler
Temmuz 2009, 71 sayfa
Bu tezde, plastik gerinim ve kalınlık değişimi gibi sac metal şekillendirme etkilerinin
çarpışma üzerindeki etkileri sayısal analiz yöntemleri ile incelenmiştir.
Önden çarpışmada, enerjinin büyük çoğunluğunu emen yük yolundaki parçaların sac
metal şekillendirme kalıntıları göz önünde bulundurulmuştur. Bu yük yolunu bulmak
için öncelikle Ford F250 kamyonetinin 56 km/saat hızla rijit bir duvara önden
çarpması sonlu elemanlar yöntemiyle analiz edilmiştir. Seçilen yük yolundaki her
parça için sac metal şekillendirme analizleri yapılmıştır. Şekillendirme etkileri elde
edildikten sonra kalınlık değişimi ve plastik gerinim dağılımları ön çarpışma
modeline aktarılmıştır. Ford F250 kamyonetinin ön çarpışma analizi, aktarılan bu
veriler ile yeniden yapılmıştır.

vii
Sac metal şekillendirme etkilerinin çarpışma analizi üzerindeki etkilerini incelemek
için, çarpışma analizlerinin sonuçları deneysel çarpışma sonuçları ile
karşılaştırılmıştır. Elde edilen sonuçlar, aracın çarpışmaya verdiği tepkilerin ve
seçilen parçalarının deformasyonlarının şekillendirme etkilerinin göz önüne
alınmasıyla değiştiğini ve yolcu kabinine aktarılan en büyük ivme miktarının
azaldığını göstermiştir. Şekillendirme etkilerini içeren sayısal analiz sonuçları ile
deney sonuçları arasında iyi bir uyum gözlenmiştir.
Anahar Kelimeler: Sac Metal Şekillendirme, Şekillendirmeden Çarpışmaya,
Şekillendirme Geçmişi, Çarpışma Cevabı, Dahili Enerji Emilimi

viii
To my wife…
DEDICATION

ix
ACKNOWLEDGEMENTS
I would like to express profound gratitude to my supervisor, Prof. Dr. Mustafa Đlhan
Gökler, for his invaluable support, encouragement, supervision and useful
suggestions throughout this research work. His moral support and continuous
guidance enabled me to complete my thesis successfully.
I am grateful to my co-supervisor, Prof. Dr. Haluk Darendeliler, for his valuable
suggestions throughout this study.
I would like to thank my family. Throughout all my endeavors, your love, support,
guidance, and endless patience have been truly inspirational - “thanks” will never
suffice.
My deepest gratitude goes to my wife, Didem Çilingir, for her unflagging love and
support; this thess is simply impossible without her encouragement and
understanding. I am grateful to her since she is my shining sun all the time.
I am also highly thankful to the Scientific and Technological Research Council of
Turkey (TUBITAK) for the scholarship provided for me during my graduate
education.

x
TABLE OF CONTENTS ABSTRACT ................................................................................................................ iv
ÖZ................................................................................................................................vi
DEDICATION .......................................................................................................... viii
ACKNOWLEDGEMENTS ........................................................................................ ix
TABLE OF CONTENTS ............................................................................................. x
LIST OF TABLES ..................................................................................................... xii
LIST OF FIGURES .................................................................................................. xiii
CHAPTERS
1 INTRODUCTION ......................................................................................... 1
1.1 Passive Safety ....................................................................................... 1
1.2 Effect of Forming History on Passive Safety ....................................... 3
1.3 Strain Hardening and Thickness Change during Forming ................. 13
1.4 Scope of the Thesis ............................................................................. 14
2 FRONTAL CRASH ANALYSIS WITHOUT SHEET METAL
FORMING HISTORY ................................................................................. 16
2.1 Introduction ........................................................................................ 16
2.2 Finite Element Software Used in the Study ....................................... 16
2.3 Vehicle Model .................................................................................... 17
2.4 Analysis Results ................................................................................. 20
2.5 Selection of Main Impact Members ................................................... 23
3 FORMING ANALYSIS OF LOAD CARRYING MEMBERS .................. 27
3.1 Introduction ........................................................................................ 27
xi
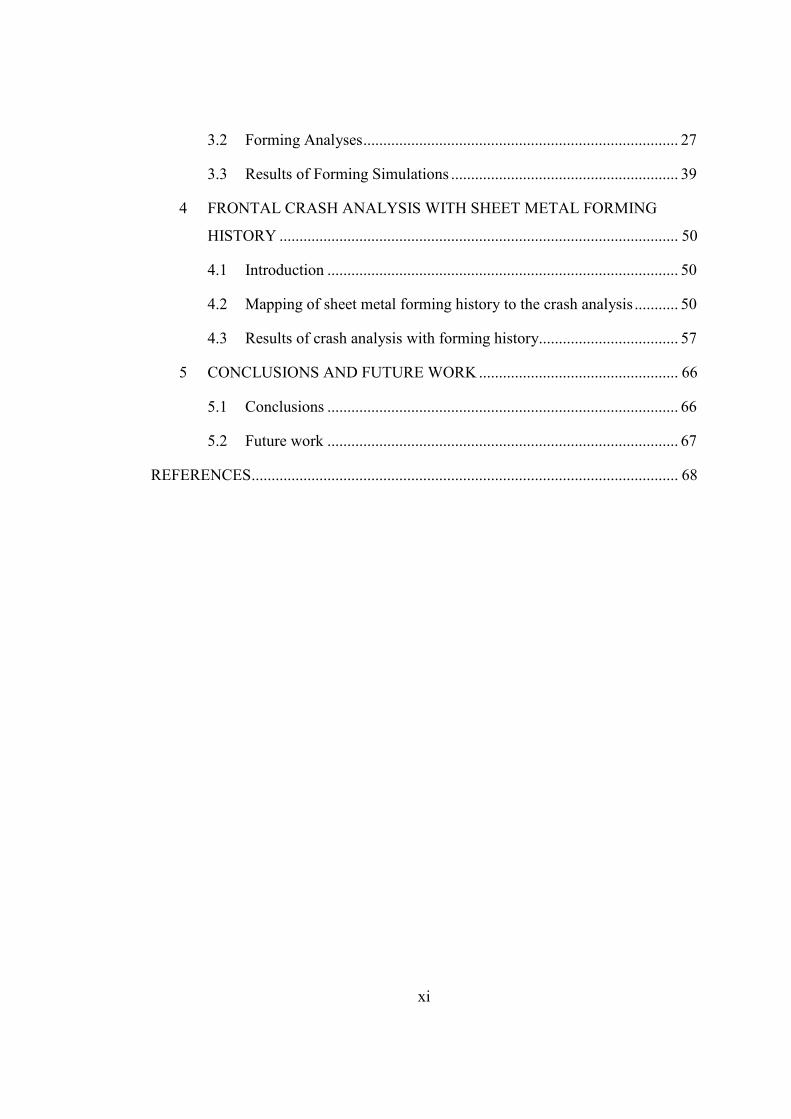
3.2 Forming Analyses ............................................................................... 27
3.3 Results of Forming Simulations ......................................................... 39
4 FRONTAL CRASH ANALYSIS WITH SHEET METAL FORMING
HISTORY .................................................................................................... 50
4.1 Introduction ........................................................................................ 50
4.2 Mapping of sheet metal forming history to the crash analysis ........... 50
4.3 Results of crash analysis with forming history................................... 57
5 CONCLUSIONS AND FUTURE WORK .................................................. 66
5.1 Conclusions ........................................................................................ 66
5.2 Future work ........................................................................................ 67
REFERENCES ........................................................................................................... 68
xii
LIST OF TABLES
TABLES
Table 2.1 2006 Ford F250 Pickup – vehicle finite element model summary ............ 20
Table 3.1 Thickness change of the components after sheet forming process ............ 49
Table 3.2 Maximum plastic strain after sheet metal forming process ....................... 49
Table 4.1 Comparison of internal absorbed energy levels of each part ..................... 58
Table 4.2 Maximum total reaction force .................................................................... 63

xiii
LIST OF FIGURES
FIGURES
Figure 1.1 Distribution of global injury mortality by cause ........................................ 1
Figure 1.2 Deformed shapes of the front side member assembly for 56 kph full
frontal crash simulation: (a) without forming effects; (b) with forming
effects .......................................................................................................... 4
Figure 1.3 Engineering stress-strain curves of DP500, TRIP700 and ZStE300 steel .. 5
Figure 1.4 Force (Fw) – deflection (xd) curve with and without forming effects –
DP500 ......................................................................................................... 6
Figure 1.5 Deformation modes of the structure for the different inputs of forming
data .............................................................................................................. 7
Figure 1.6 Simulation and test results for a prototype front crash test ........................ 8
Figure 1.7 Simulation and test results for a prototype front crash test (with deep
drawing results) ........................................................................................... 8
Figure 1.8 Estimated zones of forming strain .............................................................. 9
Figure 1.9 Differences in crash response due to forming history .............................. 10
Figure 1.10 Effect of high-strength steels on the crashworthiness of S-rails ............. 11
Figure 1.11 Effect of forming effect on the crash response of roof rail ..................... 12
Figure 1.12 Work hardening of a material due to forming ........................................ 13
Figure 1.13 Thickness change of the material after forming process ........................ 14
Figure 2.1 Isometric view of Ford F250 Pickup ........................................................ 18
Figure 2.2 Side view of Ford F250 Pickup ................................................................ 19
Figure 2.3 Bottom view of Ford F250 Pickup ........................................................... 19
Figure 2.4 Validation of finite element model of Ford F250 with test ...................... 20
Figure 2.5 Total wall force ......................................................................................... 21
Figure 2.6 Average velocity of left seat and right seat accelerometer ....................... 22
Figure 2.7 Resultant displacement of vehicle CG ...................................................... 22
xiv
Figure 2.8 Energy balance.......................................................................................... 24
Figure 2.9 Crash relevant components during frontal crash ...................................... 24
Figure 2.10 The first load path during frontal crash .................................................. 25
Figure 2.11 The second load path during frontal crash .............................................. 26
Figure 2.12 The other important structural components during frontal crash ........... 26
Figure 3.1 Selected components of Ford F250 .......................................................... 28
Figure 3.2 Part 2000156 - Outer side of the front right S-rail.................................... 29
Figure 3.3 Part 2000157 – Inner side of the front right S-rail.................................... 29
Figure 3.4 Part 2000180 – Front middle right rail support ........................................ 30
Figure 3.5 Part 2000183 – Rear right longitudinal member ...................................... 30
Figure 3.6 Part 2000168 – Inner side of the front left S-rail ...................................... 31
Figure 3.7 Part 2000170 – Outer side of the front left S-rail ..................................... 31
Figure 3.8 Part 2000158 – Front middle left rail support .......................................... 32
Figure 3.9 Part 2000179 – Rear left longitudinal member......................................... 32
Figure 3.10 Part 2000174 – Front engine bracket ...................................................... 33
Figure 3.11 Preparation of fine FE models ................................................................ 34
Figure 3.12 Preparation of forming tools by offsetting.............................................. 35
Figure 3.13 Forming configuration ............................................................................ 35
Figure 3.14 Mesh refinement of Part 2000168 .......................................................... 37
Figure 3.15 The force profile on the blank holder ..................................................... 38
Figure 3.16 Punch velocity profile ............................................................................. 39
Figure 3.17 Plastic strain distribution (a) and thickness distribution (b) of part
2000156 .................................................................................................. 40
Figure 3.18 Plastic strain distribution (a) and thickness distribution (b) of part
2000157 .................................................................................................. 41
Figure 3.19 Plastic strain distribution (a) and thickness distribution (b) of part
2000158 .................................................................................................. 42
Figure 3.20 Plastic strain distribution (a) and thickness distribution (b) of part
2000168 .................................................................................................. 43
xv
Figure 3.21 Plastic strain distribution (a) and thickness distribution (b) of part
2000170 .................................................................................................. 44
Figure 3.22 Plastic strain distribution (a) and thickness distribution (b) of part
2000174 .................................................................................................. 45
Figure 3.23 Plastic strain distribution (a) and thickness distribution (b) of part
2000179 .................................................................................................. 46
Figure 3.24 Plastic strain distribution (a) and thickness distribution (b) of part
2000180 .................................................................................................. 47
Figure 3.25 Plastic strain distribution (a) and thickness distribution (b) of part
2000183 .................................................................................................. 48
Figure 4.1 Summary of the mapping process............................................................. 51
Figure 4.2 Mapping of the plastic strain (a) and the thickness distribution (b) of
part 2000156 ............................................................................................. 52
Figure 4.3 Mapping of the plastic strain (a) and the thickness distribution (b) of
part 2000157 ............................................................................................. 53
Figure 4.4 Mapping of the plastic strain (a) and the thickness distribution (b) of
part 2000158 ............................................................................................. 53
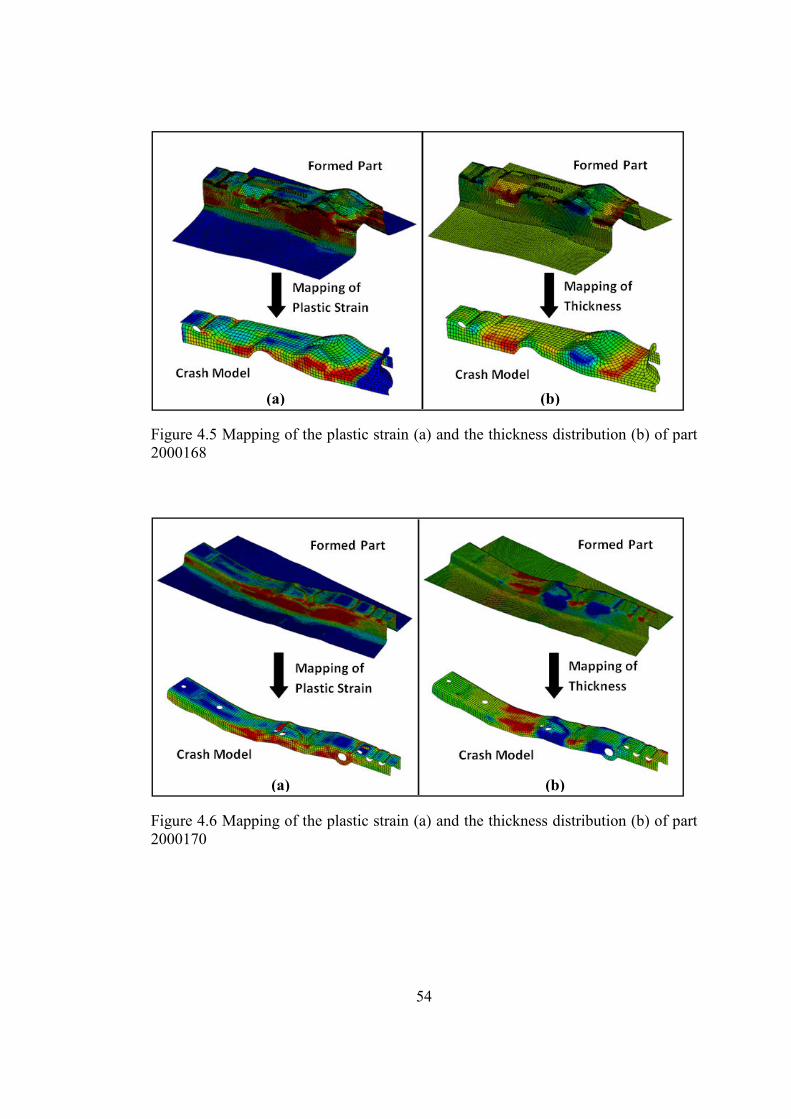
Figure 4.5 Mapping of the plastic strain (a) and the thickness distribution (b) of
part 2000168 ............................................................................................. 54
Figure 4.6 Mapping of the plastic strain (a) and the thickness distribution (b) of
part 2000170 ............................................................................................. 54
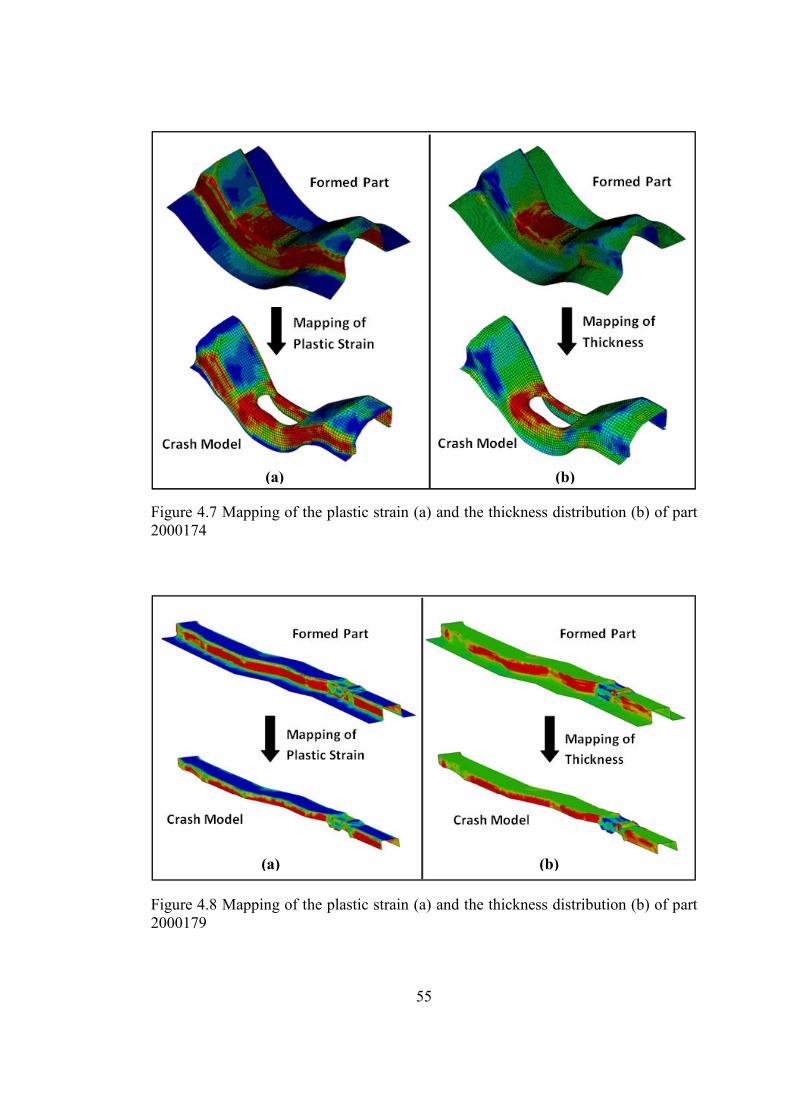
Figure 4.7 Mapping of the plastic strain (a) and the thickness distribution (b) of
part 2000174 ............................................................................................. 55
Figure 4.8 Mapping of the plastic strain (a) and the thickness distribution (b) of
part 2000179 ............................................................................................. 55
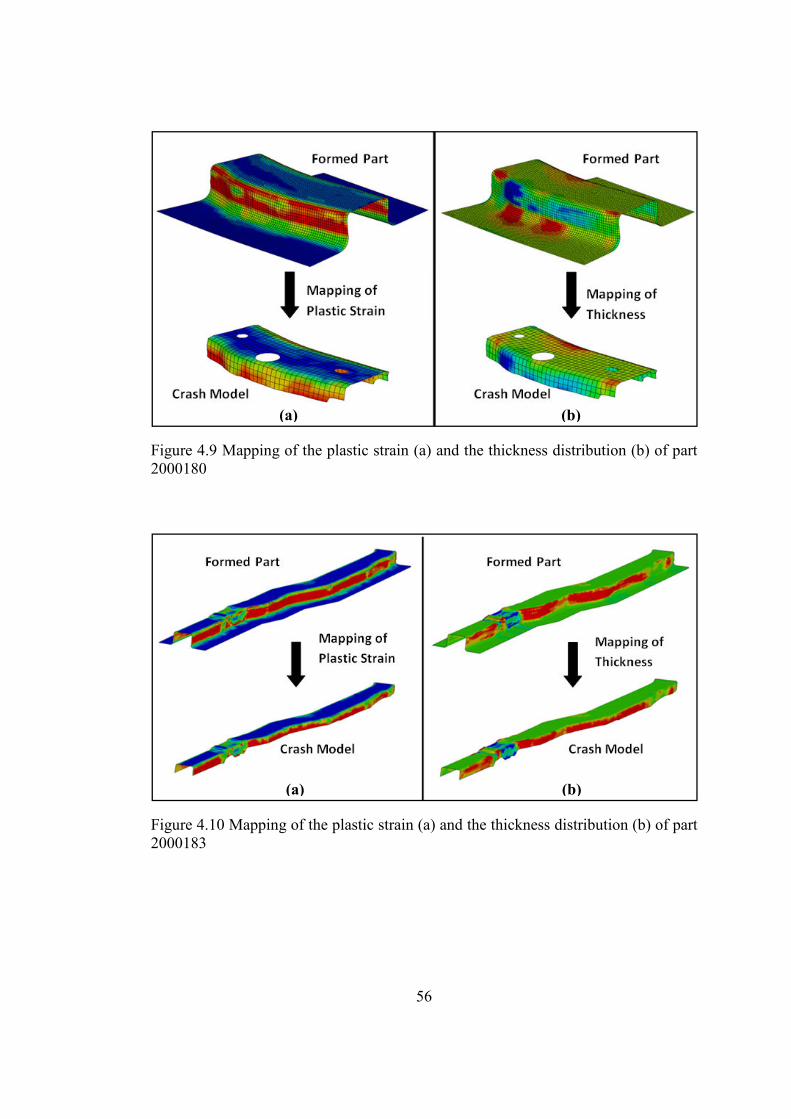
Figure 4.9 Mapping of the plastic strain (a) and the thickness distribution (b) of
part 2000180 ............................................................................................. 56
Figure 4.10 Mapping of the plastic strain (a) and the thickness distribution (b) of
part 2000183 ........................................................................................... 56
Figure 4.11 Comparison of total absorbed energy by the most important load path . 59
xvi
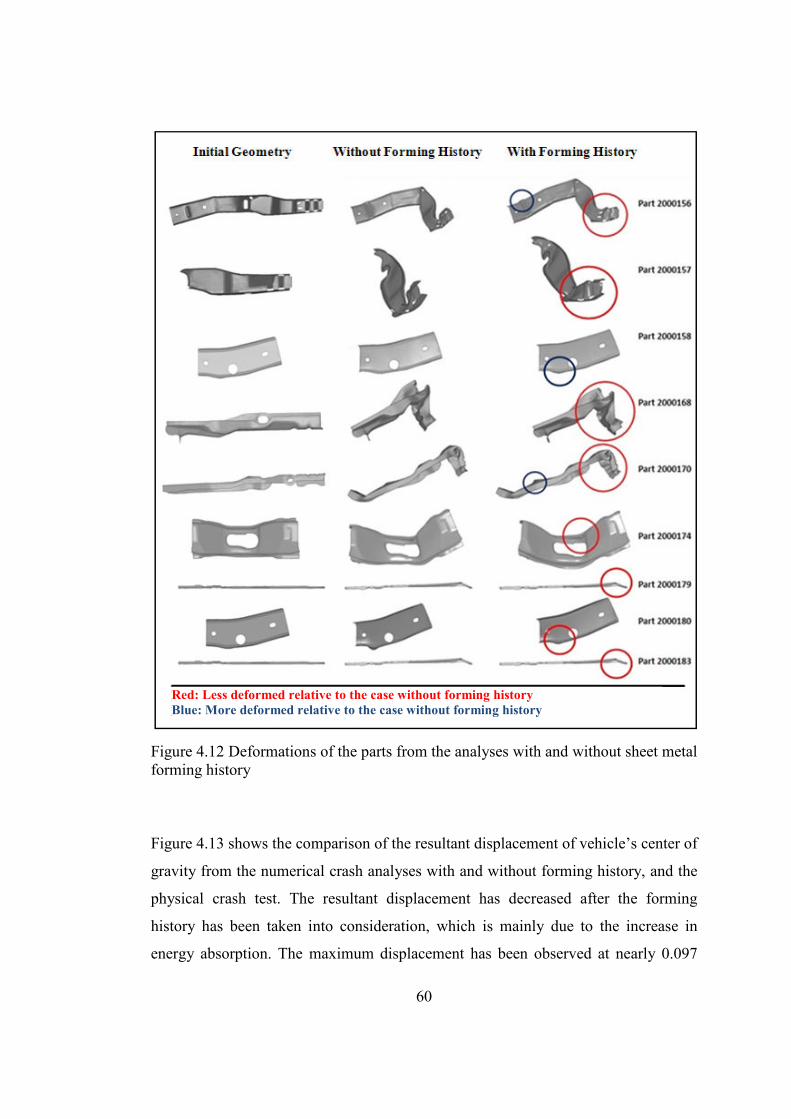
Figure 4.12 Deformations of the parts from the analyses with and without sheet
metal forming history ............................................................................. 60
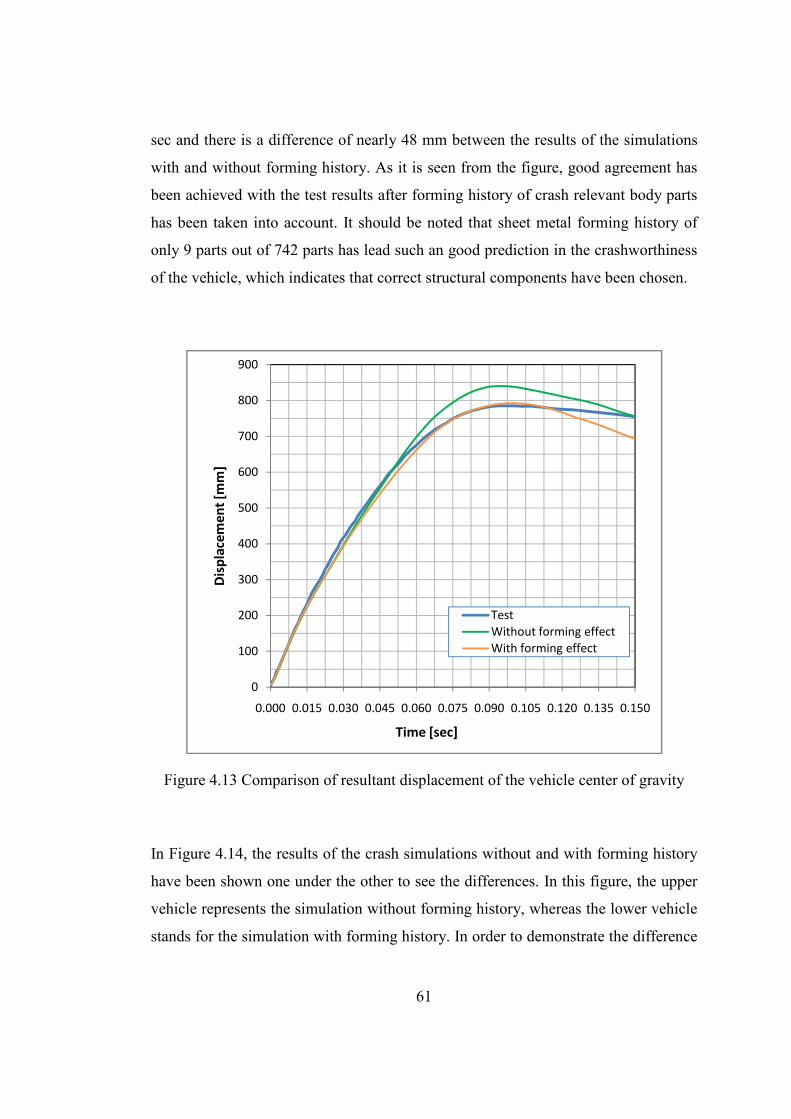
Figure 4.13 Comparison of resultant displacement of the vehicle center of gravity . 61
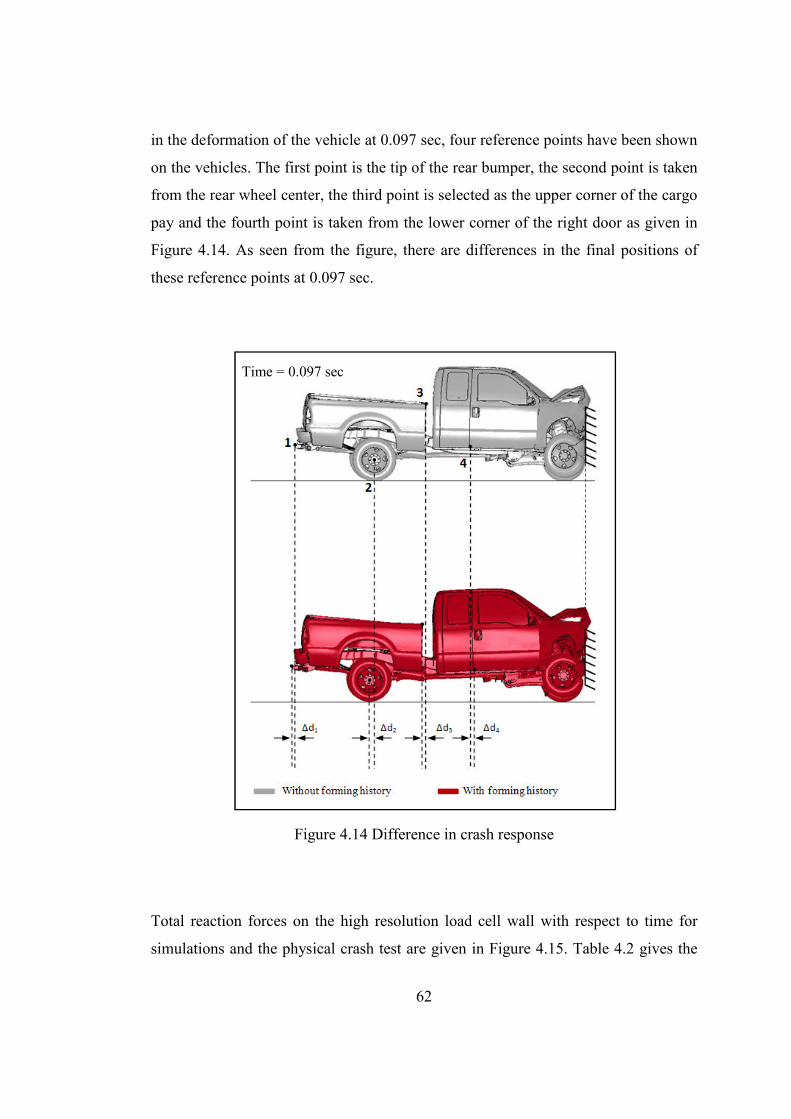
Figure 4.14 Difference in crash response ................................................................... 62
Figure 4.15 Comparison of total force recorded on the load cell wall ....................... 63
Figure 4.16 Comparison of average velocities of the left and right seat in x-
direction .................................................................................................. 64
Figure 4.17 Left seat deceleration .............................................................................. 65
Figure 4.18 Right seat deceleration ............................................................................ 65
1
CHAPTER 1
1 INTRODUCTION
1.1 Passive Safety
The invention of the vehicles made broader travels possible and much more
comfortable however this invention also brought up mortalities due to road traffic
accidents. The first record in USA which is about vehicle crash resulted with death
was saved in 1889 [1] and today, unfortunately, traffic accidents are considered as
one of the most serious threats to the human life. According to World Health
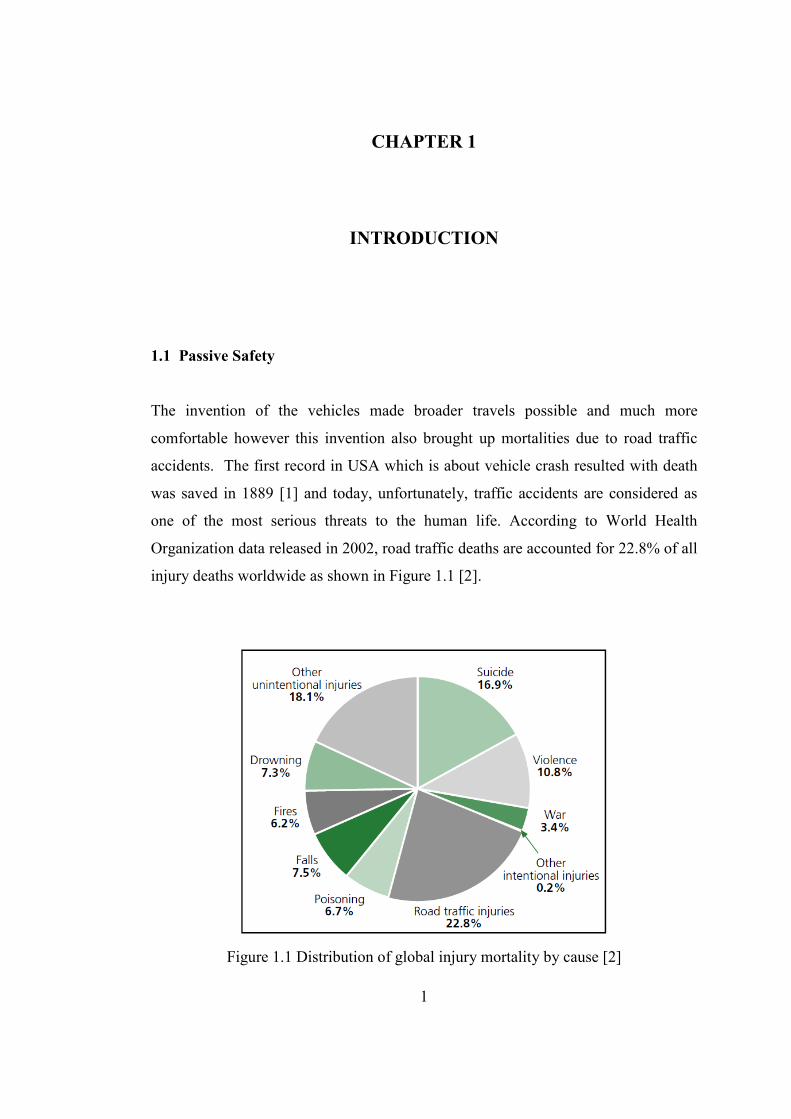
Organization data released in 2002, road traffic deaths are accounted for 22.8% of all
injury deaths worldwide as shown in Figure 1.1 [2].
Figure 1.1 Distribution of global injury mortality by cause [2]
2
As these vehicle fatalities increase, vehicle safety has become an important design
objective besides all performance and comfort criteria of vehicles over the past
century. Vehicle safety can be divided into three main categories; active safety,
passive safety and tertiary safety. Active safety focuses on preventing accidents from
occurring. Active safety systems such as ABS brakes, traction control, electronic
stability control, night vision and automatic cruise control are designed to make it
easier for the driver to avoid accidents. Passive safety, on the other hand, is to protect
occupants in the event of an accident. During a collision, as much as crash energy is
aimed to be absorbed by the structural components of a vehicle to provide greater
protection for occupants [4]. In addition, passive safety systems such as seatbelts,
airbags and anti-whiplash seats minimize the possibility of injury to vehicle
occupants. Tertiary safety mainly focuses with after the accident like alerting
emergency services, providing protection and assistance after an accident.
High deceleration levels and large deformations are the major threats for the
passengers during a collision. Thus, the improvement of passive safety is one of the
main focuses in the development of vehicles [5]. For designing the vehicles from the
view point of passive safety, the design of the load paths is important since the
components building up the load paths are the major parts absorbing the kinetic
energy during crash [6]. Energy absorption of these components is so vital that it is
directly related with the deceleration level transferred to the passenger compartment
[7]. Load paths in a vehicle alter according to the crash type. In the case of a frontal
crash, impact load directly transferred to the front longitudinal members from
bumpers. Then, load is distributed between structural components of the roof, the
floor and the frame of the vehicle [5, 8]. To design these components, the structural
energy absorption characteristics of these components should be specified precisely.
However, it is very hard to design these members with manual engineering
approaches due to high accelerations and large displacements during crash. Besides,
load transfer is not so easy to predict.
3
The increasing legal and customer demands on passive safety of automobiles have to
be fulfilled under the conditions of shortened research and development time and
cost reductions in a new vehicle project. Finite element method (FEM) is extensively
used to reduce the development time of a vehicle and to forecast the safety level of
vehicles. FEM provides possibility to see the weak points in the early stages of
development.
In order to perform a reliable full vehicle finite element analysis (FEA), much care
should be taken into account. Finite element (FE) model of the full vehicle should be
constructed using the proper parameters. Some of these important parameters are
related with mesh size, element formulation, element type and connections, which
have to be modeled as realistic as possible for sensible simulations. Last but not least
material properties should be defined thoughtfully. To describe the material behavior
under impact conditions and different velocities, necessary material parameters
should be supplied for the constitutive models used in finite element software.
The majority of the parts of a vehicle, especially parts which build up the main load
paths, are manufactured by sheet metal forming. In FEA, the standard stress-strain
curves for undeformed sheet materials are usually utilized to characterize the
behavior of materials for crash analyses. However, it is a known fact that sheet metal
forming process may alter the material properties of a sheet metal too much due to
plastic deformation and thickness change. Work hardening effect makes the metal
apparently stronger and more difficult to deform [9]. Because of the thickness
change, some regions become weaker due to thickness reduction and some regions
get stronger due to thickness increase.
1.2 Effect of Forming History on Passive Safety
For a reliable crash analysis, forming history due to sheet metal forming process
should be taken into account especially for crash relevant body parts. Some of the
4
studies related with the sheet metal forming history on crash response have been
summarized in this section.
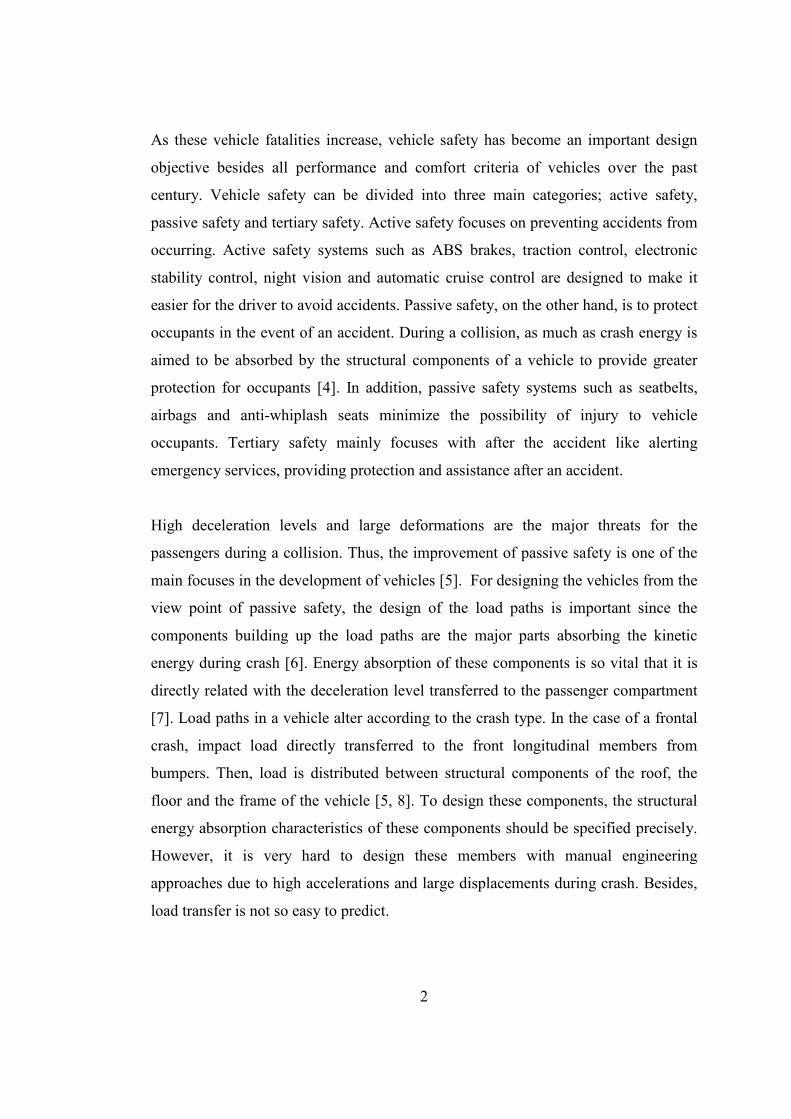
Kim [10] from Kia Motors have showed the influence of strain hardening and
thickness change due to metal forming on the deformation and deceleration pulse for
a full vehicle crash analysis (Figure 1.2). He has concluded that more realistic results
can be obtained by taking forming effects into account in the crash simulations.
Figure 1.2 Deformed shapes of the front side member assembly for 56 kph full frontal crash simulation: (a) without forming effects; (b) with forming effects [10]
High strength steels, e.g. dual phase (DP) steel and transformation induced plasticity
(TRIP) steel, are generally used to reduce weight and increase the energy absorption
capabilities of automobile body parts. Lanzerath, Omar and Wesemann [11] from
Ford Aachen have completed a research project which is mainly about the effect of
forming history on the quality of crash simulations when high strength steels are
used. In their study, they have studied three different steels, one mild steel (FePO4),
one high strength low alloyed steel (ZStE300) and one high strength steel (DP500).
Crashworthiness simulations have been carried out for the side rail (S-rail)
reinforcement of Ford Focus to see the importance of forming effects for these
5
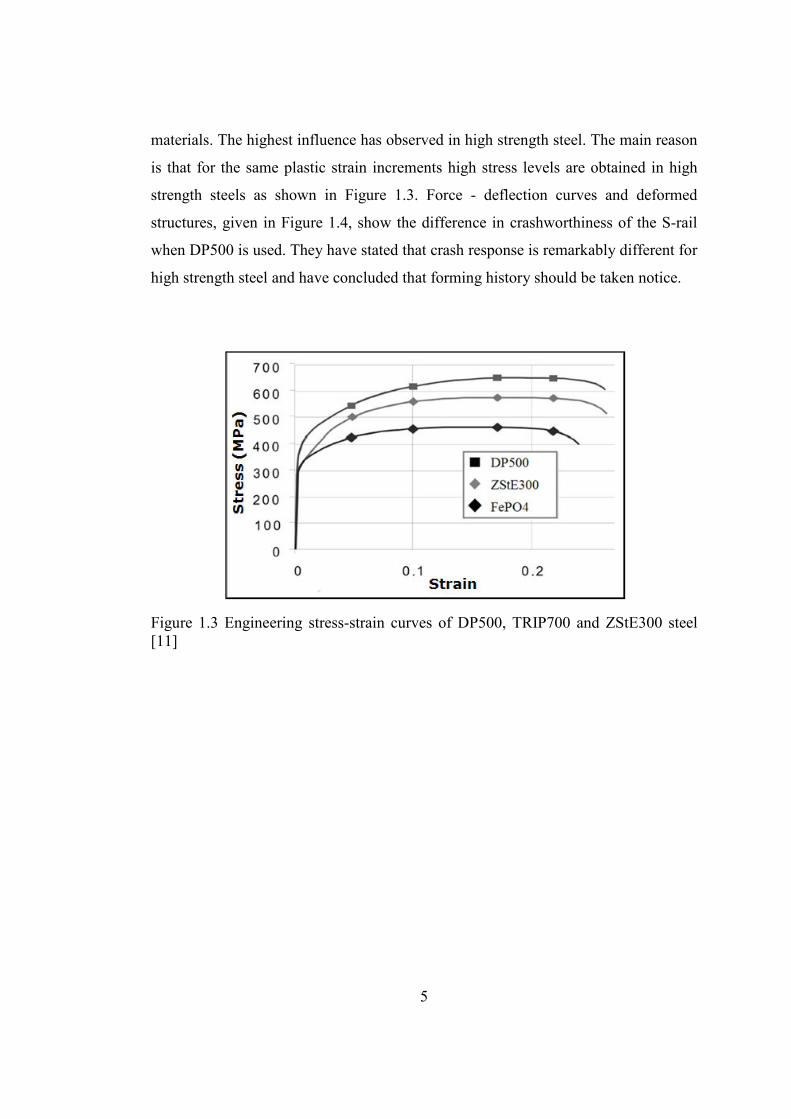
materials. The highest influence has observed in high strength steel. The main reason
is that for the same plastic strain increments high stress levels are obtained in high
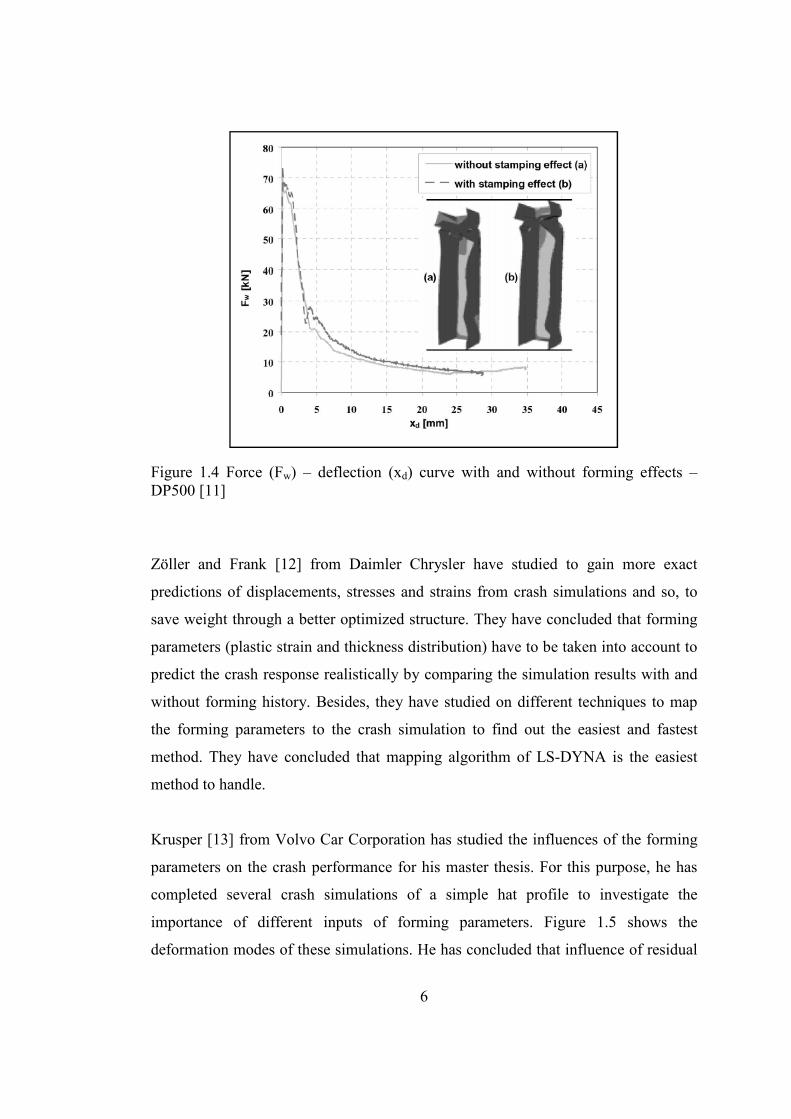
strength steels as shown in Figure 1.3. Force - deflection curves and deformed
structures, given in Figure 1.4, show the difference in crashworthiness of the S-rail
when DP500 is used. They have stated that crash response is remarkably different for
high strength steel and have concluded that forming history should be taken notice.
Figure 1.3 Engineering stress-strain curves of DP500, TRIP700 and ZStE300 steel [11]
6
Figure 1.4 Force (Fw) – deflection (xd) curve with and without forming effects – DP500 [11]
Zöller and Frank [12] from Daimler Chrysler have studied to gain more exact
predictions of displacements, stresses and strains from crash simulations and so, to
save weight through a better optimized structure. They have concluded that forming
parameters (plastic strain and thickness distribution) have to be taken into account to
predict the crash response realistically by comparing the simulation results with and
without forming history. Besides, they have studied on different techniques to map
the forming parameters to the crash simulation to find out the easiest and fastest
method. They have concluded that mapping algorithm of LS-DYNA is the easiest
method to handle.
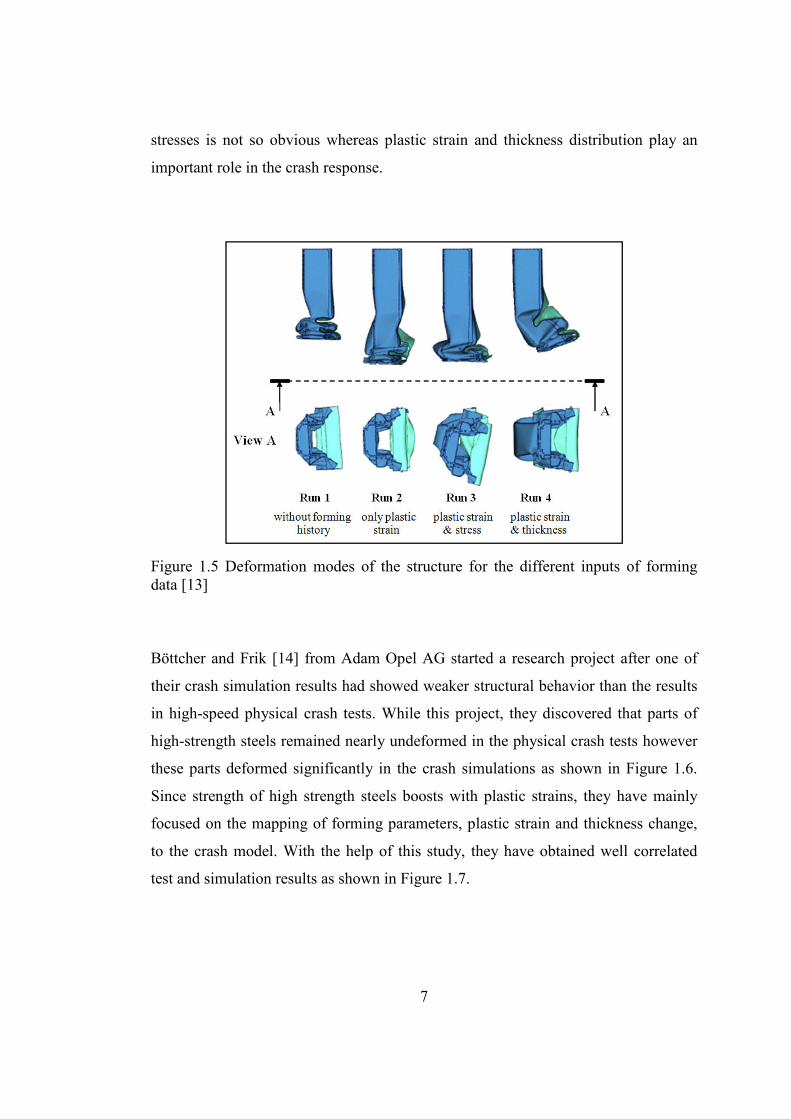
Krusper [13] from Volvo Car Corporation has studied the influences of the forming
parameters on the crash performance for his master thesis. For this purpose, he has
completed several crash simulations of a simple hat profile to investigate the
importance of different inputs of forming parameters. Figure 1.5 shows the
deformation modes of these simulations. He has concluded that influence of residual
7
stresses is not so obvious whereas plastic strain and thickness distribution play an
important role in the crash response.
Figure 1.5 Deformation modes of the structure for the different inputs of forming data [13]
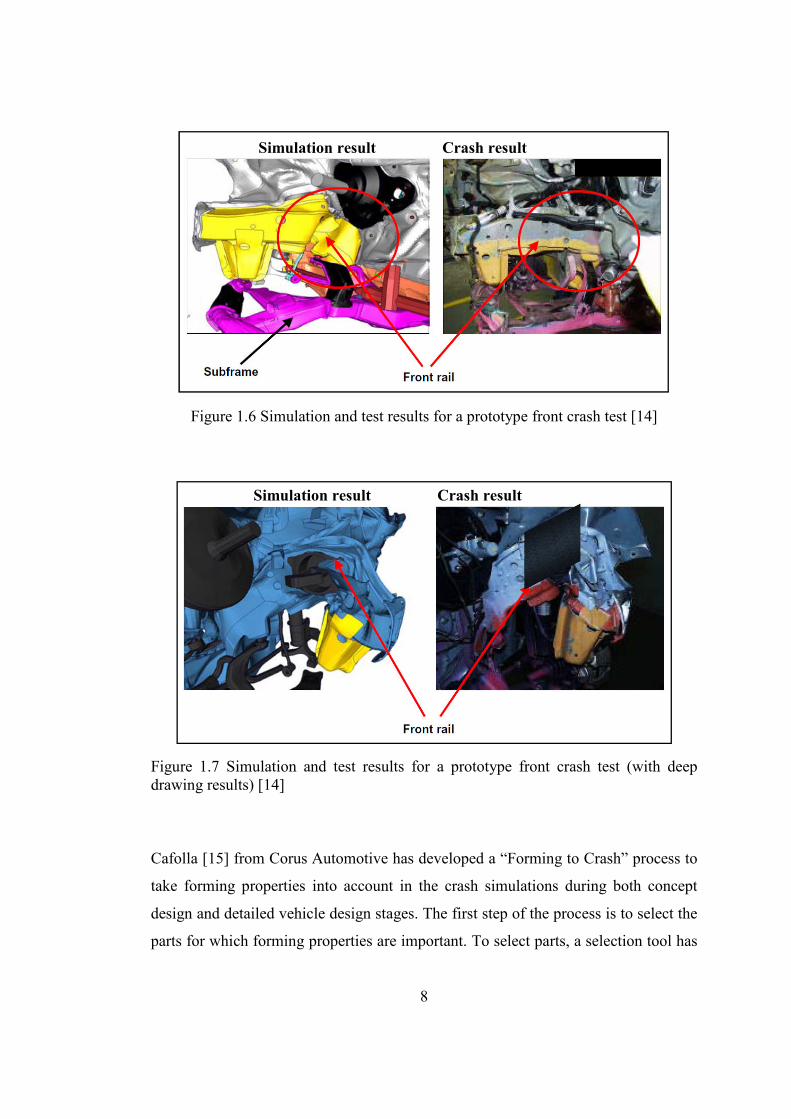
Böttcher and Frik [14] from Adam Opel AG started a research project after one of
their crash simulation results had showed weaker structural behavior than the results
in high-speed physical crash tests. While this project, they discovered that parts of
high-strength steels remained nearly undeformed in the physical crash tests however
these parts deformed significantly in the crash simulations as shown in Figure 1.6.
Since strength of high strength steels boosts with plastic strains, they have mainly
focused on the mapping of forming parameters, plastic strain and thickness change,
to the crash model. With the help of this study, they have obtained well correlated
test and simulation results as shown in Figure 1.7.
8
Figure 1.6 Simulation and test results for a prototype front crash test [14]
Figure 1.7 Simulation and test results for a prototype front crash test (with deep drawing results) [14]
Cafolla [15] from Corus Automotive has developed a “Forming to Crash” process to
take forming properties into account in the crash simulations during both concept
design and detailed vehicle design stages. The first step of the process is to select the
parts for which forming properties are important. To select parts, a selection tool has
Simulation result Crash result
Simulation result Crash result

9
been developed that has five built-in scenarios to compare sensitivity to the peak
force and energy absorption of the parts. The second step takes place during the
concept design stage. In this step, material and forming experts estimate the forming
strain distribution and thickness change as shown in Figure 1.8 with simple hand
calculations and assumptions. In the last step, since design is almost steady, forming
properties are gathered from detailed forming simulations by using FEM and map
these results to the crash model. In order to show the significance of “Forming to
Crash” process, he has completed a case study by utilizing some of the front impact
members of ultra light steel auto body (ULSAB) vehicle. In this case study, although,
the thickness change and plastic strains were included for the lower longitudinal
(sub-frame extension) only, differences in crash response of the whole structure (as
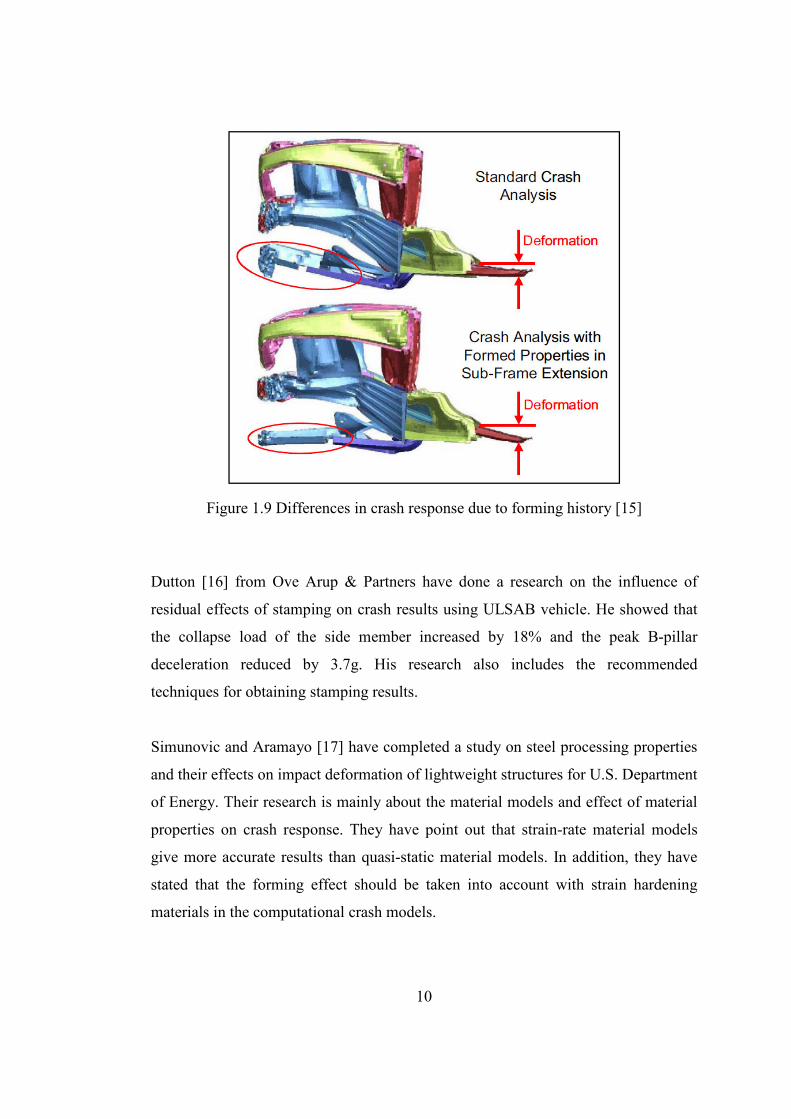
shown in Figure 1.9) could not be underestimated. So that, he has concluded that
“Forming to Crash process is very important.
Figure 1.8 Estimated zones of forming strain [15]
10
Figure 1.9 Differences in crash response due to forming history [15]
Dutton [16] from Ove Arup & Partners have done a research on the influence of
residual effects of stamping on crash results using ULSAB vehicle. He showed that
the collapse load of the side member increased by 18% and the peak B-pillar
deceleration reduced by 3.7g. His research also includes the recommended
techniques for obtaining stamping results.
Simunovic and Aramayo [17] have completed a study on steel processing properties
and their effects on impact deformation of lightweight structures for U.S. Department
of Energy. Their research is mainly about the material models and effect of material
properties on crash response. They have point out that strain-rate material models
give more accurate results than quasi-static material models. In addition, they have
stated that the forming effect should be taken into account with strain hardening
materials in the computational crash models.
11
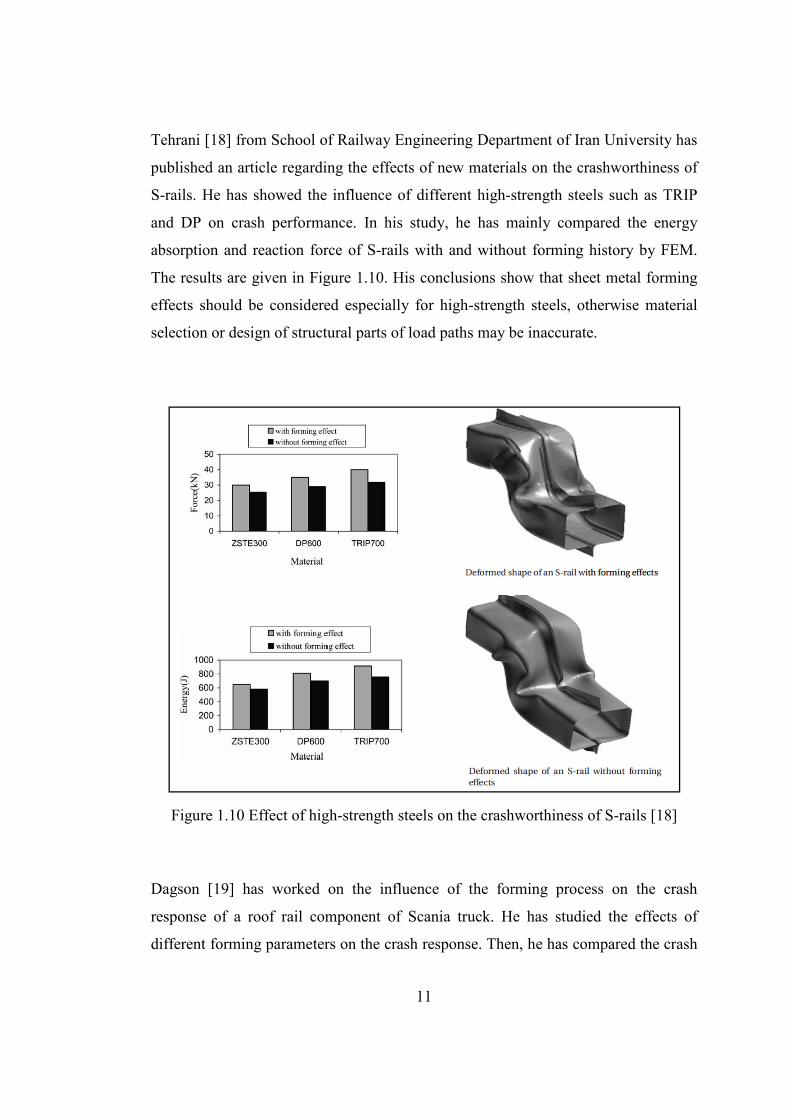
Tehrani [18] from School of Railway Engineering Department of Iran University has
published an article regarding the effects of new materials on the crashworthiness of
S-rails. He has showed the influence of different high-strength steels such as TRIP
and DP on crash performance. In his study, he has mainly compared the energy
absorption and reaction force of S-rails with and without forming history by FEM.
The results are given in Figure 1.10. His conclusions show that sheet metal forming
effects should be considered especially for high-strength steels, otherwise material
selection or design of structural parts of load paths may be inaccurate.
Figure 1.10 Effect of high-strength steels on the crashworthiness of S-rails [18]
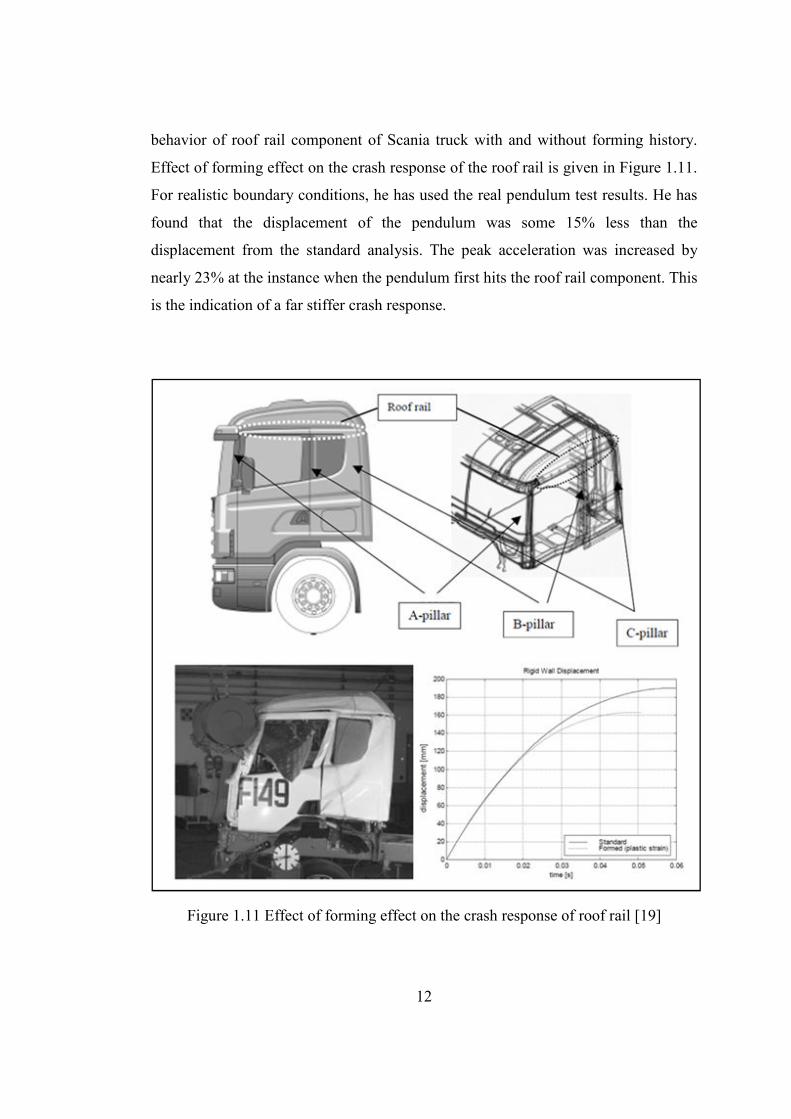
Dagson [19] has worked on the influence of the forming process on the crash
response of a roof rail component of Scania truck. He has studied the effects of
different forming parameters on the crash response. Then, he has compared the crash
12
behavior of roof rail component of Scania truck with and without forming history.
Effect of forming effect on the crash response of the roof rail is given in Figure 1.11.
For realistic boundary conditions, he has used the real pendulum test results. He has
found that the displacement of the pendulum was some 15% less than the
displacement from the standard analysis. The peak acceleration was increased by
nearly 23% at the instance when the pendulum first hits the roof rail component. This
is the indication of a far stiffer crash response.
Figure 1.11 Effect of forming effect on the crash response of roof rail [19]
13
1.3 Strain Hardening and Thickness Change during Forming
When shaping the metal into its final form, plastic strain is introduced in the material
and thickness of the metal does not remain the same.
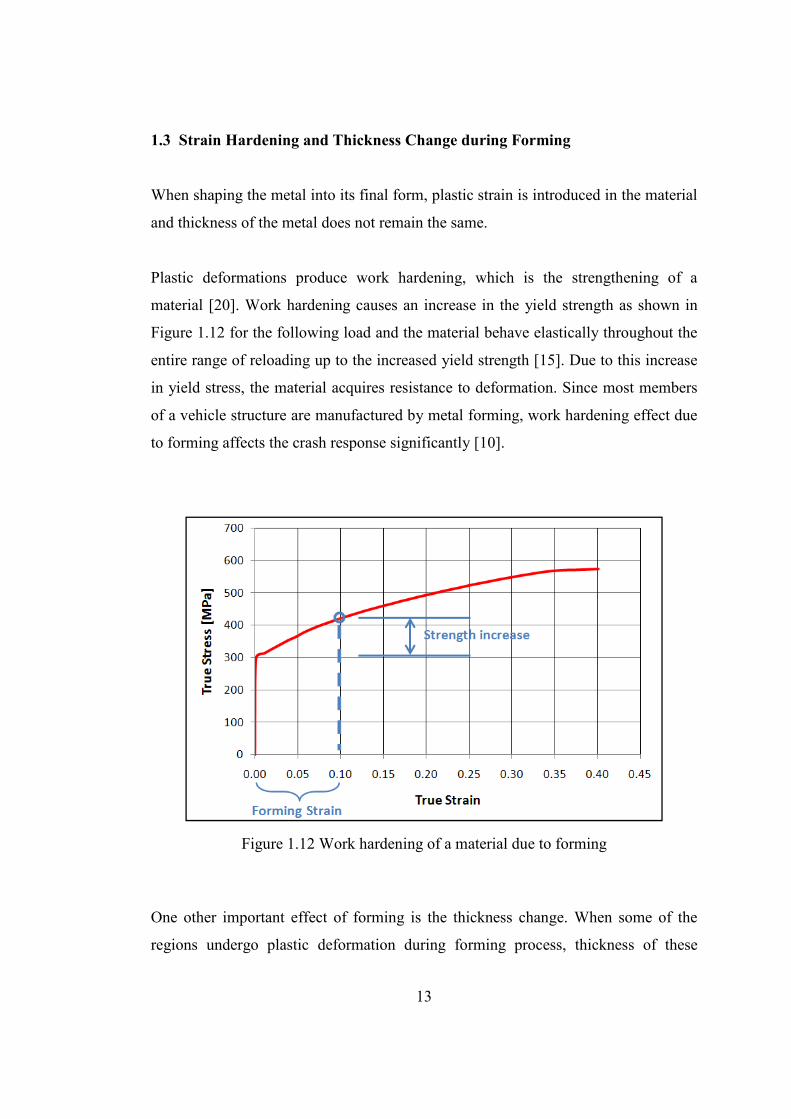
Plastic deformations produce work hardening, which is the strengthening of a
material [20]. Work hardening causes an increase in the yield strength as shown in
Figure 1.12 for the following load and the material behave elastically throughout the
entire range of reloading up to the increased yield strength [15]. Due to this increase
in yield stress, the material acquires resistance to deformation. Since most members
of a vehicle structure are manufactured by metal forming, work hardening effect due
to forming affects the crash response significantly [10].
Figure 1.12 Work hardening of a material due to forming
One other important effect of forming is the thickness change. When some of the
regions undergo plastic deformation during forming process, thickness of these
14
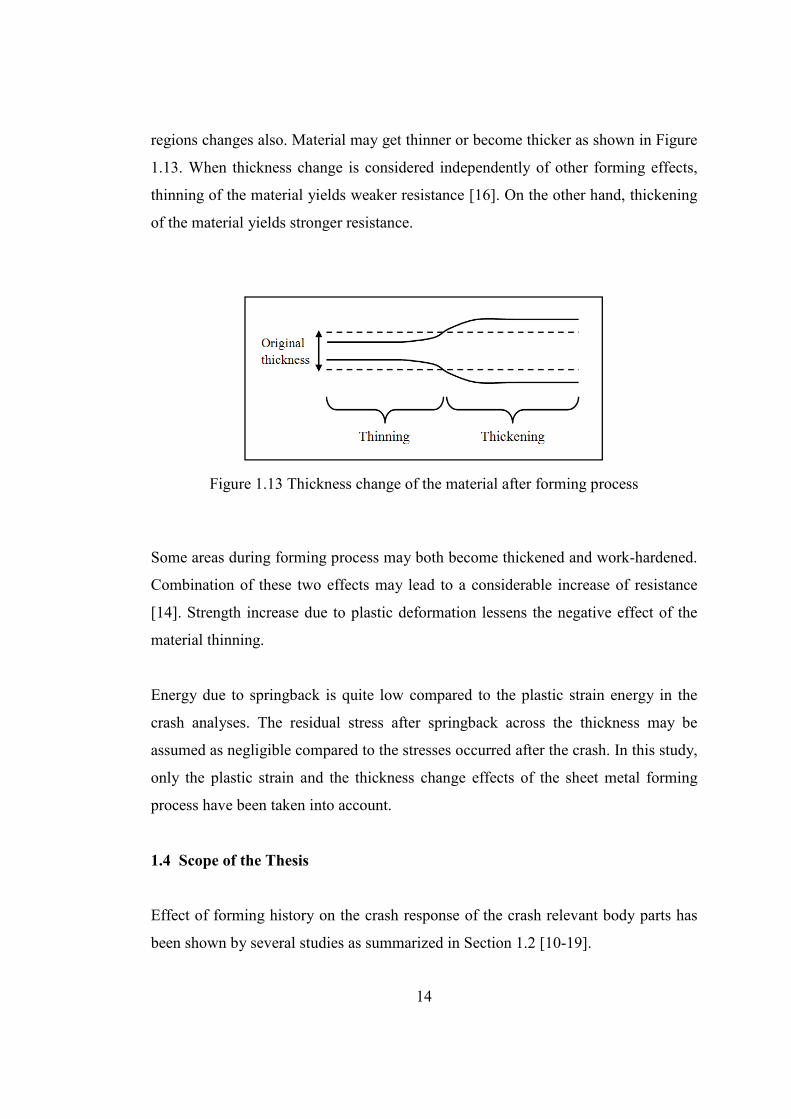
regions changes also. Material may get thinner or become thicker as shown in Figure
1.13. When thickness change is considered independently of other forming effects,
thinning of the material yields weaker resistance [16]. On the other hand, thickening
of the material yields stronger resistance.
Figure 1.13 Thickness change of the material after forming process
Some areas during forming process may both become thickened and work-hardened.
Combination of these two effects may lead to a considerable increase of resistance
[14]. Strength increase due to plastic deformation lessens the negative effect of the
material thinning.
Energy due to springback is quite low compared to the plastic strain energy in the
crash analyses. The residual stress after springback across the thickness may be
assumed as negligible compared to the stresses occurred after the crash. In this study,
only the plastic strain and the thickness change effects of the sheet metal forming
process have been taken into account.
1.4 Scope of the Thesis
Effect of forming history on the crash response of the crash relevant body parts has
been shown by several studies as summarized in Section 1.2 [10-19].
15
The main goal of this study is to show that the changes in material properties due to
sheet metal forming process introduce changes in the crashworthiness of the load
carrying parts and overall crash response of the vehicle.
The first step of this study is to select the main impact members of Ford F250
Pickup. For this purpose, FEA of full frontal crash of the particular vehicle is
performed at 56 kph by using the material properties of undeformed sheet metal as
described in Chapter 2. Instead of considering forming history of all structural
components, the main impact members of the load paths are chosen since it is a time-
consuming process to obtain the forming history of all structural components in a
vehicle. In addition, effect of the forming history for main impact members can be
more appreciable since these crash relevant parts are designed to absorb most of the
energy under impact.
The second step is to acquire the forming history of each selected member as
described in Chapter 3. In this step, detailed sheet metal forming simulations are
performed to obtain the final shape of the selected members with forming process.
Thus, plastic strain distribution and thickness distribution can be available for the
next step.
The plastic strain and thickness distribution due to sheet metal forming process of
each selected part are mapped to the FE model of Ford F250 as initial condition. The
updated crash model is run in order to see the influence of the forming on the crash
response as described in Chapter 4. Results of the former analysis and the latter
analysis are compared with the physical test results in the same chapter.
Finally, Chapter 5 presents the concluding remarks of the thesis work and suggests
for future studies.
16
CHAPTER 2
2 FRONTAL CRASH ANALYSIS WITHOUT SHEET METAL
FORMING HISTORY
2.1 Introduction
Frontal crash analysis of Ford F250 Pickup has been performed according to FMVSS
208 protocol of U.S. National Highway Traffic Safety Administration (NHTSA)
[21]. Based on this protocol, full frontal crash simulation to the rigid wall has been
carried out at 56 kph. In this analysis, sheet metal forming history has been ignored.
Thickness of each part has been assumed as constant and material properties of the
undeformed sheet are taken.
The main purpose of this full frontal crash analysis is to select the main impact
members building up the main load path for the next step. The other goal is to verify
the FE model with the physical crash test results.
2.2 Finite Element Software Used in the Study
For the numerical analyses LS-DYNA, a general-purpose nonlinear finite element
program that is capable of simulating complex problems, has been selected [22].
During this study, two types of analyses have been carried out, full vehicle crash
analysis and sheet metal forming analysis. To prepare the input deck for these
analyses and to post-process the results, LS-PrePost has been utilized since it is an
advanced interactive program, especially developed for LS-DYNA. In addition, prior
17
to metal forming analyses, MSC.Sofy has been utilized in order to create FE models
of forming tools.
In this study, sheet-metal forming analyses and full vehicle frontal crash analyses
have been solved with explicit method. These types of problems contain high non-
linearity due to the complex material models in order to simulate accurate material
behavior, the contact algorithm and large deformations. In addition to these, during a
crash, vehicle is exposed to impulsive loads which yield large deformations and large
strains in a very short time. Considering size of the FE model of the vehicle, it is
difficult to converge to a solution by taking the inverse of stiffness matrix, i.e. with
implicit method [23].
2.3 Vehicle Model
The detailed FE model of 2006 Ford F250 Pickup, which has been verified with
tests, has been downloaded from the official web site of National Crash Analysis
Center (NCAC) and utilized in this study [24]. NCAC is a collaborative effort among
the Federal Highway Administration (FHWA), the National Highway Traffic Safety
Administration (NHTSA) and George Washington University (GWU). Main function
of NCAC is to research on vehicle safety and reduce fatalities and injuries.
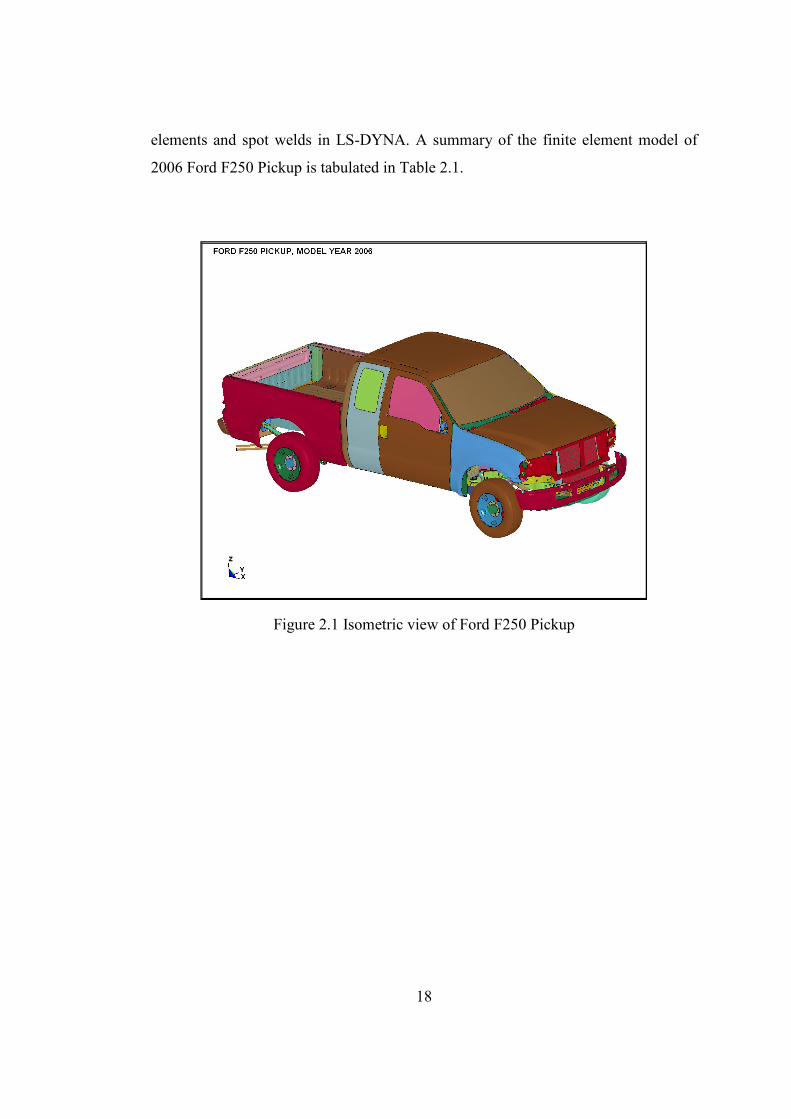
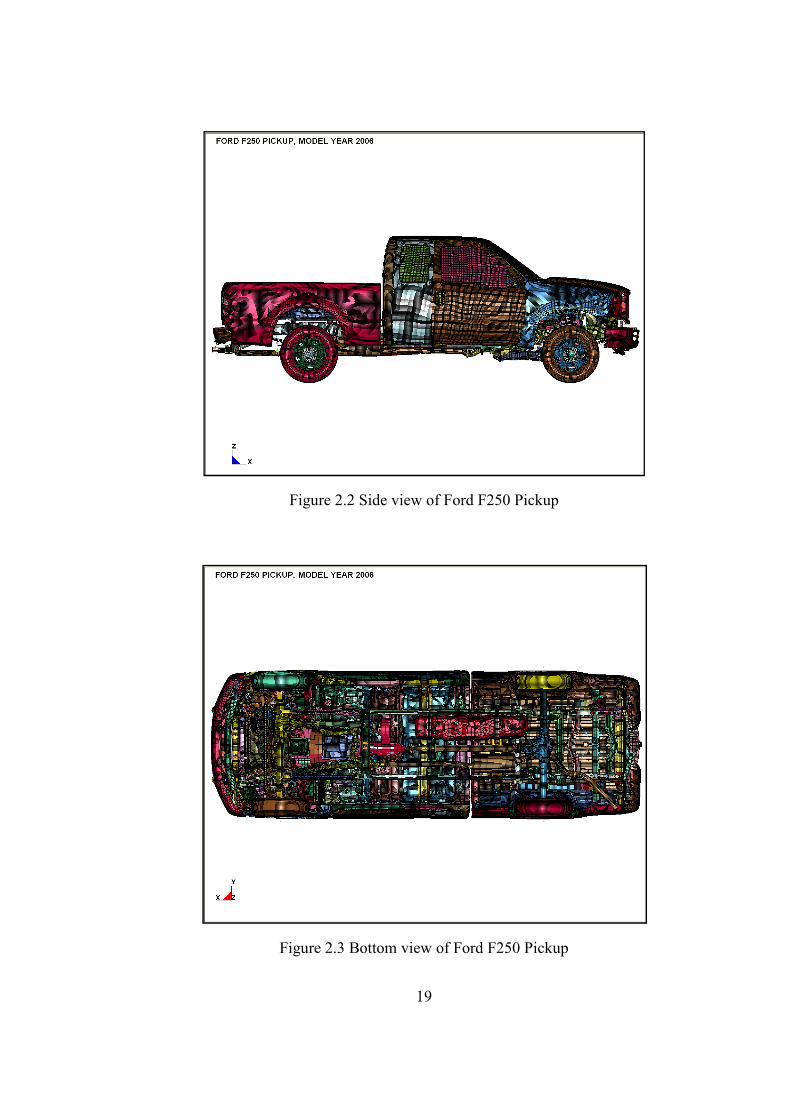
Figures 2.1 - 2.3 show the various views of the finite element model of Ford F250
Pickup. The model consists of 726629 elements and divided into 742 parts
representing the components of the vehicle. Out of the 742 parts, 637 parts are made
from the shell elements to model sheet metal parts, 19 parts are made from the beam
elements to represent steel bars, bolts and welds, 72 parts are made from the solid
elements to model solid parts such as fan, radiator, engine parts and 14 parts are
made from the discrete elements in order to represent springs and dampers. The
components of the vehicle are connected to each other with nodal rigid body
18
elements and spot welds in LS-DYNA. A summary of the finite element model of
2006 Ford F250 Pickup is tabulated in Table 2.1.
Figure 2.1 Isometric view of Ford F250 Pickup
19
Figure 2.2 Side view of Ford F250 Pickup
Figure 2.3 Bottom view of Ford F250 Pickup
20
Table 2.1 2006 Ford F250 Pickup – vehicle finite element model summary
Number of Parts 742
Number of Nodes 738004
Number of Shell Elements 698372
Number of Solid Elements 25905
Number of Beam Elements 2305
Number of Rigid Elements 14831
Number of Discrete Elements 47
Total Number of Elements 726629
2.4 Analysis Results
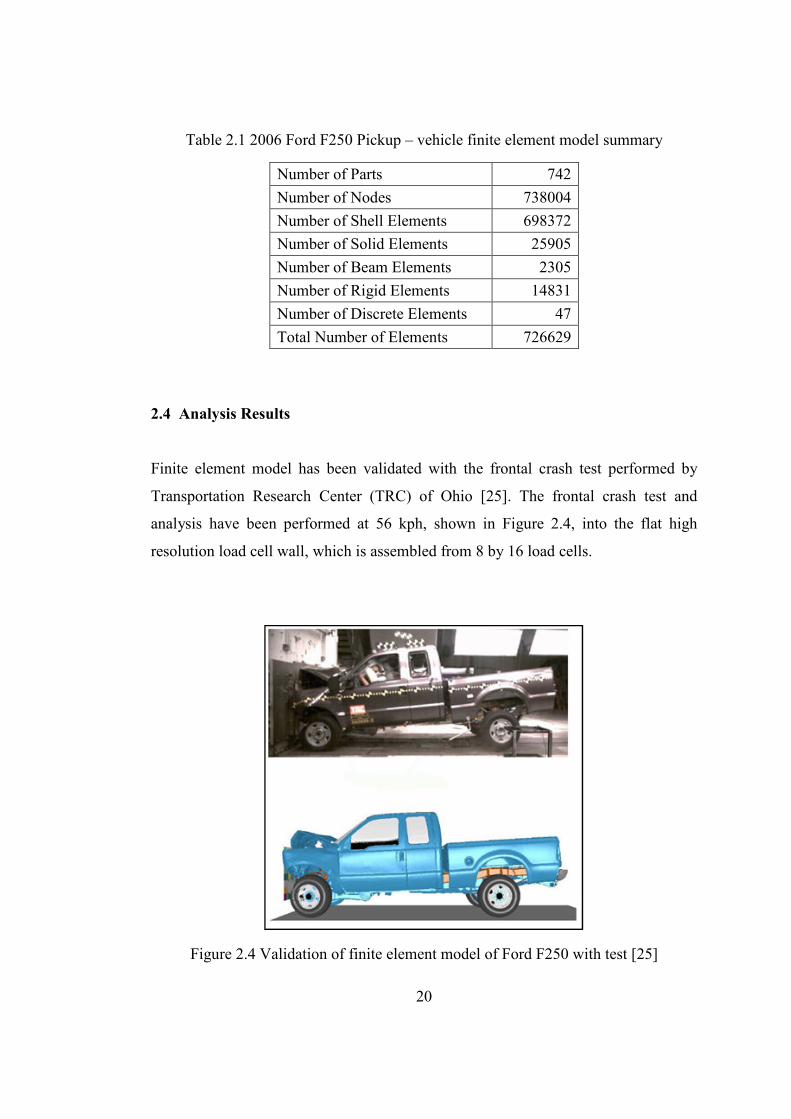
Finite element model has been validated with the frontal crash test performed by
Transportation Research Center (TRC) of Ohio [25]. The frontal crash test and
analysis have been performed at 56 kph, shown in Figure 2.4, into the flat high
resolution load cell wall, which is assembled from 8 by 16 load cells.
Figure 2.4 Validation of finite element model of Ford F250 with test [25]
21
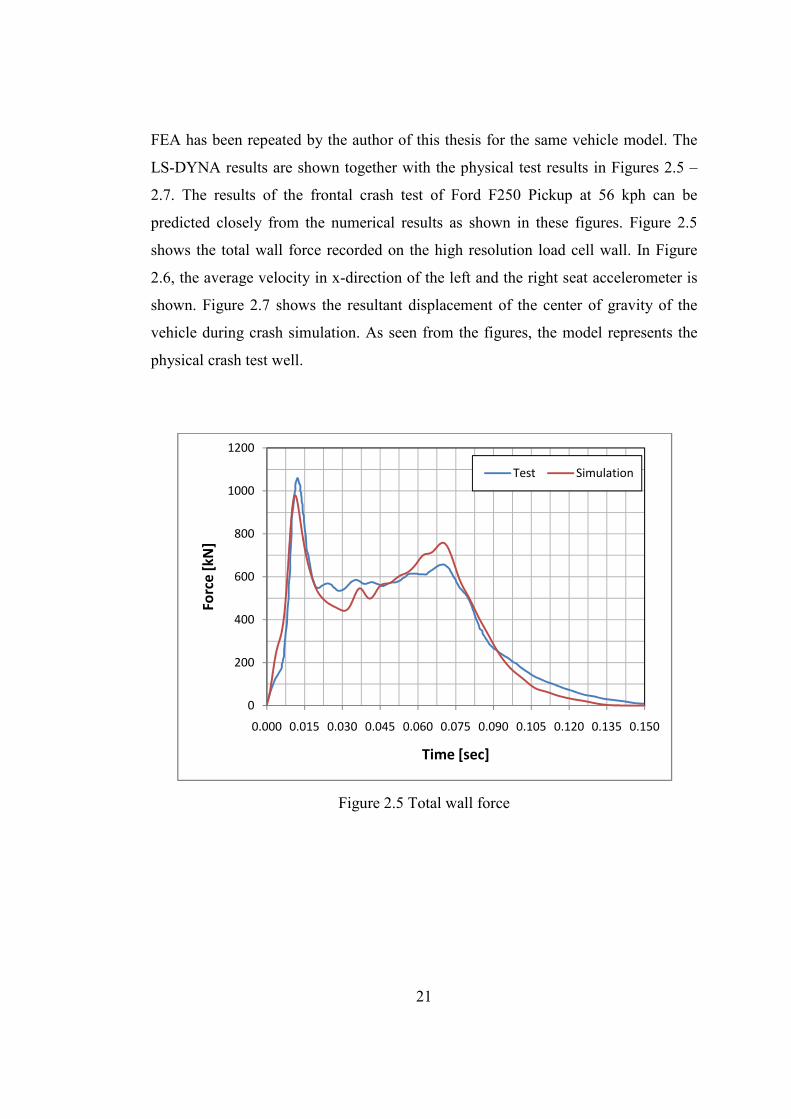
FEA has been repeated by the author of this thesis for the same vehicle model. The
LS-DYNA results are shown together with the physical test results in Figures 2.5 –
2.7. The results of the frontal crash test of Ford F250 Pickup at 56 kph can be
predicted closely from the numerical results as shown in these figures. Figure 2.5
shows the total wall force recorded on the high resolution load cell wall. In Figure
2.6, the average velocity in x-direction of the left and the right seat accelerometer is
shown. Figure 2.7 shows the resultant displacement of the center of gravity of the
vehicle during crash simulation. As seen from the figures, the model represents the
physical crash test well.
Figure 2.5 Total wall force
0
200
400
600
800
1000
1200
0.000 0.015 0.030 0.045 0.060 0.075 0.090 0.105 0.120 0.135 0.150
Fo
rce
[k
N]
Time [sec]
Test Simulation

22
Figure 2.6 Average velocity of left seat and right seat accelerometer
Figure 2.7 Resultant displacement of vehicle CG
-10
0
10
20
30
40
50
60
0.000 0.015 0.030 0.045 0.060 0.075 0.090 0.105 0.120 0.135 0.150
Ve
loci
ty [
kp
h]
Time [sec]
Test Simulation
0
100
200
300
400
500
600
700
800
900
0.000 0.015 0.030 0.045 0.060 0.075 0.090 0.105 0.120 0.135 0.150
Dis
pla
cem
en
t [m
m]
Time [sec]
Test Simulation
23
2.5 Selection of Main Impact Members
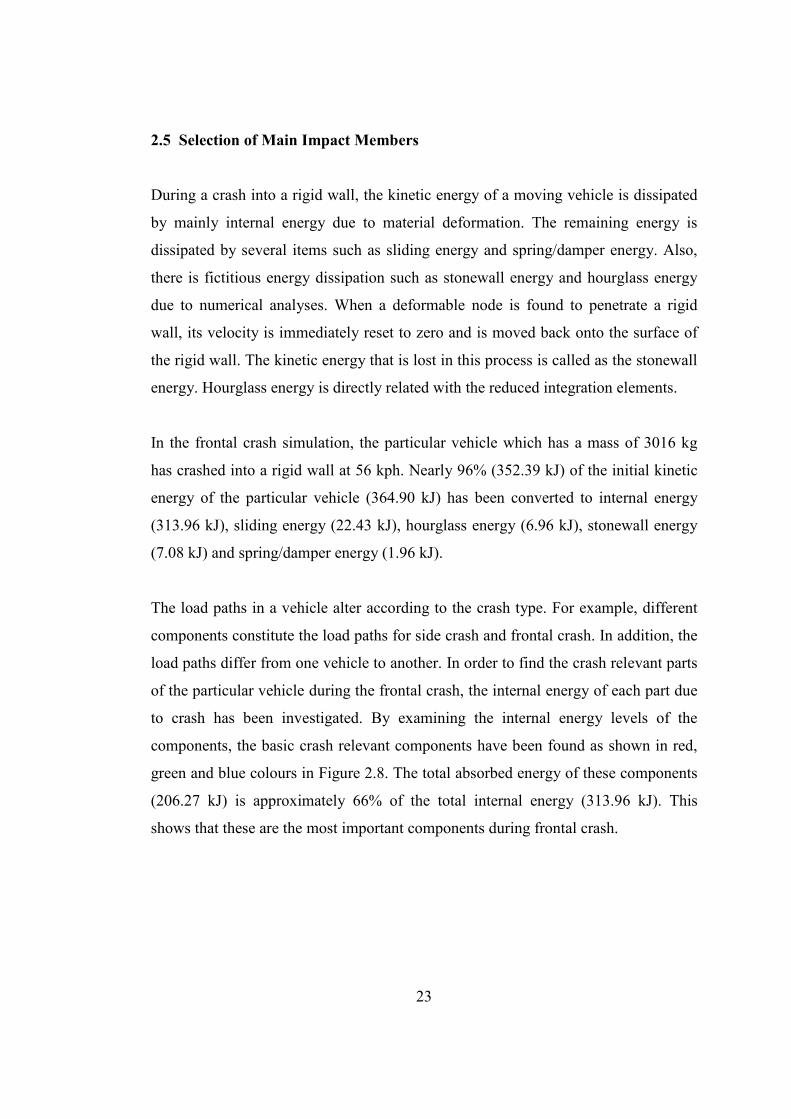
During a crash into a rigid wall, the kinetic energy of a moving vehicle is dissipated
by mainly internal energy due to material deformation. The remaining energy is
dissipated by several items such as sliding energy and spring/damper energy. Also,
there is fictitious energy dissipation such as stonewall energy and hourglass energy
due to numerical analyses. When a deformable node is found to penetrate a rigid
wall, its velocity is immediately reset to zero and is moved back onto the surface of
the rigid wall. The kinetic energy that is lost in this process is called as the stonewall
energy. Hourglass energy is directly related with the reduced integration elements.
In the frontal crash simulation, the particular vehicle which has a mass of 3016 kg
has crashed into a rigid wall at 56 kph. Nearly 96% (352.39 kJ) of the initial kinetic
energy of the particular vehicle (364.90 kJ) has been converted to internal energy
(313.96 kJ), sliding energy (22.43 kJ), hourglass energy (6.96 kJ), stonewall energy
(7.08 kJ) and spring/damper energy (1.96 kJ).
The load paths in a vehicle alter according to the crash type. For example, different
components constitute the load paths for side crash and frontal crash. In addition, the
load paths differ from one vehicle to another. In order to find the crash relevant parts
of the particular vehicle during the frontal crash, the internal energy of each part due
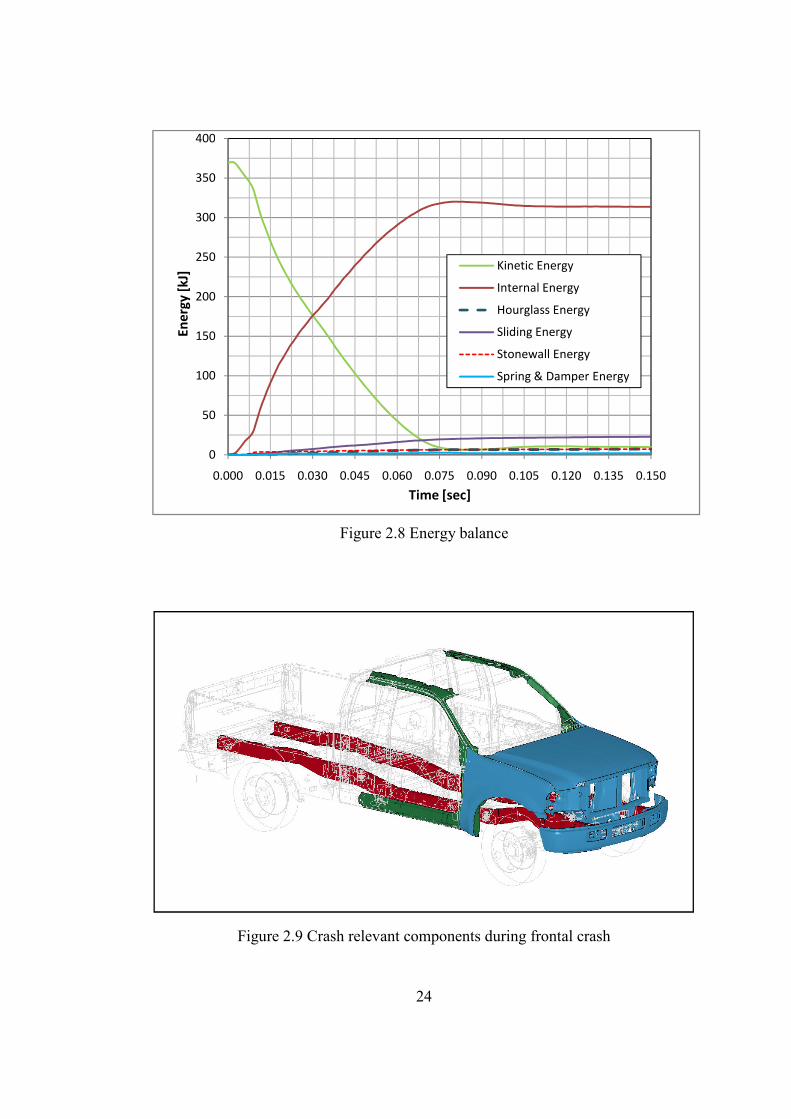
to crash has been investigated. By examining the internal energy levels of the
components, the basic crash relevant components have been found as shown in red,
green and blue colours in Figure 2.8. The total absorbed energy of these components
(206.27 kJ) is approximately 66% of the total internal energy (313.96 kJ). This
shows that these are the most important components during frontal crash.
24
Figure 2.8 Energy balance
Figure 2.9 Crash relevant components during frontal crash
0
50
100
150
200
250
300
350
400
0.000 0.015 0.030 0.045 0.060 0.075 0.090 0.105 0.120 0.135 0.150
En
erg
y [
kJ]
Time [sec]
Kinetic Energy
Internal Energy
Hourglass Energy
Sliding Energy
Stonewall Energy
Spring & Damper Energy
25
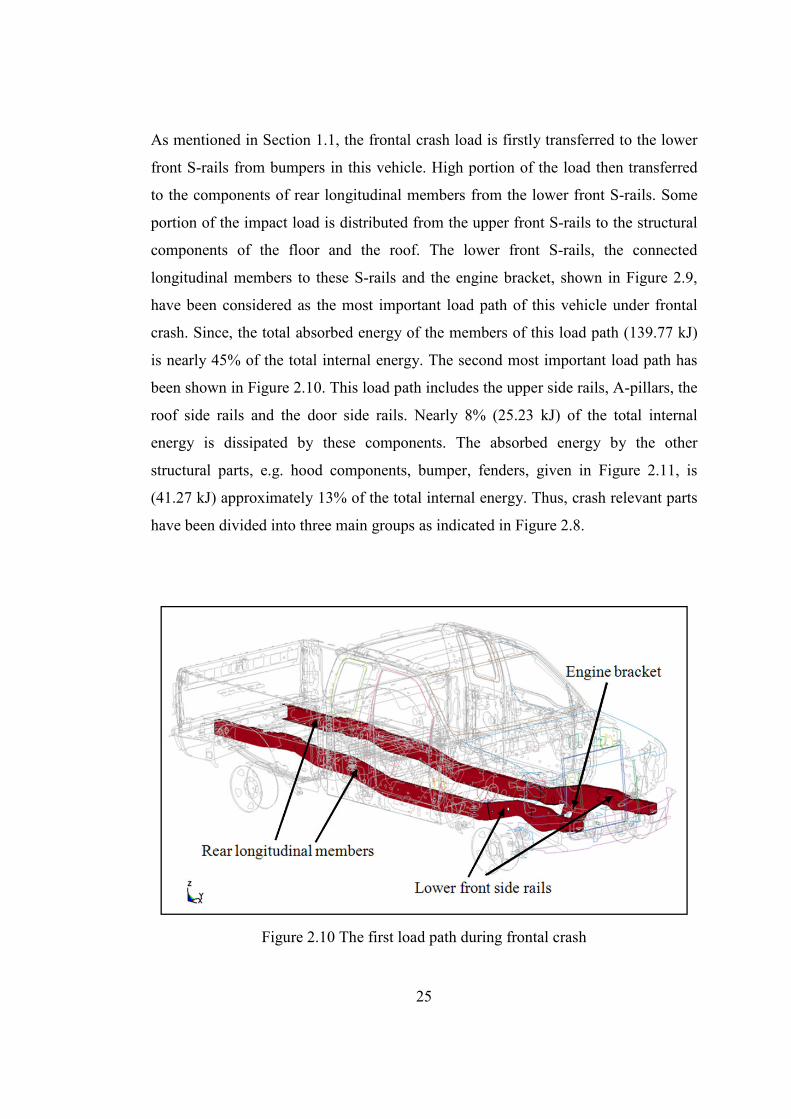
As mentioned in Section 1.1, the frontal crash load is firstly transferred to the lower
front S-rails from bumpers in this vehicle. High portion of the load then transferred
to the components of rear longitudinal members from the lower front S-rails. Some
portion of the impact load is distributed from the upper front S-rails to the structural
components of the floor and the roof. The lower front S-rails, the connected
longitudinal members to these S-rails and the engine bracket, shown in Figure 2.9,
have been considered as the most important load path of this vehicle under frontal
crash. Since, the total absorbed energy of the members of this load path (139.77 kJ)
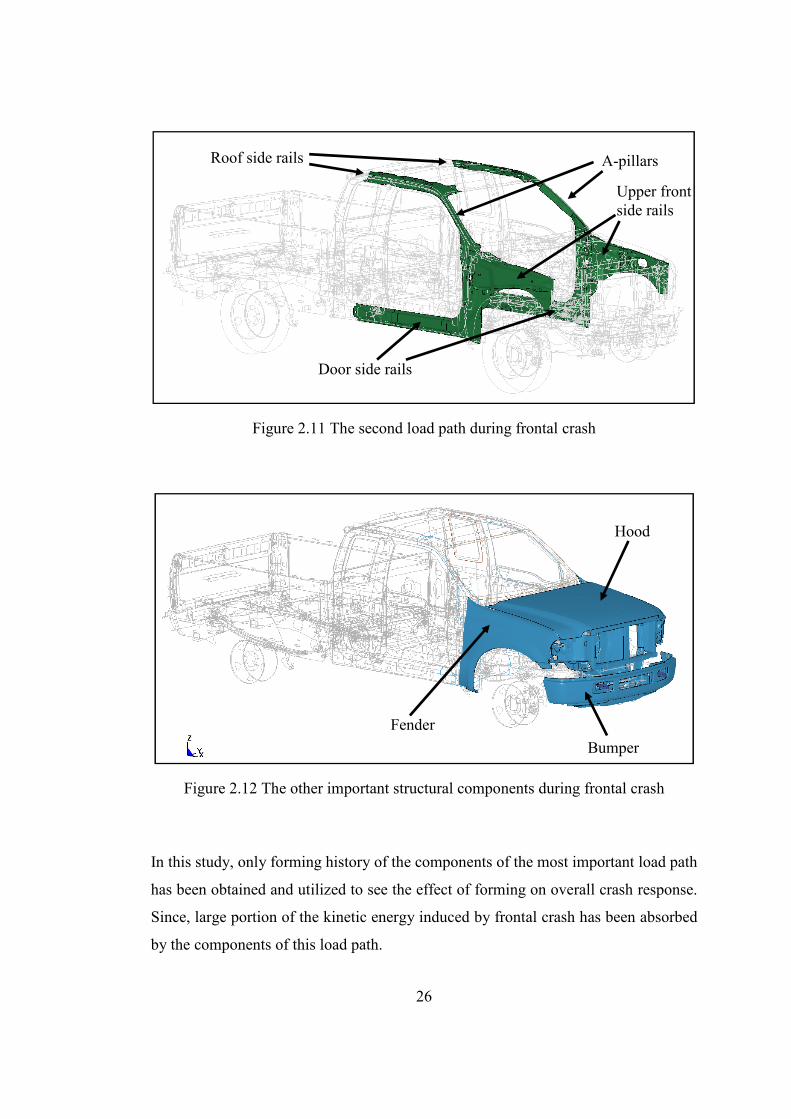
is nearly 45% of the total internal energy. The second most important load path has
been shown in Figure 2.10. This load path includes the upper side rails, A-pillars, the
roof side rails and the door side rails. Nearly 8% (25.23 kJ) of the total internal
energy is dissipated by these components. The absorbed energy by the other
structural parts, e.g. hood components, bumper, fenders, given in Figure 2.11, is
(41.27 kJ) approximately 13% of the total internal energy. Thus, crash relevant parts
have been divided into three main groups as indicated in Figure 2.8.
Figure 2.10 The first load path during frontal crash
26
Figure 2.11 The second load path during frontal crash
Figure 2.12 The other important structural components during frontal crash
In this study, only forming history of the components of the most important load path
has been obtained and utilized to see the effect of forming on overall crash response.
Since, large portion of the kinetic energy induced by frontal crash has been absorbed
by the components of this load path.
Fender
Hood
Bumper
Roof side rails
Door side rails
Upper front side rails
A-pillars
27
CHAPTER 3
3 FORMING ANALYSIS OF LOAD CARRYING MEMBERS
3.1 Introduction
The crucial components building up the most important load path during frontal
crash have been selected as mentioned in the previous chapter since large portion of
the kinetic energy induced by frontal crash has been absorbed by this load path. To
examine the sheet metal forming effects on the crash response, sheet metal forming
simulations have been carried out to detect the forming histories of these
components.
In this chapter, preparation of the forming configuration for each selected part and
sheet metal forming analyses have been explained in detail. Plastic strain distribution
and thickness change due to sheet metal forming process have been given.
3.2 Forming Analyses
It is a well known fact that shaping a sheet metal into its final shape may not be
possible with a single process. A sheet metal may come into the desired shape after
series of metal forming stages. However, in this study, it is assumed that selected
parts are manufactured with a single forming stage, deep drawing process. The main
reason is that deep drawing process, which is the forming of a sheet metal into a die
by means a punch, leads to a much larger plastic deformation of the material than
other forming stages [26].
28
Forming process of all selected parts from the sheet metal has been modeled to
obtain the plastic strain distribution and thickness changes. For the FEA of sheet
metal forming process, LS-DYNA software has been utilized.
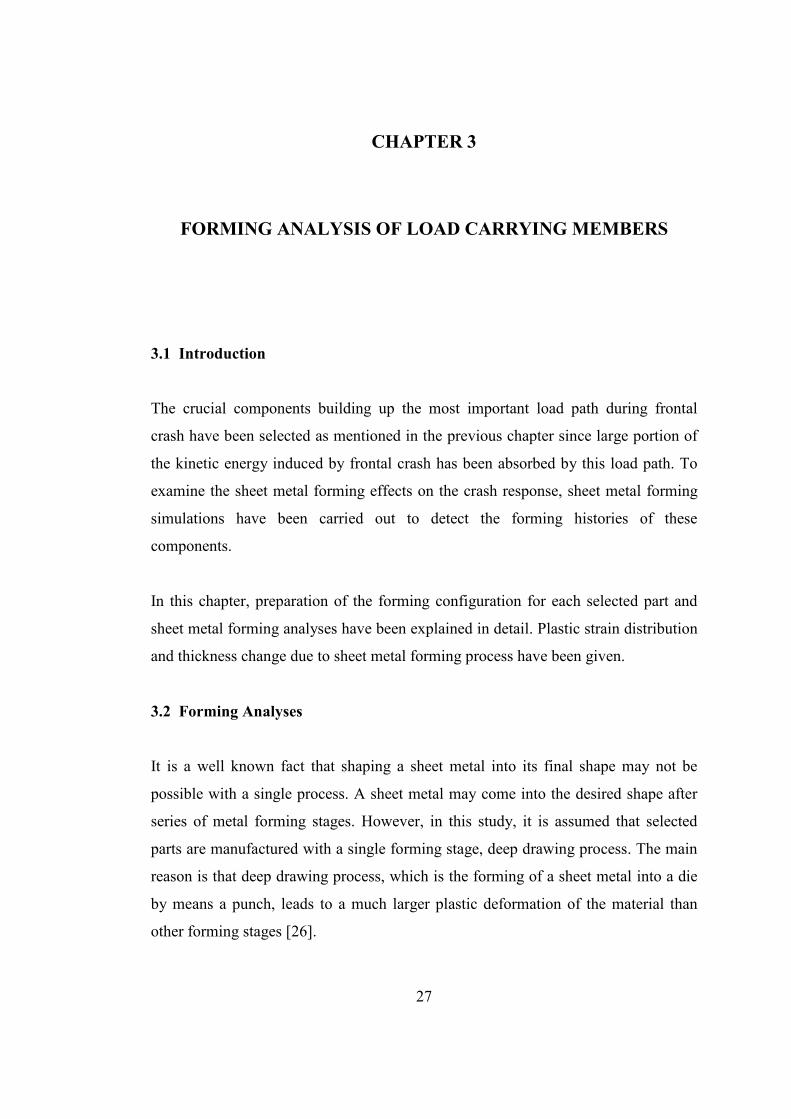
Parts building up the most important load path, which has been discussed in Chapter
2 and has been shown that it absorbs high portion of the frontal crash energy, are
shown in Figure 3.1. The numbers in the figure denote the vehicle part numbers used
in the FEM of Ford F250. Figures 3.2 - 3.10 show the selected structural components
in detail.
Figure 3.1 Selected components of Ford F250
29
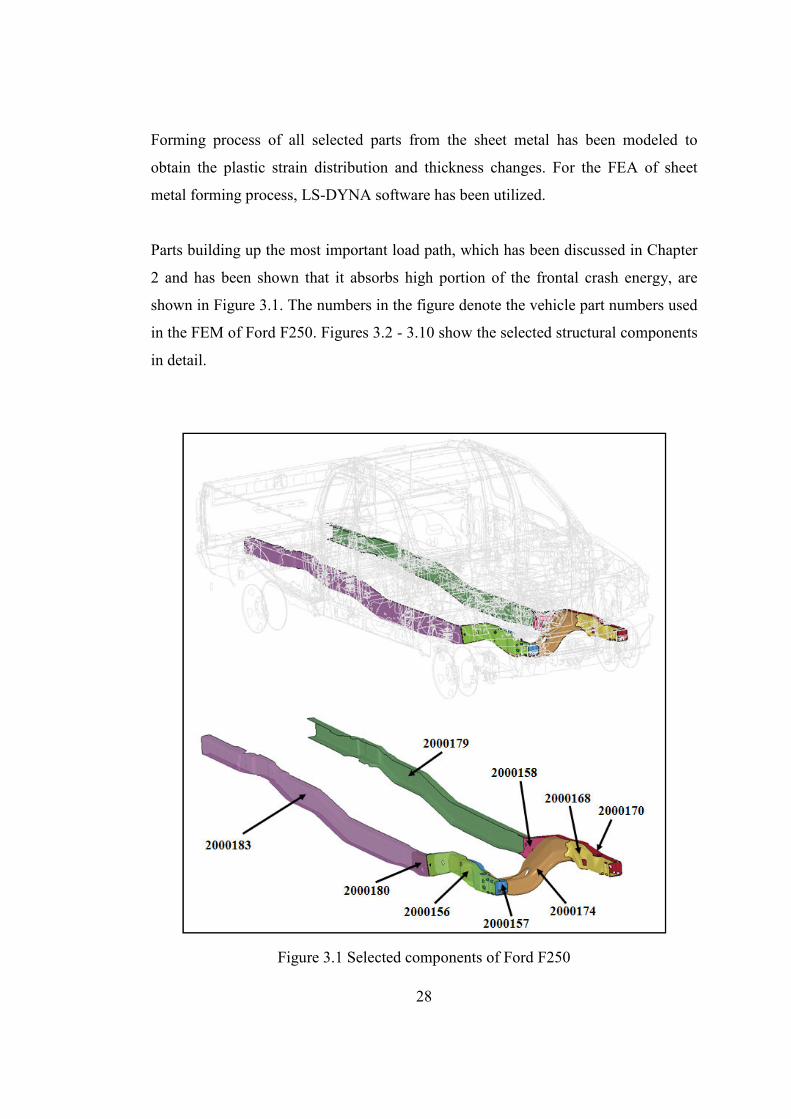
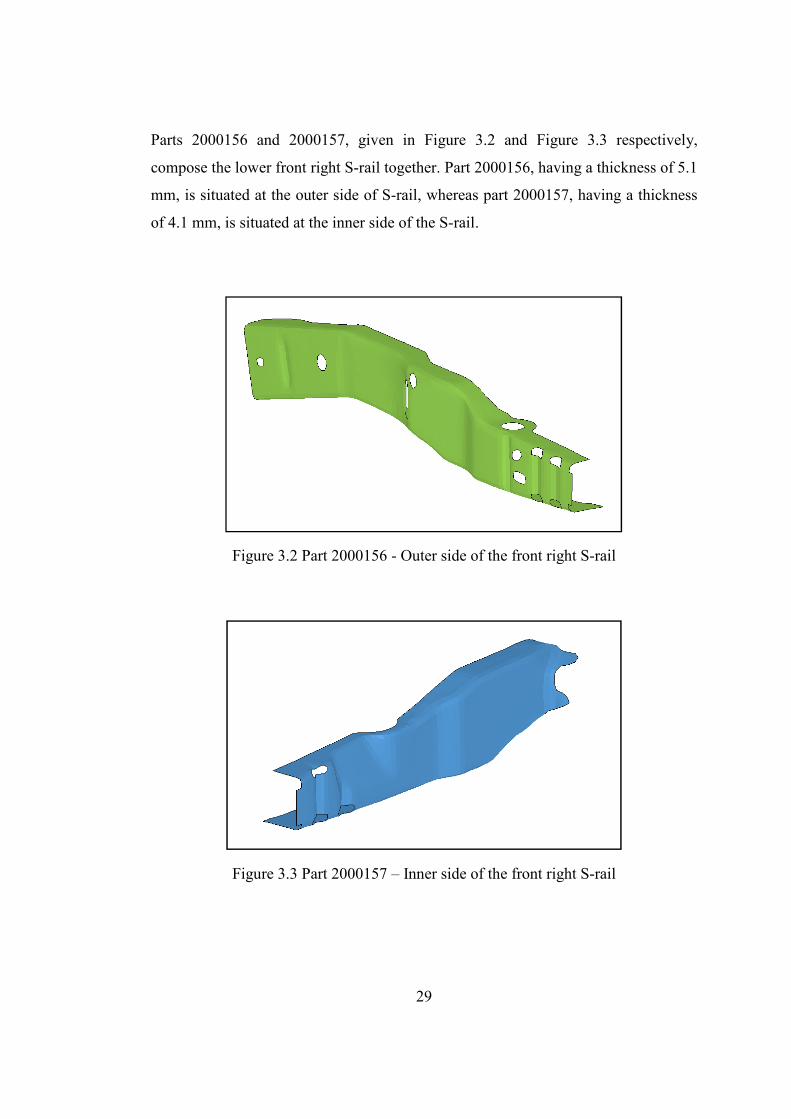
Parts 2000156 and 2000157, given in Figure 3.2 and Figure 3.3 respectively,
compose the lower front right S-rail together. Part 2000156, having a thickness of 5.1
mm, is situated at the outer side of S-rail, whereas part 2000157, having a thickness
of 4.1 mm, is situated at the inner side of the S-rail.
Figure 3.2 Part 2000156 - Outer side of the front right S-rail
Figure 3.3 Part 2000157 – Inner side of the front right S-rail
30
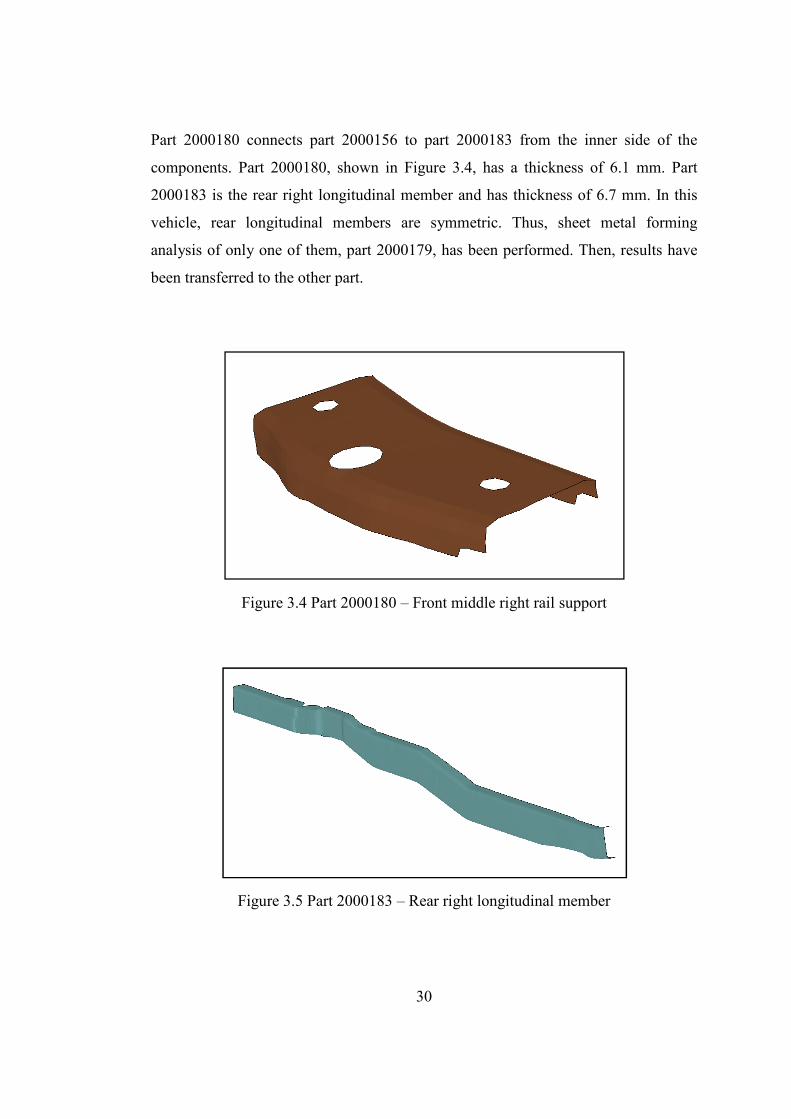
Part 2000180 connects part 2000156 to part 2000183 from the inner side of the
components. Part 2000180, shown in Figure 3.4, has a thickness of 6.1 mm. Part
2000183 is the rear right longitudinal member and has thickness of 6.7 mm. In this
vehicle, rear longitudinal members are symmetric. Thus, sheet metal forming
analysis of only one of them, part 2000179, has been performed. Then, results have
been transferred to the other part.
Figure 3.4 Part 2000180 – Front middle right rail support
Figure 3.5 Part 2000183 – Rear right longitudinal member
31
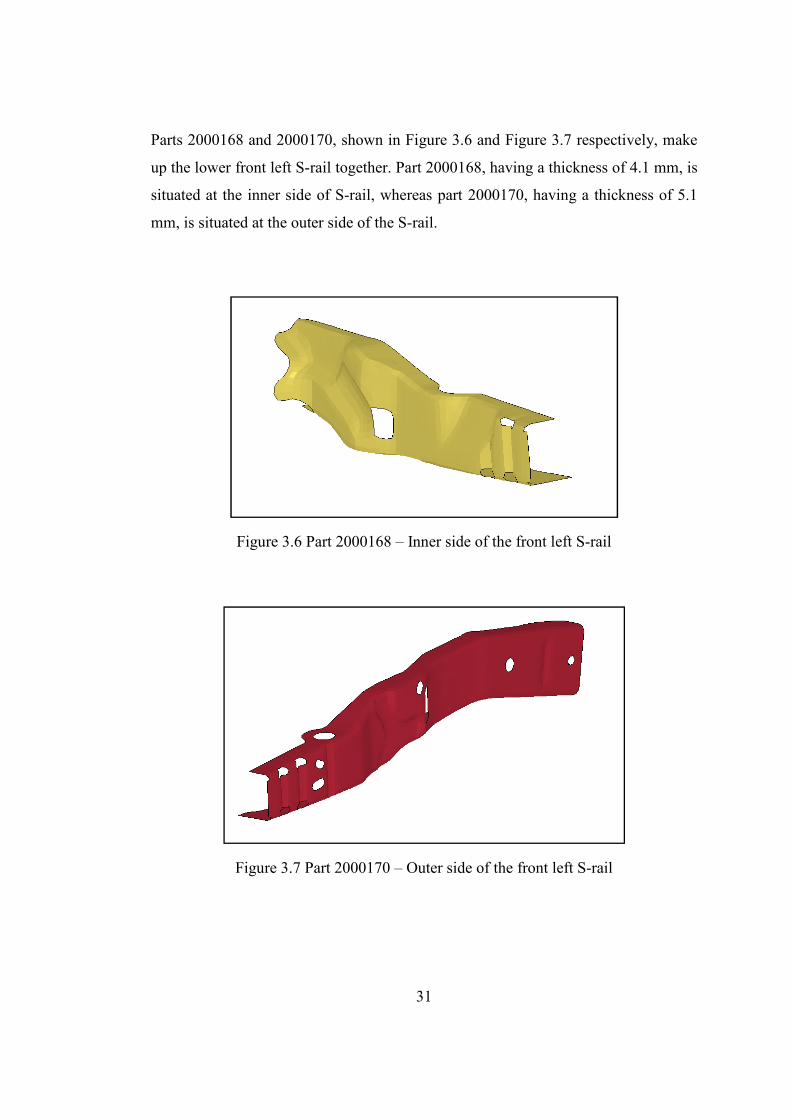
Parts 2000168 and 2000170, shown in Figure 3.6 and Figure 3.7 respectively, make
up the lower front left S-rail together. Part 2000168, having a thickness of 4.1 mm, is
situated at the inner side of S-rail, whereas part 2000170, having a thickness of 5.1
mm, is situated at the outer side of the S-rail.
Figure 3.6 Part 2000168 – Inner side of the front left S-rail
Figure 3.7 Part 2000170 – Outer side of the front left S-rail

32
Part 2000158 connects part 2000170 to part 2000179 from the inner side of the
components. Part 2000158, shown in Figure 3.8, has a thickness of 6.1 mm. Part
2000179 is the rear left longitudinal member and has thickness of 6.7 mm.
Figure 3.8 Part 2000158 – Front middle left rail support
Figure 3.9 Part 2000179 – Rear left longitudinal member
33
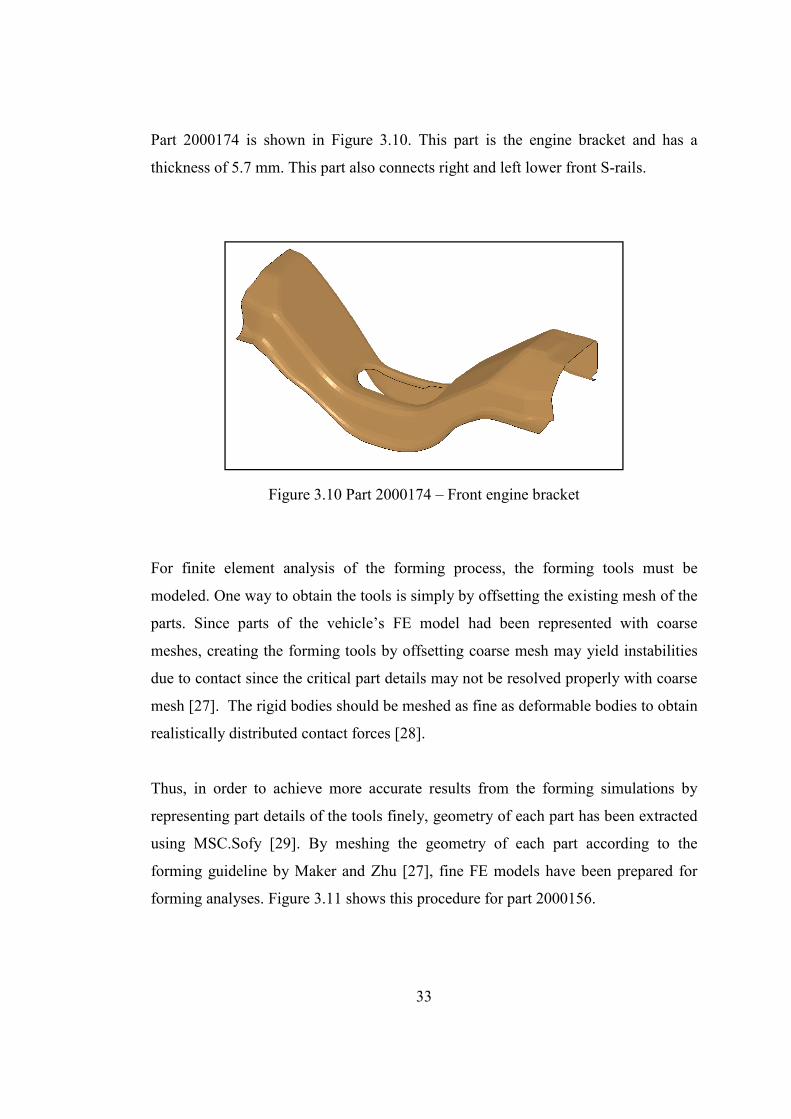
Part 2000174 is shown in Figure 3.10. This part is the engine bracket and has a
thickness of 5.7 mm. This part also connects right and left lower front S-rails.
Figure 3.10 Part 2000174 – Front engine bracket
For finite element analysis of the forming process, the forming tools must be
modeled. One way to obtain the tools is simply by offsetting the existing mesh of the
parts. Since parts of the vehicle’s FE model had been represented with coarse
meshes, creating the forming tools by offsetting coarse mesh may yield instabilities
due to contact since the critical part details may not be resolved properly with coarse
mesh [27]. The rigid bodies should be meshed as fine as deformable bodies to obtain
realistically distributed contact forces [28].
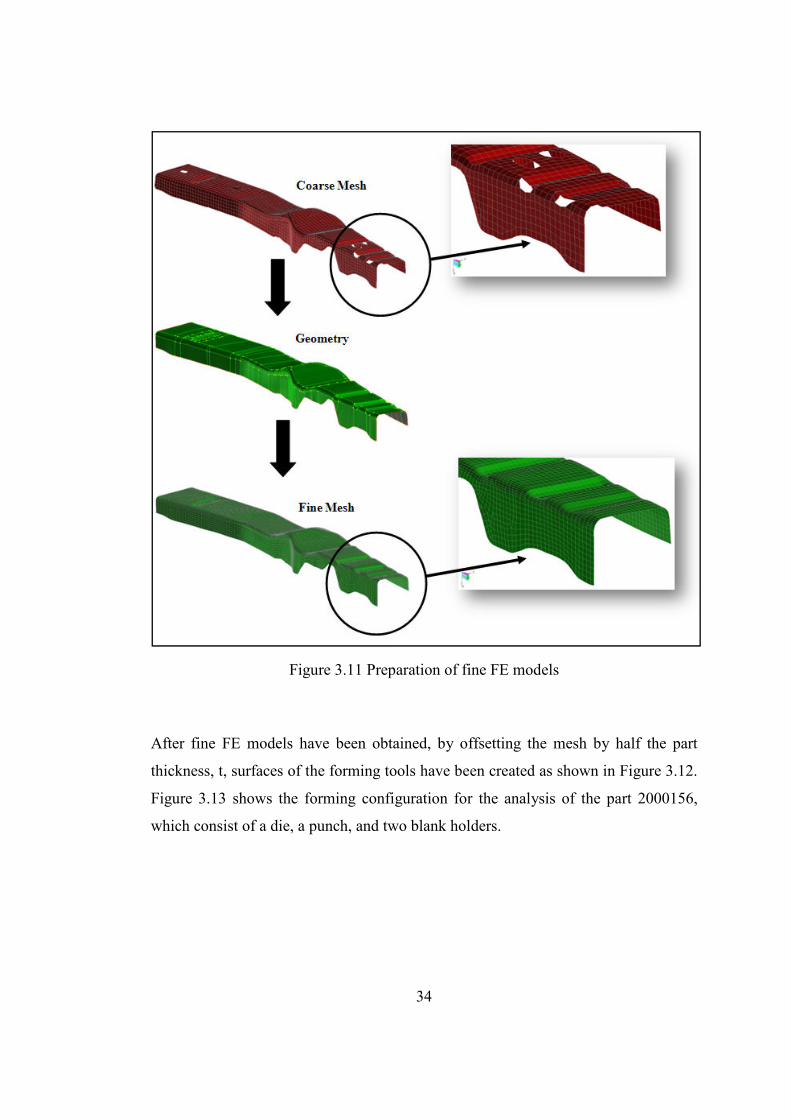
Thus, in order to achieve more accurate results from the forming simulations by
representing part details of the tools finely, geometry of each part has been extracted
using MSC.Sofy [29]. By meshing the geometry of each part according to the
forming guideline by Maker and Zhu [27], fine FE models have been prepared for
forming analyses. Figure 3.11 shows this procedure for part 2000156.
34
Figure 3.11 Preparation of fine FE models
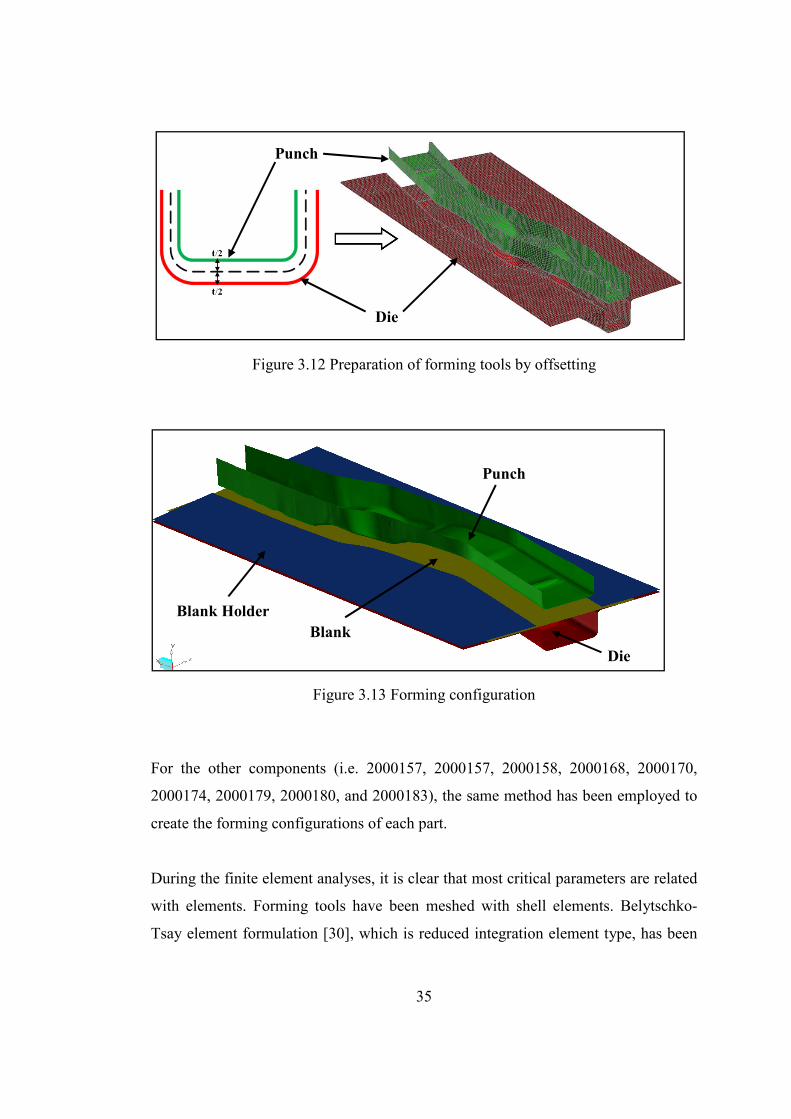
After fine FE models have been obtained, by offsetting the mesh by half the part
thickness, t, surfaces of the forming tools have been created as shown in Figure 3.12.
Figure 3.13 shows the forming configuration for the analysis of the part 2000156,
which consist of a die, a punch, and two blank holders.
35
Figure 3.12 Preparation of forming tools by offsetting
Figure 3.13 Forming configuration
For the other components (i.e. 2000157, 2000157, 2000158, 2000168, 2000170,
2000174, 2000179, 2000180, and 2000183), the same method has been employed to
create the forming configurations of each part.
During the finite element analyses, it is clear that most critical parameters are related
with elements. Forming tools have been meshed with shell elements. Belytschko-
Tsay element formulation [30], which is reduced integration element type, has been
Punch
Die
Punch
Die
Blank Blank Holder
36
used for the forming analyses. The number of integration points through the
thickness has been defined as 5 for precise simulations, which is 2 by default.
Although shell thickness change is not allowed by default, the relevant control cards
have been defined to allow shell thickness during analysis. Since the reduced
integration elements have been used and these elements have hourglass problem
[30], zero-energy mode, stiffness form of the hourglass control has been used to
minimize the hourglass. Although, there are many types of control methods to
minimize hourglass, stiffness form of hourglass control method has been selected as
this method is recommended in the forming guideline [27].
Sheet metal retrieves the final desired shape with the contact between tools and the
sheet metal. Thus, modeling of contact should be done carefully. For the contact
between punch and sheet metal and contact between die and sheet metal the
“forming-one-way” contact interface has been utilized since this contact interface is
the most commonly used contact type for metal forming simulations in LS-DYNA
[27]. 20 percent of critical viscous damping has been defined to suppress high
frequency dynamics as mentioned in the guideline [27].
The initial element size has been selected as 7 mm for all parts. This element size can
be considered as sufficient at the beginning of the simulation whereas to resolve the
part details during simulation, some critical regions should have smaller mesh size. It
is very hard to know which regions should be meshed with smaller elements. The
adaptive remesh feature of LS-DYNA is a very efficient solution for this purpose. By
adaptive remesh option [30], LS-DYNA decides to subdivide the elements and create
refined mesh whenever it is necessary according to the user-specified criteria as
shown in Figure 3.14. For this reason adaptive remesh option has been defined for
complicated parts. As remesh criteria, the angle change between two neighbouring
elements has been selected and 4.0 degrees in angle change has been defined for the
tolerance.

37
Figure 3.14 Mesh refinement of Part 2000168
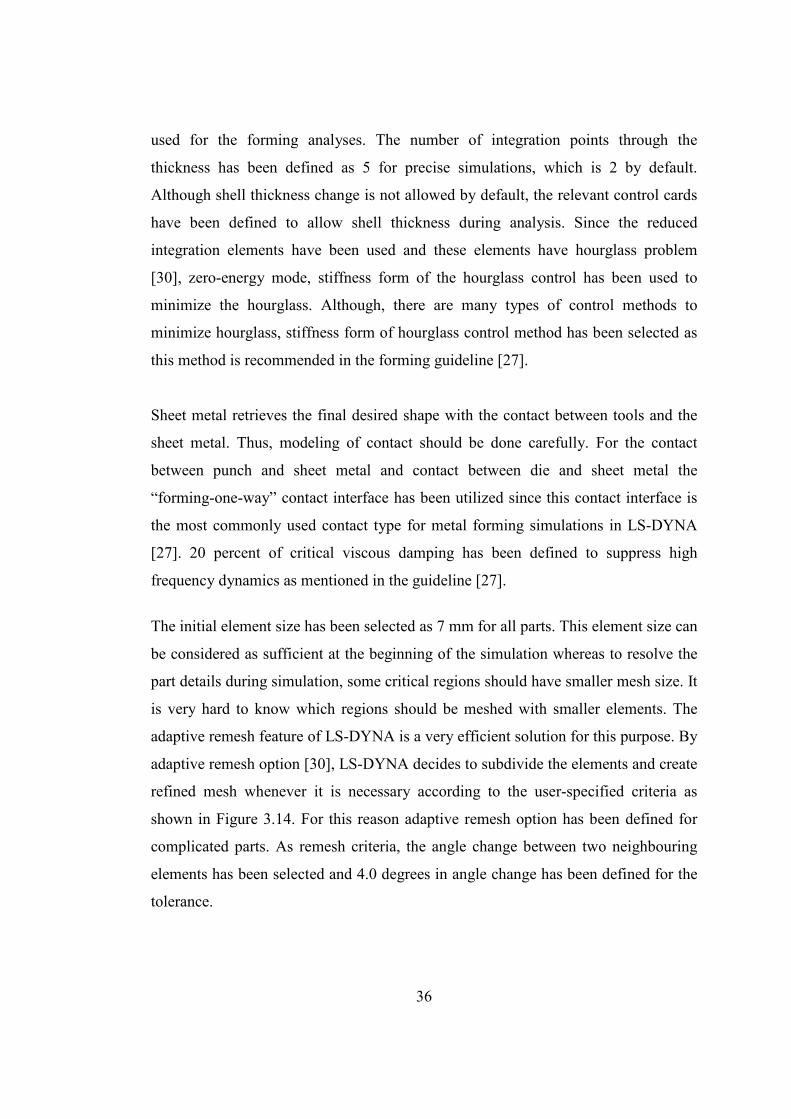
The force-controlled blank holders are used to keep the blank in the correct position
by applying load to the sheet metal [19]. To eliminate the dynamic effects, the load
curve has been defined in such a way that load at the beginning of the simulation is
zero and increases during the first few milliseconds of the simulation as shown in
Figure 3.15 [27]. Appropriate blank holder force has been used for each part to
minimize the sheet metal wrinkling [31].
Mesh refinement
Initial mesh
38
Figure 3.15 The force profile on the blank holder
There are number of factors affecting strain distribution. One of the important factors
is plastic anisotropy which is the capacity of a material to demonstrate dissimilar
properties in different directions [32]. In order to account for the contribution of the
material behavior especially in finite element analyses of sheet metal forming
process, the description of plastic anisotropy is of prime importance [33]. For this
reason, in this study, Barlat’s 3-Parameter plasticity model [30] has been used for
blank material in the forming simulations to account for plastic anisotropy, while
punch, die and blank holder have been assumed rigid.
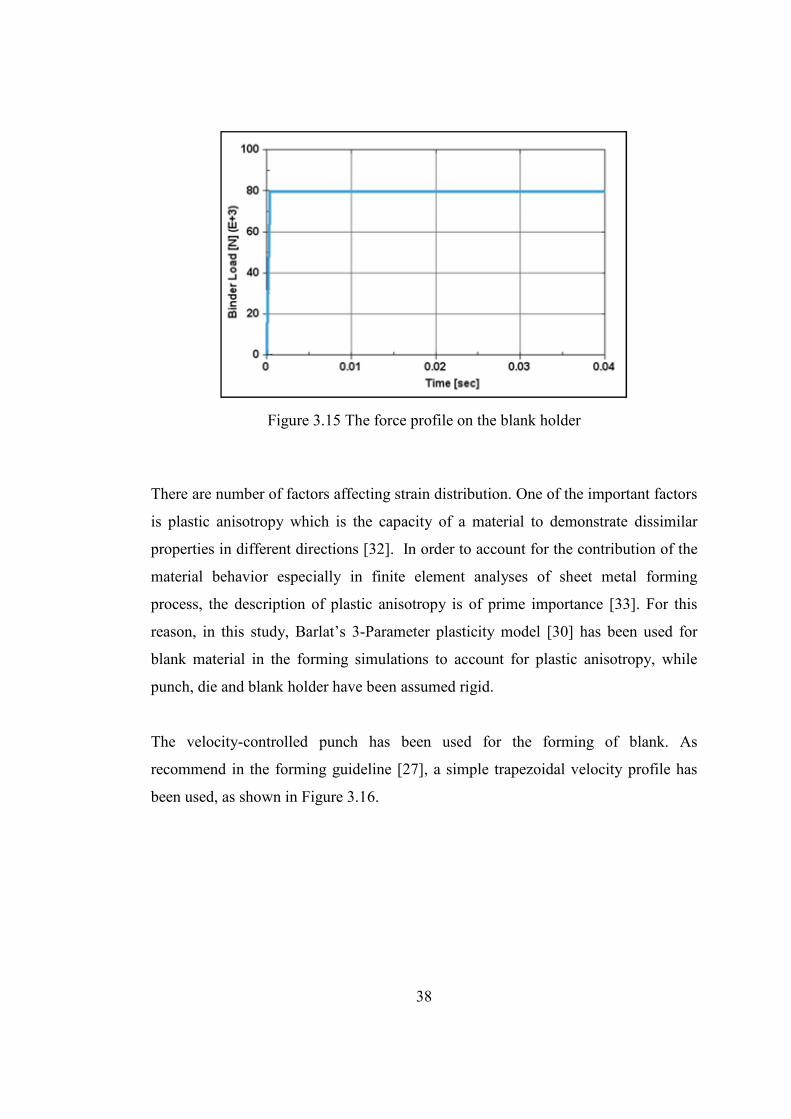
The velocity-controlled punch has been used for the forming of blank. As
recommend in the forming guideline [27], a simple trapezoidal velocity profile has
been used, as shown in Figure 3.16.
39
Figure 3.16 Punch velocity profile
3.3 Results of Forming Simulations
The plastic strain distribution and thickness distribution of the chosen structural
components have been attained by numerical forming analyses.
Figures 3.17 – 3.25 illustrate the plastic strain distribution and thickness distribution
of each component (i.e. 2000156, 2000157, 2000157, 2000158, 2000168, 2000170,
2000174, 2000179, 2000180, and 2000183) after forming simulations. For the
figures of plastic strain distribution, the red regions show the highest plastic strains
and the blue regions illustrate the lowest plastic strains. For the figures of thickness
distribution, the red regions are the thickened areas whereas, the blue regions mean
that material got thinned at those areas.
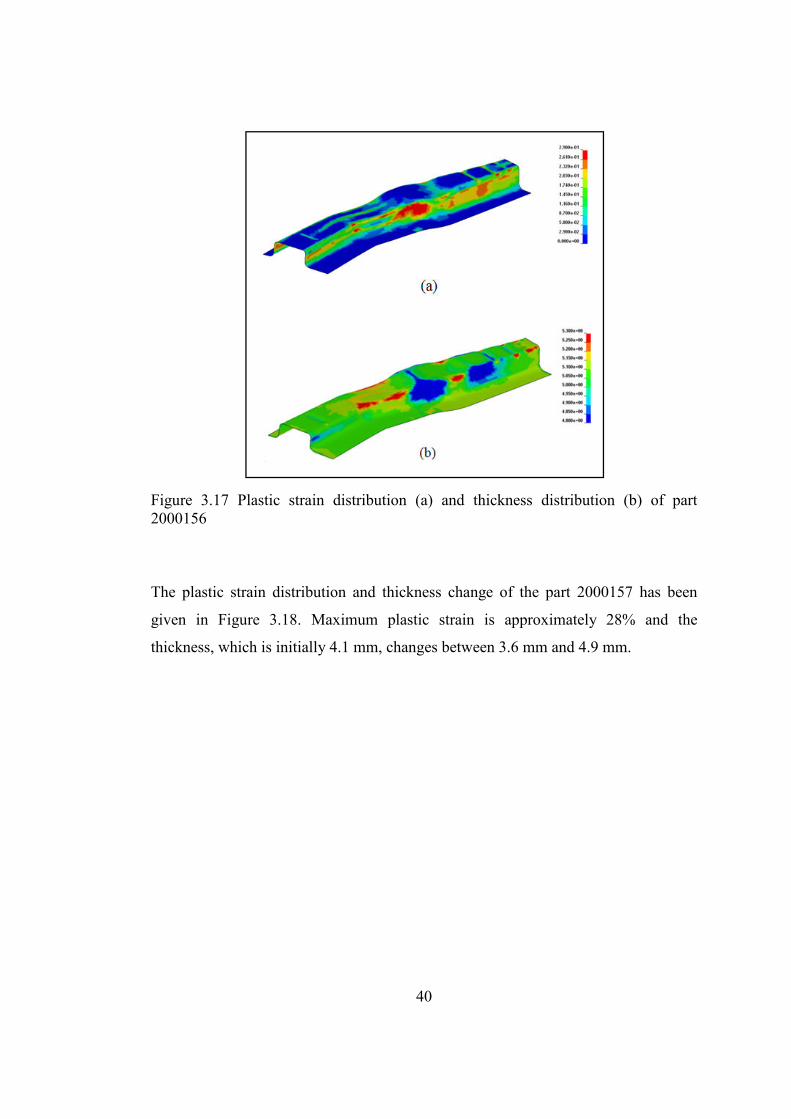
The plastic strain distribution and thickness change of the part 2000156 has been
given in Figure 3.17. Maximum plastic strain is approximately 29% and the
thickness, which is initially 5.1 mm, changes between 4.4 mm and 5.6 mm.
40
Figure 3.17 Plastic strain distribution (a) and thickness distribution (b) of part 2000156
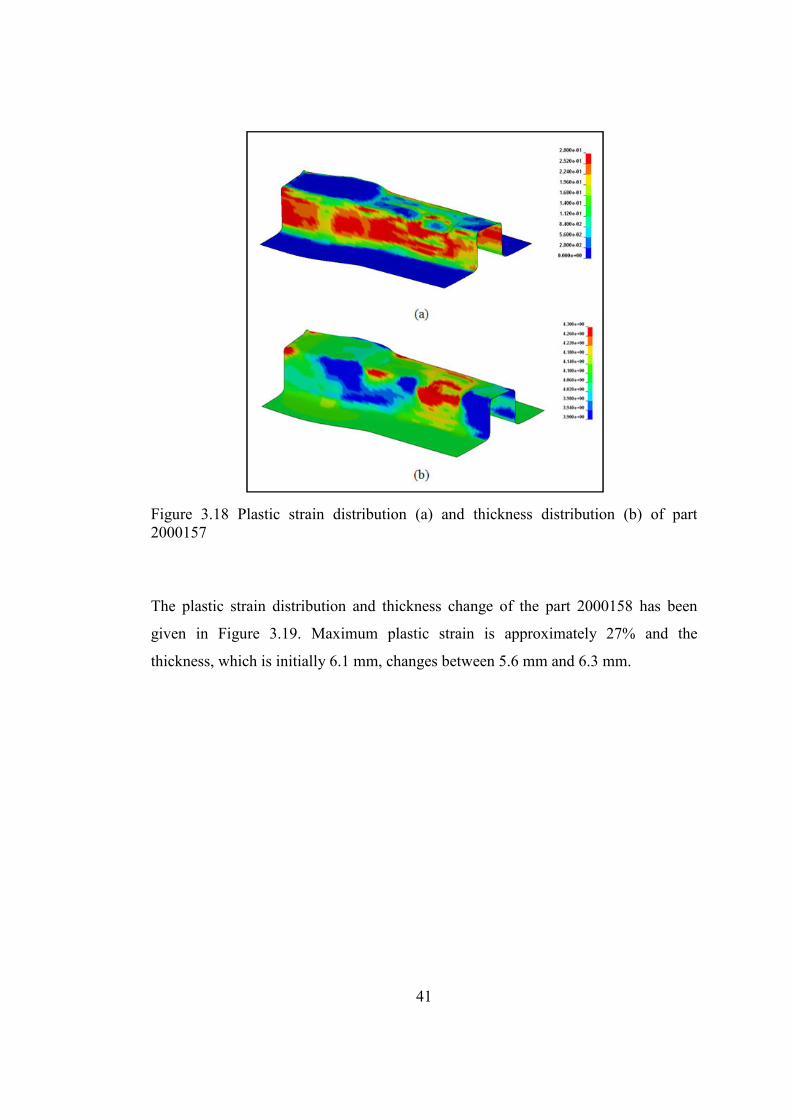
The plastic strain distribution and thickness change of the part 2000157 has been
given in Figure 3.18. Maximum plastic strain is approximately 28% and the
thickness, which is initially 4.1 mm, changes between 3.6 mm and 4.9 mm.
41
Figure 3.18 Plastic strain distribution (a) and thickness distribution (b) of part 2000157
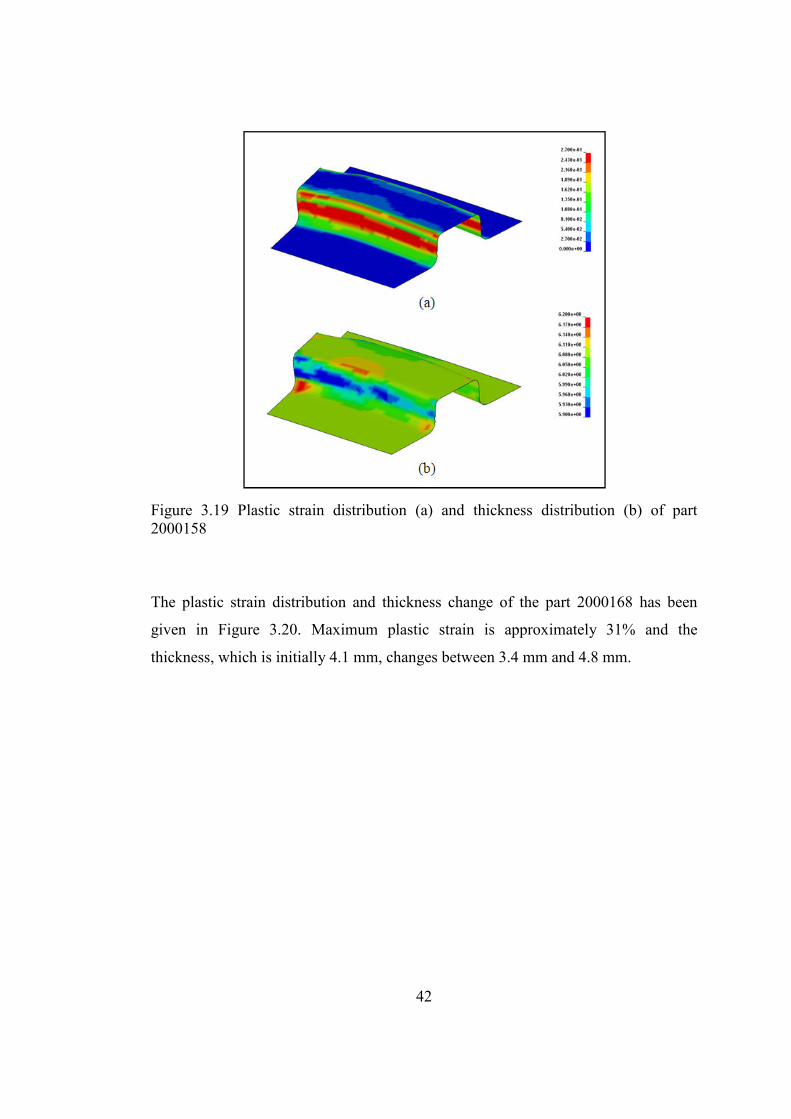
The plastic strain distribution and thickness change of the part 2000158 has been
given in Figure 3.19. Maximum plastic strain is approximately 27% and the
thickness, which is initially 6.1 mm, changes between 5.6 mm and 6.3 mm.
42
Figure 3.19 Plastic strain distribution (a) and thickness distribution (b) of part 2000158
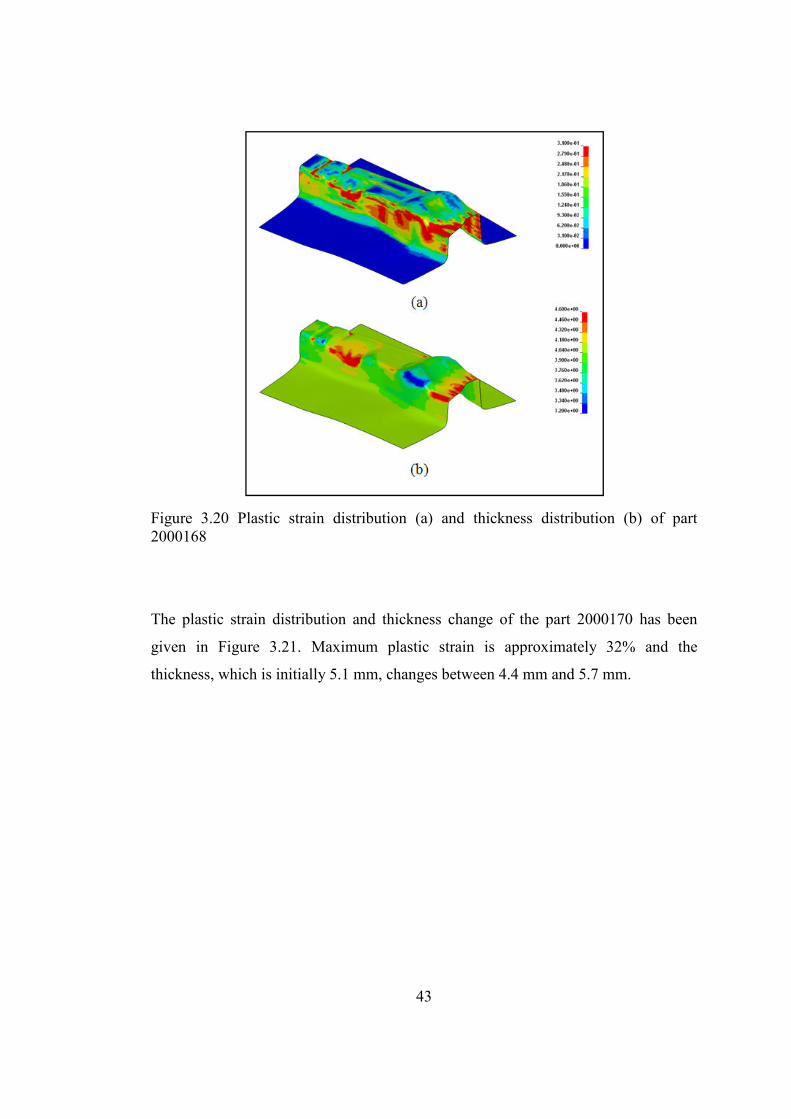
The plastic strain distribution and thickness change of the part 2000168 has been
given in Figure 3.20. Maximum plastic strain is approximately 31% and the
thickness, which is initially 4.1 mm, changes between 3.4 mm and 4.8 mm.
43
Figure 3.20 Plastic strain distribution (a) and thickness distribution (b) of part 2000168
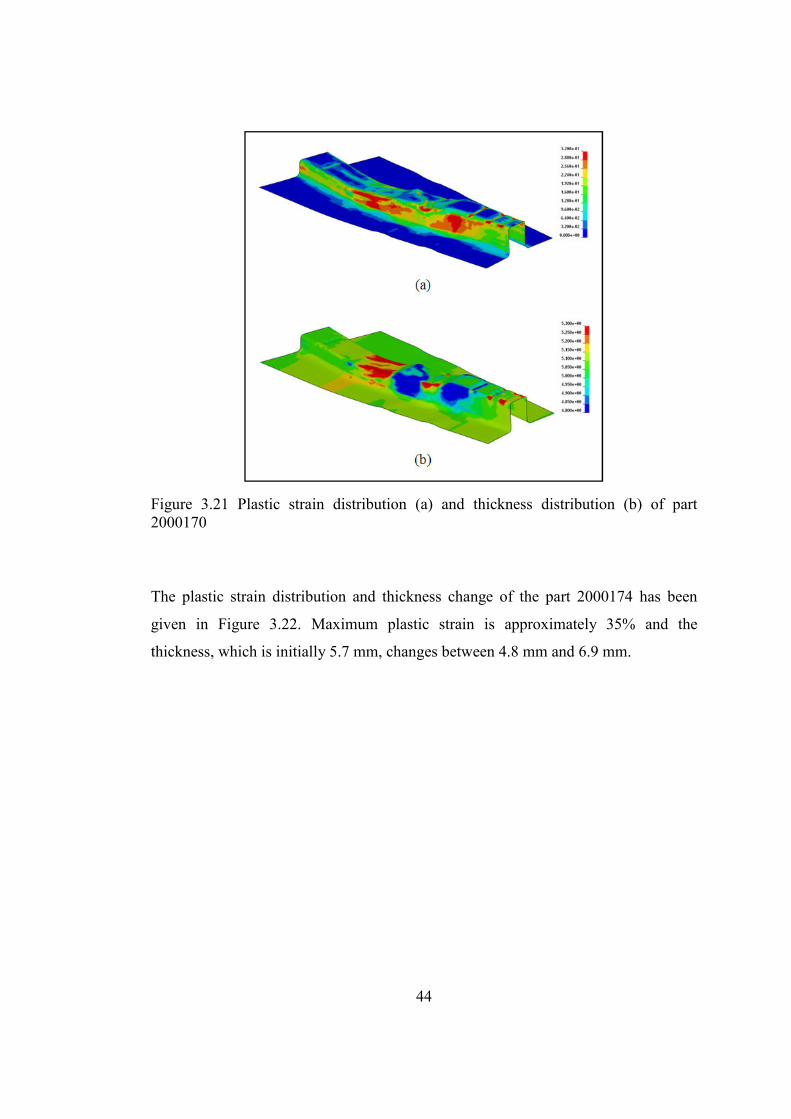
The plastic strain distribution and thickness change of the part 2000170 has been
given in Figure 3.21. Maximum plastic strain is approximately 32% and the
thickness, which is initially 5.1 mm, changes between 4.4 mm and 5.7 mm.
44
Figure 3.21 Plastic strain distribution (a) and thickness distribution (b) of part 2000170
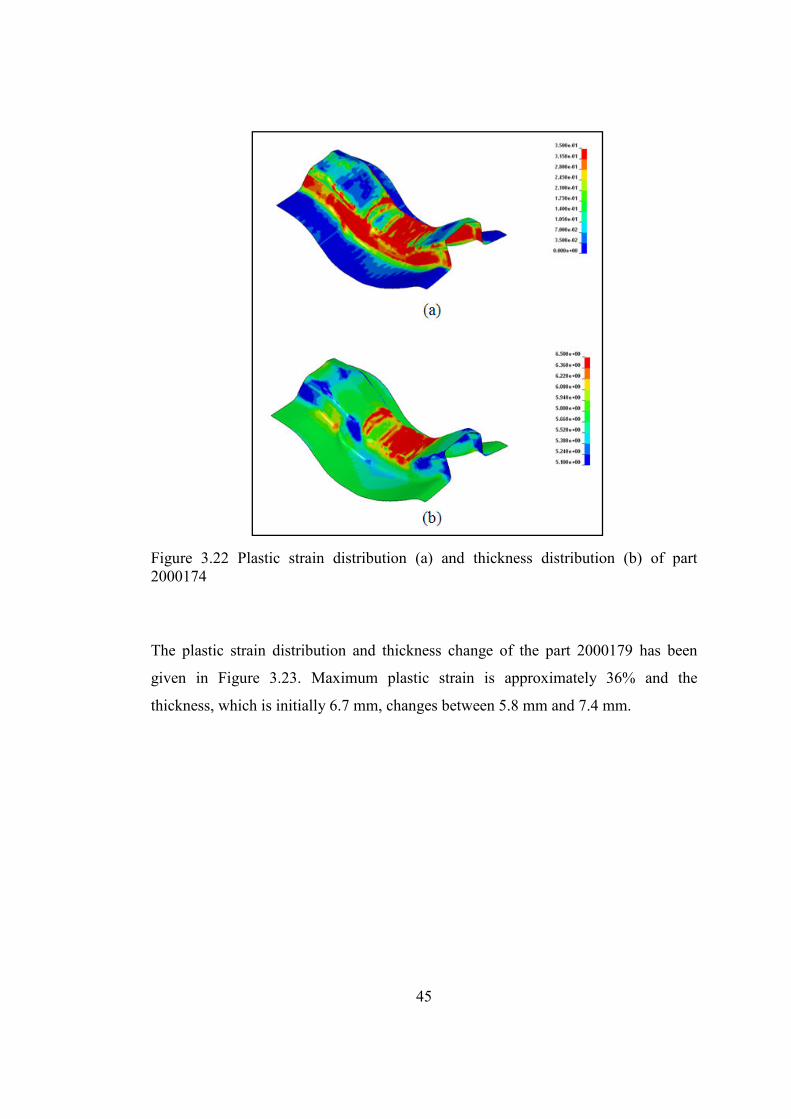
The plastic strain distribution and thickness change of the part 2000174 has been
given in Figure 3.22. Maximum plastic strain is approximately 35% and the
thickness, which is initially 5.7 mm, changes between 4.8 mm and 6.9 mm.
45
Figure 3.22 Plastic strain distribution (a) and thickness distribution (b) of part 2000174
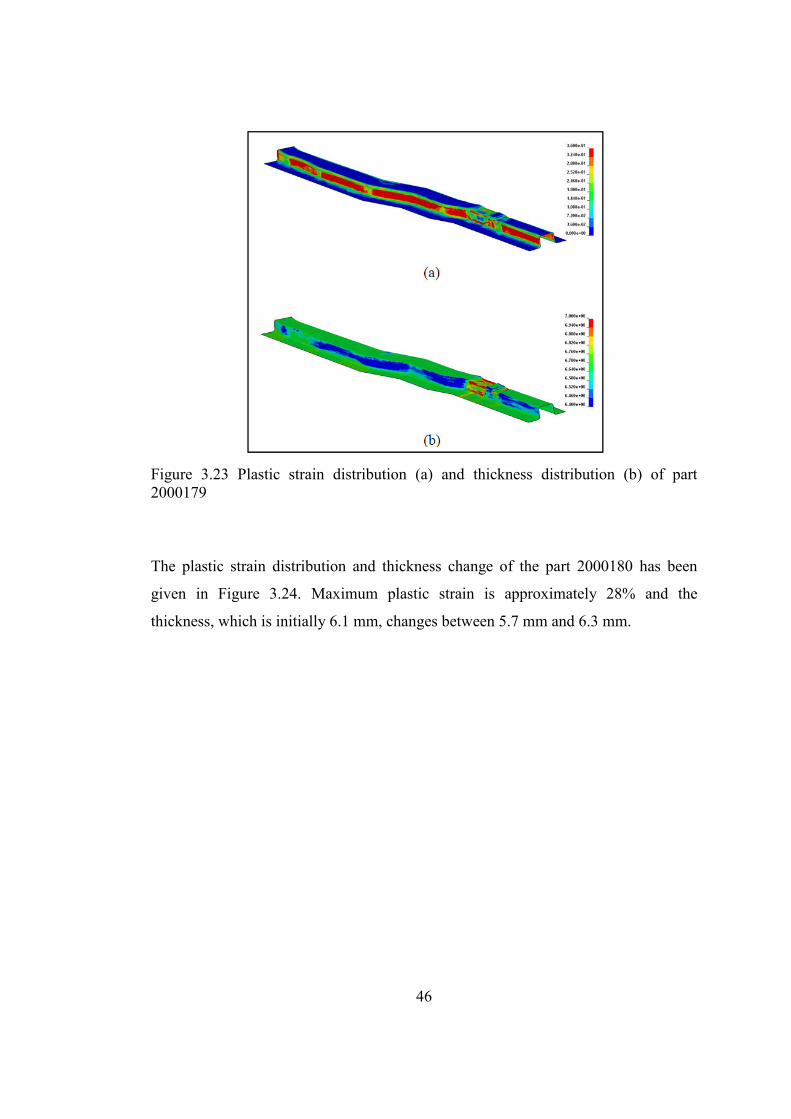
The plastic strain distribution and thickness change of the part 2000179 has been
given in Figure 3.23. Maximum plastic strain is approximately 36% and the
thickness, which is initially 6.7 mm, changes between 5.8 mm and 7.4 mm.
46
Figure 3.23 Plastic strain distribution (a) and thickness distribution (b) of part 2000179
The plastic strain distribution and thickness change of the part 2000180 has been
given in Figure 3.24. Maximum plastic strain is approximately 28% and the
thickness, which is initially 6.1 mm, changes between 5.7 mm and 6.3 mm.

47
Figure 3.24 Plastic strain distribution (a) and thickness distribution (b) of part 2000180
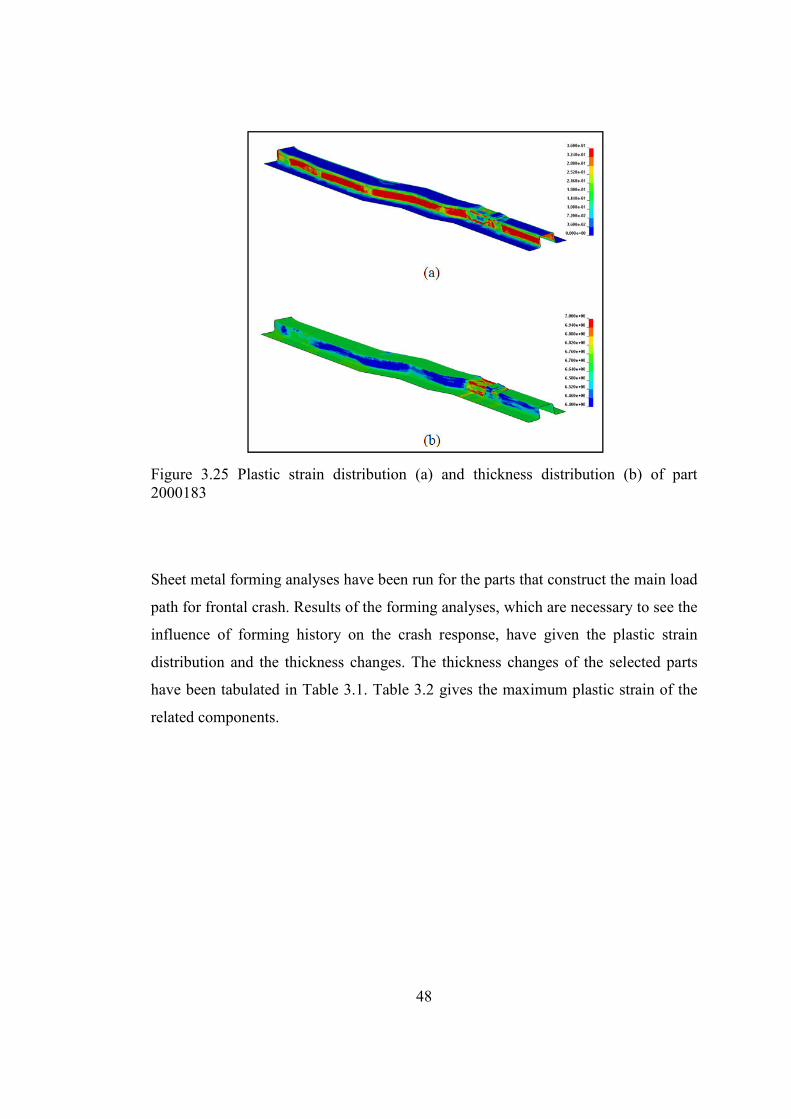
The plastic strain distribution and thickness change of the part 2000183, given in
Figure 3.25, has been obtained from the sheet metal forming analysis of part
2000179, since part 2000183 is the symmetry of part 2000179. Maximum plastic
strain is approximately 36% and the thickness, which is initially 6.7 mm, changes
between 5.8 mm and 7.4 mm.
48
Figure 3.25 Plastic strain distribution (a) and thickness distribution (b) of part 2000183
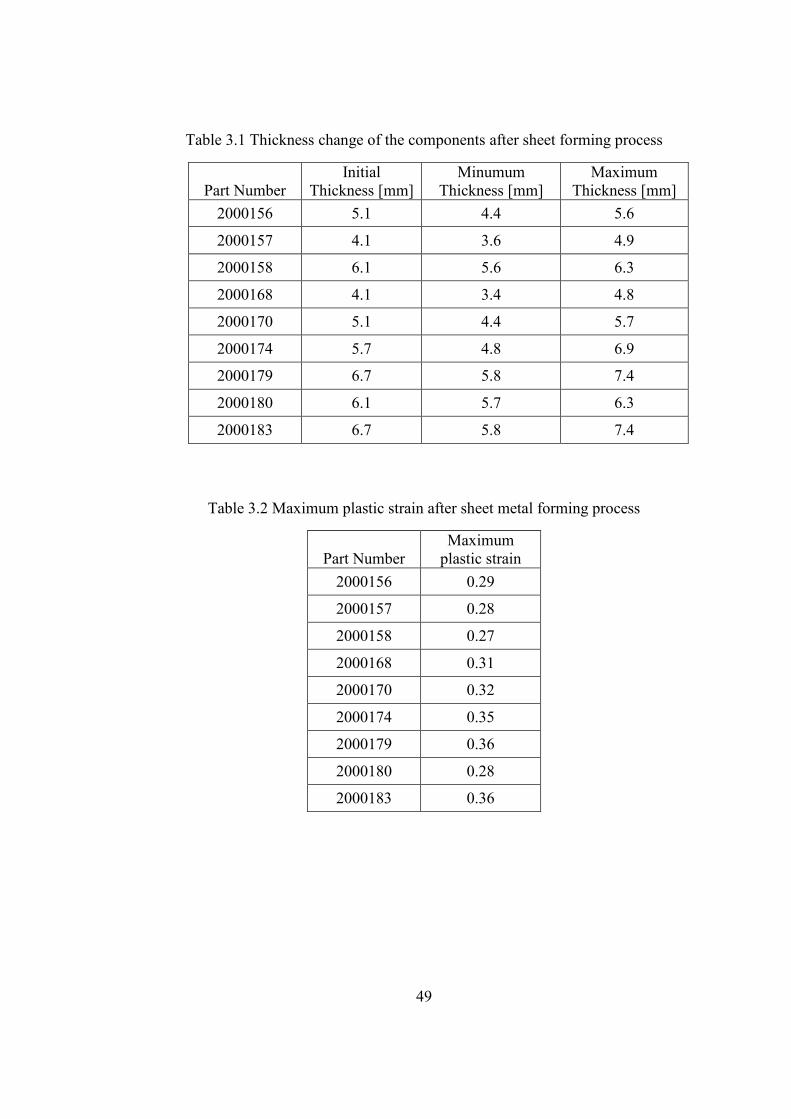
Sheet metal forming analyses have been run for the parts that construct the main load
path for frontal crash. Results of the forming analyses, which are necessary to see the
influence of forming history on the crash response, have given the plastic strain
distribution and the thickness changes. The thickness changes of the selected parts
have been tabulated in Table 3.1. Table 3.2 gives the maximum plastic strain of the
related components.
49
Table 3.1 Thickness change of the components after sheet forming process
Part Number Initial
Thickness [mm] Minumum
Thickness [mm] Maximum
Thickness [mm]
2000156 5.1 4.4 5.6
2000157 4.1 3.6 4.9
2000158 6.1 5.6 6.3
2000168 4.1 3.4 4.8
2000170 5.1 4.4 5.7
2000174 5.7 4.8 6.9
2000179 6.7 5.8 7.4
2000180 6.1 5.7 6.3
2000183 6.7 5.8 7.4
Table 3.2 Maximum plastic strain after sheet metal forming process
Part Number Maximum
plastic strain
2000156 0.29
2000157 0.28
2000158 0.27
2000168 0.31
2000170 0.32
2000174 0.35
2000179 0.36
2000180 0.28
2000183 0.36
50
CHAPTER 4
4 FRONTAL CRASH ANALYSIS WITH SHEET METAL
FORMING HISTORY
4.1 Introduction
In Chapter 2, the results of the frontal crash analysis have been presented where the
sheet metal forming histories of the related sheet metal components are neglected.
To compare the results of the frontal crash analysis with and without sheet metal
forming history, the same frontal crash analysis has been repeated but this time the
plastic strain and the thickness distributions of the selected parts have been used as
the initial conditions in the analysis. In other words, the forming histories of the sheet
metal components have been taken into account.
4.2 Mapping of sheet metal forming history to the crash analysis
In order to take the sheet metal forming history into account, the results of forming
analyses have been mapped to the crash model as initial conditions. In FEA,
“mapping” is defined as transferring the results of previous simulation to the current
simulation. To use the results of forming analyses as the initial conditions for the
crash analysis, first of all, “*INTERFACE_SPRINGBACK_LSDYNA” card in LS-
DYNA [34] has been utilized. By the help of this card, it is possible to obtain a file
containing the final geometry of the formed part with plastic strain distribution and
thickness change at the end of the forming analysis. This file is called as DYNAIN
file [34]. For each selected component, a DYNAIN file has been created to transfer
the effects from the sheet metal forming analysis to the crash analysis. To use these
51
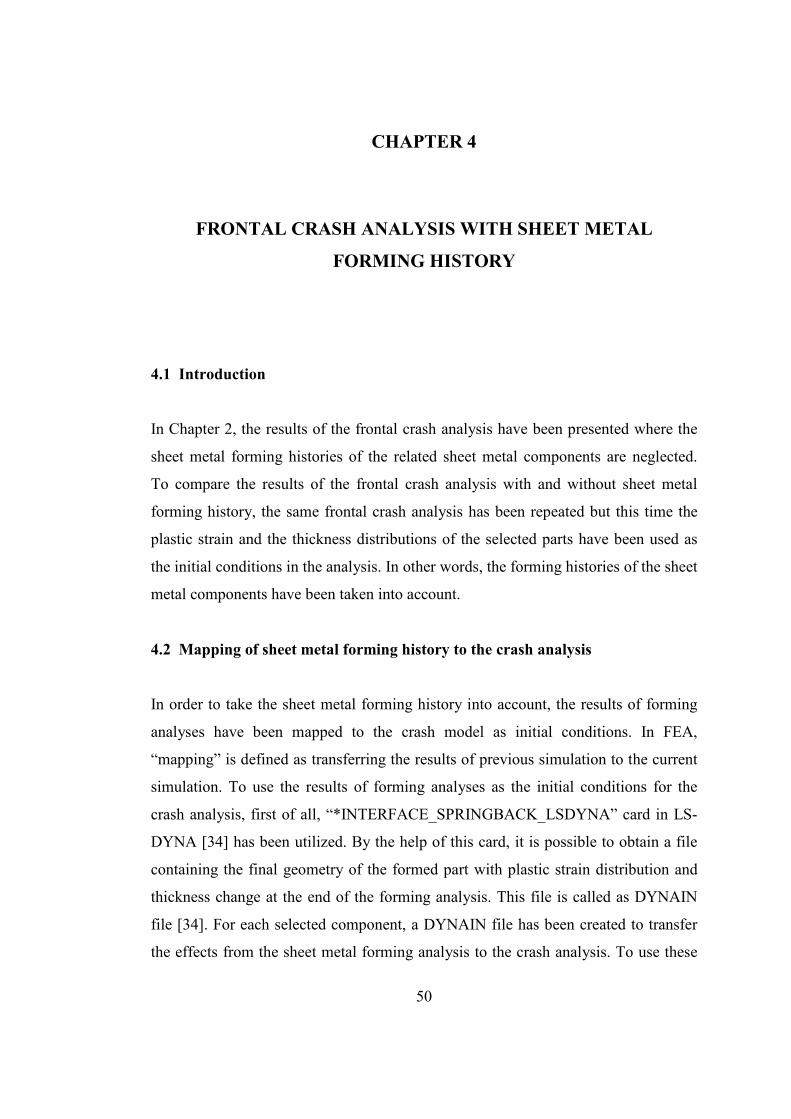
DYNAIN files, an extra card has been added to the input file of crash model which is
“*INCLUDE_STAMPED_SET” in LS-DYNA [34]. This card allows the plastic
strain and thickness distribution of the sheet metal forming simulation to be mapped
onto a part in the crash model. The mapping process mentioned above has been
summarized in Figure 4.1.
Figure 4.1 Summary of the mapping process
52
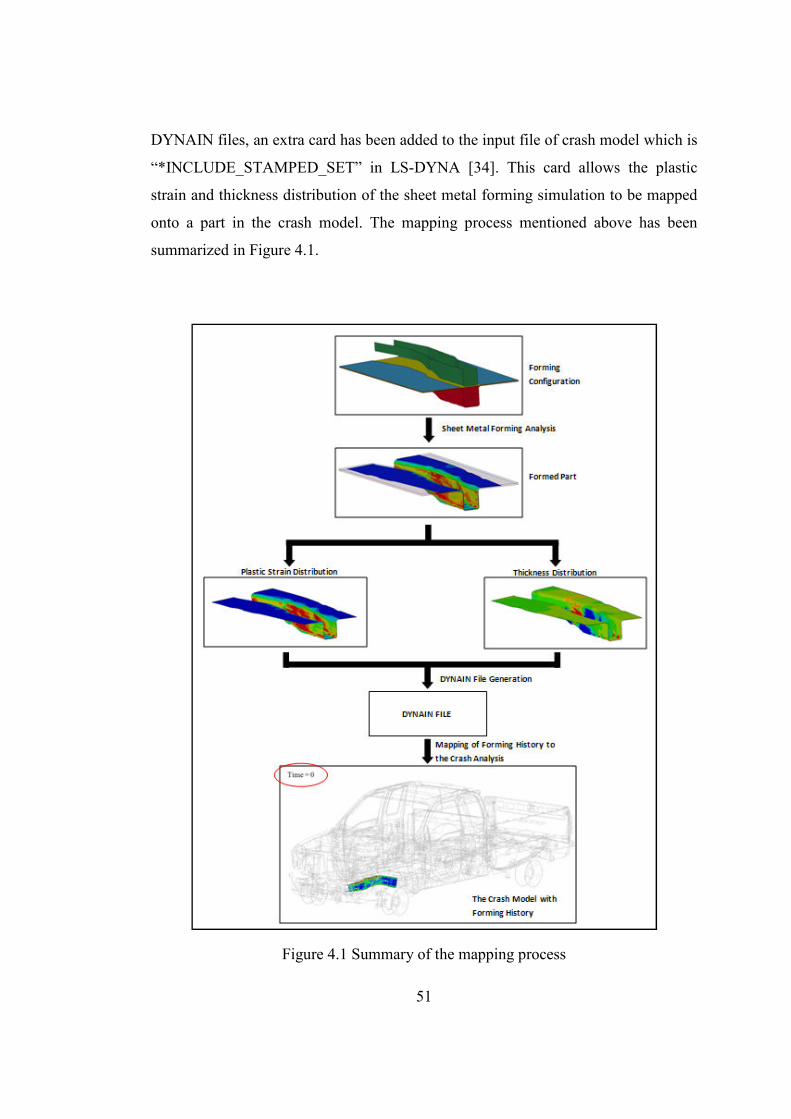
One of the main advantages of the mapping algorithm used in this study is that the
final geometry of the formed sheet metals and the geometry of the related
components in the FE model of the crash analysis do not need to be identical [34].
Mapping results of the related parts are shown in Figures 4.2 – 4.10. As shown in
these figures, the plastic strain distribution and the thickness change have been
mapped only for the regions which overlap.
Figure 4.2 Mapping of the plastic strain (a) and the thickness distribution (b) of part 2000156
53
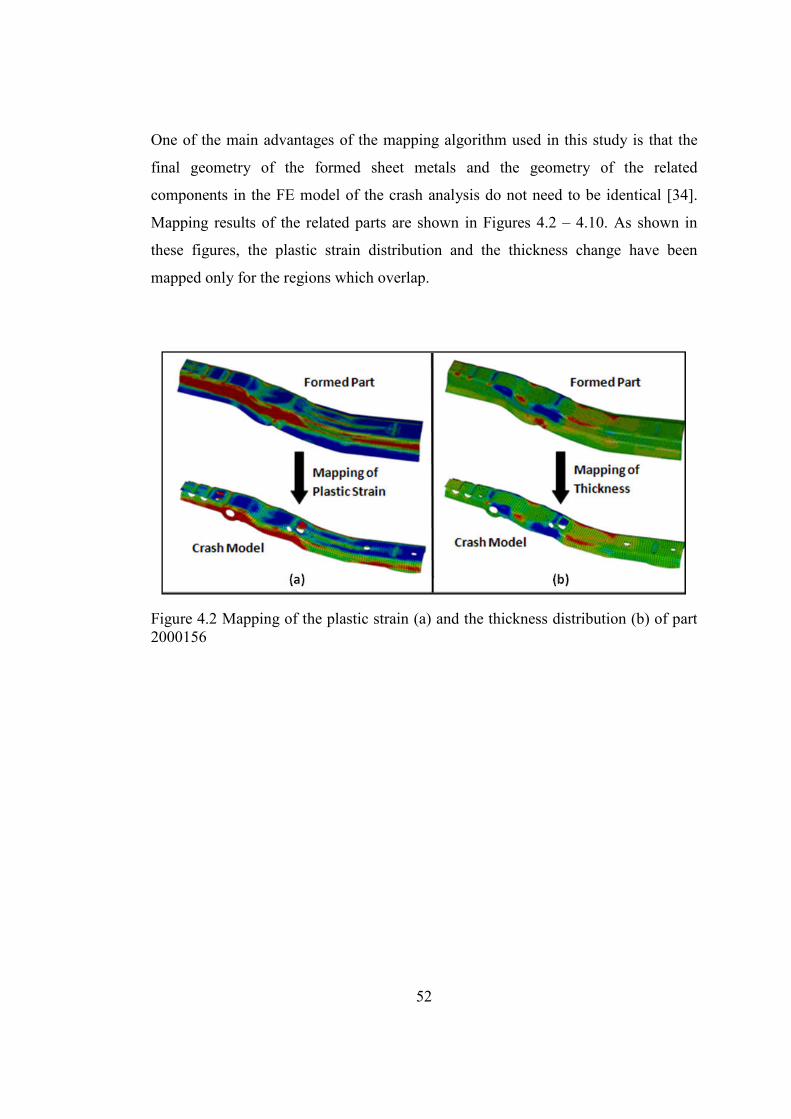
Figure 4.3 Mapping of the plastic strain (a) and the thickness distribution (b) of part 2000157
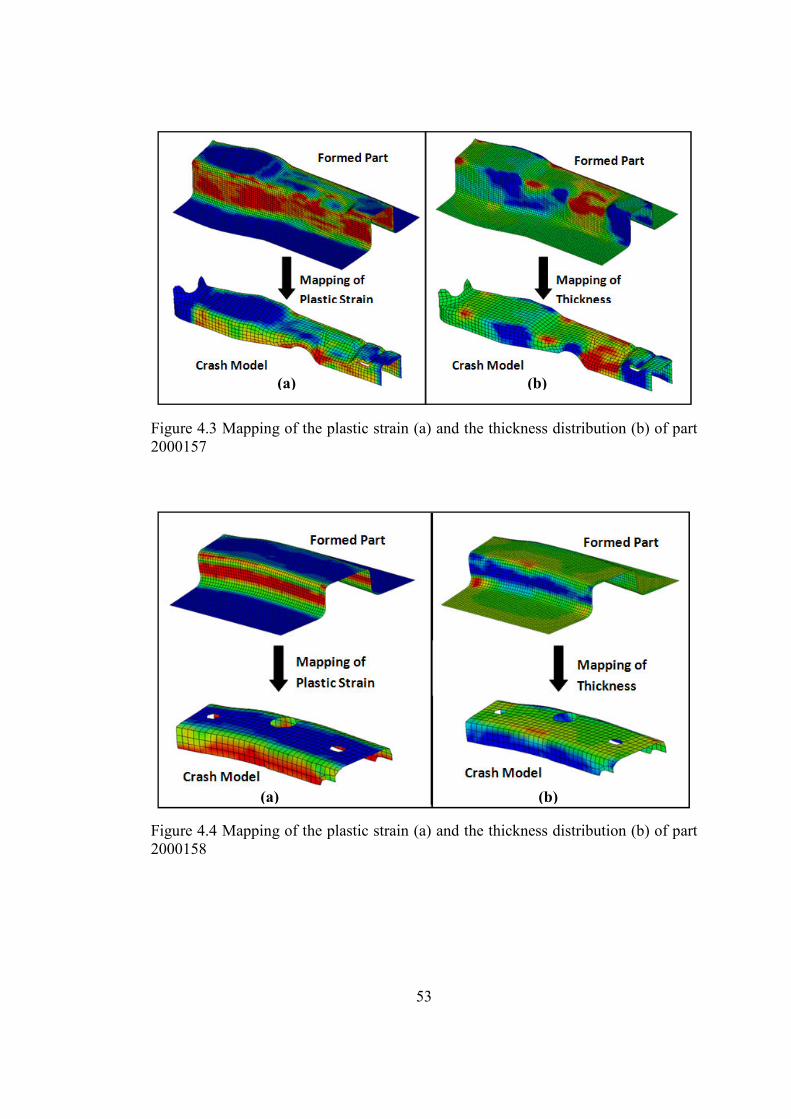
Figure 4.4 Mapping of the plastic strain (a) and the thickness distribution (b) of part 2000158
(a) (b)
(a) (b)
54
Figure 4.5 Mapping of the plastic strain (a) and the thickness distribution (b) of part 2000168
Figure 4.6 Mapping of the plastic strain (a) and the thickness distribution (b) of part 2000170
(a) (b)
(a) (b)
55
Figure 4.7 Mapping of the plastic strain (a) and the thickness distribution (b) of part 2000174
Figure 4.8 Mapping of the plastic strain (a) and the thickness distribution (b) of part 2000179
(a) (b)
(a) (b)
56
Figure 4.9 Mapping of the plastic strain (a) and the thickness distribution (b) of part 2000180
Figure 4.10 Mapping of the plastic strain (a) and the thickness distribution (b) of part 2000183
(a) (b)
(a) (b)

57
After the sheet metal forming history has been mapped for each particular
component, the full frontal crash analysis has been performed to see the influence of
the forming history on the crash response.
4.3 Results of crash analysis with forming history
The results of the frontal crash analysis with and without sheet metal forming history
have been compared to exhibit the importance of consideration of sheet metal
forming for crash analyses. First of all, the internal absorbed energy by each part has
been investigated to see the influence of forming on the energy absorption and then
the total absorbed energy amounts by the selected components in both cases have
been compared. Deformations of the particular parts have been given for both
simulations to show the forming effect on the deformation shapes. The total force
recorded on the load cell wall, the average velocity of the left seat and the right seat,
and the total displacement at the vehicle’s center of gravity have been investigated to
compare the overall crash response. Finally, the deceleration levels transferred to the
driver’s seat and the passenger seat have been examined.
The internal absorbed energy amount of the selected part has been tabulated in Table
4.1. The internal energy of a part indicates the load carrying capacity of a part and
this is really important since crashworthiness of structural members is evaluated
according to load carrying capacity. Considering the sheet metal history, the internal
energy of almost all parts has increased compared to the analysis without forming
history. It has been noted that the energy absorptions of 8 parts from the related parts
have increased. There is only one part (Part 2000158) energy absorption of which
has decreased.
58
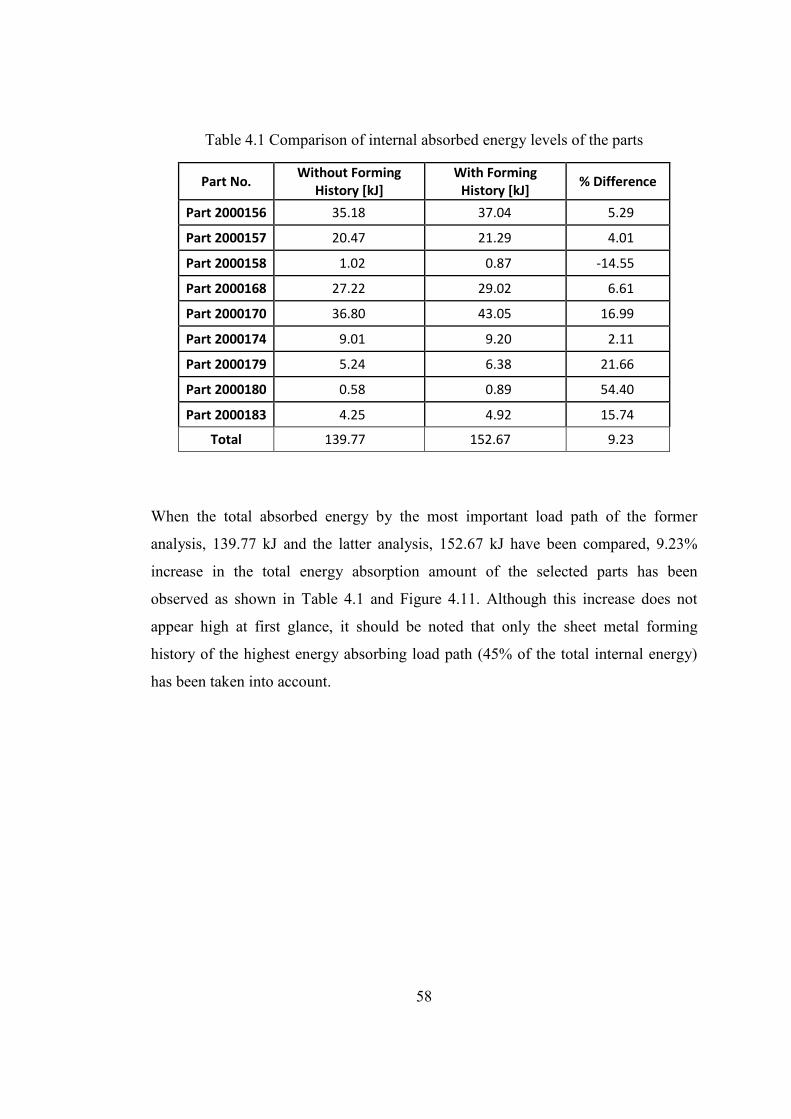
Table 4.1 Comparison of internal absorbed energy levels of the parts
Part No. Without Forming
History [kJ]
With Forming
History [kJ] % Difference
Part 2000156 35.18 37.04 5.29
Part 2000157 20.47 21.29 4.01
Part 2000158 1.02 0.87 -14.55
Part 2000168 27.22 29.02 6.61
Part 2000170 36.80 43.05 16.99
Part 2000174 9.01 9.20 2.11
Part 2000179 5.24 6.38 21.66
Part 2000180 0.58 0.89 54.40
Part 2000183 4.25 4.92 15.74
Total 139.77 152.67 9.23
When the total absorbed energy by the most important load path of the former
analysis, 139.77 kJ and the latter analysis, 152.67 kJ have been compared, 9.23%
increase in the total energy absorption amount of the selected parts has been
observed as shown in Table 4.1 and Figure 4.11. Although this increase does not
appear high at first glance, it should be noted that only the sheet metal forming
history of the highest energy absorbing load path (45% of the total internal energy)
has been taken into account.
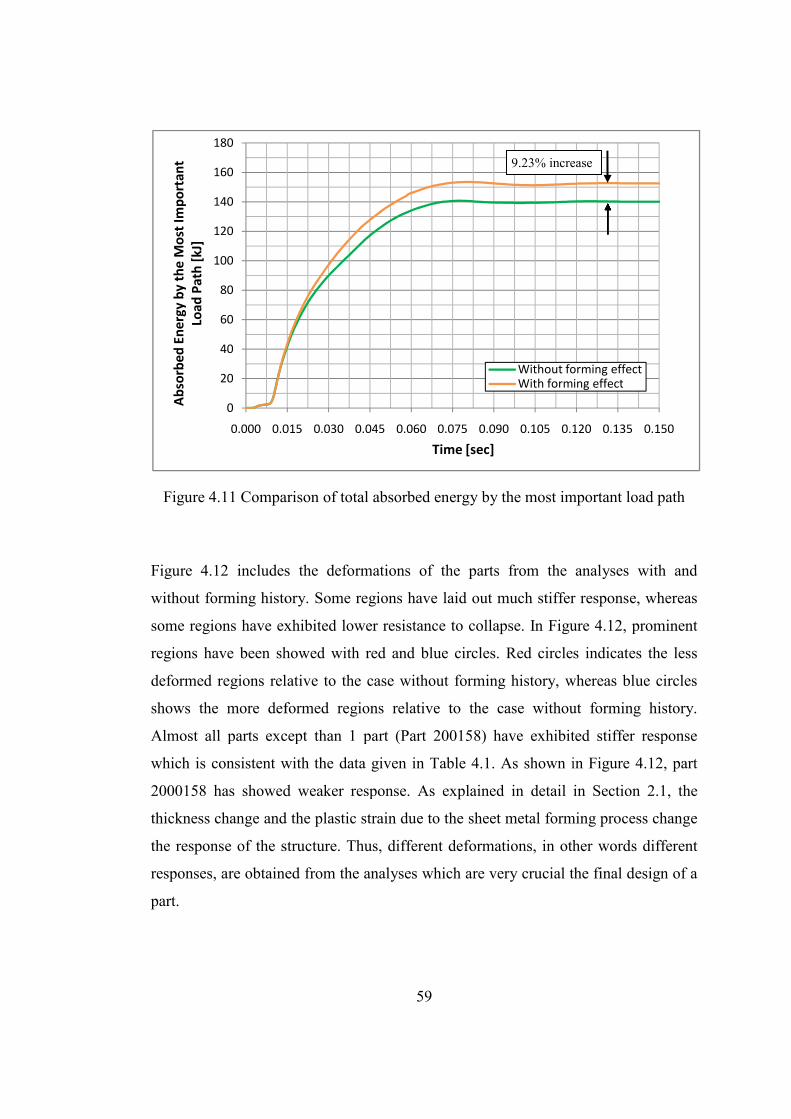
Figure 4.11 Comparison of total absorbed energy by the most important load path
Figure 4.12 includes the deform
without forming history. Some regions
some regions have exhibit
regions have been showed with red and blue circles. Red circles indicates the less
deformed regions relative to the case without forming history, whereas blue circles
shows the more deformed
Almost all parts except than 1 part (Part 200158) have exhibited stiffer response
which is consistent with the data given in Table 4.1. As shown in Figure 4.12, part
2000158 has showed weaker response.
thickness change and the plastic strain due to the sheet metal forming process change
the response of the structure. Thus, different
responses, are obtained from the analyse
part.
0
20
40
60
80
100
120
140
160
180
0.000 0.015
Ab
sorb
ed
En
erg
y b
y t
he
Mo
st I
mp
ort
an
t
Loa
d P
ath
[k
J]
59
Comparison of total absorbed energy by the most important load path
includes the deformations of the parts from the analyses with and
without forming history. Some regions have laid out much stiffer response, whereas
exhibited lower resistance to collapse. In Figure 4.12, prominent
regions have been showed with red and blue circles. Red circles indicates the less
deformed regions relative to the case without forming history, whereas blue circles
shows the more deformed regions relative to the case without forming history.
Almost all parts except than 1 part (Part 200158) have exhibited stiffer response
which is consistent with the data given in Table 4.1. As shown in Figure 4.12, part
0158 has showed weaker response. As explained in detail in Section 2.1, the
thickness change and the plastic strain due to the sheet metal forming process change
the response of the structure. Thus, different deformations, in other words different
obtained from the analyses which are very crucial the final design of a
0.015 0.030 0.045 0.060 0.075 0.090 0.105 0.120
Time [sec]
Without forming effect
With forming effect
9.23% increase
Comparison of total absorbed energy by the most important load path
of the parts from the analyses with and
out much stiffer response, whereas
In Figure 4.12, prominent
regions have been showed with red and blue circles. Red circles indicates the less
deformed regions relative to the case without forming history, whereas blue circles
regions relative to the case without forming history.
Almost all parts except than 1 part (Part 200158) have exhibited stiffer response
which is consistent with the data given in Table 4.1. As shown in Figure 4.12, part
d in detail in Section 2.1, the
thickness change and the plastic strain due to the sheet metal forming process change
, in other words different
s which are very crucial the final design of a
0.120 0.135 0.150
Without forming effect
With forming effect
increase
60
Figure 4.12 Deformations of the parts from the analyses with and without sheet metal forming history
Figure 4.13 shows the comparison of the resultant displacement of vehicle’s center of
gravity from the numerical crash analyses with and without forming history, and the
physical crash test. The resultant displacement has decreased after the forming
history has been taken into consideration, which is mainly due to the increase in
energy absorption. The maximum displacement has been observed at nearly 0.097
Red: Less deformed relative to the case without forming history Blue: More deformed relative to the case without forming history
61
sec and there is a difference of nearly 48 mm between the results of the simulations
with and without forming history. As it is seen from the figure, good agreement has
been achieved with the test results after forming history of crash relevant body parts
has been taken into account. It should be noted that sheet metal forming history of
only 9 parts out of 742 parts has lead such an good prediction in the crashworthiness
of the vehicle, which indicates that correct structural components have been chosen.
Figure 4.13 Comparison of resultant displacement of the vehicle center of gravity
In Figure 4.14, the results of the crash simulations without and with forming history
have been shown one under the other to see the differences. In this figure, the upper
vehicle represents the simulation without forming history, whereas the lower vehicle
stands for the simulation with forming history. In order to demonstrate the difference
0
100
200
300
400
500
600
700
800
900
0.000 0.015 0.030 0.045 0.060 0.075 0.090 0.105 0.120 0.135 0.150
Dis
pla
cem
en
t [m
m]
Time [sec]
Test
Without forming effect
With forming effect
62
in the deformation of the vehicle at 0.097 sec, four reference points have been shown
on the vehicles. The first point is the tip of the rear bumper, the second point is taken
from the rear wheel center, the third point is selected as the upper corner of the cargo
pay and the fourth point is taken from the lower corner of the right door as given in
Figure 4.14. As seen from the figure, there are differences in the final positions of
these reference points at 0.097 sec.
Figure 4.14 Difference in crash response
Total reaction forces on the high resolution load cell wall with respect to time for
simulations and the physical crash test are given in Figure 4.15. Table 4.2 gives the
Time = 0.097 sec

63
maximum total forces for the analyses with and without sheet metal forming history
and the crash test. First of all, it has been seen that the maximum total force obtained
with forming history is closer to the maximum total force measured during the crash
test. Besides, up to 50 msec good agreement has been achieved by considering sheet
metal forming history of main crash relevant parts. This makes sense since the
selected load path comprises of 9 parts and among these selected parts, 7 of them are
from the front side of the vehicle. Because of this reason, up to 50 msec good
agreement has been achieved.
Figure 4.15 Comparison of total force recorded on the load cell wall
Table 4.2 Maximum total reaction force
Peak Force [kN] % Difference from the Test
Test 1060 - Without forming history 979 7.64 With forming history 1105 4.25
0
200
400
600
800
1000
1200
0.000 0.015 0.030 0.045 0.060 0.075 0.090 0.105 0.120 0.135 0.150
Fo
rce
[k
N]
Time [sec]
Test
Without forming effect
With forming effect

64
The average velocities in x-direction of the left seat accelerometer and the right seat
accelerometer from the simulations without and with sheet metal forming history
have been compared with test results. As shown in Figure 4.16, the result of the latter
analysis shows good agreement with the test result up to 60 msec.
Figure 4.16 Comparison of average velocities of the left and right seat in x-direction
The deceleration pulse transferred to the left seat (driver) and right seat (passenger) is
very crucial since it is directly related to the injury criteria of occupants. Figure 4.17
and Figure 4.18 show the comparison of the deceleration pulse from the simulations
with and without sheet metal forming history for the left and right seat, respectively.
As crash response of the vehicle has been changed, deceleration pulse carried to the
seats has been altered also. Since one of the major criteria is to reduce the
deceleration pulses, precise simulation results are needed in the design stage. The
peak left seat deceleration pulse has been reduced from 55.7 to 45.7 as seen from
-10
0
10
20
30
40
50
60
0.000 0.015 0.030 0.045 0.060 0.075 0.090 0.105 0.120 0.135 0.150
Ve
loci
ty [
kp
h]
Time [sec]
Test
Without forming effect
With forming effect
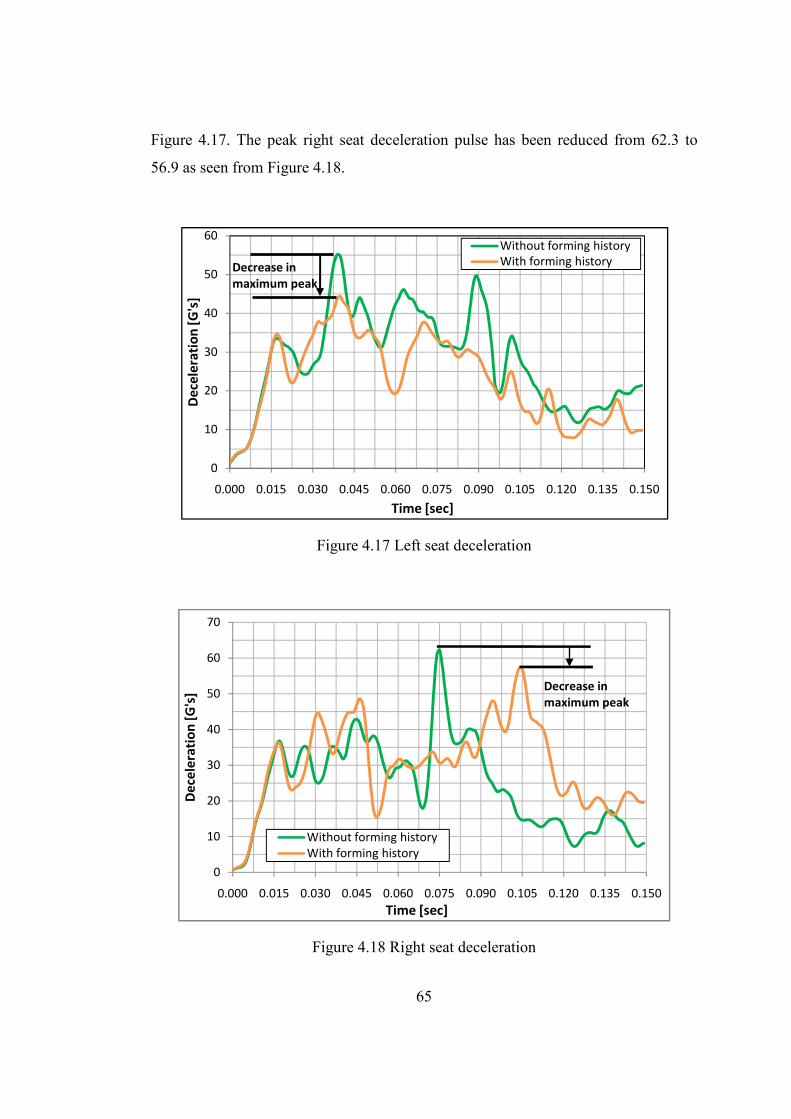
65
Figure 4.17. The peak right seat deceleration pulse has been reduced from 62.3 to
56.9 as seen from Figure 4.18.
Figure 4.17 Left seat deceleration
Figure 4.18 Right seat deceleration
0
10
20
30
40
50
60
0.000 0.015 0.030 0.045 0.060 0.075 0.090 0.105 0.120 0.135 0.150
De
cele
rati
on
[G
's]
Time [sec]
Without forming history
With forming historyDecrease in
maximum peak
0
10
20
30
40
50
60
70
0.000 0.015 0.030 0.045 0.060 0.075 0.090 0.105 0.120 0.135 0.150
De
cele
rati
on
[G
's]
Time [sec]
Without forming history
With forming history
Decrease in
maximum peak
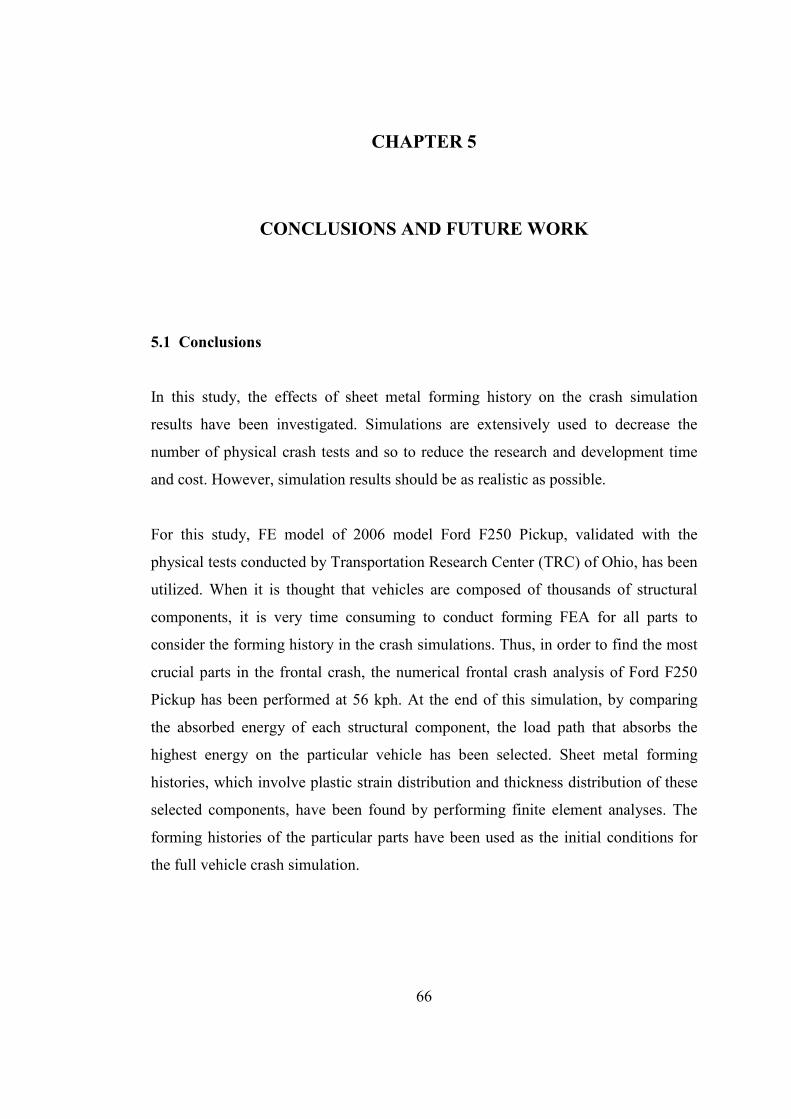
66
CHAPTER 5
5 CONCLUSIONS AND FUTURE WORK
5.1 Conclusions
In this study, the effects of sheet metal forming history on the crash simulation
results have been investigated. Simulations are extensively used to decrease the
number of physical crash tests and so to reduce the research and development time
and cost. However, simulation results should be as realistic as possible.
For this study, FE model of 2006 model Ford F250 Pickup, validated with the
physical tests conducted by Transportation Research Center (TRC) of Ohio, has been
utilized. When it is thought that vehicles are composed of thousands of structural
components, it is very time consuming to conduct forming FEA for all parts to
consider the forming history in the crash simulations. Thus, in order to find the most
crucial parts in the frontal crash, the numerical frontal crash analysis of Ford F250
Pickup has been performed at 56 kph. At the end of this simulation, by comparing
the absorbed energy of each structural component, the load path that absorbs the
highest energy on the particular vehicle has been selected. Sheet metal forming
histories, which involve plastic strain distribution and thickness distribution of these
selected components, have been found by performing finite element analyses. The
forming histories of the particular parts have been used as the initial conditions for
the full vehicle crash simulation.

67
The full vehicle crash simulations results without and with the sheet metal forming
effects have been compared with the physical test results. The following conclusions
can be drawn from this work:
1. The sheet metal forming history has lead to change in the deformations of the
structural components.
2. Energy absorption amounts of the selected parts altered when the sheet metal
forming effects had been taken into consideration in the crash simulation.
3. Taking into consideration the sheet metal forming history affects the overall
crash response of the vehicle.
4. In this study it is found that the maximum deceleration pulses transferred to the
driver’s seat and the passenger’s seat have decreased when the sheet metal
forming effects have been used as initial conditions.
5. The full vehicle crash simulation with the sheet metal forming effects is in good
agreement with the physical crash test results. It is shown that the sheet metal
forming history should be taken into account to get more realistic results from FE
analyses.
5.2 Future work
As already stated, in this study, it is assumed that the selected parts are manufactured
with a single forming stage, deep drawing process. Thus, the effect of sheet metal
forming history after serious of forming stages as in the real must be investigated
further.
In addition, physical forming tests should be performed to validate the forming
analyses. Another future work related to this study can be conducting component
test to compare the crushing characteristics with the results of simulations with
forming effects and without forming effects.
68
REFERENCES
[1] Bois, P. D., Chou, C. C., Fileta, B. B., Khalil, T. B., King, A. I., Mahmood, H. F., et al. (2004). Vehicle Crashworthiness and Occupant Protection. Michigan: Automotive Applications Committee.
[2] World Health Organization. (2004). World Report on Road Traffic Injury
Prevention. Geneva: World Health Organization.
[3] Toyota Motor Europe, http://www.toyota.eu/06_Safety/03_understanding_ active_safety, Last Visited on June, 2009
[4] Toyota Motor Europe, http://www.toyota.eu/06_Safety/04_implementing_ passive_safety, Last Visited on June, 2009
[5] Thomer, K. W. (2008). Materials and Concepts in Body Construction. In H. J. Streitberger, & K. F. Dossel (Eds.), Automotive Paints and Coatings (pp. 22-60). Weinheim: Wiley-VCH.
[6] Griškevicius, P., & Ziliukas, A. (2003). The Crash Energy Absorption of the Vehicles Front Structures. Transport, XVIII (2), 97-101.
[7] Tehrani, P. H., & Asadi, E. (2008). Effects of New Materials on the Crashworthiness of S-rails. Journal of Materials: Design and Applications, 222 (1), 37-41.
[8] Automotive Aluminum, http://www.autoaluminum.org/documents/ whitepapers/crashworthiness.pdf, Last Visited on June, 2009
[9] Engineers Edge, http://www.engineersedge.com/material_science/ work_strain_hardening.htm, Last Visited on June, 2009
69
[10] Kim, H., Hong, S., Hong, S., & Huh, H. (2003). The Evaluation of Crashworthiness of Vehicles with Forming Effect. 4th European LS-DYNA Conference. Ulm.
[11] Lanzerath, H., Ghouati, O., Wesemann, J., & Schillung, R. (2001). Influence of Manufacturing Processes on the Performance of Vehicles in Frontal Crash. 3rd European LS-DYNA Conference. Paris.
[12] Zöller, A., Frank, T., & Haufe, A. (2004). Berücksichtigung von Blechumformergebnissen in der Crashberechnung. 3th German LS-DYNA Forum. Bamberg.
[13] Krusper, A. (2003). Influences of the Forming Process on the Crash
Performance - Finite Element Analysis. Unpublished master’s thesis. Chalmers University of Technology, Göteborg.
[14] Böttcher, C.-S., & Frik, S. (2003). Consideration of Manufacturing Effects to
Improve Crash Simulation Accuracy. 4th European LS-DYNA Users Conference. Ulm.
[15] Cafolla, J., Hall, R. W., & Norman, D. P. (2003). "Forming to Crash" Simulation in Full Vehicle Models. 4th European LS-DYNA Users Conference. Ulm.
[16] Dutton, T., Richardson, P., Knight, A., & Sturt, R. (2001). The Influence of
Residual Effects of Stamping on Crash Results. 3rd European LS-DYNA Conference. Paris.
[17] Simunovic, S., & Aramayo, G. (2002). Steel Processing Properties and Their
Effect on Impact Deformation of Lightweight Structures. Retrieved from U.S. Department of Energy Information Bridge: http://www.osti.gov/bridge
[18] Tehrani, P. H., & Asadi, E. (2008). Effects of New Materials on the
Crashworthiness of S-rails. Journal of Materials: Design and Applications, 222 (1), 37-41.
70
[19] Dagson, N. (2001). Influence of the Forming Process on the Crash Response of a Roof Rail Component. Unpublished master’s thesis. Linköping University, Linköping.
[20] Wikipedia, http://en.wikipedia.org/wiki/Work_hardening, Last Visited on June, 2009
[21] Crash Test, http://www.crashtest.com/explanations/nhtsa/usncap.htm, Last Visited on June, 2009.
[22] Livermore Software Technology, http://www.lstc.com/lsdyna.htm, Last Visited on June, 2009.
[23] Hinton, E. (1992). Introduction to Nonlinear Finite Element Analysis. East Libbride: NAFEMS.
[24] National Crash Analysis Center, http://www.ncac.gwu.edu/index.html, Last Visited on June, 2009.
[25] Kan, S., & Marzougui, D. (2007). Finite Element Model of Ford F250 - Model
Year 2006. Retrieved from National Crash Analysis Center: http://www.ncac.gwu.edu/vml
[26] Barthel, C., Clausmeyer, T., & Svendsen, B. (2009). Numerical Investigation of Draw Bending and Deep Drawing Taking into Account Cross Hardening. 7th European LS-DYNA Conference. Salzburg.
[27] Maker, B. N., & Zhu, X. (2000). Input Parameters for Metal Forming
Simulation using LS-DYNA. 6th International LS-DYNA Users Conference. Michigan.
[28] LS-DYNA Support, http://www.dynasupport.com/tutorials/contact.modeling, Last Visited on June, 2009.
71
[29] Sofy – Overview, http://www.mscsoftware.com/assets/SOFY2005.pdf, Last Visited on June, 2009.
[30] Hallquist, J. (2006). LS-DYNA Theory Manual. Livermore: Livermore Software Technology Corporation.
[31] Demirci, H. I., Yaşar, M., Demiray, K., & Karalı, M. (2008). The Theoretical and Experimental Investigation of Blank Holder Forces Plate Effect in Deep
Drawing Process of AL 1050 Material. Materials & Design, 29 (2), 526-532. [32] ESI Special Topics, http://www.esi-topics.com/fmf/2006/may06-
Yoon_Barlat_Brem.html, Last Visited on June, 2009.
[33] Barlat, F., Brem, J., Yoon, J., & Chung, K. (2003). Plane Stress Yield Function for Aluminum Alloy Sheets - Part 1: Theory. International Journal of Plasticity, 19 (9), 1297-1319.
[34] Livermore Software Technology Corporation. (2007). LS-DYNA Keyword User's Manual. Livermore: Livermore Software Technology.