Embed Size (px)
Citation preview
PROSIDING PERKEM ke-9 (2014) 400 - 415
ISSN: 2231-962X
Persidangan Kebangsaan Ekonomi Malaysia ke-9 (PERKEM ke-9)
“Urus Tadbir Ekonomi yang Adil : Ke Arah Ekonomi Berpendapatan Tinggi”
Kuala Terengganu,Terengganu, 17 – 19 Oktober 2014
Effect of Sovereign Rating Changes on Bond Market Returns
Cheng Fan Fah
Associate Professor
Faculty Economics and Management,
University Putra Malaysia,
43400 UPM, Serdang, Selangor
E-mail: [email protected]
Lim Li Hsia
Annuar Nasir
Professor
Faculty Economics and Management,
University Putra Malaysia,
43400 UPM, Serdang, Selangor
ABSTRACT
Malaysia has just experienced another downgrade of the sovereign rating in July last year, our capital
market and currency exchange rate reacted immediately with high loses in Bursa Malaysia couple with
sharp depreciation of our currency against major foreign exchanges. Therefore, the main objective of
this study is to investigate the effect of sovereign rating changes on bond market returns control for
inflation. The importance of sovereign ratings and the growing bond marketsare the main motivation
for this study. This paper analyse the risk and return relationship of 30 major bond markets which
account for 80 percent of world GDP. This paper studiestwo categories of bond with different maturity
period which are1year bond and 10years bond. This study collects Bond yield (YTM) for continuous
five years (2007-2011) and the final sample consist of total number of 150 observations for each
category of bond. The relationship between bond yields, inflation rates and real yields or inflation
adjusted bond yields are examined based on individual observation and portfolio. Findings of portfolios
analysis show that all the observations grouped into portfolio, there is negative relationship between
sovereign rating and bond yield and positive relationship between inflation rate and bond yield. Finally,
hypothesis thattest on the relationship between sovereign ratings and real yields is rejected.
Keywords: sovereign rating, sovereign rating changes, bond yields, inflation rates and real yields,
portfolio analysis.
JEL Classification: G21
INTRODUCTION
International investors take the advantage of global diversification and invest in both developed and
emerging countries. Consequently, investors need valuable information that represents the global
marketplace and act as a benchmarking instrument for them to evaluate those markets. As a result,
sovereign credit ratings start to play important role in assessing sovereign bond market. Greater
dependency has been allocated on sovereign credit ratings by investors, regulators and relevant parties.
In the recent worldwide economic crisis, the negative influence in capital market and at the
downgrading by the rating agencies had also adjusted the sovereign rating for countries. Significantly,
financial and economic crisis since year 2008 until present has influence on the sovereign default risks
in most countries. Announcement of sovereign credits ratings by rating agencies lately, especially in
European Union countries, had become important motivation of this research. Therefore, it is important
to identify the connection between changes of sovereign rating and yield to maturity (measure of bond
market returns).
After Mexican economic downturn in year 1994, following with Asia financial crisis in year
1997 and worldwide financial crisisin year 2008. Sovereign rating has again influenced the capital
market globally. President of World Bank, Robert Zoellick indicates that Eurozone crisis may deepen
and threaten global economy with creation of ripple effect. Moreover, Li, Jeon, Cho and Chiang (2007)
suggested that there is significant connection between sovereign rating changes and Asia economic
crisis in 1997.
Prosiding Persidangan Kebangsaan Ekonomi Malaysia Ke-9 2014 401
In the past, sovereign debt crisis rarely occur in developed countries (Reinhart, 2010);
conversely sovereign rating changes does not preserve as an erratic issue nowadays. The most eye
catching issue was sovereign rating of United States government bond downgraded by Standard &
Poor’s (S&P) on 5th August 2011 for the first time after almost 90years since United States ranked the
top spot in 1971. One notch drop from AAA to AA+ mainly caused by failure of congress in budget
tightening and government spending cut. According to S&P, this decision taken after they considered
spending cut for US$2.1 trillion on 2nd August is unsatisfactory and this amount is not enough to
stabilise its debt.
After US sovereign rating downgraded by S&P, more sovereign rating continuously being
announced. After 13years, New Zealand faces its rating downgraded by both Fitch and S&P due to its
high external debt on September. On 14th October 2011, Spain rating’s downgraded by rating agencies
due to its high unemployment, economic slowdown and high private sector debt. Moreover, countries
such as Greece, Japan (one notch), and Portugal (become junk status) faced ratings cut by rating
agencies and lastly Italy had being downgraded by three notches.
Generally, there are two alternatives capital market for investors to invest their extra income,
which include stock market and bond market. According to Cheng and Ariff (2011), bond market
capitalization consists of US$ 154 trillion whereas share market consists of US$ 45trillion. Obviously,
this amount shows that bond markets is massive and act as an important platform for investors to
generate income. The most precise proxy in measure bond returns goes to yield to maturity (YTM),
which is bond yield, where it depends on maturity period and predominant interest rate (Ariff, Cheng
and Neoh, 2008). There are plenty of literature that studied on ratings changes and bond spread (see
Kraussl, 2005; Afonso et al, 2011; Ismailescu and Hossein, 2010), which said to be more ostensibly.
However, previous researches do not include relationship between bond yields and sovereign rating
changes in their studies. Therefore, the main purpose of this study is to investigate the effect of
sovereign changes on bond yields.
Malaysia has just experienced another downgrade of the sovereign rating last months, our
capital market and currency exchange rate reacted immediately with high loses in Bursa Malaysia
couple with sharp depreciation of our currency against major foreign exchanges. The effect is still
being felt until today of writing (22/8/2013). Our Bank Negara has revised the GDP forecast for this
year (New Strait Time, 22/8/2013). The issue of sovereign rating change is very much at home, not
something happening at other part of the world. Therefore it is important for us to study the link
between sovereign ratings and rating changes to the bond yields and economic variables.
Therefore, the problems are to identify these reactions on the directions, magnitudes and
duration of these effects. This preliminary study is a modest attempt to understand the behavior of
investors’ reactions in short term and long term on the bond yields control by inflation.
LITERATURE REVIEW
Determinants of Sovereign Rating
Saunders (1986) argued macroeconomic variables of countries treated as “new” information in examine
sovereign default. Besides that, Cantor and Parker (1996a) examined eight economic variables from 49
countries as determinants of ratings encompassed by S&P and Moodys. Analysis proved that both
agencies highly consistent in assigning sovereign rating by watching the macroeconomic fundaments
and there are six macroeconomic factors show significant result by applying ordinary least square as
techniques of analysis.
This area is revised by Bheenick (2005) to assess the determinants of sovereign rating in
economic aspect mentioned by both rating agencies. However, method used by Bheenick (2005) is
ordered response model, which claimed as higher accuracy and more appropriate. This implication
supported by Bheenick et al (2006) as this study ll. Extension research had been conducted by
Bheenick et al (2006), which includes three rating agencies, S&P, Moodys and Fitch ratings. Bheenick
(2005) appraisal the most relevant economic variables are GNP per capital and inflation. Furthermore,
additional vital indicators for emerging market include current account balance and level of foreign
reserves. Therefore, results suggest that large range of indicators should be added in emerging market.
Alternatively, Baek et al (2005) assessed country risk by including economic fundamentals
variables as well as market’s attitude toward risk, which consider as non-country specific indicators.
Results submitted that solvency, economic stability and liquidity have impact on ratings where
measurement for each indicator provided in table 2.1. Critically, risk appetite index (measurement of
market’s attitude toward risk) are important in define market assessed country risk premium.
402 Cheng Fan Fah, Lim Li Hsia, Annuar Nasir
Effect of Sovereign Changes on Bond Market Return
There are limited research on sovereign changes in relation to bond market returns. One of the earlier
stud by Cantor and Parker (1996) found that ratings changes give impact on bond return (yield) follow
by Kaminsky and Schmukler (2002) that supported sovereign rating announcements have relationship
with bond market returns. However, the authors silent on it magnitude and explanation given in brief
since the main purpose of the research focused on determinants of sovereign rating.
On the other hand, Pukthuanthong-Le et al (2007) studies the relationship ofsovereign rating
changes and return of stock and bond market. Measurements of bond market return used in mentioned
research are daily price indexes and interest rate data. Authors claimed that taking both data as
measurements of market return helps in maximize the supremacy and accuracy in hypothesis testing.
Study indicates that downgrades of ratings give negative impact on both bond and stock market,
whereas positive returns only occur in bond market when there are upgrades announcements.
Additionally, authors identified that downgrades of sovereign rating showed significant negative
impact in countries which are high inflation and low current account.
The latest study by Cheng and Ariff (2011) conducted a study to examine the relationship
between sovereign rating and bond market returns which focusing on bond yields, term spread and real
yield in 33countries with high GDP. Authors had grouped the 33countires into portfolio and found that
there is significant relationship between sovereign rating and bond market return based on Spearman
rank correlations analysis.
METHODOLOGY
This study focuses on secondary data to determine the effect on bond market return by using yield to
maturity, which estimated from government securities. Bond valuation method is important in this
study where sovereign ratings and bond yields for five years period (2007-2011) of 30 countries, which
representing 80 percent of world GDP is investigated. Data will be collected from Data stream’ bond
indices section, S&P Capital IQ, Asian Bond Online and each country’s central bank website.
The process of the research begins with the development of the research framework which
shows that bond market return is the dependent variable, independent variable is sovereign rating
changes and macroeconomic factors is the moderating variable. Ratings for five years (2007-2011)
provided by the Standard and Poor’s this study are obtained in order to identify sovereign rating
changes. Sample frame filtered by using country gross domestic product (GDP) where only high GDP
countries this study re selected. Moreover, bond market return measured by yield to maturity which had
been specified as the most accurate indicator. Additionally, moderating variable which is inflation rate
was studies in order to analyse on inflation adjusted bond yields. Sovereign ratings had been assigned
with ranking where highest rating (AAA) assigned as rank 21 and lowest rating (SD) assigned as rank
1. Data was analysed through correlation and regression analysis and sovereign ratings of 30 countries
this study are grouped into portfolio in order to reduce effect of errors.
Hypothesis Development
The theoretical framework illustrates the relationship between variables and the relationship being
identified. A hypothesis is a testable statement or can be defined as a logically conjectured relationship
in this study with two or more variables expressed in the form of a testable statement (Malhotra, 2009).
Hypothesis will be tested in order to find the relationship and solve the problem. The following is the
hypothesis that is formulated to help to test the relationships between sovereign rating changes and
bond market return.
H1: There is a relationship betweensovereign rating changes and yield to maturity.
Ho: There is no relationship between sovereign rating changes and yield to maturity.
H2: There is a relationship between inflation rate and yield to maturity.
Ho: There is no relationship between inflation rate and yield to maturity.
H3: There is a relationship between sovereign rating changes and inflation adjusted yield to
maturity.
Ho. There is no relationship between sovereign rating changes and inflation adjusted yield to
maturity.
Prosiding Persidangan Kebangsaan Ekonomi Malaysia Ke-9 2014 403
Sample of the Study
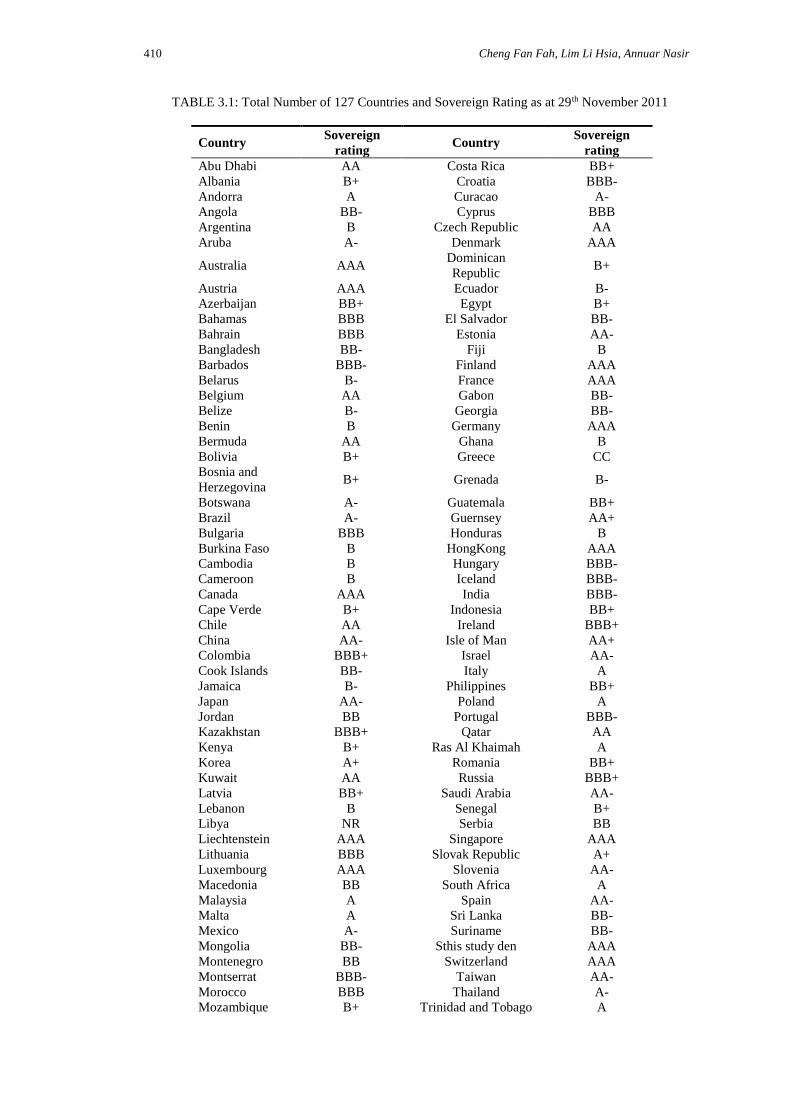
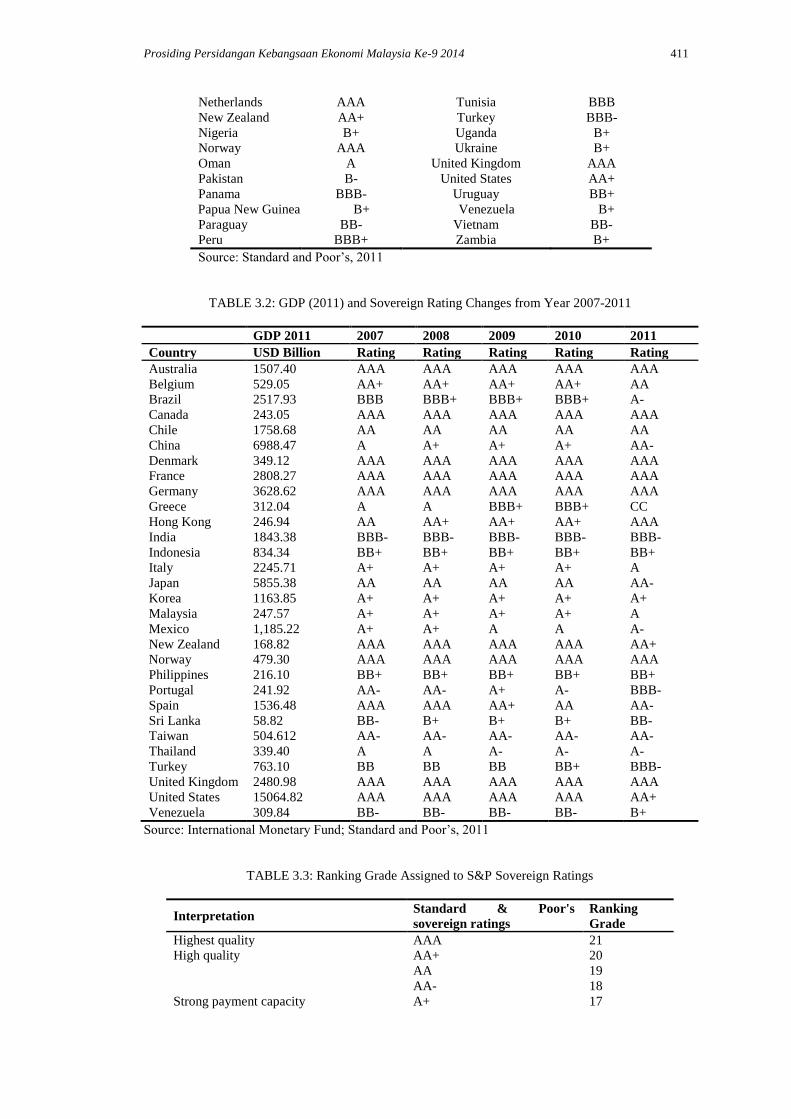
In this research, there are 127 countries in S&P sovereign rating list. This studysamplesfrom the rating
list provided by S&P (Table 3.1). A final 30 countries filtered according to country’s gross domestic
product (GDP). These 30 countries representing of the largest bond market value in international bond
market. Besides that, this sample composed about 80 percent of world’s GDP where total GDP for 30
selected markets is US$ 56,430 billion and world’s GDP is US$ 70,011 billion (International Monetary
Fund, 2011). Table 3.2 shows the 30 countries and their GDP and the sovereign rating changes from
year 2007 to year 2011. As a result, there are total 150 observations in this study.
Last but not least, Data stream’s bond indices section, S&P Capital IQ, Asian Bond Online
and each country’s central bank website had been accessed to obtain yield to maturity for both short
term and long term government bond from 2007 to 2011. Yield to maturity of government bond is the
most important data which need to be collected. In order to increase reliability and precision of the
findings, sources of data such as central bank of each country and others reliable database not only
important for obtaining data but also vital to ensure data accuracy.
Data Analysis
Fundamentally, this research is a multicounty analysis of short term and long term government bond
yields of 30 countries for most recent five years periods from 2007 to 2011. First and foremost,
sovereign ratings of 30 countries had been retrieved from S&P. Next, government bond yields for three
categories of bond which include 1year bond yields, 5years bond yields and 10years bond yields had
been collected from Data stream’s bond indices section, S&P Capital IQ, Asian Bond Online and each
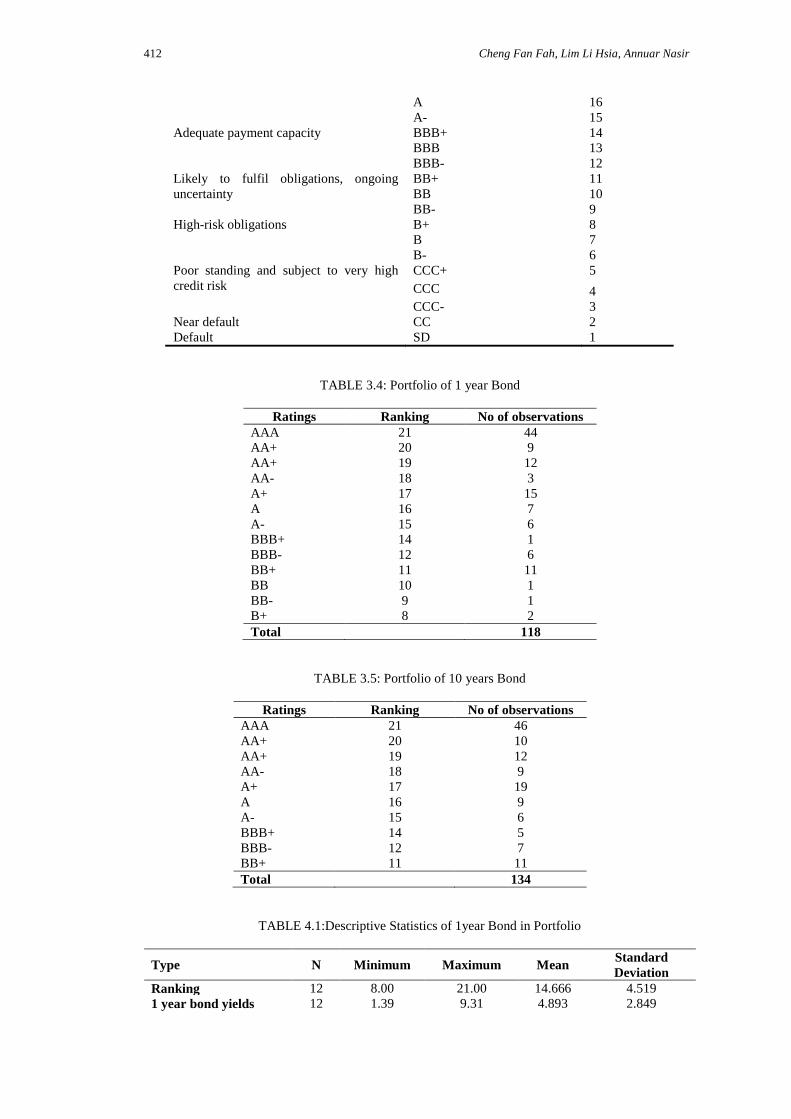
country central bank’s. Essentially, bond market returns are measured using yield to maturity. Table 3.3
shows that 1-21 ranking had been assigned to each sovereign rating where highest quality (AAA)
ranked as 21 and default (SD) ranked as 1. Moreover, bond yields had been filtered and eliminate all
out linear by looking at the mean and standard deviation.
The number of qualify observations in each category after filtering is 118 observations for 1
year bond and 134 observations for 10 years bond. Data are then grouped into portfolio according to
category of bond with different maturity period. Portfolio results are presented in this study since this
study show that portfolio is able to lower disturbance term. Differences of bond yield and inflation rate
before and after sovereign rating changes are presented and discussed as well.
Grouping sovereign ratings into portfolios:
According to Cheng and Ariff (2011), portfolio is important in diminishing disturbance term effect
where it occurs when there is large number of data from diverse country. Moreover, Cheng, Ariff and
Shamsher (2004) supported that errors in variables issue can be eliminated by grouping method.
Table 3.4, and 3.5show portfolios this study re formed according to the ratings assigned for
the 150 observation based on the sovereign rating of 2007-2011. There are total 10-13 portfoliosare
grouped and presented according to each category of bond which include 1year bond and 10years bond.
Pearson Correlation Analysis
This study determines the extent to which changes in the value of an attribute (sovereign rating ‘rank
and inflation rate) is associated with changes in another attributes (yield to maturity). Besides,
correlation analysis in this study also assists in examining the association between yield to maturity and
inflation rate.Inflation rate act as moderating variable, therefore, results of correlation between inflation
adjusted yields to maturity and sovereign ratings this study re presented in chapter 4. The formula for
inflation adjusted yield to maturity as:
Inflation adjusted yield to maturity = Yield to maturity – Inflation rate (3)
Regression Analysis
Multivariate analysis applied when there are two or more measurements on each element, variables will
be analysed simultaneously. Multiple linear regressions are used to test the relationship between two or
more independent variables and one dependent variable at the same time. It could perform regressions
based on the following models:
404 Cheng Fan Fah, Lim Li Hsia, Annuar Nasir
Where:
Bond market return (yield to maturity)
Sovereign ratings
Inflation rate
= Error term
All the methods above are used to increase the efficiency and the accuracy of data analysis of
this study.
RESULTS
Descriptive Statistics of Bond based on Portfolio Results
Descriptive Statistics of 1 year Bond in Portfolio
After filteringsample, there are12 groups of descriptive statistics of 1 year bond. Table 4.1 shows that
maximum ranking for 1 year bond portfolio is 21which mean the sovereign rating it has is AAA and
the minimum ranking is 8 (B+). Then, the minimum yield designates 1.39 percent, maximum yield
9.31 percent, a mean value of 4.8933 percent and standard deviation of 2.85 percent. While the
inflation for this category has a minimum value of 2.13 percent, a maximum value of 7.47 percent, a
mean value of 4.30 percent and standard deviation of 2.07 percent. Furthermore, the inflation adjusted
bond yield for 1year bond has minimum percentage of -0.74, maximum percentage of 2.57, mean value
as 4.89 percent and 2.85 percent for standard deviation.
Descriptive Statistics of 10 years Bond in Portfolio
Another group selection process has been done for the sample; there are 10 groups of descriptive
statistic for 10 years bond portfolios. From the results obtained, the minimum ranking rating grade is
BB+ while the maximum is AAA. The portfolio’s yield, it has a minimum of 2.77 percent while
maximum yield has 11.06 percent, mean value 5.743 and standard deviation of 2.694. Subsequently,
the minimum inflation rate is 2.01 percent while maximum is 8.54 percent. Then for mean value shows
3.864 percent and standard deviation 1.971 percent. Next, inflation adjusted bond yield shows
minimum percentage of -0.33; maximum percentage of 6.42, mean value of 1.88 and standard
deviation shows 1.82 percent in Table 4.2.
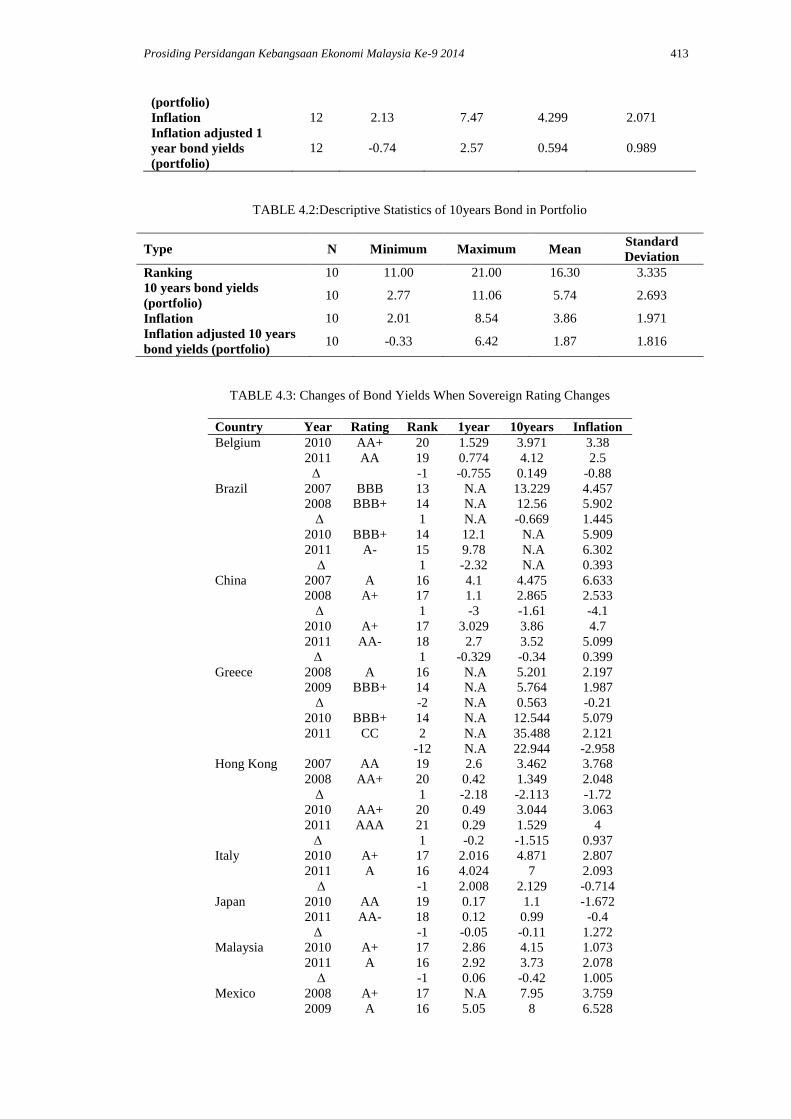
Descriptive analysis of changes of sovereign ratings and changes of bond yields
In table 4.3, it shows the changes of bond yields when there are sovereign rating changes (upgrades and
downgrades). As mentioned in chapter 3, there are total 30 countries as the sample for this study. After
filtered all countries which did not experienced any sovereign rating changes between years 2007-2011,
there are 17 countries experienced sovereign rating upgraded or downgraded by S&P in the last five
years.
From the table 4.3, it can be observed that there are total 28 changes of sovereign rating with 9
upgrades announcement and 19 downgrades announcement across 17 countries. Among the 17
countries, there are 13 countries that experienced downgrades of sovereign rating, three countries had
upgrades of sovereign rating and one country had both upgrades and downgrades of sovereign rating in
past five years. According to the theory, when there is downgrade, bond yield should increase since
downgraded means higher of default risk. Therefore, changes of yields should show negative sign
(yield of current year less than yield of previous year) when upgrades and positive sign (yield of
current year higher than yield of previous year) when downgrades of sovereign rating. As a result, this
section discussing on changes of bond yield when there are sovereign rating changes.
The only one country which experience both upgrade and downgrade of sovereign rating is Sri
Lanka. Sri Lanka experienced one notch down in year 2008 from BB- (ranked as 9 in year 2007) to
become B+ (ranked as 8 in year 2008). Refresh back that the higher the ranking, higher quality is the
bond where AAA+ ranked as 21. Sri Lanka had experienced downgrades in year 2008 from BB- in
year 2007 to become B+ in year 2008 and upgrades in year 2011 from B+ in year 2010 to become BB-
Prosiding Persidangan Kebangsaan Ekonomi Malaysia Ke-9 2014 405
in year 2011. First, this study identified in table 4.11 show that there is a sudden jump in inflation rate
from 1.99 percent in year 2007 to become 18.7 percent in year 2008. Refer to the upgrades in year
2011, this study identify that there is positive sign for changes of bond yield. Logically, the value of
changes should provide negative sign when there is upgrade. Yet, when bond yields less the inflation
rate, the real yield obtained will be in negative sign. Therefore, this study indicates that the bond yield
changes of Sri Lanka are consistent with the theory.
Additionally, there are four other countries experience upgrades in past five years which
include Brazil, China, Hong Kong and Turkey. Refer to the table 4.4, all of the four mentioned
countries experienced two times of sovereign rating upgrades. This study observes that bond yields of
Brazil have decrease once its sovereign rating upgraded by S&P. Besides, China experiences one notch
upgrade in year 2008 (from A to A+) and the second time of one notch upgrade happened in year 2011
(from A+ to AA-). Same as China, Hong Kong has experiences two times sovereign rating upgrades in
year 2008 (from AA to AA+) and year 2011(from AA+ to AAA). On the other hand, Turkey has
experiences two times sovereign rating upgrades in continuous year which are in year 2010 (from BB
to become BB+) and year 2011 (from BB+ to BBB-). Refer to the column of bond yield changes; this
study observed that yield changes of Brazil, China and Hong Kong have supported the theory by
showing negative sign. These values indicate that when sovereign rating upgrades, bond yield for
investors will be reduced. Moreover, sovereign rating upgrades happened in Turkey do not support the
theory, this might be due to the high inflation in Turkey where inflation rate reach 10.1 percent in year
2009 and about 7 percent in year 2010 and year 2011.
Other than the above mentioned countries (Sri Lanka, Brazil, China, Hong Kong and Turkey)
above, the remained 12countries have had experienced sovereign rating downgrades which include
Belgium, Greece, Italy, Japan, Malaysia, Mexico, New Zealand, Portugal, Spain, Thailand, United
States and Venezuela. The most significant countries which involve in serious notches downgrade are
Greece and Portugal. Obviously, Greece had experienced many notches downgrade last year from
BBB+ (ranked as 14) to CC (ranked as 2) which can be classified as junk bond. This study can identify
that inflation rate had decreased about 3 percent in year 2011 (5%) when compare with year 2010 (2%).
However, the changes of bond yields had increased in a huge percentage. For instance, 3years bond
yield is roughly 14 percent in year 2010 when Greece sovereign rating given as BBB+, however when
sovereign rating had been downgrades as CC, 3years bond yield has increase to become 102 percent.
Therefore, change of 3years bond yield is 88 percent. This phenomenon suggested that when there is
downgrade of sovereign rating, bond yield offer by issuer need to be raised as its risk of default
increase equivalently.
Additionally, Portugal had experienced serious sovereign ratings downgrade since year 2008.
In year 2008, Portugal had been rates as AA- which falls in the category of high quality bond.
However, in year 2011, sovereign rating of Portugal becomes BBB- that interpret as government that
has adequate payment capacity (refer to table 1.1). As showed in the table 4.4, the changes of bond
yields have increase about 7 to 10 percent once Portugal’s sovereign rating had been downgraded by
S&P. Follow with Mexico and Spain which had involve in sovereign downgrades since year 2008 to
2011. Mexico had been announced sovereign rating downgrade in year 2008 (from A+ to A) and year
2011 (from A to A-). Although there this study re two times of downgrade, this study can identify that
sovereign ratings still fall under the same category which interprets as the government has strong
payment capacity (refer to table 1.1). As a result, bond yields of Mexico at a decreasing rate and its
changes of bond yields in table 4.11 are in negative sign. This value indicates that when downgrades of
sovereign rating fall under the same category and bond issued by government still considered as high
quality, investors might not perceive as high risk and do not request for higher return. This justification
can be observed from the sovereign rating changes and bond yield changes happened in Spain as this
study ll. Spain had experienced downgrades for three times in year 2009 (from AAA to AA+), year
2010 (AA+ to AA) and year 2011 (from AA to AA-). All the sovereign ratings fall under the same
category where S&P given the interpretation as high quality bond.
Furthermore, the other countries had experiences minor notch downgrade are Belgium, Italy,
Japan, Malaysia, New Zealand and Thailand. According to the table, these countries had experienced
minor downgrade such as Belgium’s sovereign rating had downgraded from AA+ to AA and
Malaysia’s sovereign rating had downgraded from A+ to A. In overall, this study identifies that
government of these countries have increase the bond yields for short term and long term bond when
sovereign ratings had been downgraded. Therefore, changes of bond yields column in table 4.4 show
positive sign which means that there is an increase by using current year bond yield minus previous
year bond yield. Last but not least, United States had been downgraded for one notch from AAA to
AA+ after being as the top spot government which has the highest ability in paying their debt for
406 Cheng Fan Fah, Lim Li Hsia, Annuar Nasir
90years. From the changes of bond yield, this study indicates that this announcement give small impact
since the cost of borrowing had decreased in year 2011 when compare to year 2010.
Pearson Correlations Analysis
Correlation analysis or bivariate analysis use to test the relationship in these two variables. Correlation
is defined only when both of the standard deviation is finite and both of them are non-zero. In this
research, Pearson correlation which under correlation test has been used to test the relationship be this
study independent and dependent variables. There is signification relationship between variables when
significant value, P is less than 0.1, 0.01 or 0,001. Additionally, r-value shows positive figure which
mean the relationship between variables is positive correlated. On the other hand, when r-value show
negative sign which mean there is negative correlation be this study variables.
Person correlation analysis for Portfolio results
Two tables (Table 4.4, 4.5) below in this section show the results of correlation coefficient after each
observation in particular category of government bond with different maturity period had been grouped
into portfolio. Label R is sovereign ranking for grouped observation; YTM is grouped yield to maturity
and lastly is grouped inflation rate. Same as above, grouped bond yields is the dependent variable while
independent variable is grouped as sovereign ranking, whereas grouped inflation rate is the moderating
variable. In this section, results of bond yield in portfolio this study re presented first, follow by the
inflation adjusted bond yield in portfolio.
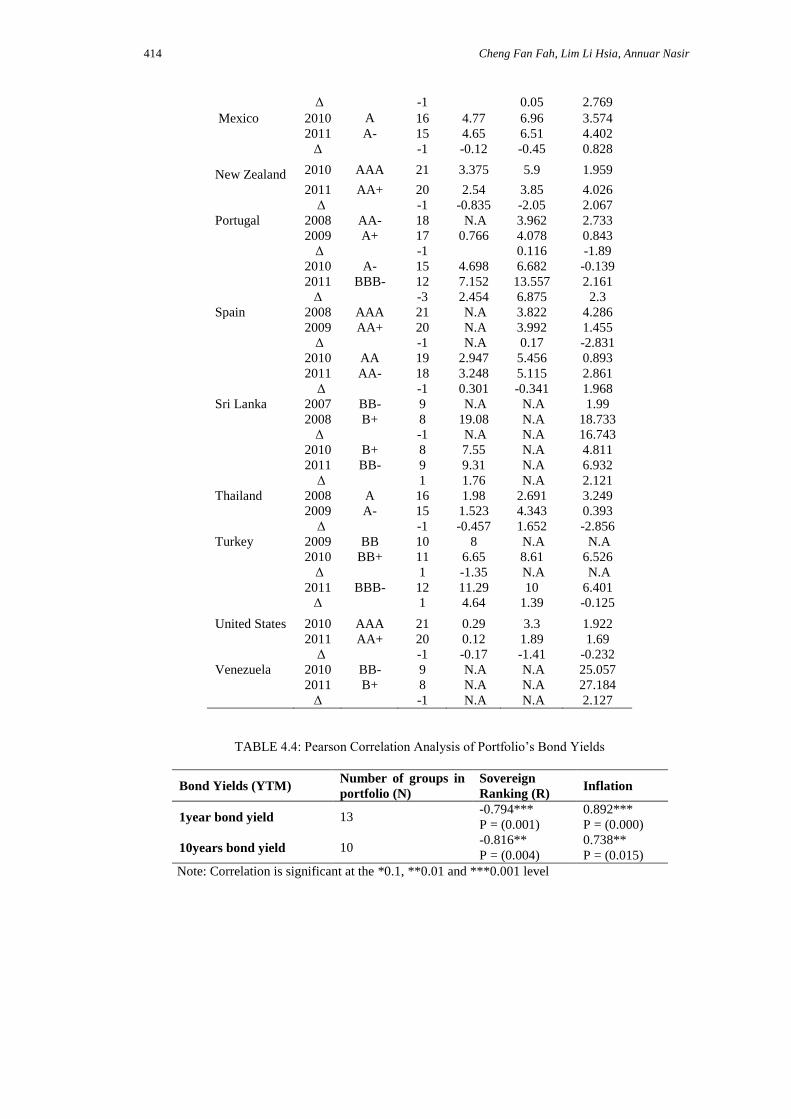
Pearson correlation analysis for portfolio’s bond yields
In this section, portfolio results this study re discussed and herewith this study had started the
discussion as bond yield is the dependent variable whereas both inflation rate and sovereign ranking are
independent variable. According to the table 4.4 obtained, it starts off with the 1year bond. The Pearson
correlation for 1year bond yield and sovereign ranking, the r-value = -0.794 (p-value = 0.001) while
Pearson correlation for grouped bond yield and inflation rate, r = 0.892 (p-value = 0.000). From here, it
can be observed that bond yield and sovereign ranking show negative correlation. Next, the correlation
between bond yield and inflation rate shows positive correlation. In this category, all the significance
values is less than 0.001, therefore, this study can conclude that there is quite a high association
between bond yield with sovereign ranking and inflation rate.
Last but not least, the final category of bond in portfolio will be 10years bond. From the
results, the Pearson correlation for grouped 10years bond yield and sovereign ranking, r-value = -0.816
(p-value = 0.004) while the Pearson correlation for bond yield and inflations rate, r-value is 0.738 (p-
value = 0.015). From here, it can be seen that both of the correlation significant at 0.01. As suggested
in the theory, higher quality of sovereign ranking, lower is the bond yield. Whereas, there is positive
correlation between yield and inflation rate, when increase in inflation rate, yield will increase as well.
Pearson correlation analysis for portfolio’s inflation adjusted bond yields
After discussed on portfolio’s bond yield in previous section, this section inflation adjusted bond yield
is the dependent variable and discussion is focusing on the Pearson correlation for portfolio’s inflation
adjusted bond yield and grouped sovereign ranking. Refer to the Table 4.5, the Pearson correlation for
grouped 3months inflation adjusted yield and sovereign ranking, r-value = -0.06 and p-value = 0.845.
Although there is no significant relationship, this study still can conclude that there is negative
correlation in this study en inflation adjusted bond yield and sovereign ranking. As proposed in the
theory, higher quality of the bond, in this study r is the real yield.
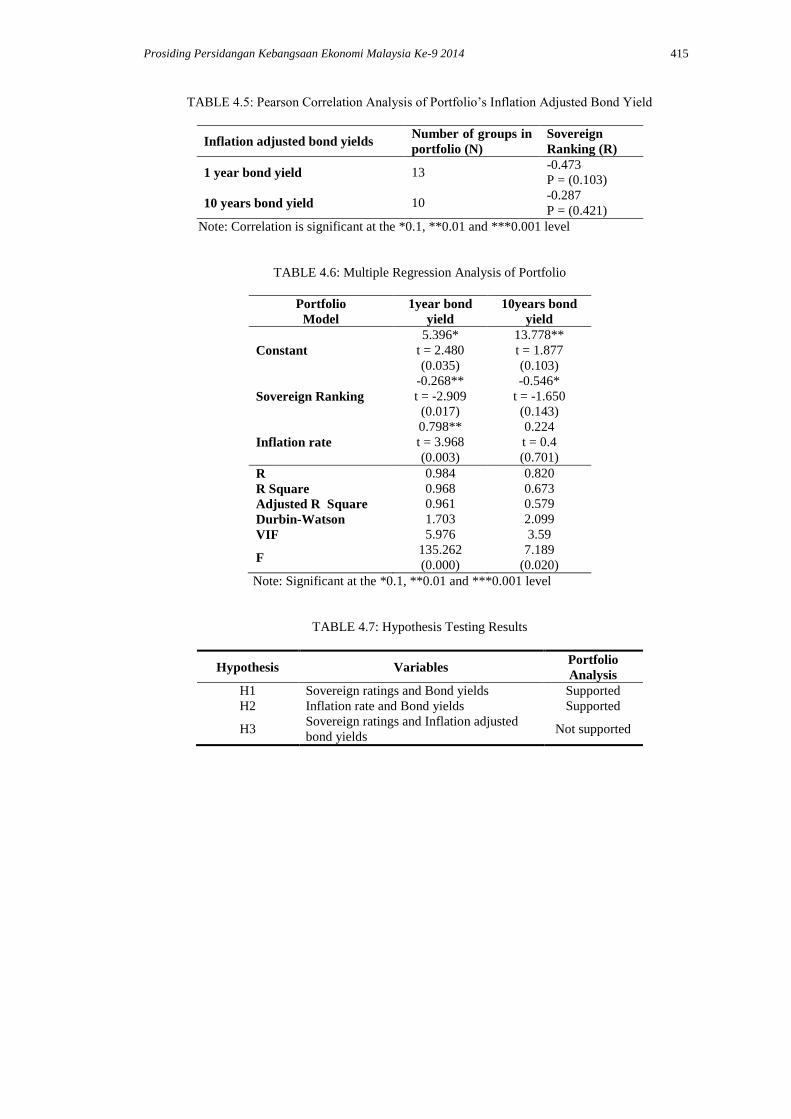
Whereas, the Pearson correlation for grouped 1year inflation adjusted bond yield and
sovereign ranking, r-value = -0.473 and p-value = 0.103. Table show not significant result for this
grouped 1year bond’s real yield. Again, it shows that there is negative correlation between real yield
and sovereign ranking as supported by theory: higher quality of bond has lower real yield.
Continuously, portfolio of 10years bond will be discussed. From the table 4.5, correlation
coefficient for grouped 10years inflation adjusted bond yield and sovereign ranking, r = -0.287 and p-
value = 0.421. Therefore, this study can concludes that there is no significant result for this portfolio.
From the result, negative correlation within variables can be observed.
Prosiding Persidangan Kebangsaan Ekonomi Malaysia Ke-9 2014 407
Regression Analysis
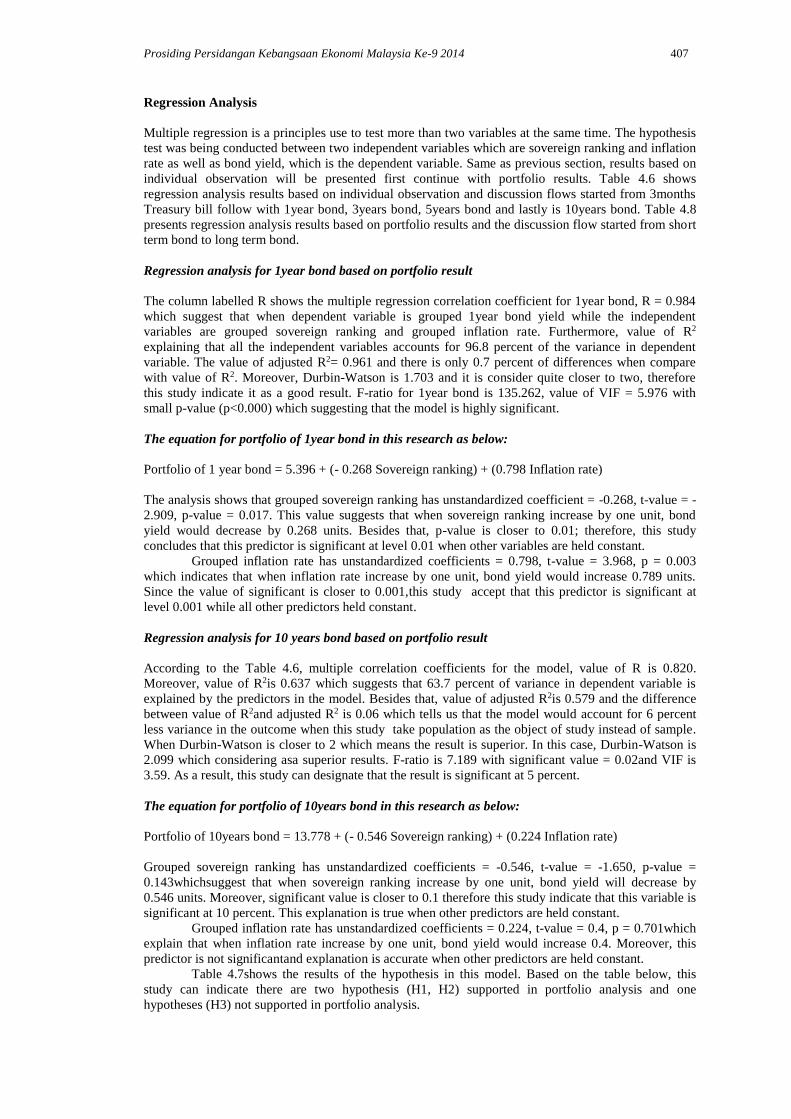
Multiple regression is a principles use to test more than two variables at the same time. The hypothesis
test was being conducted between two independent variables which are sovereign ranking and inflation
rate as well as bond yield, which is the dependent variable. Same as previous section, results based on
individual observation will be presented first continue with portfolio results. Table 4.6 shows
regression analysis results based on individual observation and discussion flows started from 3months
Treasury bill follow with 1year bond, 3years bond, 5years bond and lastly is 10years bond. Table 4.8
presents regression analysis results based on portfolio results and the discussion flow started from short
term bond to long term bond.
Regression analysis for 1year bond based on portfolio result
The column labelled R shows the multiple regression correlation coefficient for 1year bond, R = 0.984
which suggest that when dependent variable is grouped 1year bond yield while the independent
variables are grouped sovereign ranking and grouped inflation rate. Furthermore, value of R2
explaining that all the independent variables accounts for 96.8 percent of the variance in dependent
variable. The value of adjusted R2= 0.961 and there is only 0.7 percent of differences when compare
with value of R2. Moreover, Durbin-Watson is 1.703 and it is consider quite closer to two, therefore
this study indicate it as a good result. F-ratio for 1year bond is 135.262, value of VIF = 5.976 with
small p-value (p<0.000) which suggesting that the model is highly significant.
The equation for portfolio of 1year bond in this research as below:
Portfolio of 1 year bond = 5.396 + (- 0.268 Sovereign ranking) + (0.798 Inflation rate)
The analysis shows that grouped sovereign ranking has unstandardized coefficient = -0.268, t-value = -
2.909, p-value = 0.017. This value suggests that when sovereign ranking increase by one unit, bond
yield would decrease by 0.268 units. Besides that, p-value is closer to 0.01; therefore, this study
concludes that this predictor is significant at level 0.01 when other variables are held constant.
Grouped inflation rate has unstandardized coefficients = 0.798, t-value = 3.968, p = 0.003
which indicates that when inflation rate increase by one unit, bond yield would increase 0.789 units.
Since the value of significant is closer to 0.001,this study accept that this predictor is significant at
level 0.001 while all other predictors held constant.
Regression analysis for 10 years bond based on portfolio result
According to the Table 4.6, multiple correlation coefficients for the model, value of R is 0.820.
Moreover, value of R2is 0.637 which suggests that 63.7 percent of variance in dependent variable is
explained by the predictors in the model. Besides that, value of adjusted R2is 0.579 and the difference
between value of R2and adjusted R2 is 0.06 which tells us that the model would account for 6 percent
less variance in the outcome when this study take population as the object of study instead of sample.
When Durbin-Watson is closer to 2 which means the result is superior. In this case, Durbin-Watson is
2.099 which considering asa superior results. F-ratio is 7.189 with significant value = 0.02and VIF is
3.59. As a result, this study can designate that the result is significant at 5 percent.
The equation for portfolio of 10years bond in this research as below:
Portfolio of 10years bond = 13.778 + (- 0.546 Sovereign ranking) + (0.224 Inflation rate)
Grouped sovereign ranking has unstandardized coefficients = -0.546, t-value = -1.650, p-value =
0.143whichsuggest that when sovereign ranking increase by one unit, bond yield will decrease by
0.546 units. Moreover, significant value is closer to 0.1 therefore this study indicate that this variable is
significant at 10 percent. This explanation is true when other predictors are held constant.
Grouped inflation rate has unstandardized coefficients = 0.224, t-value = 0.4, p = 0.701which
explain that when inflation rate increase by one unit, bond yield would increase 0.4. Moreover, this
predictor is not significantand explanation is accurate when other predictors are held constant.
Table 4.7shows the results of the hypothesis in this model. Based on the table below, this
study can indicate there are two hypothesis (H1, H2) supported in portfolio analysis and one
hypotheses (H3) not supported in portfolio analysis.
408 Cheng Fan Fah, Lim Li Hsia, Annuar Nasir
CONCLUSION
Global economic crisis in year 2008 had threatened worldwide financial market. Follow with Eurozone
crisis in year 2011 had again deepen the global capital market. S&P announced to downgrade United
States sovereign ratings in August 2011, continue with downgrades announcement of few countries
such as Italy, New Zealand and others. Moreover, Greece and Portugal sovereign ratings had been
downgraded for many notches and classified as junk bond. Sovereign debt crisis has significantly place
the financial market into a tension situation. Kaminsky and Schmukler (2002) indicated that sovereign
rating changes have obviously give impact on bond returns. The concealment relationship between risk
and return needed to be study. Sovereign debt issues become the main motive for this research to
conduct in order to provide insight for all related parties to understanding the relationship between
sovereign rating changes and bond yields.
The main objective of this research is to find out the effect of sovereign rating changes on
bond market returns. Moreover, nominal bond yield, real yield and inflation rate this study re included
into this research in order to study the risk and return relationship. After studied plenty of previous
research which has been discussed in literature review, it provides insight and dimension about which
area should be covered. Theories and finding of those researches are important and contributes in this
study. This study have discovered that rarely has study focused on the relationship between sovereign
rating and yield to maturity. Therefore, this research is important to provide new information and fresh
idea regarding risk and return relationship in bond market.
As suggested by Cantor and Packer (1996), sovereign rating changes contain invisible
information that gives impact on bond market which includes information for central government in
decision making. Authors had indicated that government seek sovereign rating as an important tool for
them to enter international market since most of the investors prefer rated bond. This study allows
central government to understand that how sovereign rating changes affect investors’ perception toward
their default risk and likelihood to invest in their government securities. Significantly, this study allows
central government to estimate their cost of borrowing during sovereign rating changes. For instance,
when there is downgrade announcement, government is expected to increase the bond yield. However,
this means that their cost of funding will be increased and this situation might effect on their account.
High borrowing cost will give burden on government ability to pay their debt. In worst, huge
government debt might cause collapse of a country’s future and threaten its financial market. Besides,
inflation rate and sovereign rating change are significant effect on government policy.
Descriptive analysis on sovereign rating changes and bond yield changes provide insight that
when there is significant downgrade announcements such as Greece and Portugal, bond yields have
been observed that increase in large percentage. However, different degree of downgrade and upgrade
announcements give different impact on bond yields. For example, downgrades on Mexico did not
brought any significant impact on bond yield. This reason might be due to the sovereign rating within
class or across class will give different degree of impact. Besides that, sovereign rating downgrade of
reputable country such as New Zealand and United States seek to have very minor impact on bond
yield. This information is able to give different point of view for investors and related parties as other
researchers who interested to study in deep regarding.
Last but not least, results found in this study would provide insight for regulators. As
documented by Pukthuanthong-Le et al (2007), the information regarding sovereign rating helps
regulator agents such as Basel Committee to design their regulatory. Moreover, this research serves as
the gateway for further research to study on topic regarding sovereign rating changes and bond yield.
REFERENCES
Amihud, Y. (2002). Illiquidity and stock returns: Cross section and time series effects. Journal of
Financial Markets, 5, 31-56.
Amihud, Y., Mendelson, H. & Pedersen, L. (2005). Liquidity and asset prices. Foundations and Trends
in Finance, 1, 269-364.
Ariff, M., Cheng, F.F.& Neo, V.H. (2008). Bond Markets in Malaysia and Singapore. University Putra
Malaysia Press, Serdang, Selangor, Malaysia.
Baek, I-M., Bandopadhyaya, A. & Du, C. (2005). Determinants of market-assessed sovereign risk:
Economic fundamentals or market risk appetite? Journal of International Money and Finance,
24 (2005), 533-548
Bheenick, E. B. (2005). An analysis of the determinants of sovereign ratings. Global Finance Journal,
15, 251-280.
Prosiding Persidangan Kebangsaan Ekonomi Malaysia Ke-9 2014 409
Bheenick, E. B. (2012). Do sovereign rating changes trigger spillover effects? Research in
International Business and Finance, 26, 79-96.
Bheenick, E. B., Brooks, R. & Yip, Y. N. (2006). Determinants of sovereign ratings: A comparison of
case-based reasoning and ordered probit approaches. Global Finance Journal, 17, 136-154.
Cantor, R. & Packer, F. (1995). Sovereign credit ratings. Federal Reserve Bank of New York Economic
Policy Review, 1(3), 1-6.
Cantor, R. & Packer, F. (1996). Determinants and impacts of sovereign credit ratings. Federal Reserve
Bank of New York Economic Policy Review, 2, 37-53.
Cantor, R. & Packer, F. (1996a). Determinants and impacts of sovereign credit ratings. Federal Reserve
Bank of New York Economic Policy Review, (October), 1-15.
Cheng. F.F. & Ariff, M. (2011). Risk, return relationship in world’s sovereign bond markets: A
multicounty study. Proceeding of World Finance Conference II. 23-27 July 2011.
Cheng, F.F., Ariff, M. & Shamsher, M.R.M. (2004). Accounting earnings and share revaluation:
Further exploration. Capital Market Review, 9(1&2), 21-48.
International Monetary Fund (2011). Selected Online IMF Data Sources. Retrieved December 7th,
2011, from http://www.imf.org/external/np/ds/matrix.htm
Ismailescu, J. & Kazemi, H. (2010). The reaction of emerging market credit default swap spreads to
sovereign credit ratings changes. Journal of Banking & Finance, 34 (2), 2861-2871.
Kaminsky, G. & Schmukler, S. L. (2002). Emerging market instability: Do sovereign rating affect
country risk and stock return? World Bank Economic Review, 16, 171-195.
Kraussel, R. (2005). Do credit rating agencies add to the dynamics of emerging market crises? Journal
of Financial Stability, 1(3), 85-355.
Li, H., Jeon, B. N., Cho, S. Y. & Chiang, T. C. (2007). The impact of sovereign rating changes and
financial contagion on stock returns: Evidence from five Asian countries. Global Finance
Journal, 19 (2008), 46-55.
Malhotra, N.K. (2009). Basic marketing research. A decision-making approach. New Jersey: Pearson
Prentice Hall.
Moody’s Investors Services (2006). Moody’s Statistical Handbook Country Credit. Retrieved
November 28th, 2011, from http://www2.um.edu.uy/fborraz/ratings-
Statisical%20handbook%20No%2006.pdf
Pukthuanthong-Le, K., Elayan, F. A. & Rose, L. C. (2007). Equity and debt market responses to
sovereign credit ratings announcement. Global Finance Journal, 18, 47-83.
Reinhart, C. (2010). This time is different chartbook: Country histories on debt, default, and financial
crises. NBER Working Paper 15815.
Standard & Poor’s (2008). Sovereign credit ratings: A Primer. Standard & Poor’s Rating Direct.
Standard & Poor’s (2010).Sovereign rating and country T&C assessment histories. Retrieved
December 7th, 2011, from
http://www.standardandpoors.com/ratings/articles/en/us/?assetID=1245213114875
Standard & Poor’s (2011). Ratings direct on the global credit portal: Sovereign ratings and country
T&C Assessments. Retrieved December 7th, 2011, from
http://www.standardandpoors.com/ratings/sovereigns/ratings-
list/en/us/?subSectorCode=39§orId=1221186707758&subSectorId=1221187348494
Standard & Poors (2011). Credit Ratings Definitions & FAQs. Retrieved November 28 th, 2011, from
http://www.standardandpoors.com
Saunders, M., Lewis, P. & Thornhill, A. (2000). Research Methods for business students. Essex:
Pearson Educations
Saunders, A (1986). The determinants of country risk: A selective survey of the literature. Journal of
Banking and Finance, 3, 1-38.
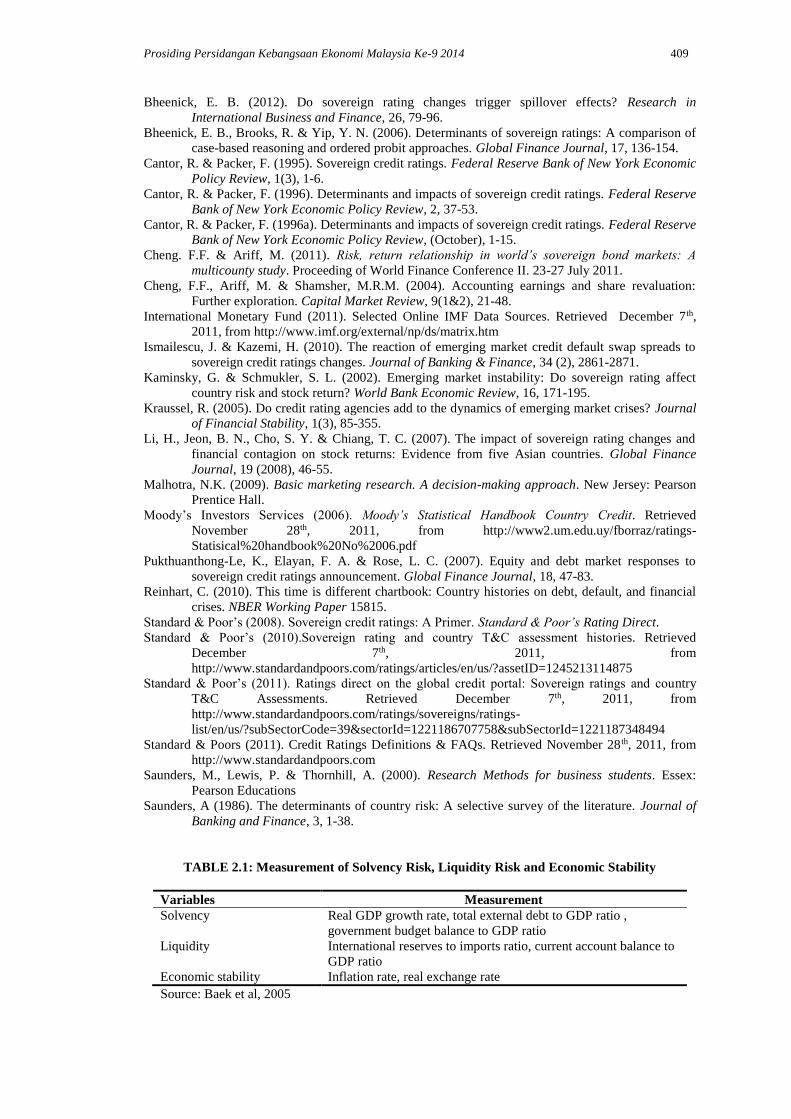
TABLE 2.1: Measurement of Solvency Risk, Liquidity Risk and Economic Stability
Variables Measurement
Solvency Real GDP growth rate, total external debt to GDP ratio ,
government budget balance to GDP ratio
Liquidity International reserves to imports ratio, current account balance to
GDP ratio
Economic stability Inflation rate, real exchange rate
Source: Baek et al, 2005
410 Cheng Fan Fah, Lim Li Hsia, Annuar Nasir
TABLE 3.1: Total Number of 127 Countries and Sovereign Rating as at 29th November 2011
Country Sovereign
rating Country
Sovereign
rating
Abu Dhabi AA Costa Rica BB+
Albania B+ Croatia BBB-
Andorra A Curacao A-
Angola BB- Cyprus BBB
Argentina B Czech Republic AA
Aruba A- Denmark AAA
Australia AAA Dominican
Republic B+
Austria AAA Ecuador B-
Azerbaijan BB+ Egypt B+
Bahamas BBB El Salvador BB-
Bahrain BBB Estonia AA-
Bangladesh BB- Fiji B
Barbados BBB- Finland AAA
Belarus B- France AAA
Belgium AA Gabon BB-
Belize B- Georgia BB-
Benin B Germany AAA
Bermuda AA Ghana B
Bolivia B+ Greece CC
Bosnia and
Herzegovina B+ Grenada B-
Botswana A- Guatemala BB+
Brazil A- Guernsey AA+
Bulgaria BBB Honduras B
Burkina Faso B HongKong AAA
Cambodia B Hungary BBB-
Cameroon B Iceland BBB-
Canada AAA India BBB-
Cape Verde B+ Indonesia BB+
Chile AA Ireland BBB+
China AA- Isle of Man AA+
Colombia BBB+ Israel AA-
Cook Islands BB- Italy A
Jamaica B- Philippines BB+
Japan AA- Poland A
Jordan BB Portugal BBB-
Kazakhstan BBB+ Qatar AA
Kenya B+ Ras Al Khaimah A
Korea A+ Romania BB+
Kuwait AA Russia BBB+
Latvia BB+ Saudi Arabia AA-
Lebanon B Senegal B+
Libya NR Serbia BB
Liechtenstein AAA Singapore AAA
Lithuania BBB Slovak Republic A+
Luxembourg AAA Slovenia AA-
Macedonia BB South Africa A
Malaysia A Spain AA-
Malta A Sri Lanka BB-
Mexico A- Suriname BB-
Mongolia BB- Sthis study den AAA
Montenegro BB Switzerland AAA
Montserrat BBB- Taiwan AA-
Morocco BBB Thailand A-
Mozambique B+ Trinidad and Tobago A
Prosiding Persidangan Kebangsaan Ekonomi Malaysia Ke-9 2014 411
Netherlands AAA Tunisia BBB
New Zealand AA+ Turkey BBB-
Nigeria B+ Uganda B+
Norway AAA Ukraine B+
Oman A United Kingdom AAA
Pakistan B- United States AA+
Panama BBB- Uruguay BB+
Papua New Guinea B+ Venezuela B+
Paraguay BB- Vietnam BB-
Peru BBB+ Zambia B+
Source: Standard and Poor’s, 2011
TABLE 3.2: GDP (2011) and Sovereign Rating Changes from Year 2007-2011
GDP 2011 2007 2008 2009 2010 2011
Country USD Billion Rating Rating Rating Rating Rating
Australia 1507.40 AAA AAA AAA AAA AAA
Belgium 529.05 AA+ AA+ AA+ AA+ AA
Brazil 2517.93 BBB BBB+ BBB+ BBB+ A-
Canada 243.05 AAA AAA AAA AAA AAA
Chile 1758.68 AA AA AA AA AA
China 6988.47 A A+ A+ A+ AA-
Denmark 349.12 AAA AAA AAA AAA AAA
France 2808.27 AAA AAA AAA AAA AAA
Germany 3628.62 AAA AAA AAA AAA AAA
Greece 312.04 A A BBB+ BBB+ CC
Hong Kong 246.94 AA AA+ AA+ AA+ AAA
India 1843.38 BBB- BBB- BBB- BBB- BBB-
Indonesia 834.34 BB+ BB+ BB+ BB+ BB+
Italy 2245.71 A+ A+ A+ A+ A
Japan 5855.38 AA AA AA AA AA-
Korea 1163.85 A+ A+ A+ A+ A+
Malaysia 247.57 A+ A+ A+ A+ A
Mexico 1,185.22 A+ A+ A A A-
New Zealand 168.82 AAA AAA AAA AAA AA+
Norway 479.30 AAA AAA AAA AAA AAA
Philippines 216.10 BB+ BB+ BB+ BB+ BB+
Portugal 241.92 AA- AA- A+ A- BBB-
Spain 1536.48 AAA AAA AA+ AA AA-
Sri Lanka 58.82 BB- B+ B+ B+ BB-
Taiwan 504.612 AA- AA- AA- AA- AA-
Thailand 339.40 A A A- A- A-
Turkey 763.10 BB BB BB BB+ BBB-
United Kingdom 2480.98 AAA AAA AAA AAA AAA
United States 15064.82 AAA AAA AAA AAA AA+
Venezuela 309.84 BB- BB- BB- BB- B+
Source: International Monetary Fund; Standard and Poor’s, 2011
TABLE 3.3: Ranking Grade Assigned to S&P Sovereign Ratings
Interpretation Standard & Poor's
sovereign ratings
Ranking
Grade
Highest quality AAA 21
High quality AA+ 20
AA 19
AA- 18
Strong payment capacity A+ 17
412 Cheng Fan Fah, Lim Li Hsia, Annuar Nasir
A 16
A- 15
Adequate payment capacity BBB+ 14
BBB 13
BBB- 12
Likely to fulfil obligations, ongoing
uncertainty
BB+ 11
BB 10
BB- 9
High-risk obligations B+ 8
B 7
B- 6
Poor standing and subject to very high
credit risk
CCC+ 5
CCC 4
CCC- 3
Near default CC 2
Default SD 1
TABLE 3.4: Portfolio of 1 year Bond
Ratings Ranking No of observations
AAA 21 44
AA+ 20 9
AA+ 19 12
AA- 18 3
A+ 17 15
A 16 7
A- 15 6
BBB+ 14 1
BBB- 12 6
BB+ 11 11
BB 10 1
BB- 9 1
B+ 8 2
Total 118
TABLE 3.5: Portfolio of 10 years Bond
Ratings Ranking No of observations
AAA 21 46
AA+ 20 10
AA+ 19 12
AA- 18 9
A+ 17 19
A 16 9
A- 15 6
BBB+ 14 5
BBB- 12 7
BB+ 11 11
Total 134
TABLE 4.1:Descriptive Statistics of 1year Bond in Portfolio
Type N Minimum Maximum Mean Standard
Deviation
Ranking 12 8.00 21.00 14.666 4.519
1 year bond yields 12 1.39 9.31 4.893 2.849
Prosiding Persidangan Kebangsaan Ekonomi Malaysia Ke-9 2014 413
(portfolio)
Inflation 12 2.13 7.47 4.299 2.071
Inflation adjusted 1
year bond yields
(portfolio)
12 -0.74 2.57 0.594 0.989
TABLE 4.2:Descriptive Statistics of 10years Bond in Portfolio
Type N Minimum Maximum Mean Standard
Deviation
Ranking 10 11.00 21.00 16.30 3.335
10 years bond yields
(portfolio) 10 2.77 11.06 5.74 2.693
Inflation 10 2.01 8.54 3.86 1.971
Inflation adjusted 10 years
bond yields (portfolio) 10 -0.33 6.42 1.87 1.816
TABLE 4.3: Changes of Bond Yields When Sovereign Rating Changes
Country Year Rating Rank 1year 10years Inflation
Belgium 2010 AA+ 20 1.529 3.971 3.38
2011 AA 19 0.774 4.12 2.5
Δ -1 -0.755 0.149 -0.88
Brazil 2007 BBB 13 N.A 13.229 4.457
2008 BBB+ 14 N.A 12.56 5.902
Δ
1 N.A -0.669 1.445
2010 BBB+ 14 12.1 N.A 5.909
2011 A- 15 9.78 N.A 6.302
Δ 1 -2.32 N.A 0.393
China 2007 A 16 4.1 4.475 6.633
2008 A+ 17 1.1 2.865 2.533
Δ
1 -3 -1.61 -4.1
2010 A+ 17 3.029 3.86 4.7
2011 AA- 18 2.7 3.52 5.099
Δ 1 -0.329 -0.34 0.399
Greece 2008 A 16 N.A 5.201 2.197
2009 BBB+ 14 N.A 5.764 1.987
Δ
-2 N.A 0.563 -0.21
2010 BBB+ 14 N.A 12.544 5.079
2011 CC 2 N.A 35.488 2.121
-12 N.A 22.944 -2.958
Hong Kong
2007 AA 19 2.6 3.462 3.768
2008 AA+ 20 0.42 1.349 2.048
Δ
1 -2.18 -2.113 -1.72
2010 AA+ 20 0.49 3.044 3.063
2011 AAA 21 0.29 1.529 4
Δ 1 -0.2 -1.515 0.937
Italy 2010 A+ 17 2.016 4.871 2.807
2011 A 16 4.024 7 2.093
Δ -1 2.008 2.129 -0.714
Japan 2010 AA 19 0.17 1.1 -1.672
2011 AA- 18 0.12 0.99 -0.4
Δ -1 -0.05 -0.11 1.272
Malaysia 2010 A+ 17 2.86 4.15 1.073
2011 A 16 2.92 3.73 2.078
Δ -1 0.06 -0.42 1.005
Mexico 2008 A+ 17 N.A 7.95 3.759
2009 A 16 5.05 8 6.528
414 Cheng Fan Fah, Lim Li Hsia, Annuar Nasir
Δ
-1 0.05 2.769
Mexico 2010 A 16 4.77 6.96 3.574
2011 A- 15 4.65 6.51 4.402
Δ -1 -0.12 -0.45 0.828
New Zealand
2010 AAA 21 3.375 5.9 1.959
2011 AA+ 20 2.54 3.85 4.026
Δ -1 -0.835 -2.05 2.067
Portugal 2008 AA- 18 N.A 3.962 2.733
2009 A+ 17 0.766 4.078 0.843
Δ
-1 0.116 -1.89
2010 A- 15 4.698 6.682 -0.139
2011 BBB- 12 7.152 13.557 2.161
Δ -3 2.454 6.875 2.3
Spain 2008 AAA 21 N.A 3.822 4.286
2009 AA+ 20 N.A 3.992 1.455
Δ
-1 N.A 0.17 -2.831
2010 AA 19 2.947 5.456 0.893
2011 AA- 18 3.248 5.115 2.861
Δ -1 0.301 -0.341 1.968
Sri Lanka 2007 BB- 9 N.A N.A 1.99
2008 B+ 8 19.08 N.A 18.733
Δ
-1 N.A N.A 16.743
2010 B+ 8 7.55 N.A 4.811
2011 BB- 9 9.31 N.A 6.932
Δ 1 1.76 N.A 2.121
Thailand 2008 A 16 1.98 2.691 3.249
2009 A- 15 1.523 4.343 0.393
Δ -1 -0.457 1.652 -2.856
Turkey 2009 BB 10 8 N.A N.A
2010 BB+ 11 6.65 8.61 6.526
Δ
1 -1.35 N.A N.A
2011 BBB- 12 11.29 10 6.401
Δ 1 4.64 1.39 -0.125
United States 2010 AAA 21 0.29 3.3 1.922
2011 AA+ 20 0.12 1.89 1.69
Δ -1 -0.17 -1.41 -0.232
Venezuela 2010 BB- 9 N.A N.A 25.057
2011 B+ 8 N.A N.A 27.184
Δ -1 N.A N.A 2.127
TABLE 4.4: Pearson Correlation Analysis of Portfolio’s Bond Yields
Bond Yields (YTM) Number of groups in
portfolio (N)
Sovereign
Ranking (R) Inflation
1year bond yield 13 -0.794*** 0.892***
P = (0.001) P = (0.000)
10years bond yield 10 -0.816** 0.738**
P = (0.004) P = (0.015)
Note: Correlation is significant at the *0.1, **0.01 and ***0.001 level
Prosiding Persidangan Kebangsaan Ekonomi Malaysia Ke-9 2014 415
TABLE 4.5: Pearson Correlation Analysis of Portfolio’s Inflation Adjusted Bond Yield
Inflation adjusted bond yields Number of groups in
portfolio (N)
Sovereign
Ranking (R)
1 year bond yield 13 -0.473
P = (0.103)
10 years bond yield 10 -0.287
P = (0.421)
Note: Correlation is significant at the *0.1, **0.01 and ***0.001 level
TABLE 4.6: Multiple Regression Analysis of Portfolio
Portfolio
Model
1year bond
yield
10years bond
yield
Constant
5.396*
t = 2.480
(0.035)
13.778**
t = 1.877
(0.103)
Sovereign Ranking
-0.268**
t = -2.909
(0.017)
-0.546*
t = -1.650
(0.143)
Inflation rate
0.798**
t = 3.968
(0.003)
0.224
t = 0.4
(0.701)
R 0.984 0.820
R Square 0.968 0.673
Adjusted R Square 0.961 0.579
Durbin-Watson 1.703 2.099
VIF 5.976 3.59
F 135.262
(0.000)
7.189
(0.020)
Note: Significant at the *0.1, **0.01 and ***0.001 level
TABLE 4.7: Hypothesis Testing Results
Hypothesis Variables Portfolio
Analysis
H1 Sovereign ratings and Bond yields Supported
H2 Inflation rate and Bond yields Supported
H3 Sovereign ratings and Inflation adjusted
bond yields Not supported