Embed Size (px)
Citation preview
Effect of Size and Shape of PDC Cutter on Wear Rate
in Multi Layer Formation
By
Kong Kai Vern
14738
Dissertation submitted in partial fulfillment of
the requirements for the
Bachelor of Engineering (Hons)
(MECHANICAL ENGINEERING)
JANUARY 2015
Universiti Teknologi PETRONAS
32610 Bandar Seri Iskandar
Perak Darul Ridzuan
brought to you by COREView metadata, citation and similar papers at core.ac.uk
provided by UTPedia
CERTIFICATION OF APPROVAL
EFFECT OF SIZE AND SHAPE OF PDC CUTTER ON WEAR RATE
IN MULTI LAYER FORMATION
By
Kong Kai Vern
A project dissertation submitted to the
Mechanical Engineering Programme
Universiti Teknologi PETRONAS
in partial fulfilment of the requirement for the
BACHELOR OF ENGINEERING (Hons)
(MECHANICAL ENGINEERING)
Approved by,
________________________________
(AP Dr Ahmad Majdi Bin Abdul Rani)
Universiti Teknologi PETRONAS
32610 Bandar Seri Iskandar,
Perak Darul Ridzuan, Malaysia.
January 2015
CERTIFICATION OF ORIGINALITY
This is to certify that I am responsible for the work submitted in this project, that the
original work is my own except as specified in the references and acknowledgements, and
that the original work contained herein have not been undertaken or done by unspecified
sources or persons.
____________
Kong Kai Vern
ACKNOWLEDGEMENT
An endeavour over a period can be successful only with the advice and support of well-
wishers. The author would like to take this opportunity to express his profound gratitude to
Universiti Teknologi PETRONAS for providing the platform for the research project to be
conducted.
The author also take this opportunity to express a deep sense of gratitude and regards to
his supervisor, AP Dr Ahmad Majdi Abdul Rani, Senior Lecturer, Mechanical
Engineering, Universiti Teknologi PETRONAS, for his cordial support, valuable
information and exemplary guidance, which help the author in completing the final year
project. The blessing, help and guidance given by him time to time shall carry the author
a long way in the journey of life on which the author about to embark.
The gratitude also goes to Dr Shahrul Kamaruddin and Dr Abdul Rahim Othman for
their guidance in doing the simulation in ABAQUS software and supervision in completing
the project. A big contribution and hard worked from them during project progress is very
great indeed.
Last but not least, the author would like to his parents and friends for their
constant encouragement without which this report would not be possible.
i
Abstract
During a normal drilling operation, the rate of penetration (ROP) often over focused while
the wear rate is less taken care of. However, wear rate is a more severe problem faced in
a long run drilling operation in multi-layer formation rather than focusing solely on the
ROP. The project is to investigate the effect of Polycrystalline Diamond Compact (PDC)
bit design features on the bit wear rate during the operation in multi-layer formation, which
is sandstone formation and dolomite formation. The bit design features studied in the
project is the shape of the cutters and the size of the cutters. The effect of drilling fluid is
assumed to be optimum. Using ABAQUS, models with different shape of cutter and size
of cutter are simulated and compared. Results are analyzed and compared to study the
effects on wear rate and select the best model which has minimum wear rate. Result
showed that 16mm size cutter and cone shape cutter are best design to minimize the cutter
wear compared to other size and shape of cutter used in the project.
ii
Table of Contents
Abstract ............................................................................................................................... i
Table of Contents ............................................................................................................... ii
List of Figures ................................................................................................................... iv
List of Tables...................................................................................................................... v
Chapter 1: Introduction
1.1. Background of Study .............................................................................. 1
1.2. Problem Statement ................................................................................. 2
1.3. Objective ................................................................................................ 2
1.4. Scope of Study ........................................................................................ 3
Chapter 2: Literature Review
2.1. Bit Wear .................................................................................................. 4
2.2. Multi Layer Formation ........................................................................... 6
2.3. Bit Design Parameters ............................................................................ 8
2.4. Cutter-rock Interaction Modeling ......................................................... 12
2.5. Merchant’s Model of Orthogonal Cutting ............................................ 14
2.6. Stress Analysis ...................................................................................... 17
2.7. Wear Model .......................................................................................... 19

iii
Chapter 3: Methodology
3.1. Framework ............................................................................................ 20
3.2. Reverse Engineering ............................................................................. 22
3.3. 3D Scanning ......................................................................................... 23
3.4. Parameters ............................................................................................ 24
3.5. Design Features .................................................................................... 28
3.6. Gantt Chart and Key Milestone ............................................................ 29
Chapter 4: Result and Discussion
4.1. PDC Single Cutter Test ........................................................................ 31
4.2. PDC Cutter Wear .................................................................................. 49
Chapter 5: Conclusion and Recommendations
5.1. Conclusion ............................................................................................ 51
5.2. Recommendation .................................................................................. 51
References ........................................................................................................................ 52
iv
List of Figures
FIGURE 1.1 PDC bit 1
FIGURE 2.1 Common bit wear 4
FIGURE 2.2 Multi layer formation 6
FIGURE 2.3 Matrix body bit (left) & Steel body bit (right) 9
FIGURE 2.4 Sample of different shape of cutters 9
FIGURE 2.5 Series of cutter size 10
FIGURE 2.6 Back-up cutter 11
FIGURE 2.7 Merchant’s circle diagram 15
FIGURE 3.1 Research Methodology 20,21
FIGURE 3.2 VIUscan Scanner, Clould Model display and dull PDC drill
bit
(left to right)
23
FIGURE 3.3 a(i) 8mm bit cutter. a(ii) 13mm bit cutter. a(iii) 16mm bit cutter.
b(i) standard shape cutter. b(ii) curve shape cutter. b(iii) cone
shape cutter.
28
FIGURE 4.1 Effect on Size of Cutter on Shear Stress (Analytical) 33
FIGURE 4.2 Effect on Shape of Cutter on Shear Stress (Analytical) 35
FIGURE 4.3 Graph of Stress vs Time for Different Size of Cutter
(Sandstone Formation) 39
FIGURE 4.4 Graph of Stress vs Time for Different Size of Cutter
(Dolomite Formation) 39
FIGURE 4.5 Effect on Size of Cutter on Shear Stress (Simulation) 40
FIGURE 4.6 Comparison of Stress Values for Different Size of Cutter 41
FIGURE 4.7 Graph of Stress vs Time for Different Shape of Cutter
(Sandstone Formation) 45
FIGURE 4.8 Graph of Stress vs Time for Different Shape of Cutter
(Dolomite Formation) 45
FIGURE 4.9 Effect on Shape of Cutter on Shear Stress (Simulation) 46
FIGURE 4.10 Comparison of Stress Values for Different Shape of Cutter 48
v
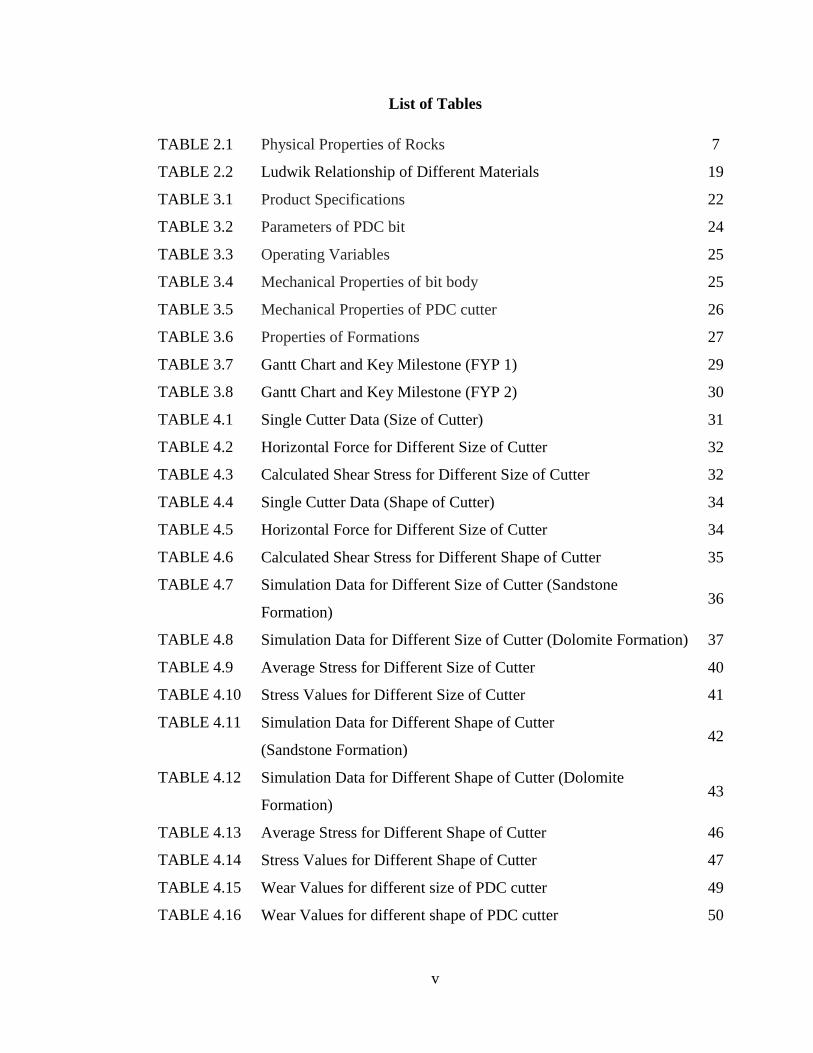
List of Tables
TABLE 2.1 Physical Properties of Rocks 7
TABLE 2.2 Ludwik Relationship of Different Materials 19
TABLE 3.1 Product Specifications 22
TABLE 3.2 Parameters of PDC bit 24
TABLE 3.3 Operating Variables 25
TABLE 3.4 Mechanical Properties of bit body 25
TABLE 3.5 Mechanical Properties of PDC cutter 26
TABLE 3.6 Properties of Formations 27
TABLE 3.7 Gantt Chart and Key Milestone (FYP 1) 29
TABLE 3.8 Gantt Chart and Key Milestone (FYP 2) 30
TABLE 4.1 Single Cutter Data (Size of Cutter) 31
TABLE 4.2 Horizontal Force for Different Size of Cutter 32
TABLE 4.3 Calculated Shear Stress for Different Size of Cutter 32
TABLE 4.4 Single Cutter Data (Shape of Cutter) 34
TABLE 4.5 Horizontal Force for Different Size of Cutter 34
TABLE 4.6 Calculated Shear Stress for Different Shape of Cutter 35
TABLE 4.7 Simulation Data for Different Size of Cutter (Sandstone
Formation) 36
TABLE 4.8 Simulation Data for Different Size of Cutter (Dolomite Formation) 37
TABLE 4.9 Average Stress for Different Size of Cutter 40
TABLE 4.10 Stress Values for Different Size of Cutter 41
TABLE 4.11 Simulation Data for Different Shape of Cutter
(Sandstone Formation) 42
TABLE 4.12 Simulation Data for Different Shape of Cutter (Dolomite
Formation) 43
TABLE 4.13 Average Stress for Different Shape of Cutter 46
TABLE 4.14 Stress Values for Different Shape of Cutter 47
TABLE 4.15 Wear Values for different size of PDC cutter 49
TABLE 4.16 Wear Values for different shape of PDC cutter 50
1
Chapter 1
Introduction
1.1. Background
Drilling is an important operation in oil and gas industry. Polycrystalline Diamond
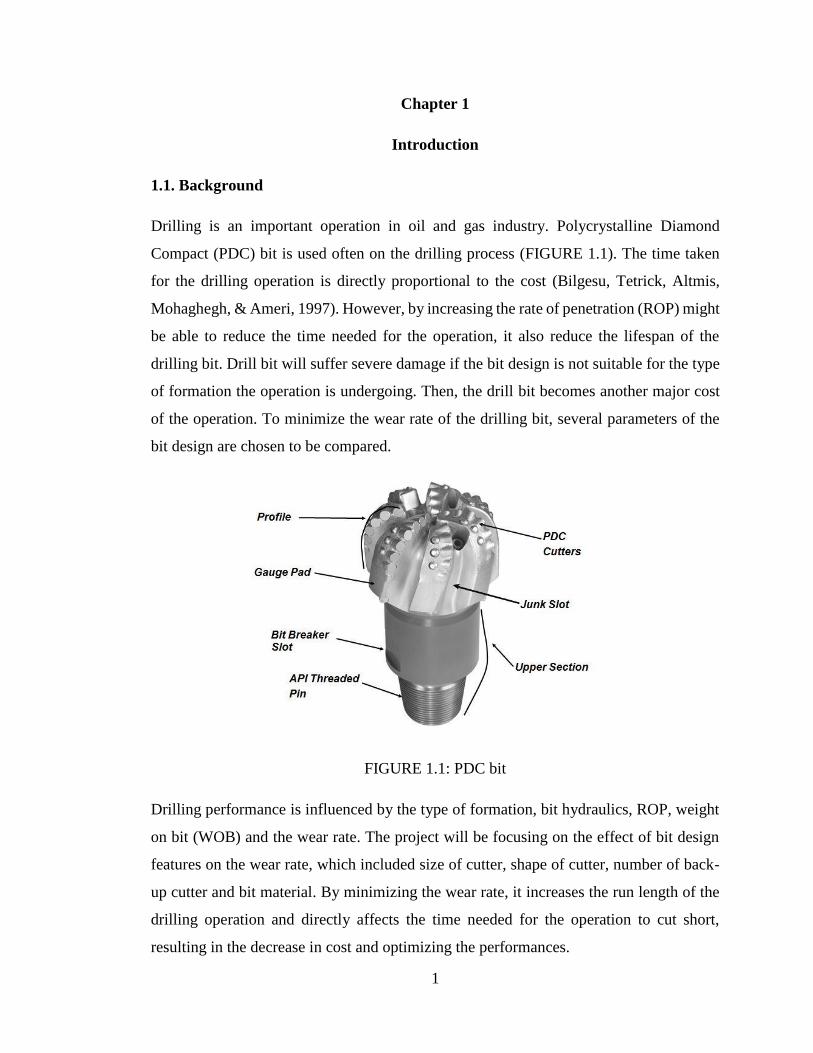
Compact (PDC) bit is used often on the drilling process (FIGURE 1.1). The time taken
for the drilling operation is directly proportional to the cost (Bilgesu, Tetrick, Altmis,
Mohaghegh, & Ameri, 1997). However, by increasing the rate of penetration (ROP) might
be able to reduce the time needed for the operation, it also reduce the lifespan of the
drilling bit. Drill bit will suffer severe damage if the bit design is not suitable for the type
of formation the operation is undergoing. Then, the drill bit becomes another major cost
of the operation. To minimize the wear rate of the drilling bit, several parameters of the
bit design are chosen to be compared.
FIGURE 1.1: PDC bit
Drilling performance is influenced by the type of formation, bit hydraulics, ROP, weight
on bit (WOB) and the wear rate. The project will be focusing on the effect of bit design
features on the wear rate, which included size of cutter, shape of cutter, number of back-
up cutter and bit material. By minimizing the wear rate, it increases the run length of the
drilling operation and directly affects the time needed for the operation to cut short,
resulting in the decrease in cost and optimizing the performances.
2
1.2. Problem Statement
During the drilling operation, ROP is commonly used for rating the drilling performance.
However, as mentioned before, to reduce cost or optimize the drilling performance,
maximizing the ROP is not the only way. Sometime, run length is more preferable
especially in the drilling operation of multi layer formation. When the drill bit is worn out,
the team will need to bring the drill bit all the way up and change it. This consumed a lot
of time. Moreover, when the drill bit is worn out but the drilling operation is still carried
on, the connection between the drill bit and bottom hole assembly (BHA) tools might
break and the team will need to fish the broken drill bit out before the drilling operation
can be continued. Another issue is, if the parts are not able to fish out, the team will need
to recalculate a new route which can avoid the particular spot. In the end, all of these
consumed a lot of unnecessary time. This project is to assist in this problem by obtaining
a bit design which allow minimal wear rate to occur by altering the size and shape of the
cutters. Thus, preventing the lost of time and increase the run length of the drill bit.
1.3. Objectives
This research is to study how the PDC bit can be worn during the process of drilling and
using what size and shape of cutters are able to successfully reduce its wear rate. Different
types of PDC bit design are simulated to get a relatively better design with minimum wear
rate. Thus, the objectives of this research are:
To understand the PDC cutter through analytical model.
To simulate the effect of the size and shape of cutter on the stress distribution.
To establish the relationship between stress and wear using wear equation.
To determine the best size and shape of cutter for multi-layer formation.
3
1.4. Scope of Study
The research relates overall to compare different type of combinations of bit design to
deduce a best design in minimizing the wear rate of the bit. Due to the limitation of time
frame and software, the bit design used in the research limit to size and shape of the cutter.
PDC bit design is chosen as this type of cutter is most commonly used in the oil and gas
industry for hard formation. The drilling fluid assumed to be functioning well and
effective cleaning thus can be ignored in the drilling operation. The multi-layer formation
properties chosen in this project is sandstone which represents the relatively soft formation
and dolomite which represents the hard formation. These two formations are chosen as
they are categorized in the sedimentary rocks which are more common in the drilling
operation.
Chapter 2
4
Literature Review
2.1. Bit Wear
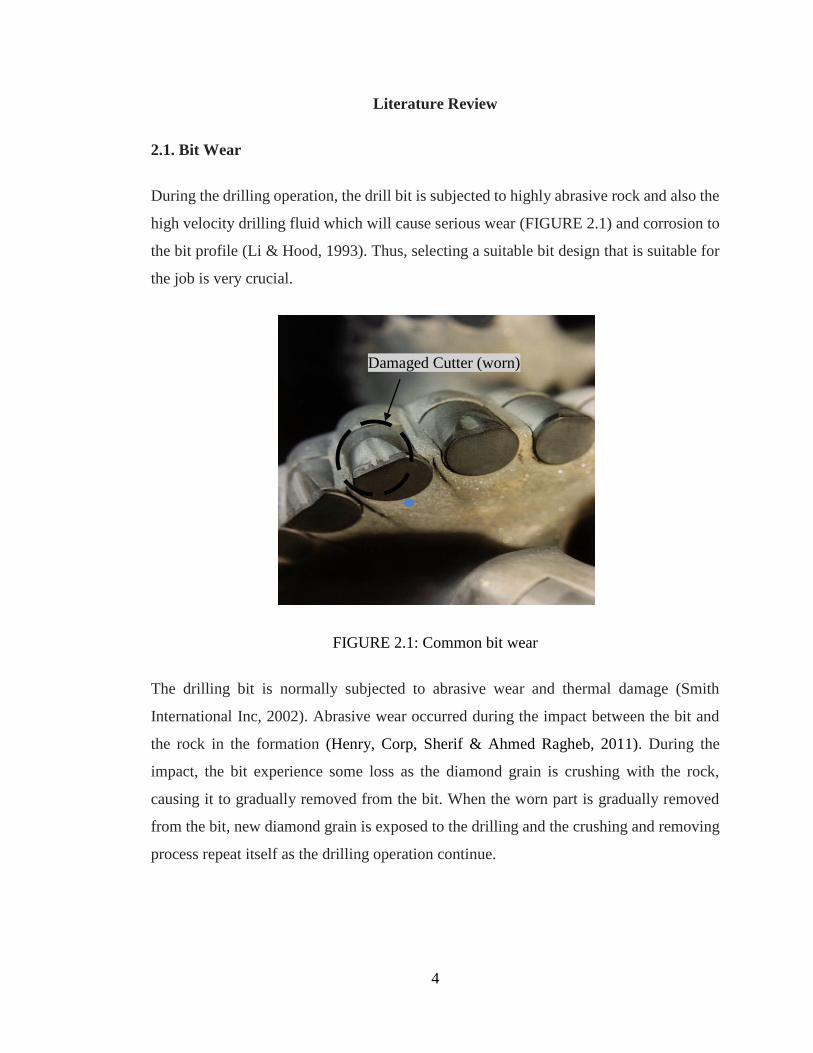
During the drilling operation, the drill bit is subjected to highly abrasive rock and also the
high velocity drilling fluid which will cause serious wear (FIGURE 2.1) and corrosion to
the bit profile (Li & Hood, 1993). Thus, selecting a suitable bit design that is suitable for
the job is very crucial.
FIGURE 2.1: Common bit wear
The drilling bit is normally subjected to abrasive wear and thermal damage (Smith
International Inc, 2002). Abrasive wear occurred during the impact between the bit and
the rock in the formation (Henry, Corp, Sherif & Ahmed Ragheb, 2011). During the
impact, the bit experience some loss as the diamond grain is crushing with the rock,
causing it to gradually removed from the bit. When the worn part is gradually removed
from the bit, new diamond grain is exposed to the drilling and the crushing and removing
process repeat itself as the drilling operation continue.
Damaged Cutter (worn)
5
Abrasive wear in soft formation is minimal, however, when the formation consist of hard
stingers, or when the hardness of the formation increased, the wear rate become more and
more severe (Yahiaoui, Gerbaud, Paris, Denape, & Dourfaye, 2012). The higher the
different between the bit and the formation will cause a more severe wear rate to the bit
(Cheatham & Loeb, 1985).
While for thermal damage, when the temperature continues to rise and over pass 662
Fahrenheit, the unfavorable stress condition begin to occur in the bit. When the
temperature increased, the hardness of the PDC bit decreased. Research have shown that
the hardness of the PDC bit decrease for more than 65% when the temperature arose near
to 1300 Fahrenheit, when compared to its hardness during room temperature. This further
increase the abrasive wear as the difference in hardness of the bit and the formation
hardness will directly affect the wear rate of the bit (Glowka, & Stone, 1986).
6
2.2. Multi Layer Formation
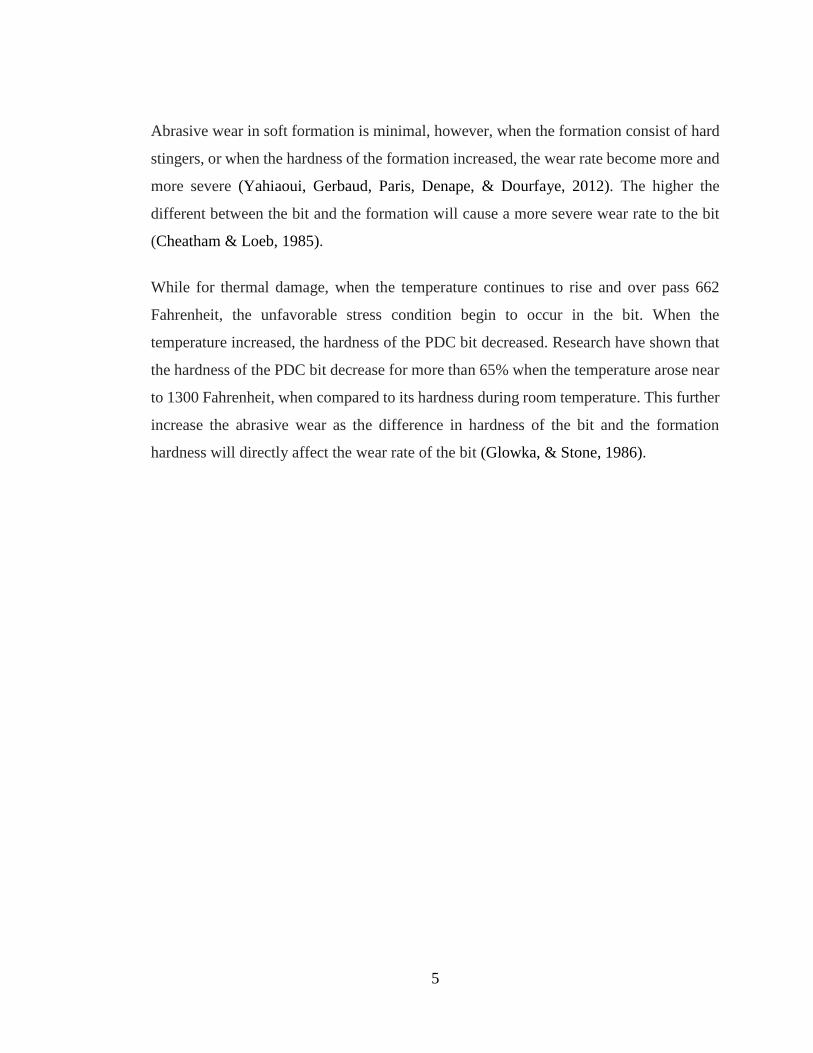
Multi layer formation is defined as different types of formation interbedded with another
types of formation (FIGURE 2.2). In multi layer formation, the hardness of the formation
is always changing (Muhammad Hariz, 2014); it might change from a soft formation and
then drastically to a hard formation due to the content and properties of the formation.
FIGURE 2.2: Multi layer formation
Drilling operation in multi layer formation often takes many trip of drilling as the drill bit
has worn out and cause the drilling performance to be undesirable (Hareland, Nygaard &
Wise, 2009). During the changing of new drill bit, it uses up a lot of time and this increase
the cost of the operation. Meanwhile, this might not only occurred once as if the drilling
performance becomes undesirable again or is still undesirable, the drill bit is needed to be
taken off and on several times until the case is solved. In this case, it is very important for
the selection of a suitable drilling bit to optimize in the run length of the drilling bit rather
than only focusing on the penetration rate.
7
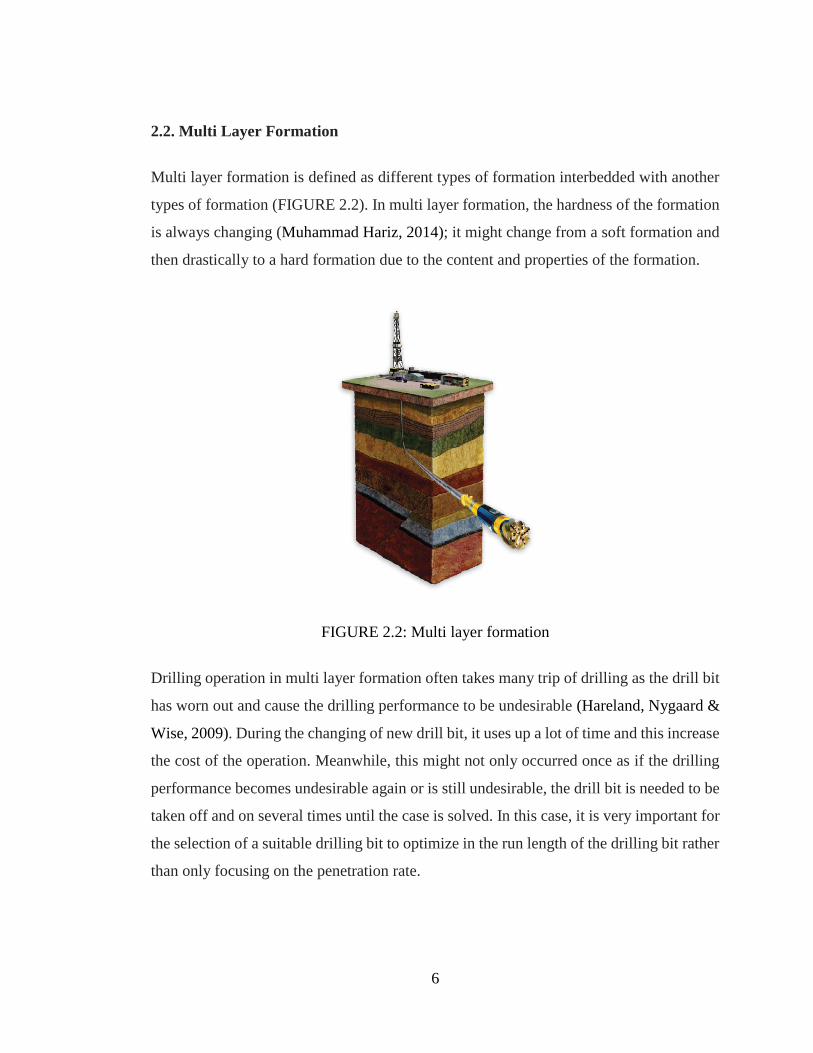
TABLE 2.1: Physical Properties of Rocks
TABLE 2.1 shows a list of rocks in different type of rock formations. The main 3 types
of rock formation here are igneous formation, sedimentary formation and metamorphic
formation. Igneous formation is associated with volcanoes and form at plate boundaries.
The rock is formed by molten rock or magma. When the molten rock passes through a
cooler region, it cooled up and hardened by going through a process known as fractional
crystallization. The formation of igneous formation is fast, while the sedimentary
formation needs thousand years to form. Sedimentary rock is formed under the sea bed
and layer by layer with the remains of living things, mud, sand, and etc. when the sediment
becomes so dense, it undergoes a process called lithification and forms the formation. Last
is the metamorphic formation, which is formed when igneous and
8
sedimentary formations under immerse pressure and heat. The immerse pressure and heat
cause the rock to crystallize and form gemstones such as onyx, ruby, sapphire and
turquoise.
2.3. Bit Design Parameters
Bit design consists of several parameters, which included the bit profile, bit material, the
shape of the cutters, the size of the cutter, the number of back-up cutter, the back rake
angle, and gauge design.
The bit profiles that are common seen are double-cone design, parabolic design and
concave design. These three designs are normally used in the industry of oil and gas. In
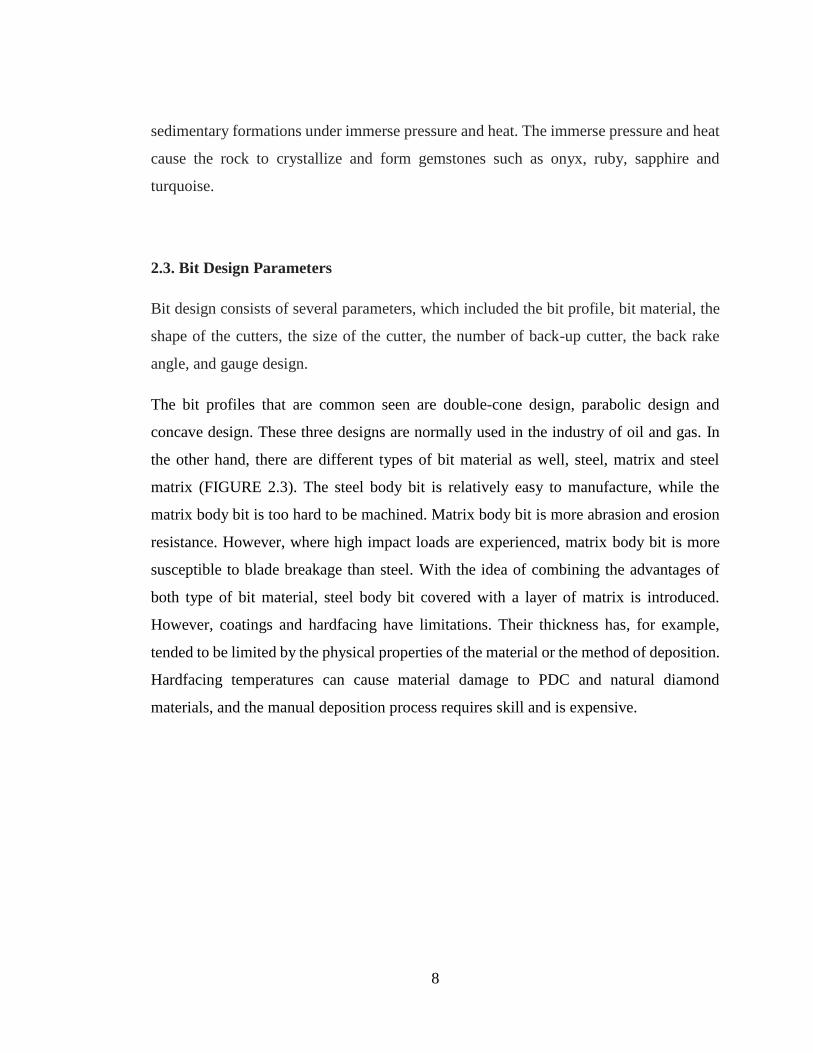
the other hand, there are different types of bit material as well, steel, matrix and steel
matrix (FIGURE 2.3). The steel body bit is relatively easy to manufacture, while the
matrix body bit is too hard to be machined. Matrix body bit is more abrasion and erosion
resistance. However, where high impact loads are experienced, matrix body bit is more
susceptible to blade breakage than steel. With the idea of combining the advantages of
both type of bit material, steel body bit covered with a layer of matrix is introduced.
However, coatings and hardfacing have limitations. Their thickness has, for example,
tended to be limited by the physical properties of the material or the method of deposition.
Hardfacing temperatures can cause material damage to PDC and natural diamond
materials, and the manual deposition process requires skill and is expensive.
9
FIGURE 2.3: Matrix body bit (left) & Steel body bit (right)
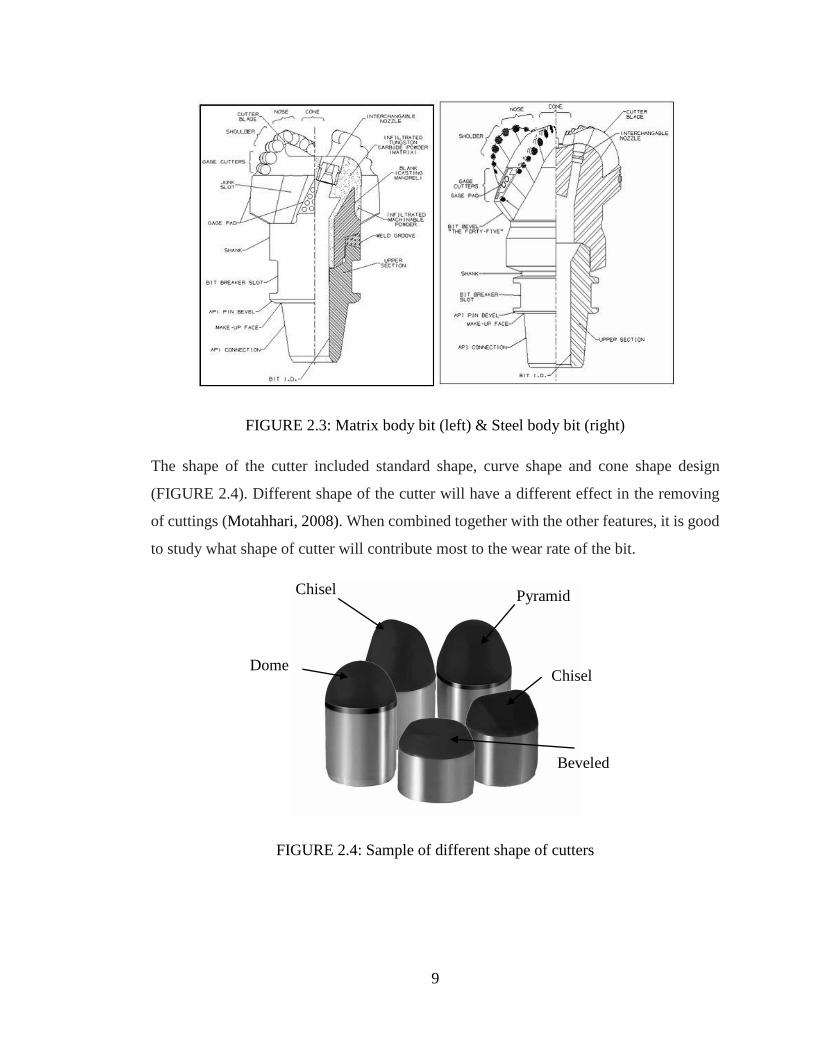
The shape of the cutter included standard shape, curve shape and cone shape design
(FIGURE 2.4). Different shape of the cutter will have a different effect in the removing
of cuttings (Motahhari, 2008). When combined together with the other features, it is good
to study what shape of cutter will contribute most to the wear rate of the bit.
FIGURE 2.4: Sample of different shape of cutters
Chisel
Dome
Beveled
Chisel
Pyramid
10
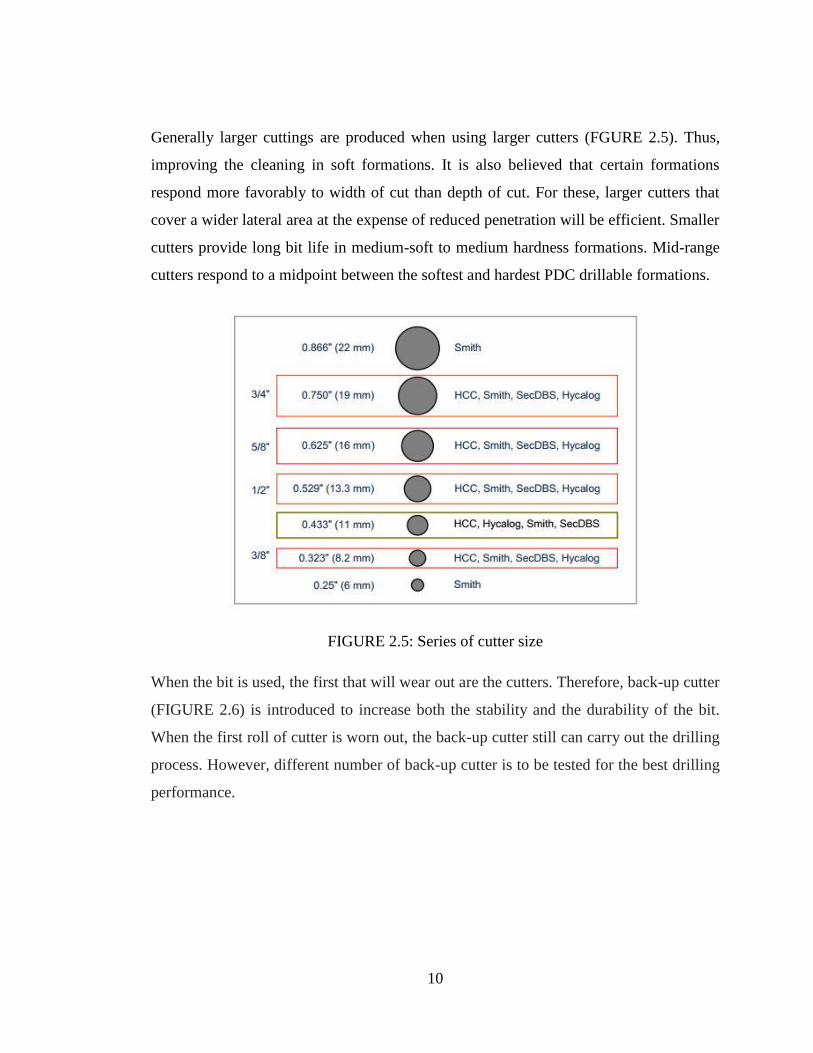
Generally larger cuttings are produced when using larger cutters (FGURE 2.5). Thus,
improving the cleaning in soft formations. It is also believed that certain formations
respond more favorably to width of cut than depth of cut. For these, larger cutters that
cover a wider lateral area at the expense of reduced penetration will be efficient. Smaller
cutters provide long bit life in medium-soft to medium hardness formations. Mid-range
cutters respond to a midpoint between the softest and hardest PDC drillable formations.
FIGURE 2.5: Series of cutter size
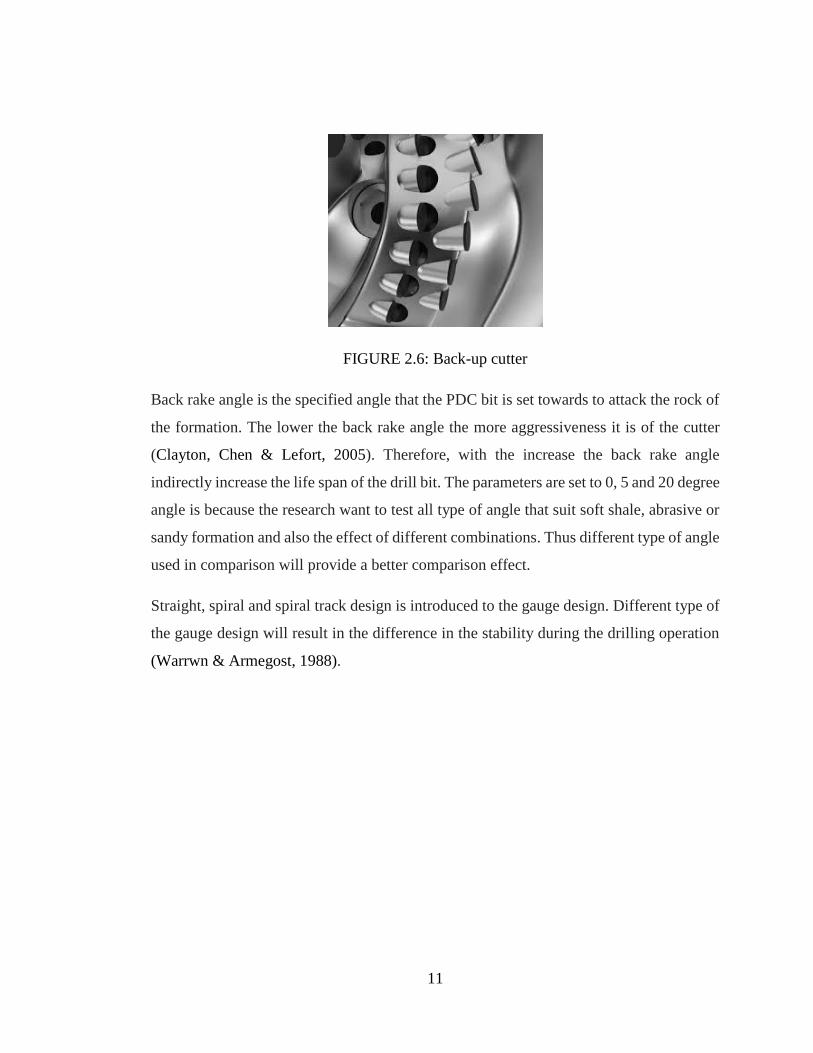
When the bit is used, the first that will wear out are the cutters. Therefore, back-up cutter
(FIGURE 2.6) is introduced to increase both the stability and the durability of the bit.
When the first roll of cutter is worn out, the back-up cutter still can carry out the drilling
process. However, different number of back-up cutter is to be tested for the best drilling
performance.
11
FIGURE 2.6: Back-up cutter
Back rake angle is the specified angle that the PDC bit is set towards to attack the rock of
the formation. The lower the back rake angle the more aggressiveness it is of the cutter
(Clayton, Chen & Lefort, 2005). Therefore, with the increase the back rake angle
indirectly increase the life span of the drill bit. The parameters are set to 0, 5 and 20 degree
angle is because the research want to test all type of angle that suit soft shale, abrasive or
sandy formation and also the effect of different combinations. Thus different type of angle
used in comparison will provide a better comparison effect.
Straight, spiral and spiral track design is introduced to the gauge design. Different type of
the gauge design will result in the difference in the stability during the drilling operation
(Warrwn & Armegost, 1988).
12
2.4. Cutter-rock Interaction Modeling
Using the 3D analytical model proposed by Rajabov, et al. (2012), the horizontal cutting
force of the PDC cutter can be known by providing the information on the back rake angle
and the coefficient of the rock formation.
The forces included in the equation are as following:
Cutting Force – Fc, acting perpendicular to the cutter surface
Friction Force, Ffc
Wear Force, Fw, acting perpendicular to the cutter wear flat at the bottom
Wear Frictional Force, Ffw
These forces above are the result of the shearing and friction between the PDC cutter
and the crushed rock. Therefore, by balancing the external force on the cutter, the
equation below is obtained.
FH = FC cos α cos β − Ffc sin α cos β + Ffw
FS = FC cos α sin β − Ffc sin α sin β
FN = FC sin α − Ffc cos α + Fw
Where FH is the horizontal force, FS is the shearing force, FN is the normal force, α is
the back rake angle and β is the side rake angle, and
Fc = RcAc, Ffc = μFc = μRcAc
Fw = RpAw, Ffw = μFw = μRpAw
Rc and Rp are the rock resistance to shearing and rock compressive strength in pounds
per square inch (psi) respectively while Ac and Aw are the contact area between cutter
and rock, and cutter wear area.
13
Substituting the values of Ffc and Ffw from equation to equation, the equation can be
yielded respectively:
Fc − μFc tan α = FH − μFW
cos α cos β
Fc − μFc tan α = FS
cos α sin β
Fc + μFc cot α = FN − FW
sin α
From equation, μFc can be obtained
μFc = FN − FW
cos α− Fc tan α
By substituting and rearranging the equation, following is obtained:
Fc =FH + FN tan α cos β − FW(μ + tan α cos β)
cos α cos β (1 + tan2 α)
The equation is then further simplified by assuming the cutter is new, thus the wear
force is negligible.
Fc =FH + FN tan α cos β
cos α cos β (1 + tan2 α)
With the coefficient of friction known, the equation can be derived into the form:
Fc =FN
sin α − μcos α
14
And if there is no wear at the cutter, and substitute Fc from equation, the following is
obtained:
FH = FN cos β [1 − μ tan α
μ + tan α]
Equation shown above is the 3D analytical model that predicts the horizontal cutting
force if the normal force and coefficient of friction is known by considering the effect of
back rake and side rake angles. If the side rake angle ( β = 0), the equation is simplified
to 2D form:
FH = FN [1 − μ tan α
μ + tan α]
2.5. Merchant’s Model of Orthogonal Cutting
Merchant’s model is the first proposed by Dr Merchant to study the forces acting on a
tool during the process of metal cutting. By making an analysis of the process on a
qualitative basis, the Merchant’s model is formed to ease the study of the metal cutting
process and the forces relationship.
Several assumptions have been made when Dr Merchant found out the relationship for
the forces (Jain & Chitale, 2010):
The cutting edge of the tool is sharp and it does not make any flank contact with
the workpiece.
Only continuous chip without any built-up edge is produced.
The shear surface is a plane extending upward from the cutting edge.
The cutting edge is a straight line, extending perpendicular to the direction of
motion, and generates a plane surface as the work moves past it.
The chip does not flow to either side.
15
The cutting velocity remains constant.
The depth of cut is constant.
The width of the tool is greater than that of the workpiece.
The inertia force of the chip is entirely neglected.
The workpiece moves relative to the tool with uniform velocity.
The chip behaves as a free body in stable equilibrium under the action of two
equal, opposite and almost collinear resultant forces.
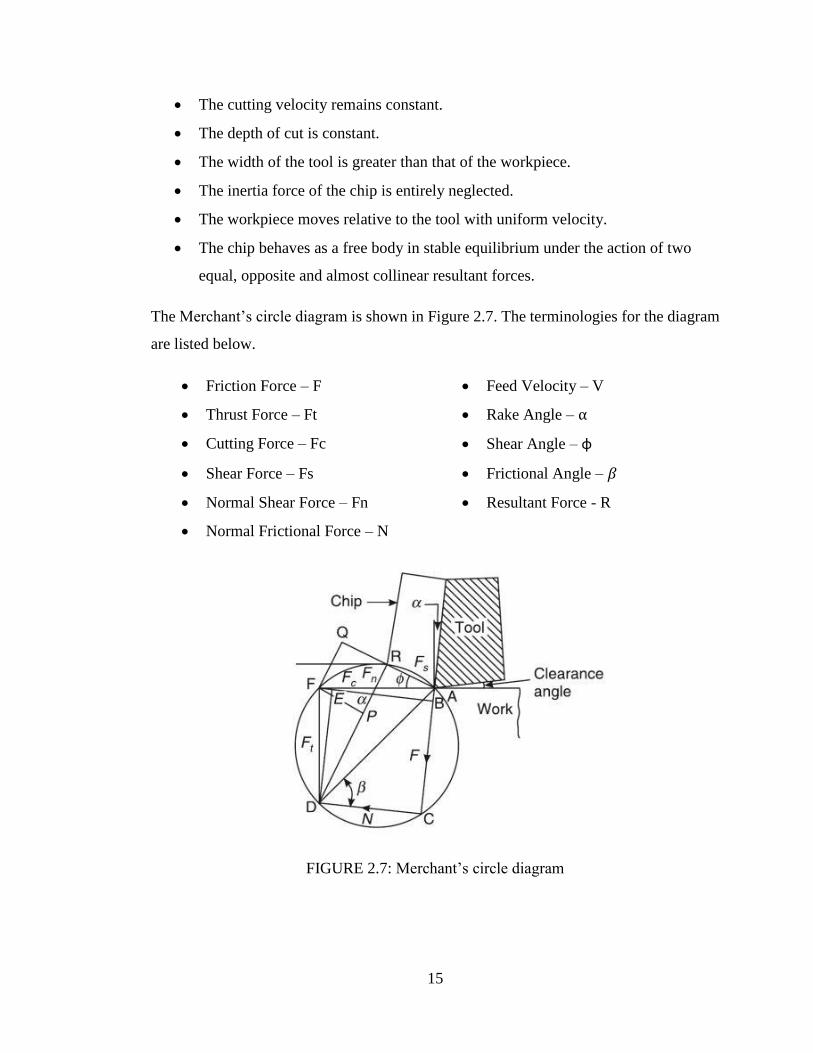
The Merchant’s circle diagram is shown in Figure 2.7. The terminologies for the diagram
are listed below.
Friction Force – F Feed Velocity – V
Thrust Force – Ft Rake Angle – α
Cutting Force – Fc Shear Angle – φ
Shear Force – Fs Frictional Angle – 𝛽
Normal Shear Force – Fn Resultant Force - R
Normal Frictional Force – N
FIGURE 2.7: Merchant’s circle diagram

16
By knowing the Fc, Fs, α, and φ, all other component forces can be calculated as:
F = FC sin α + Ft cos α
N = FC cos α − Ft sin α
The coefficient of friction will be then given as:
μ = F
N=
FC sin α + Ft cos α
FC cos α − Ft sin α
On shear plane,
F𝑠 = FC cos φ − Ft sin φ
F𝑛 = FC sin φ + Ft cos φ
Thus, the resultant force is derived as equation
R = √Fc2 + Ft
2 = √Fs2 + Fn
2 = √F2 + N2
The stress on the tool rake face can be obtained using the equation:
σ = Normal Frictional Force
Contact Area=
N
A
τ = Shear Force
Contact Area=
F
A
17
2.6. Stress Analysis
When a body is subjected to axial force and torsional force, axial stress and torsional
stress are produced.
Based on Hibbeler (2013), the axial stress, σ is obtained using equation :
σ =F
A
where F and A is the axial force and A is the loading area. The axial strain, ε can be
obtained using equation:
ε =σ
E
where E is the Young’s Modulus of the material of the body.
Torsion acting on a cylinder tends to twist it in the direction of the torque. The
assumptions are made for the body:
Plane sections remain plane after the torque is applied
The shear strain γ varies linearly in the radial direction
The material is linearly elastic, so that Hooke's law applies
The maximum shear stress (τmax) occurs in a circular body of radius due to the
application of torque is calculated using equation:
τ𝑚𝑎𝑥 =Tr
J
18
Where T is the torque, r is the radius of the body and J is the polar moment of inertia of
the cross sectional area.
The polar moment of inertia of the cross sectional area is:
J =π
2𝑟4
According to the maximum distortion energy criterion, the failure occurs when the
maximum shear stress (τyield) reaches √2σy
3 if the maximum shear stress theory is valid.
And the angle of twist, φ can be found by using:
φ =TL
GJ
where L is the length of the body and G is the shear modulus of the body material. This
value is dependent on the material properties.
19
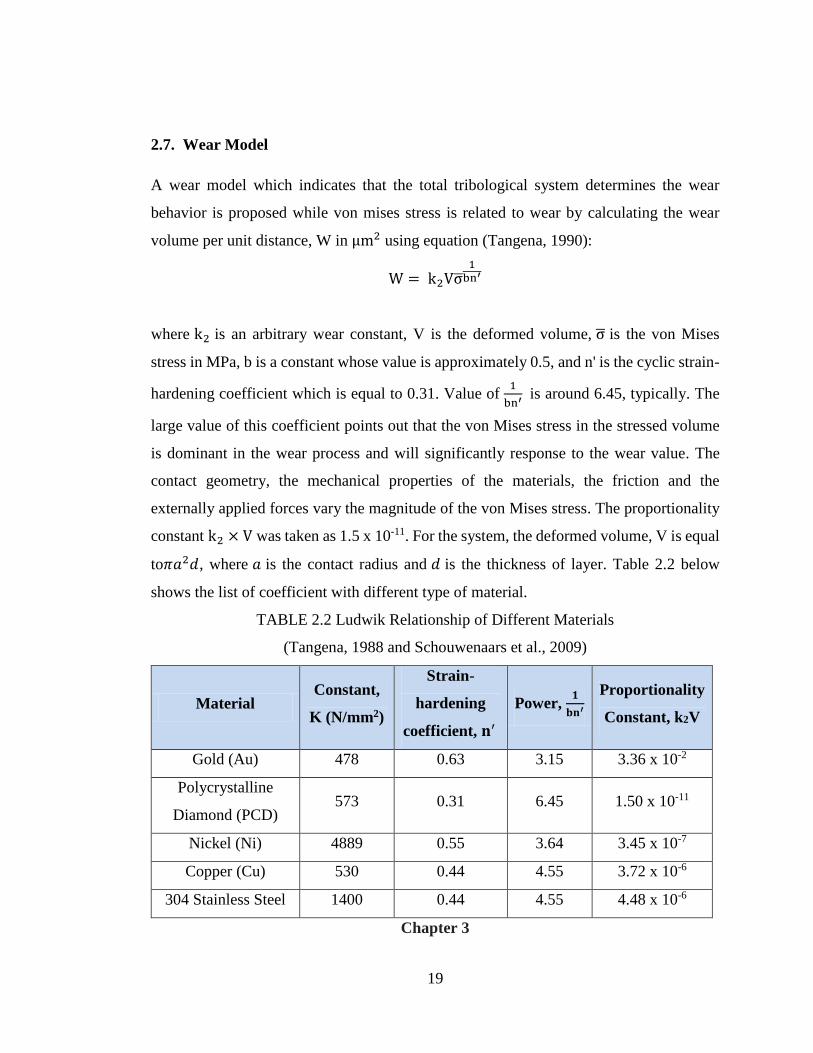
2.7. Wear Model
A wear model which indicates that the total tribological system determines the wear
behavior is proposed while von mises stress is related to wear by calculating the wear
volume per unit distance, W in μm2 using equation (Tangena, 1990):
W = k2Vσ̅1
bn′
where k2 is an arbitrary wear constant, V is the deformed volume, σ̅ is the von Mises
stress in MPa, b is a constant whose value is approximately 0.5, and n' is the cyclic strain-
hardening coefficient which is equal to 0.31. Value of 1
bn′ is around 6.45, typically. The
large value of this coefficient points out that the von Mises stress in the stressed volume
is dominant in the wear process and will significantly response to the wear value. The
contact geometry, the mechanical properties of the materials, the friction and the
externally applied forces vary the magnitude of the von Mises stress. The proportionality
constant k2 × V was taken as 1.5 x 10⁻¹¹. For the system, the deformed volume, V is equal
to𝜋𝑎2𝑑, where 𝑎 is the contact radius and 𝑑 is the thickness of layer. Table 2.2 below
shows the list of coefficient with different type of material.
TABLE 2.2 Ludwik Relationship of Different Materials
(Tangena, 1988 and Schouwenaars et al., 2009)
Material Constant,
K (N/mm2)
Strain-
hardening
coefficient, 𝐧′
Power, 𝟏
𝐛𝐧′ Proportionality
Constant, k2V
Gold (Au) 478 0.63 3.15 3.36 x 10⁻²
Polycrystalline
Diamond (PCD) 573 0.31 6.45 1.50 x 10⁻¹¹
Nickel (Ni) 4889 0.55 3.64 3.45 x 10⁻⁷
Copper (Cu) 530 0.44 4.55 3.72 x 10⁻⁶
304 Stainless Steel 1400 0.44 4.55 4.48 x 10⁻⁶
Chapter 3
20
Methodology
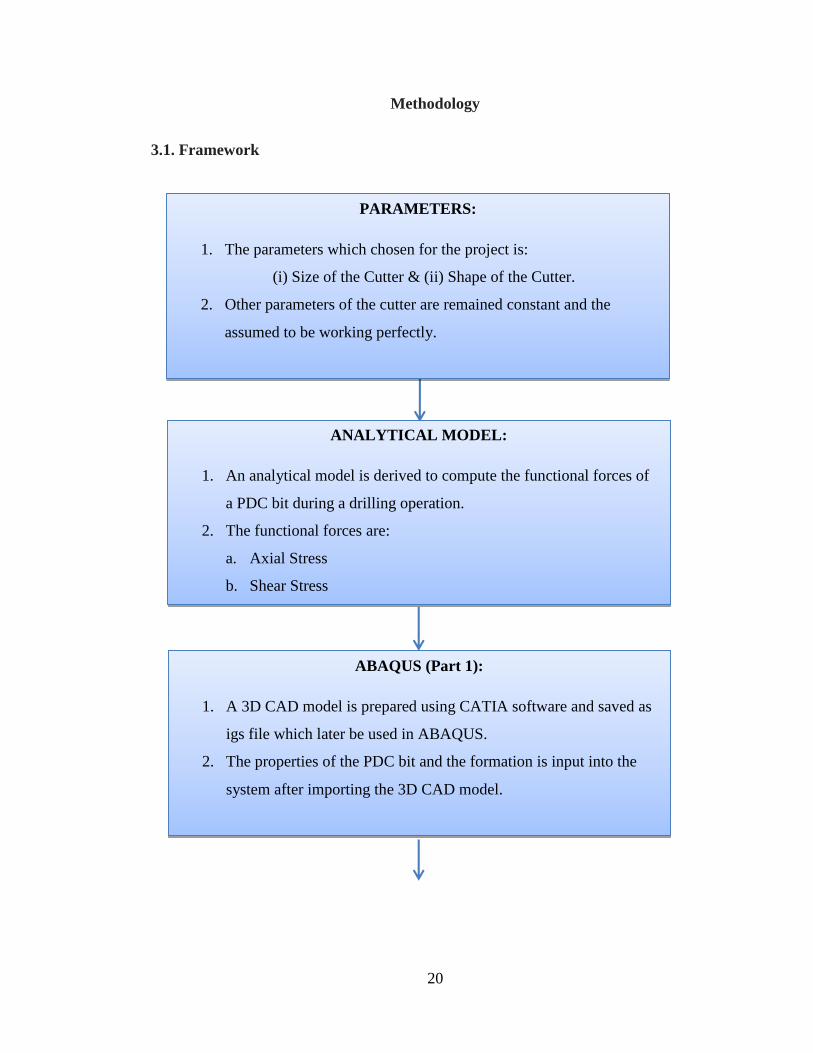
3.1. Framework
ABAQUS (Part 1):
1. A 3D CAD model is prepared using CATIA software and saved as
igs file which later be used in ABAQUS.
2. The properties of the PDC bit and the formation is input into the
system after importing the 3D CAD model.
ANALYTICAL MODEL:
1. An analytical model is derived to compute the functional forces of
a PDC bit during a drilling operation.
2. The functional forces are:
a. Axial Stress
b. Shear Stress
PARAMETERS:
1. The parameters which chosen for the project is:
(i) Size of the Cutter & (ii) Shape of the Cutter.
2. Other parameters of the cutter are remained constant and the
assumed to be working perfectly.
21
FIGURE 3.1: Research Methodology
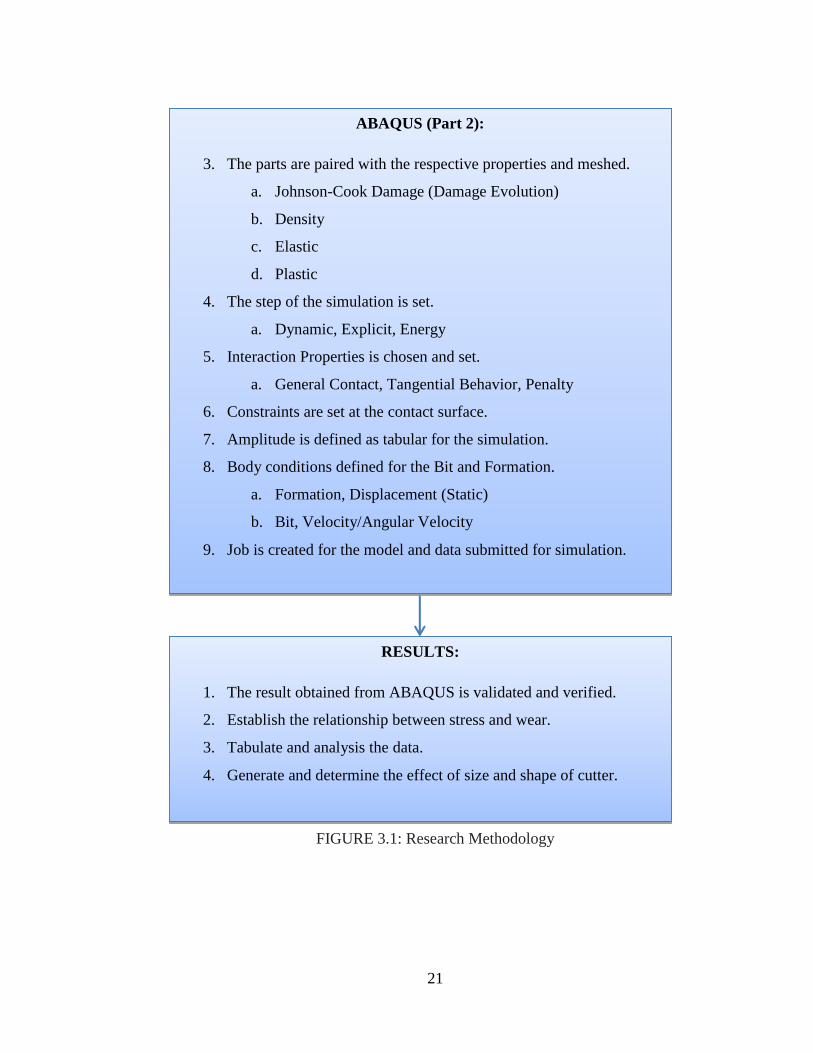
ABAQUS (Part 2):
3. The parts are paired with the respective properties and meshed.
a. Johnson-Cook Damage (Damage Evolution)
b. Density
c. Elastic
d. Plastic
4. The step of the simulation is set.
a. Dynamic, Explicit, Energy
5. Interaction Properties is chosen and set.
a. General Contact, Tangential Behavior, Penalty
6. Constraints are set at the contact surface.
7. Amplitude is defined as tabular for the simulation.
8. Body conditions defined for the Bit and Formation.
a. Formation, Displacement (Static)
b. Bit, Velocity/Angular Velocity
9. Job is created for the model and data submitted for simulation.
RESULTS:
1. The result obtained from ABAQUS is validated and verified.
2. Establish the relationship between stress and wear.
3. Tabulate and analysis the data.
4. Generate and determine the effect of size and shape of cutter.
22
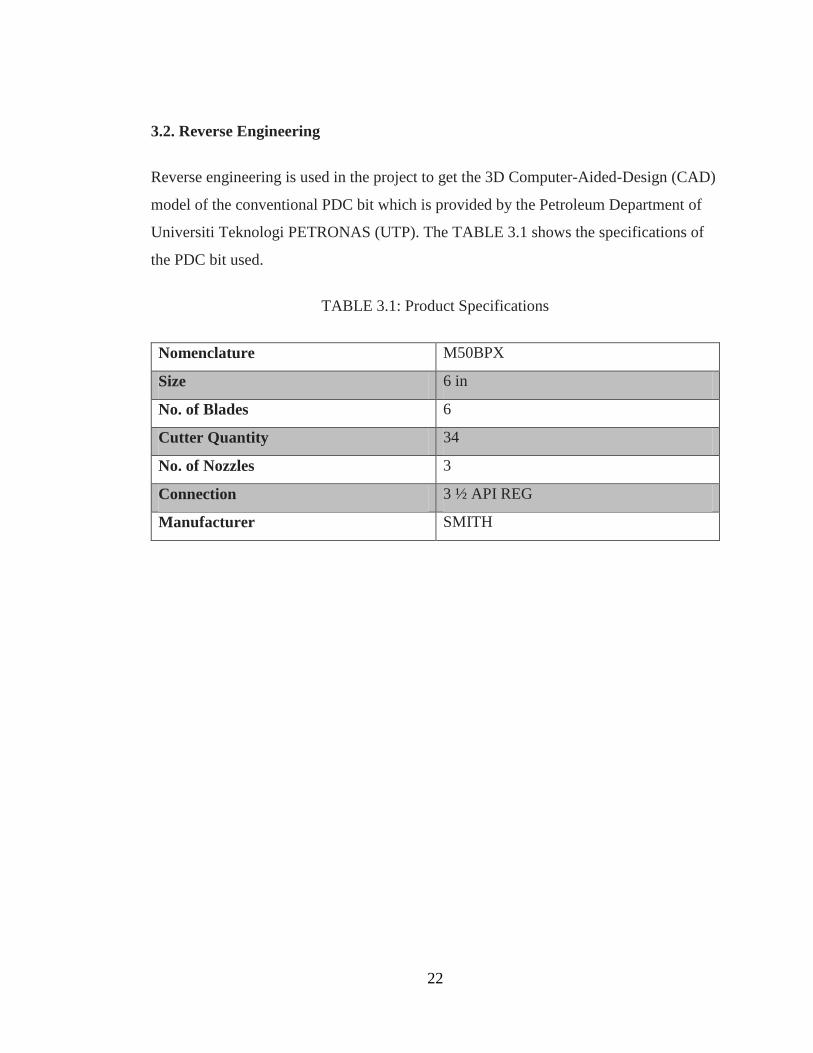
3.2. Reverse Engineering
Reverse engineering is used in the project to get the 3D Computer-Aided-Design (CAD)
model of the conventional PDC bit which is provided by the Petroleum Department of
Universiti Teknologi PETRONAS (UTP). The TABLE 3.1 shows the specifications of
the PDC bit used.
TABLE 3.1: Product Specifications
Nomenclature M50BPX
Size 6 in
No. of Blades 6
Cutter Quantity 34
No. of Nozzles 3
Connection 3 ½ API REG
Manufacturer SMITH
23
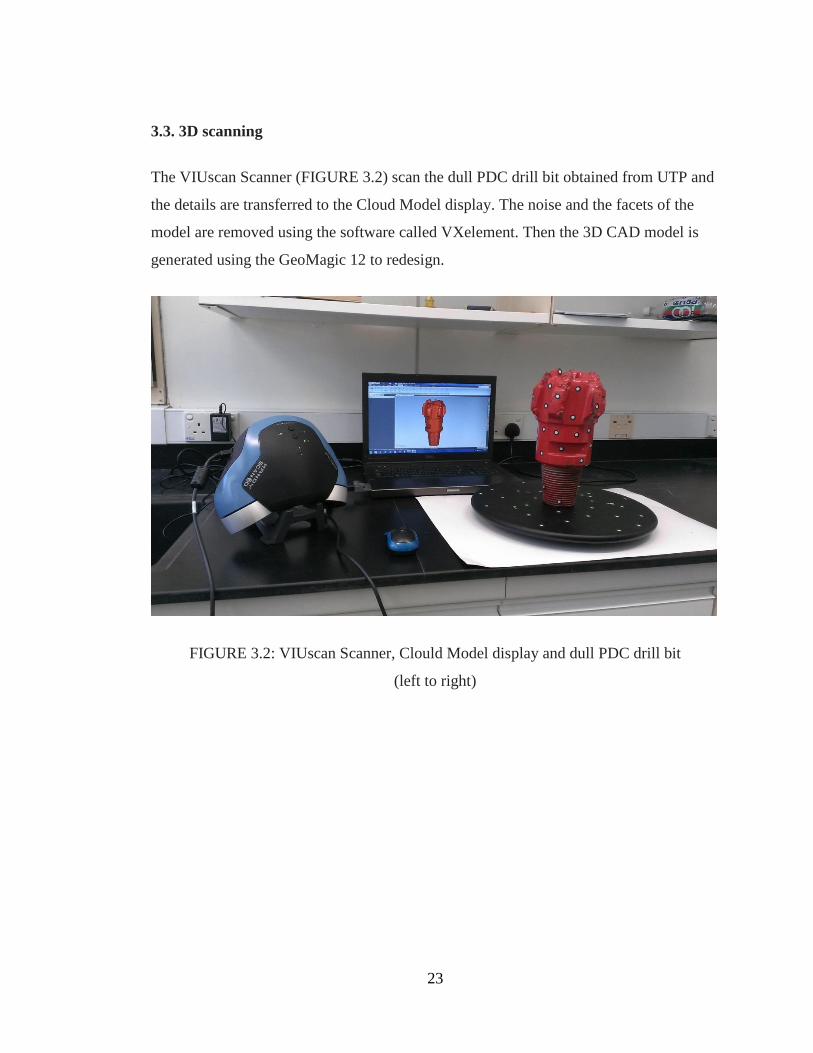
3.3. 3D scanning
The VIUscan Scanner (FIGURE 3.2) scan the dull PDC drill bit obtained from UTP and
the details are transferred to the Cloud Model display. The noise and the facets of the
model are removed using the software called VXelement. Then the 3D CAD model is
generated using the GeoMagic 12 to redesign.
FIGURE 3.2: VIUscan Scanner, Clould Model display and dull PDC drill bit
(left to right)
24
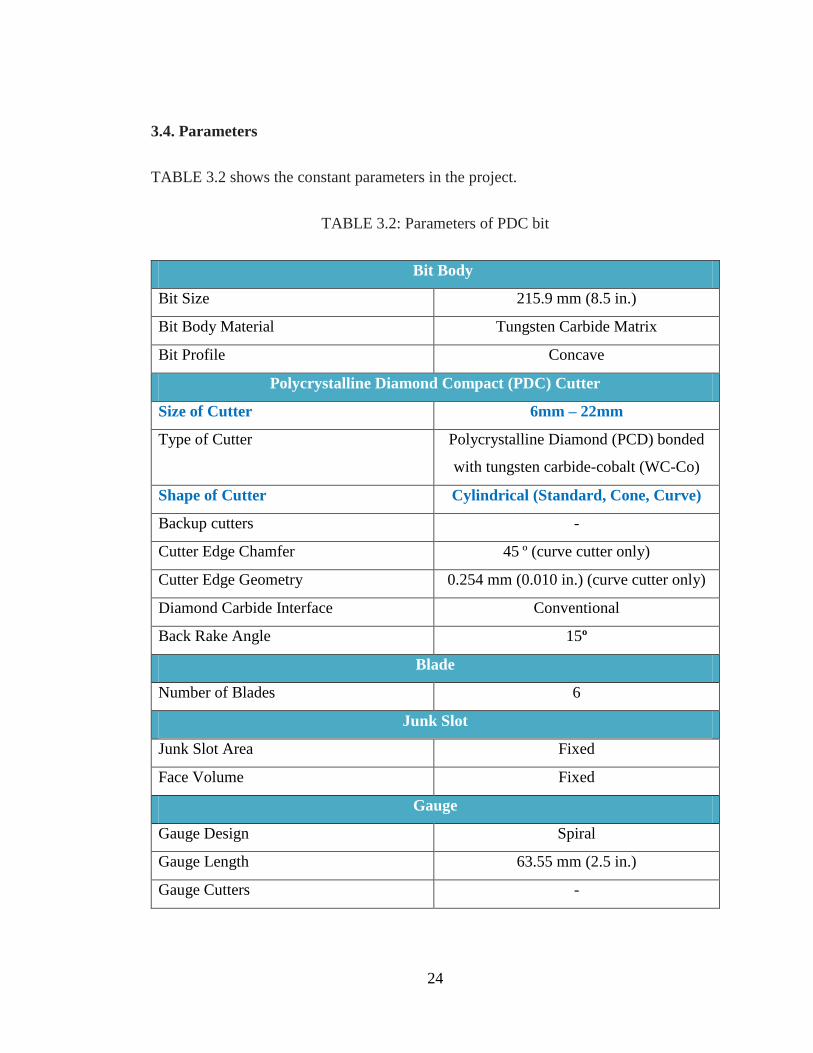
3.4. Parameters
TABLE 3.2 shows the constant parameters in the project.
TABLE 3.2: Parameters of PDC bit
Bit Body
Bit Size 215.9 mm (8.5 in.)
Bit Body Material Tungsten Carbide Matrix
Bit Profile Concave
Polycrystalline Diamond Compact (PDC) Cutter
Size of Cutter 6mm – 22mm
Type of Cutter Polycrystalline Diamond (PCD) bonded
with tungsten carbide-cobalt (WC-Co)
Shape of Cutter Cylindrical (Standard, Cone, Curve)
Backup cutters -
Cutter Edge Chamfer 45 º (curve cutter only)
Cutter Edge Geometry 0.254 mm (0.010 in.) (curve cutter only)
Diamond Carbide Interface Conventional
Back Rake Angle 15º
Blade
Number of Blades 6
Junk Slot
Junk Slot Area Fixed
Face Volume Fixed
Gauge
Gauge Design Spiral
Gauge Length 63.55 mm (2.5 in.)
Gauge Cutters -
25
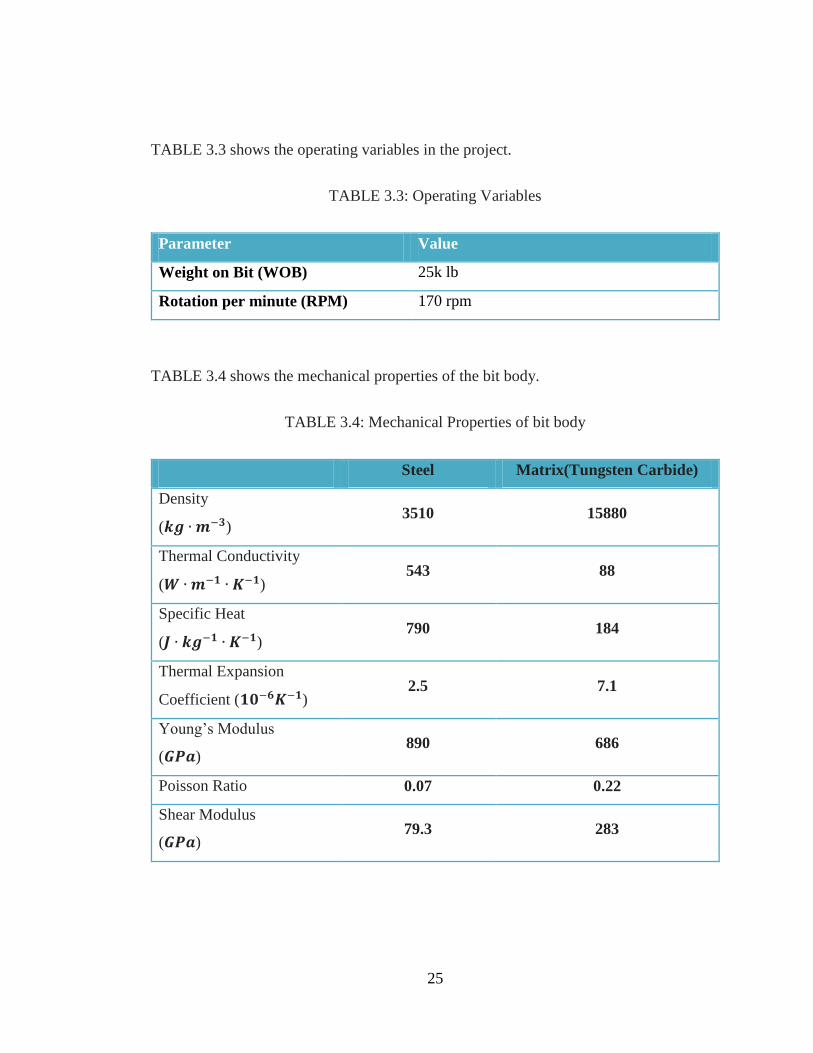
TABLE 3.3 shows the operating variables in the project.
TABLE 3.3: Operating Variables
Parameter Value
Weight on Bit (WOB) 25k lb
Rotation per minute (RPM) 170 rpm
TABLE 3.4 shows the mechanical properties of the bit body.
TABLE 3.4: Mechanical Properties of bit body
Steel Matrix(Tungsten Carbide)
Density
(𝒌𝒈 ∙ 𝒎−𝟑) 3510 15880
Thermal Conductivity
(𝑾 ∙ 𝒎−𝟏 ∙ 𝑲−𝟏) 543 88
Specific Heat
(𝑱 ∙ 𝒌𝒈−𝟏 ∙ 𝑲−𝟏) 790 184
Thermal Expansion
Coefficient (𝟏𝟎−𝟔𝑲−𝟏) 2.5 7.1
Young’s Modulus
(𝑮𝑷𝒂) 890 686
Poisson Ratio 0.07 0.22
Shear Modulus
(𝑮𝑷𝒂) 79.3 283
26
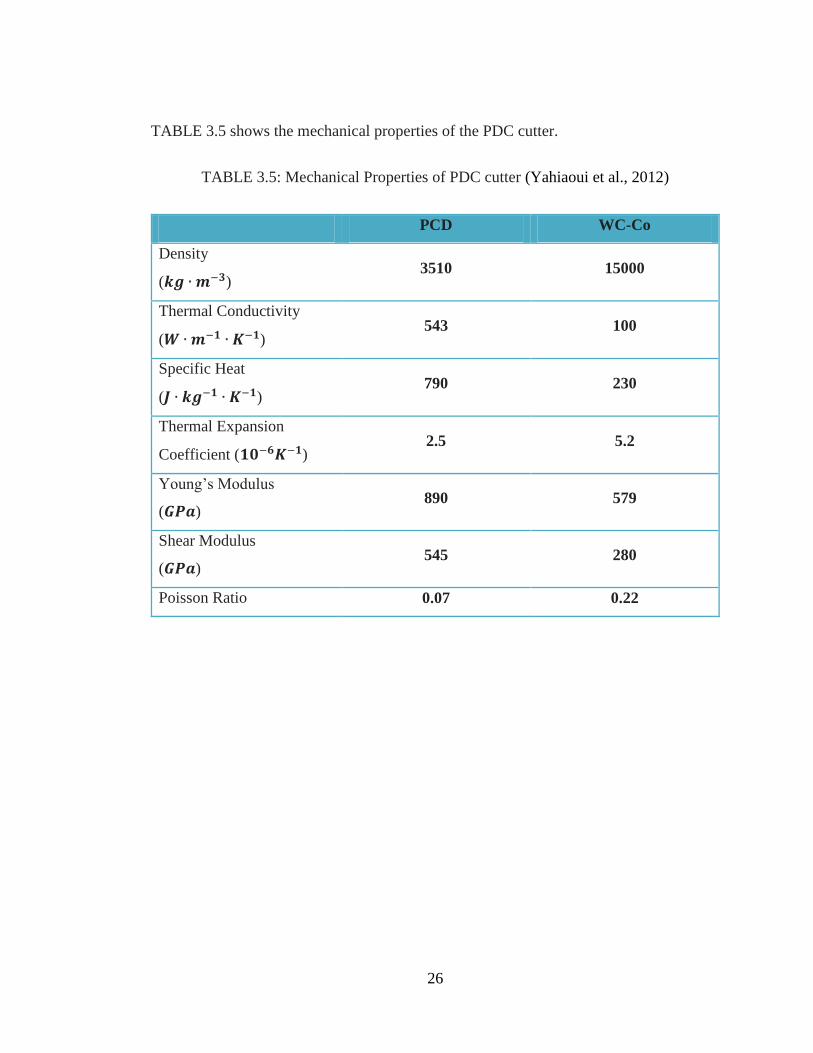
TABLE 3.5 shows the mechanical properties of the PDC cutter.
TABLE 3.5: Mechanical Properties of PDC cutter (Yahiaoui et al., 2012)
PCD WC-Co
Density
(𝒌𝒈 ∙ 𝒎−𝟑) 3510 15000
Thermal Conductivity
(𝑾 ∙ 𝒎−𝟏 ∙ 𝑲−𝟏) 543 100
Specific Heat
(𝑱 ∙ 𝒌𝒈−𝟏 ∙ 𝑲−𝟏) 790 230
Thermal Expansion
Coefficient (𝟏𝟎−𝟔𝑲−𝟏) 2.5 5.2
Young’s Modulus
(𝑮𝑷𝒂) 890 579
Shear Modulus
(𝑮𝑷𝒂) 545 280
Poisson Ratio 0.07 0.22
27
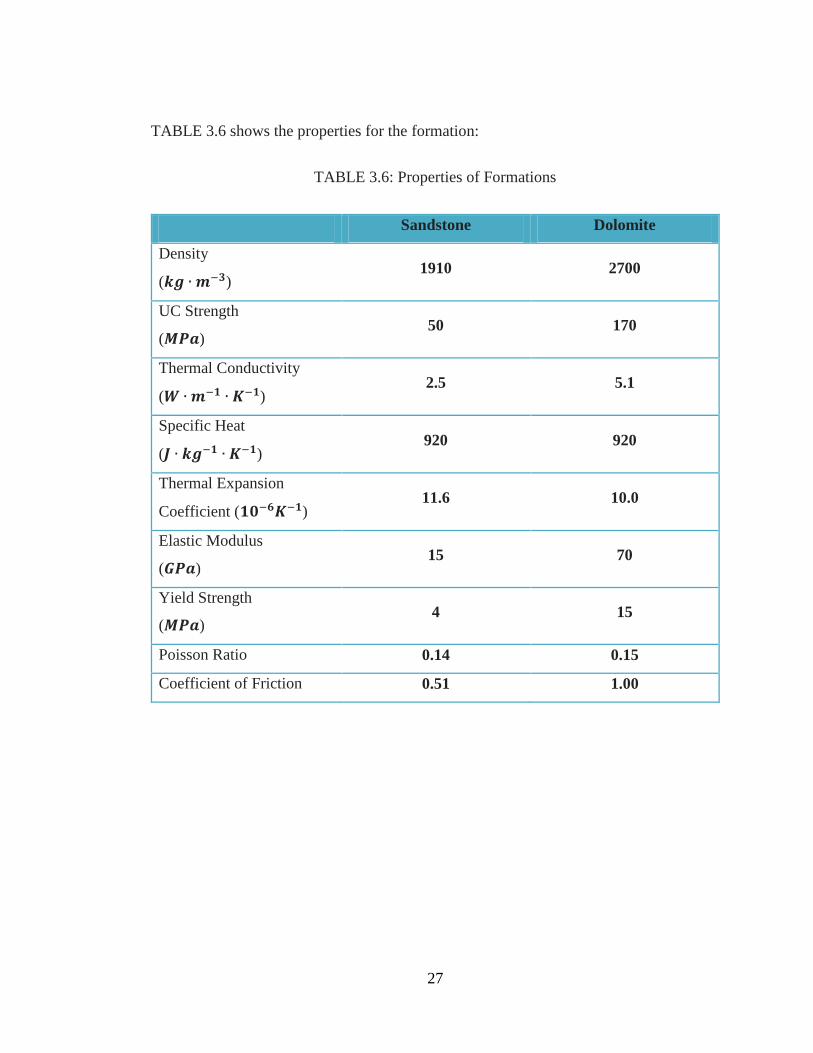
TABLE 3.6 shows the properties for the formation:
TABLE 3.6: Properties of Formations
Sandstone Dolomite
Density
(𝒌𝒈 ∙ 𝒎−𝟑) 1910 2700
UC Strength
(𝑴𝑷𝒂) 50 170
Thermal Conductivity
(𝑾 ∙ 𝒎−𝟏 ∙ 𝑲−𝟏) 2.5 5.1
Specific Heat
(𝑱 ∙ 𝒌𝒈−𝟏 ∙ 𝑲−𝟏) 920 920
Thermal Expansion
Coefficient (𝟏𝟎−𝟔𝑲−𝟏) 11.6 10.0
Elastic Modulus
(𝑮𝑷𝒂) 15 70
Yield Strength
(𝑴𝑷𝒂) 4 15
Poisson Ratio 0.14 0.15
Coefficient of Friction 0.51 1.00
28
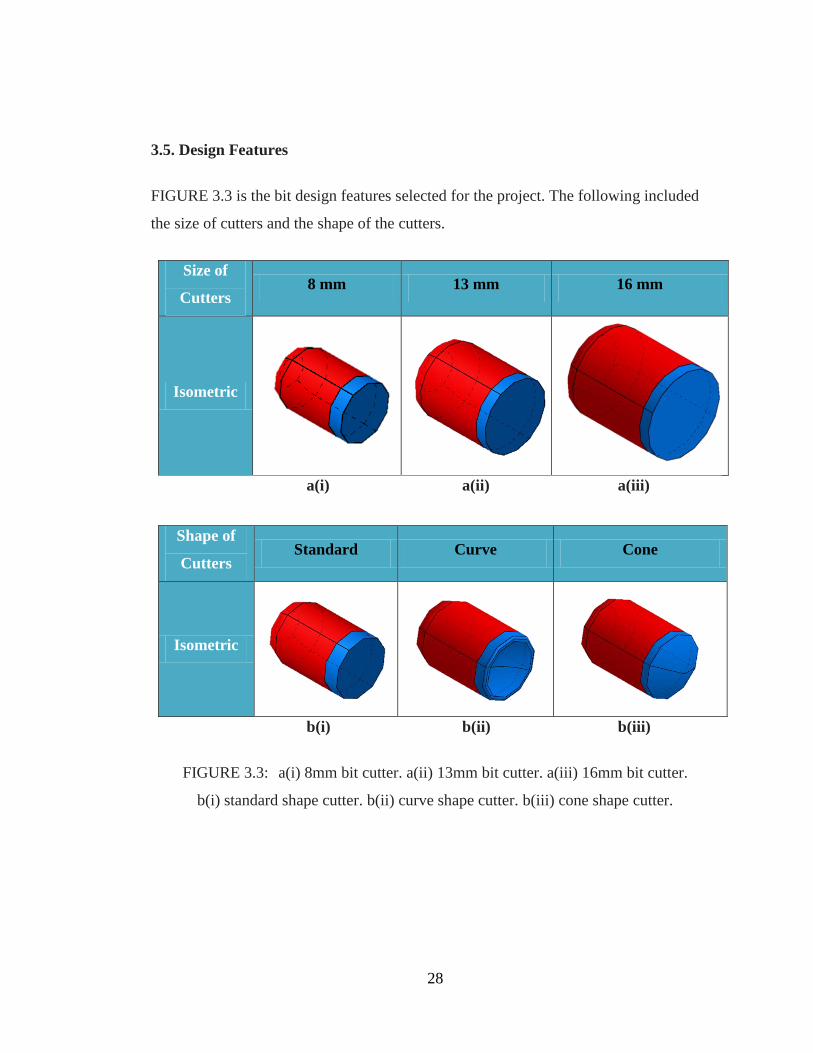
3.5. Design Features
FIGURE 3.3 is the bit design features selected for the project. The following included
the size of cutters and the shape of the cutters.
Size of
Cutters 8 mm 13 mm 16 mm
Isometric
a(i) a(ii) a(iii)
b(i) b(ii) b(iii)
FIGURE 3.3: a(i) 8mm bit cutter. a(ii) 13mm bit cutter. a(iii) 16mm bit cutter.
b(i) standard shape cutter. b(ii) curve shape cutter. b(iii) cone shape cutter.
Shape of
Cutters Standard Curve Cone
Isometric
29
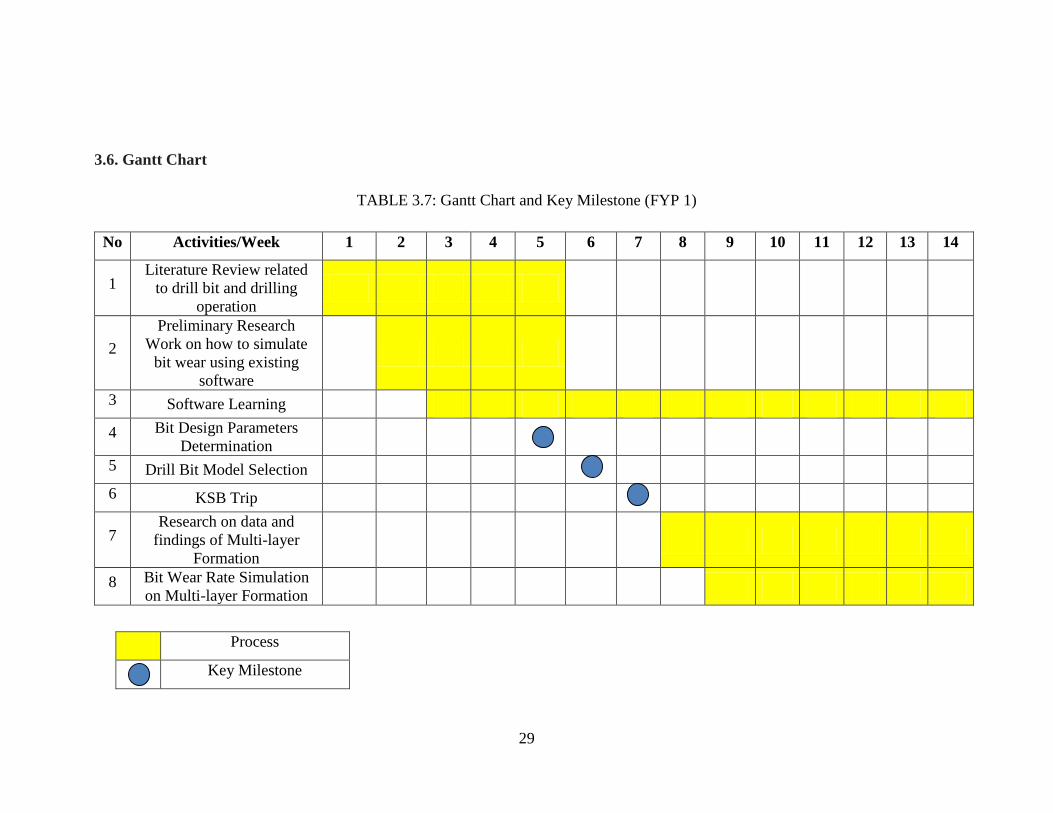
3.6. Gantt Chart
TABLE 3.7: Gantt Chart and Key Milestone (FYP 1)
No Activities/Week 1 2 3 4 5 6 7 8 9 10 11 12 13 14
1 Literature Review related
to drill bit and drilling
operation
2
Preliminary Research
Work on how to simulate
bit wear using existing
software
3 Software Learning
4 Bit Design Parameters
Determination
5 Drill Bit Model Selection
6 KSB Trip
7 Research on data and
findings of Multi-layer
Formation
8 Bit Wear Rate Simulation
on Multi-layer Formation
Process
Key Milestone
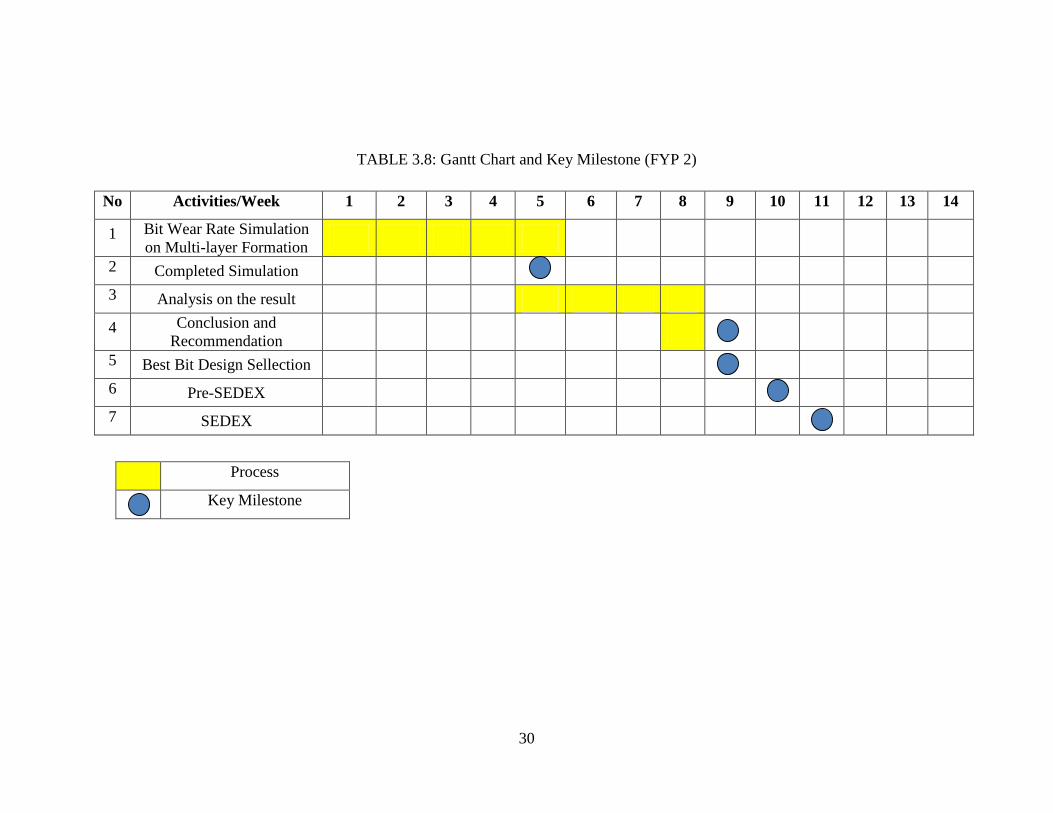
30
TABLE 3.8: Gantt Chart and Key Milestone (FYP 2)
No Activities/Week 1 2 3 4 5 6 7 8 9 10 11 12 13 14
1 Bit Wear Rate Simulation
on Multi-layer Formation
2 Completed Simulation
3 Analysis on the result
4 Conclusion and
Recommendation
5 Best Bit Design Sellection
6 Pre-SEDEX
7 SEDEX
Process
Key Milestone
31
Chapter 4
Result & Discussion
4.1. PDC SINGLE CUTTER TEST
PART I: PDC SINGLE CUTTER ANALYTICAL MODEL
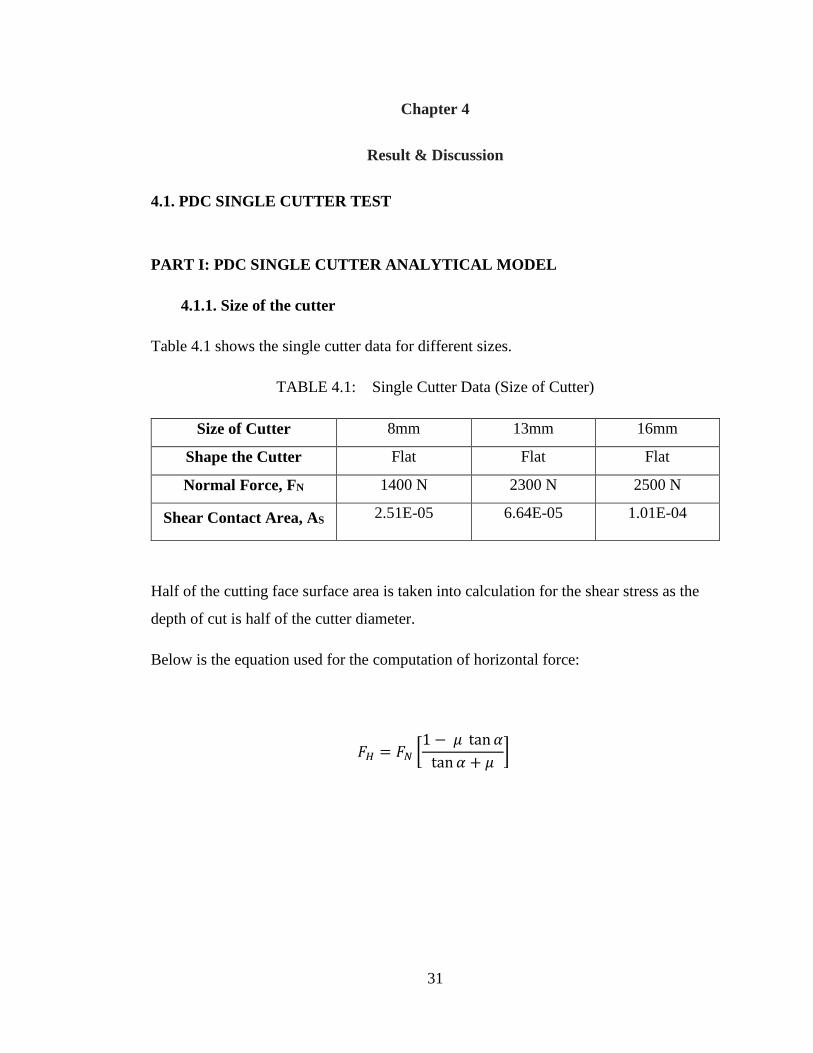
4.1.1. Size of the cutter
Table 4.1 shows the single cutter data for different sizes.
TABLE 4.1: Single Cutter Data (Size of Cutter)
Size of Cutter 8mm 13mm 16mm
Shape the Cutter Flat Flat Flat
Normal Force, FN 1400 N 2300 N 2500 N
Shear Contact Area, AS 2.51E-05
6.64E-05
1.01E-04
Half of the cutting face surface area is taken into calculation for the shear stress as the
depth of cut is half of the cutter diameter.
Below is the equation used for the computation of horizontal force:
𝐹𝐻 = 𝐹𝑁 [1 − 𝜇 tan 𝛼
tan 𝛼 + 𝜇]
32
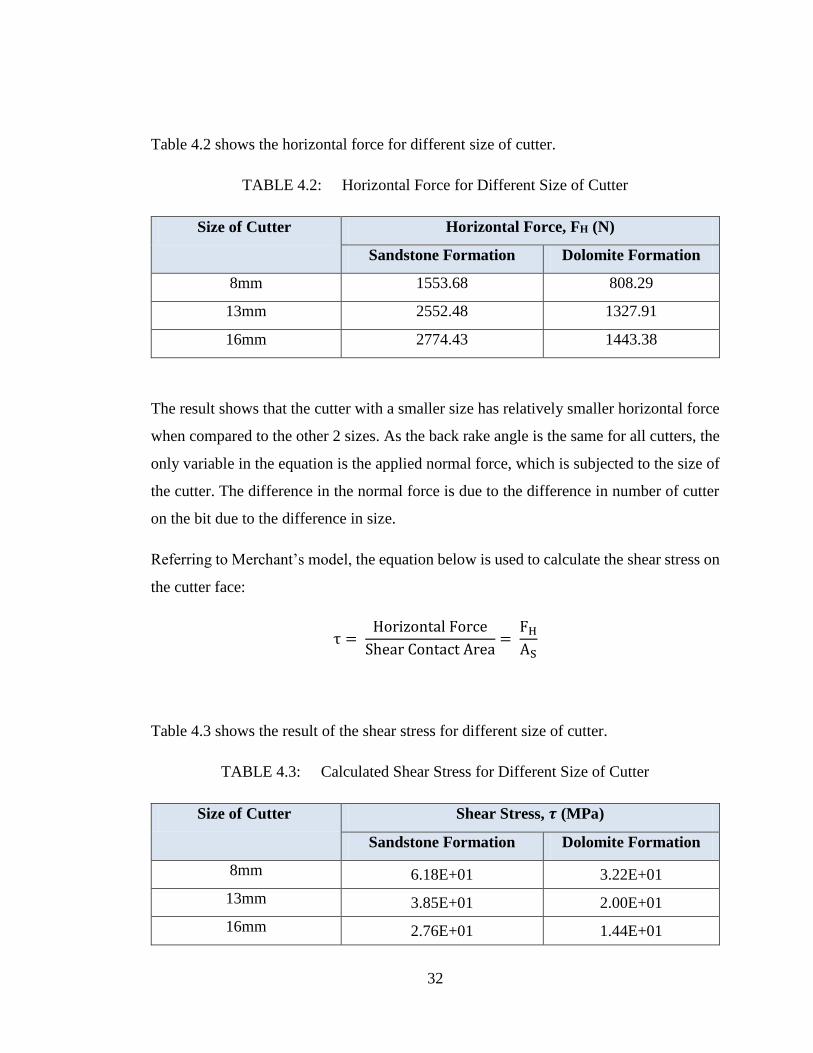
Table 4.2 shows the horizontal force for different size of cutter.
TABLE 4.2: Horizontal Force for Different Size of Cutter
Size of Cutter Horizontal Force, FH (N)
Sandstone Formation Dolomite Formation
8mm 1553.68 808.29
13mm 2552.48 1327.91
16mm 2774.43 1443.38
The result shows that the cutter with a smaller size has relatively smaller horizontal force
when compared to the other 2 sizes. As the back rake angle is the same for all cutters, the
only variable in the equation is the applied normal force, which is subjected to the size of
the cutter. The difference in the normal force is due to the difference in number of cutter
on the bit due to the difference in size.
Referring to Merchant’s model, the equation below is used to calculate the shear stress on
the cutter face:
τ = Horizontal Force
Shear Contact Area=
FH
AS
Table 4.3 shows the result of the shear stress for different size of cutter.
TABLE 4.3: Calculated Shear Stress for Different Size of Cutter
Size of Cutter Shear Stress, 𝝉 (MPa)
Sandstone Formation Dolomite Formation
8mm 6.18E+01 3.22E+01
13mm 3.85E+01 2.00E+01
16mm 2.76E+01 1.44E+01
33
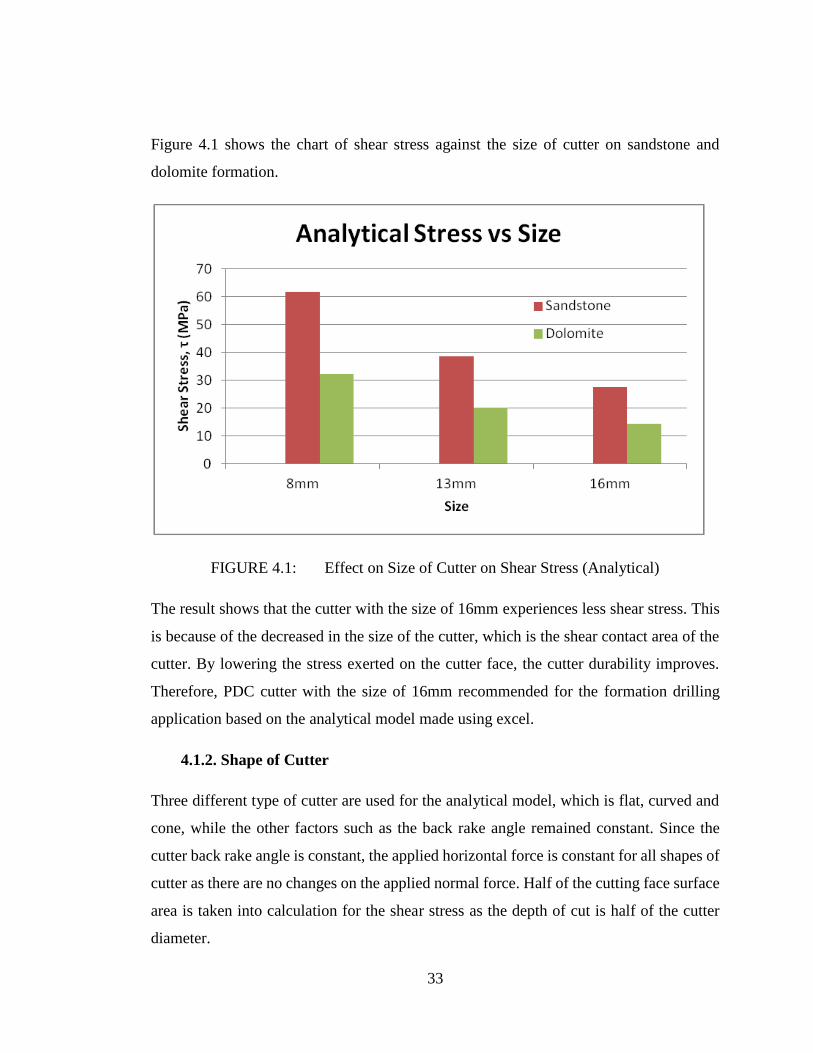
Figure 4.1 shows the chart of shear stress against the size of cutter on sandstone and
dolomite formation.
FIGURE 4.1: Effect on Size of Cutter on Shear Stress (Analytical)
The result shows that the cutter with the size of 16mm experiences less shear stress. This
is because of the decreased in the size of the cutter, which is the shear contact area of the
cutter. By lowering the stress exerted on the cutter face, the cutter durability improves.
Therefore, PDC cutter with the size of 16mm recommended for the formation drilling
application based on the analytical model made using excel.
4.1.2. Shape of Cutter
Three different type of cutter are used for the analytical model, which is flat, curved and
cone, while the other factors such as the back rake angle remained constant. Since the
cutter back rake angle is constant, the applied horizontal force is constant for all shapes of
cutter as there are no changes on the applied normal force. Half of the cutting face surface
area is taken into calculation for the shear stress as the depth of cut is half of the cutter
diameter.
34
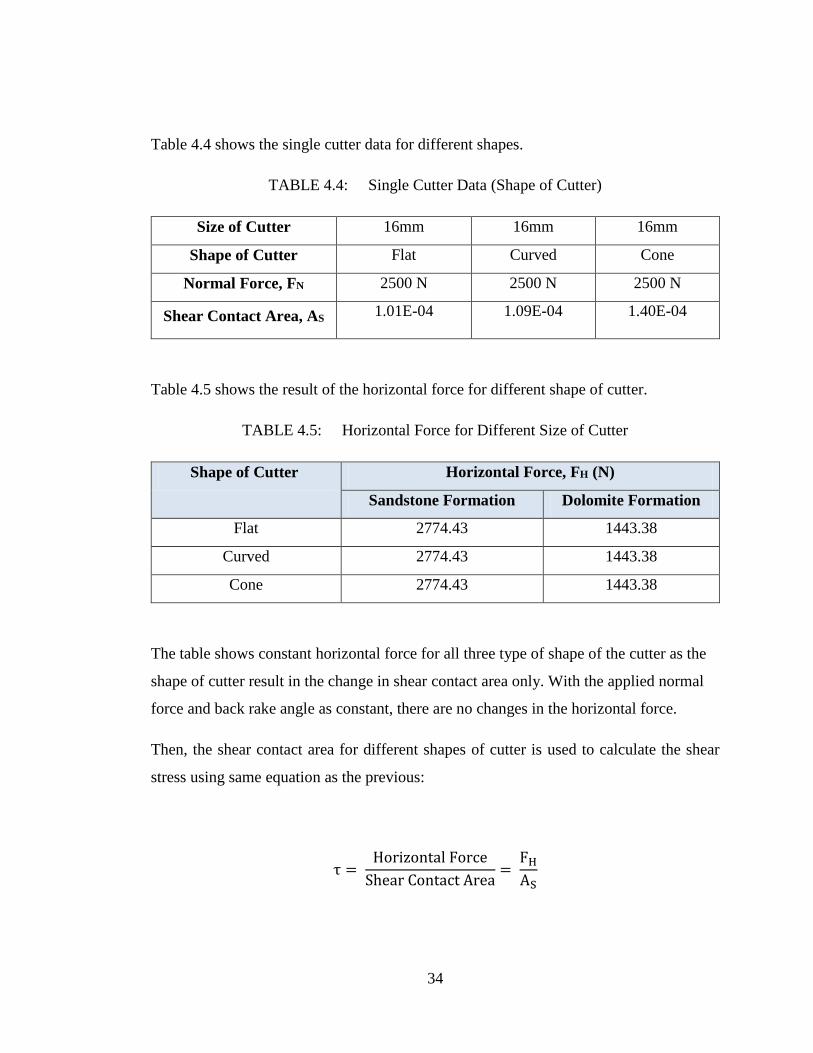
Table 4.4 shows the single cutter data for different shapes.
TABLE 4.4: Single Cutter Data (Shape of Cutter)
Size of Cutter 16mm 16mm 16mm
Shape of Cutter Flat Curved Cone
Normal Force, FN 2500 N 2500 N 2500 N
Shear Contact Area, AS 1.01E-04
1.09E-04
1.40E-04
Table 4.5 shows the result of the horizontal force for different shape of cutter.
TABLE 4.5: Horizontal Force for Different Size of Cutter
Shape of Cutter Horizontal Force, FH (N)
Sandstone Formation Dolomite Formation
Flat 2774.43 1443.38
Curved 2774.43 1443.38
Cone 2774.43 1443.38
The table shows constant horizontal force for all three type of shape of the cutter as the
shape of cutter result in the change in shear contact area only. With the applied normal
force and back rake angle as constant, there are no changes in the horizontal force.
Then, the shear contact area for different shapes of cutter is used to calculate the shear
stress using same equation as the previous:
τ = Horizontal Force
Shear Contact Area=
FH
AS
35
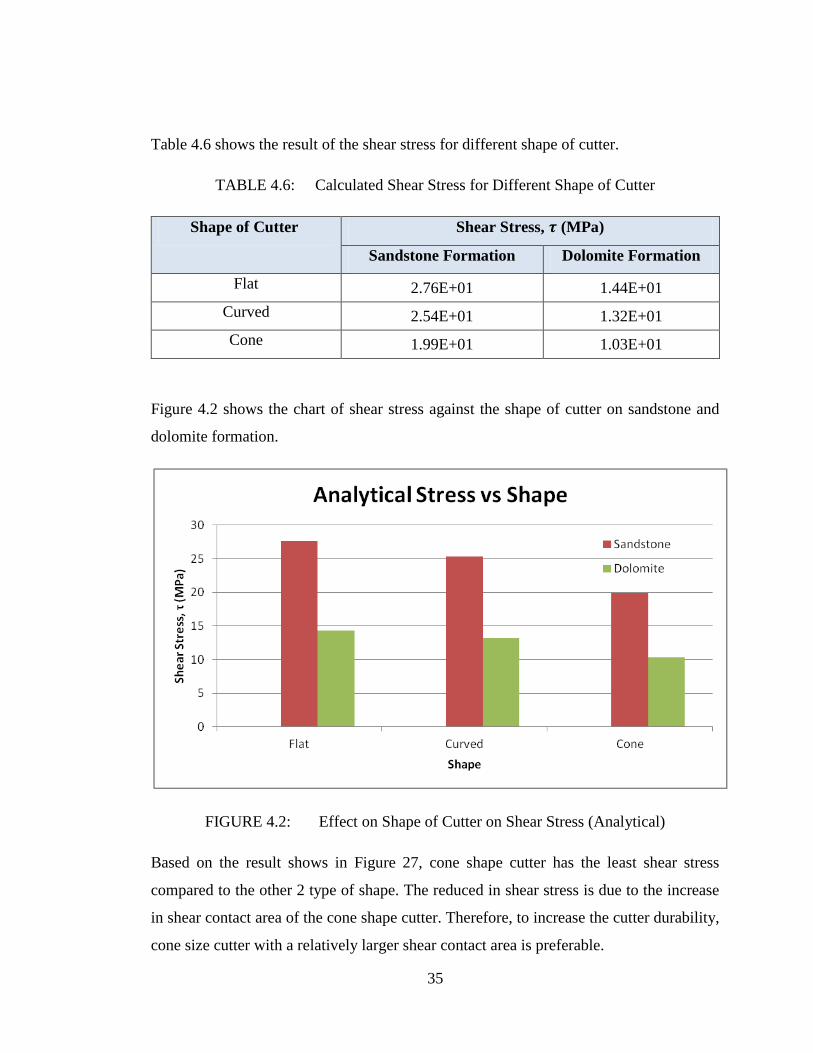
Table 4.6 shows the result of the shear stress for different shape of cutter.
TABLE 4.6: Calculated Shear Stress for Different Shape of Cutter
Shape of Cutter Shear Stress, 𝝉 (MPa)
Sandstone Formation Dolomite Formation
Flat 2.76E+01 1.44E+01
Curved 2.54E+01 1.32E+01
Cone 1.99E+01 1.03E+01
Figure 4.2 shows the chart of shear stress against the shape of cutter on sandstone and
dolomite formation.
FIGURE 4.2: Effect on Shape of Cutter on Shear Stress (Analytical)
Based on the result shows in Figure 27, cone shape cutter has the least shear stress
compared to the other 2 type of shape. The reduced in shear stress is due to the increase
in shear contact area of the cone shape cutter. Therefore, to increase the cutter durability,
cone size cutter with a relatively larger shear contact area is preferable.
36
PART II: PDC SINGLE CUTTER SIMULATION
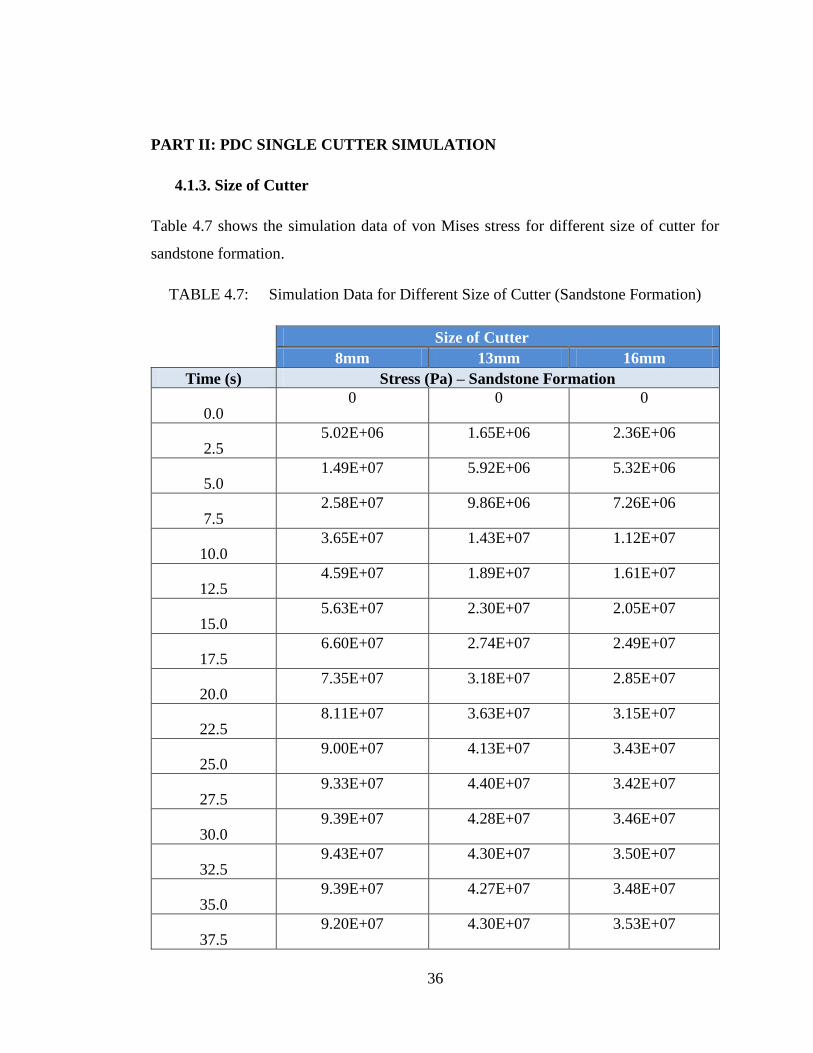
4.1.3. Size of Cutter
Table 4.7 shows the simulation data of von Mises stress for different size of cutter for
sandstone formation.
TABLE 4.7: Simulation Data for Different Size of Cutter (Sandstone Formation)
Size of Cutter
8mm 13mm 16mm
Time (s) Stress (Pa) – Sandstone Formation
0.0 0 0 0
2.5 5.02E+06 1.65E+06 2.36E+06
5.0 1.49E+07 5.92E+06 5.32E+06
7.5 2.58E+07 9.86E+06 7.26E+06
10.0 3.65E+07 1.43E+07 1.12E+07
12.5 4.59E+07 1.89E+07 1.61E+07
15.0 5.63E+07 2.30E+07 2.05E+07
17.5 6.60E+07 2.74E+07 2.49E+07
20.0 7.35E+07 3.18E+07 2.85E+07
22.5 8.11E+07 3.63E+07 3.15E+07
25.0 9.00E+07 4.13E+07 3.43E+07
27.5 9.33E+07 4.40E+07 3.42E+07
30.0 9.39E+07 4.28E+07 3.46E+07
32.5 9.43E+07 4.30E+07 3.50E+07
35.0 9.39E+07 4.27E+07 3.48E+07
37.5 9.20E+07 4.30E+07 3.53E+07
37
40.0 9.29E+07 4.29E+07 3.54E+07
42.5 9.16E+07 4.22E+07 3.52E+07
45.0 9.48E+07 4.37E+07 3.49E+07
47.5 9.04E+07 4.33E+07 3.42E+07
50.0 9.35E+07 4.28E+07 3.54E+07
52.5 9.06E+07 4.38E+07 3.58E+07
55.0 9.45E+07 4.29E+07 3.53E+07
57.5 9.14E+07 4.31E+07 3.58E+07
60.0 9.09E+07 4.30E+07 3.51E+07
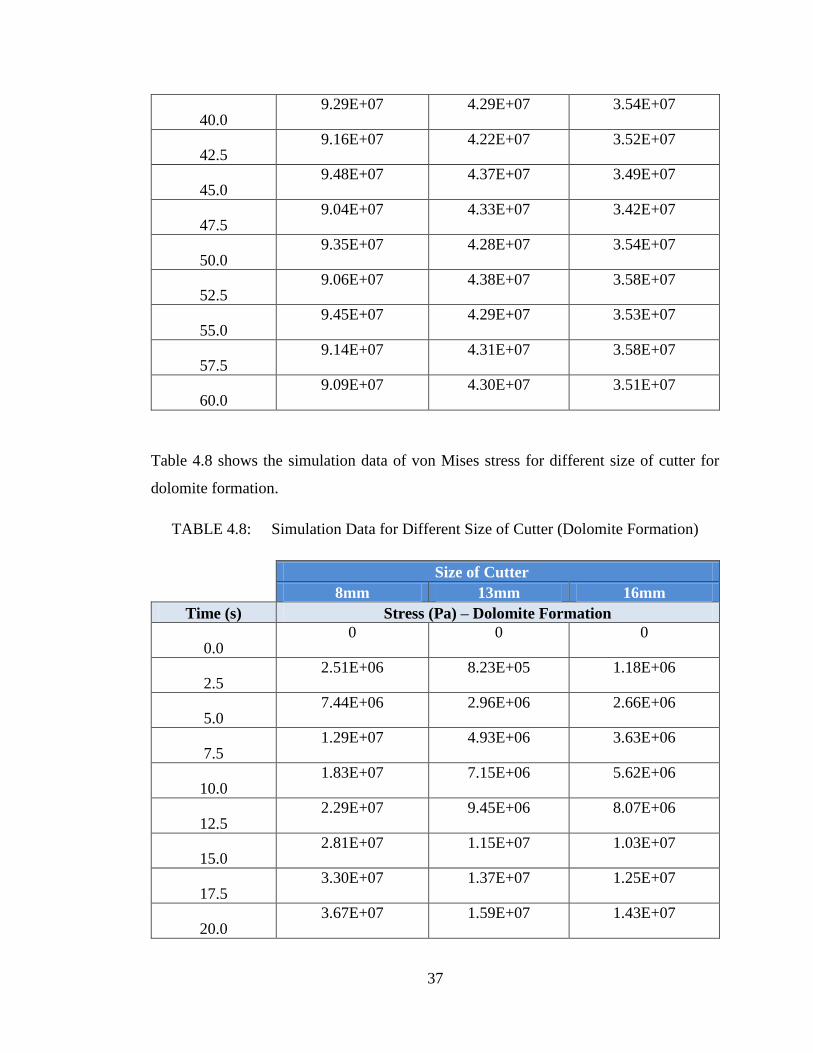
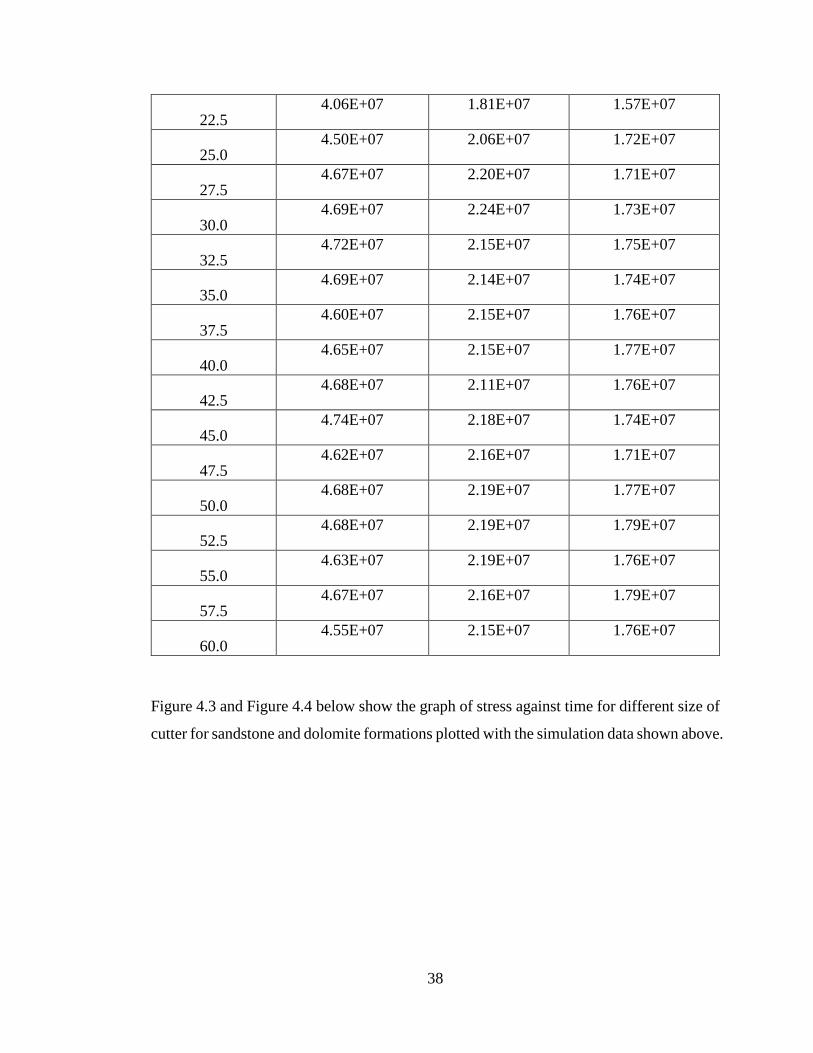
Table 4.8 shows the simulation data of von Mises stress for different size of cutter for
dolomite formation.
TABLE 4.8: Simulation Data for Different Size of Cutter (Dolomite Formation)
Size of Cutter
8mm 13mm 16mm
Time (s) Stress (Pa) – Dolomite Formation
0.0 0 0 0
2.5 2.51E+06 8.23E+05 1.18E+06
5.0 7.44E+06 2.96E+06 2.66E+06
7.5 1.29E+07 4.93E+06 3.63E+06
10.0 1.83E+07 7.15E+06 5.62E+06
12.5 2.29E+07 9.45E+06 8.07E+06
15.0 2.81E+07 1.15E+07 1.03E+07
17.5 3.30E+07 1.37E+07 1.25E+07
20.0 3.67E+07 1.59E+07 1.43E+07
38
22.5 4.06E+07 1.81E+07 1.57E+07
25.0 4.50E+07 2.06E+07 1.72E+07
27.5 4.67E+07 2.20E+07 1.71E+07
30.0 4.69E+07 2.24E+07 1.73E+07
32.5 4.72E+07 2.15E+07 1.75E+07
35.0 4.69E+07 2.14E+07 1.74E+07
37.5 4.60E+07 2.15E+07 1.76E+07
40.0 4.65E+07 2.15E+07 1.77E+07
42.5 4.68E+07 2.11E+07 1.76E+07
45.0 4.74E+07 2.18E+07 1.74E+07
47.5 4.62E+07 2.16E+07 1.71E+07
50.0 4.68E+07 2.19E+07 1.77E+07
52.5 4.68E+07 2.19E+07 1.79E+07
55.0 4.63E+07 2.19E+07 1.76E+07
57.5 4.67E+07 2.16E+07 1.79E+07
60.0 4.55E+07 2.15E+07 1.76E+07
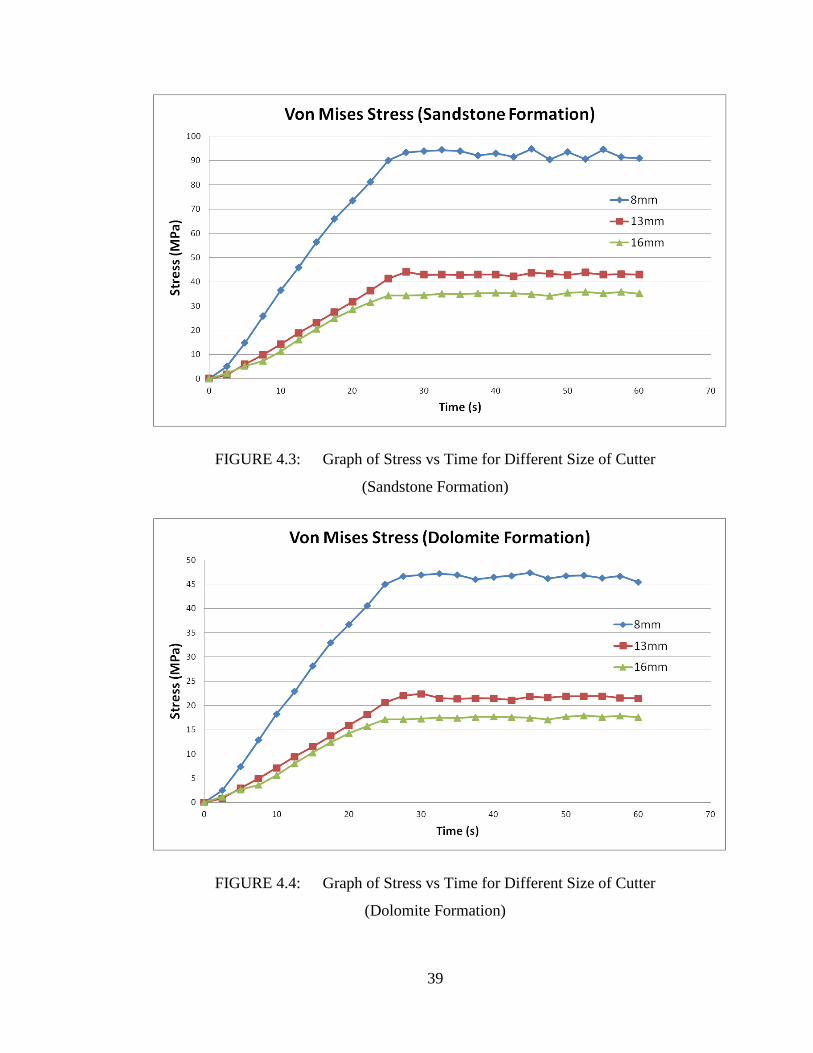
Figure 4.3 and Figure 4.4 below show the graph of stress against time for different size of
cutter for sandstone and dolomite formations plotted with the simulation data shown above.
39
FIGURE 4.3: Graph of Stress vs Time for Different Size of Cutter
(Sandstone Formation)
FIGURE 4.4: Graph of Stress vs Time for Different Size of Cutter
(Dolomite Formation)
40
The stress of the cutter climb rapidly in the beginning and started to stable itself about 30s
afterwards. This is because the simulated data is trying to reach the designated horizontal
force during the beginning stage of the simulation.
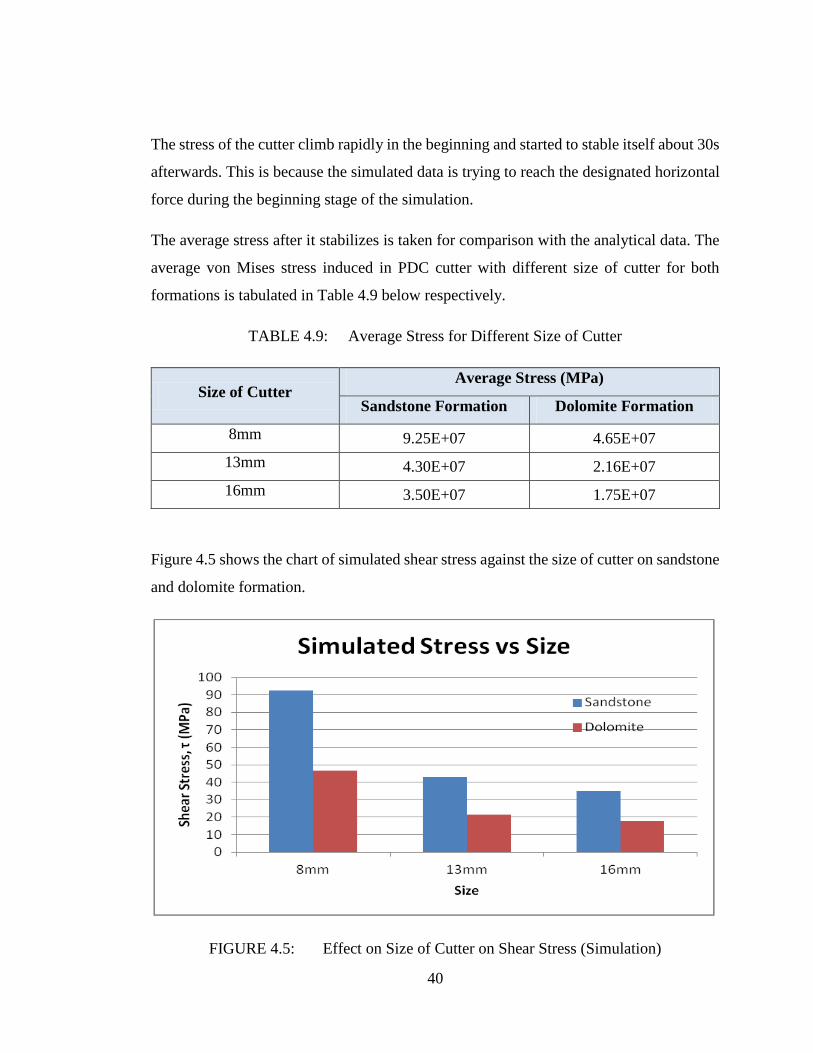
The average stress after it stabilizes is taken for comparison with the analytical data. The
average von Mises stress induced in PDC cutter with different size of cutter for both
formations is tabulated in Table 4.9 below respectively.
TABLE 4.9: Average Stress for Different Size of Cutter
Size of Cutter Average Stress (MPa)
Sandstone Formation Dolomite Formation
8mm 9.25E+07 4.65E+07
13mm 4.30E+07 2.16E+07
16mm 3.50E+07 1.75E+07
Figure 4.5 shows the chart of simulated shear stress against the size of cutter on sandstone
and dolomite formation.
FIGURE 4.5: Effect on Size of Cutter on Shear Stress (Simulation)
41
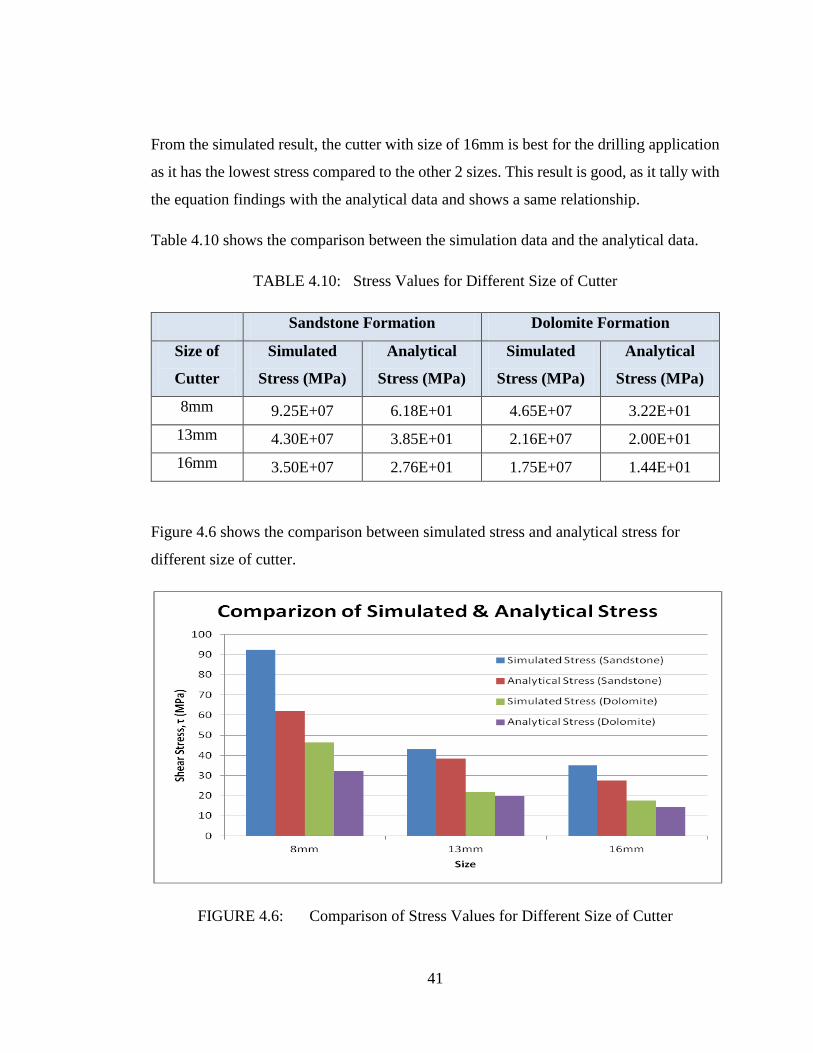
From the simulated result, the cutter with size of 16mm is best for the drilling application
as it has the lowest stress compared to the other 2 sizes. This result is good, as it tally with
the equation findings with the analytical data and shows a same relationship.
Table 4.10 shows the comparison between the simulation data and the analytical data.
TABLE 4.10: Stress Values for Different Size of Cutter
Sandstone Formation Dolomite Formation
Size of
Cutter
Simulated
Stress (MPa)
Analytical
Stress (MPa)
Simulated
Stress (MPa)
Analytical
Stress (MPa)
8mm 9.25E+07 6.18E+01 4.65E+07 3.22E+01
13mm 4.30E+07 3.85E+01 2.16E+07 2.00E+01
16mm 3.50E+07 2.76E+01 1.75E+07 1.44E+01
Figure 4.6 shows the comparison between simulated stress and analytical stress for
different size of cutter.
FIGURE 4.6: Comparison of Stress Values for Different Size of Cutter
42
The von Mises stress obtained from the simulation data is higher than analytical data. This
is due to the axial stress and not all forces are taken into the calculation of the analytical
model. However, both the simulated and analytical stress data show the same behaviour,
which tally with the theory based on the equation. Thus, both set of data show that the
best size of cutter for drilling operation in considerations of cutter durability is the cutter
with 16mm size.
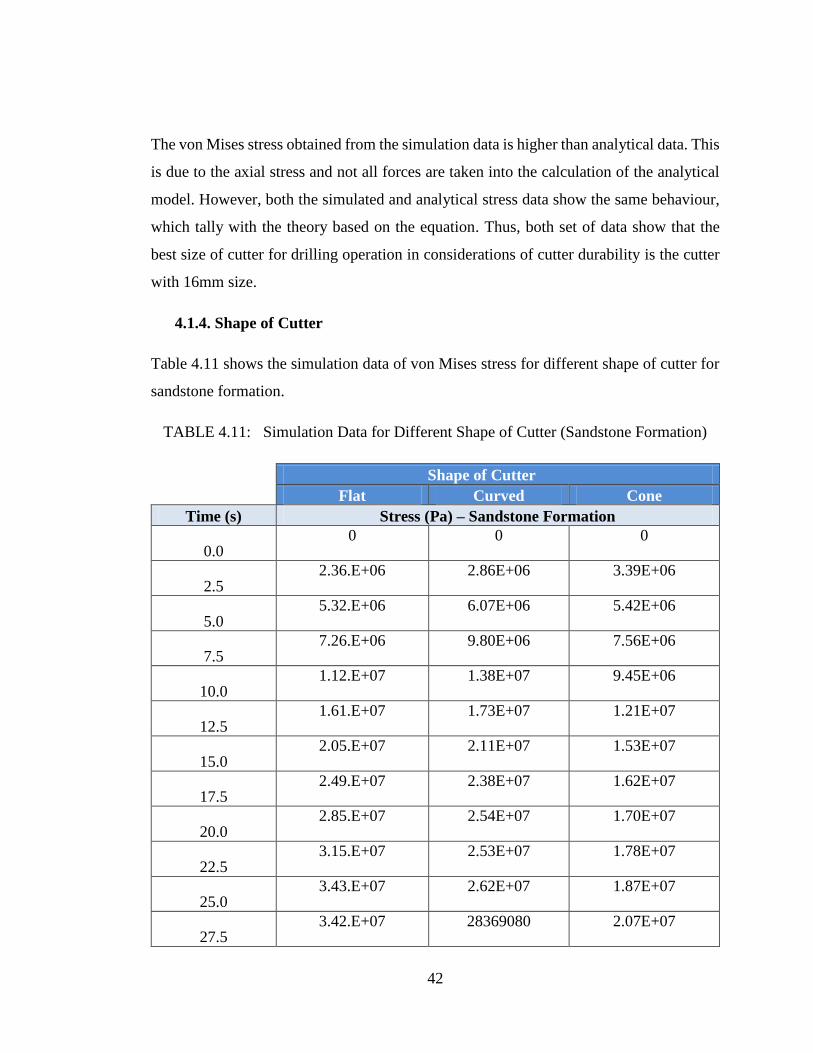
4.1.4. Shape of Cutter
Table 4.11 shows the simulation data of von Mises stress for different shape of cutter for
sandstone formation.
TABLE 4.11: Simulation Data for Different Shape of Cutter (Sandstone Formation)
Shape of Cutter
Flat Curved Cone
Time (s) Stress (Pa) – Sandstone Formation
0.0 0 0 0
2.5 2.36.E+06 2.86E+06 3.39E+06
5.0 5.32.E+06 6.07E+06 5.42E+06
7.5 7.26.E+06 9.80E+06 7.56E+06
10.0 1.12.E+07 1.38E+07 9.45E+06
12.5 1.61.E+07 1.73E+07 1.21E+07
15.0 2.05.E+07 2.11E+07 1.53E+07
17.5 2.49.E+07 2.38E+07 1.62E+07
20.0 2.85.E+07 2.54E+07 1.70E+07
22.5 3.15.E+07 2.53E+07 1.78E+07
25.0 3.43.E+07 2.62E+07 1.87E+07
27.5 3.42.E+07 28369080 2.07E+07
43
30.0 3.46.E+07 28944900 2.30E+07
32.5 3.50.E+07 28081260 2.38E+07
35.0 3.48.E+07 28421730 2.49E+07
37.5 3.53.E+07 28061730 2.56E+07
40.0 3.54.E+07 27521730 2.47E+07
42.5 3.52.E+07 27341730 2.47E+07
45.0 3.49.E+07 27431730 2.42E+07
47.5 3.42.E+07 28061730 2.47E+07
50.0 3.54.E+07 28241730 2.50E+07
52.5 3.58.E+07 28888173 2.49E+07
55.0 3.53.E+07 28061730 2.43E+07
57.5 3.58.E+07 28331730 2.45E+07
60.0 3.51.E+07 27971730 2.45E+07
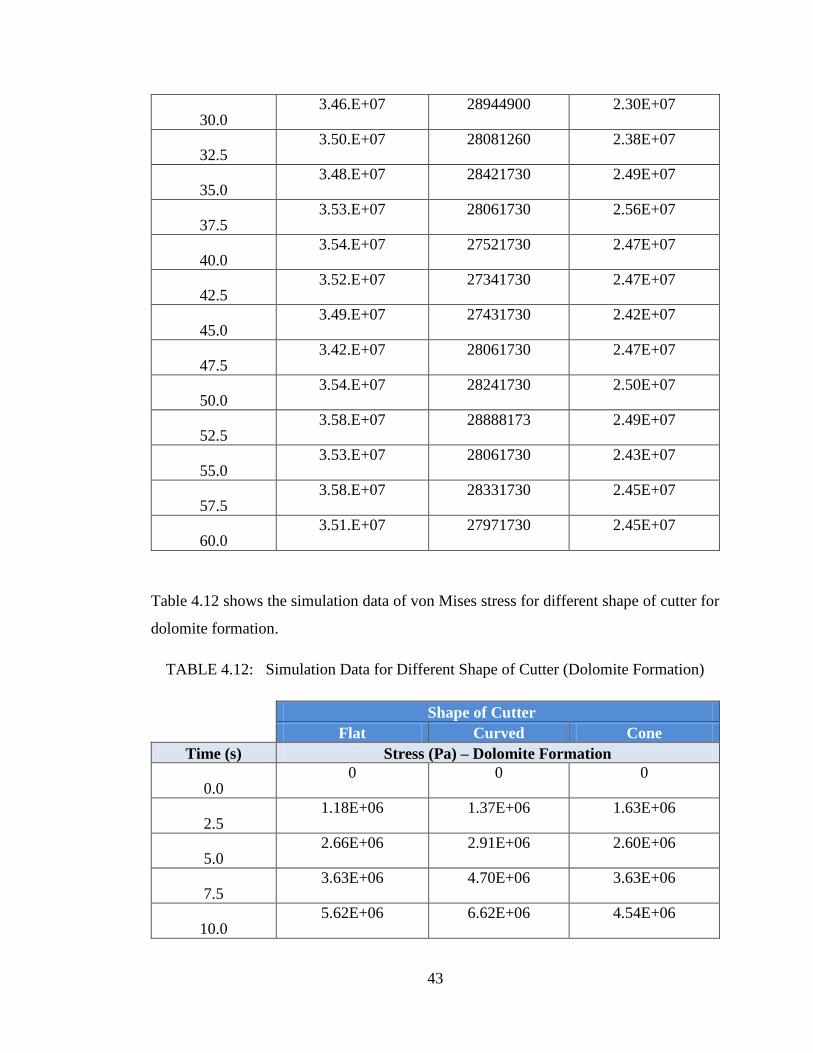
Table 4.12 shows the simulation data of von Mises stress for different shape of cutter for
dolomite formation.
TABLE 4.12: Simulation Data for Different Shape of Cutter (Dolomite Formation)
Shape of Cutter
Flat Curved Cone
Time (s) Stress (Pa) – Dolomite Formation
0.0 0 0 0
2.5 1.18E+06 1.37E+06 1.63E+06
5.0 2.66E+06 2.91E+06 2.60E+06
7.5 3.63E+06 4.70E+06 3.63E+06
10.0 5.62E+06 6.62E+06 4.54E+06
44
12.5 8.07E+06 8.30E+06 5.81E+06
15.0 1.03E+07 1.01E+07 7.33E+06
17.5 1.25E+07 1.14E+07 7.76E+06
20.0 1.43E+07 1.22E+07 8.15E+06
22.5 1.57E+07 1.22E+07 8.52E+06
25.0 1.72E+07 1.26E+07 8.99E+06
27.5 1.71E+07 1.36E+07 9.96E+06
30.0 1.73E+07 1.39E+07 1.10E+07
32.5 1.75E+07 1.35E+07 1.14E+07
35.0 1.74E+07 1.36E+07 1.19E+07
37.5 1.76E+07 1.35E+07 1.20E+07
40.0 1.77E+07 1.32E+07 1.19E+07
42.5 1.76E+07 1.31E+07 1.18E+07
45.0 1.74E+07 1.38E+07 1.16E+07
47.5 1.71E+07 1.35E+07 1.16E+07
50.0 1.77E+07 1.37E+07 1.20E+07
52.5 1.79E+07 1.39E+07 1.20E+07
55.0 1.76E+07 1.35E+07 1.17E+07
57.5 1.79E+07 1.36E+07 1.18E+07
60.0 1.76E+07 1.34E+07 1.18E+07
Figure 4.7 and Figure 4.8 show the graph of stress against time for different size of cutter
for sandstone and dolomite formations plotted with the simulation data shown above.
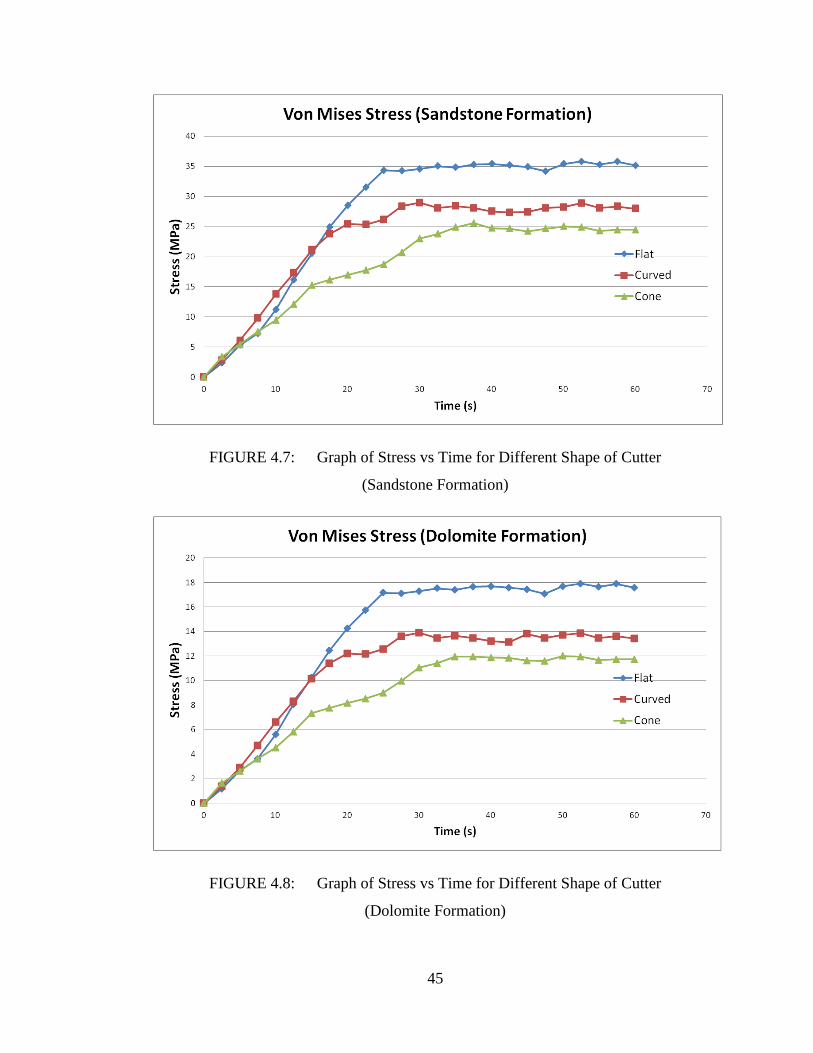
45
FIGURE 4.7: Graph of Stress vs Time for Different Shape of Cutter
(Sandstone Formation)
FIGURE 4.8: Graph of Stress vs Time for Different Shape of Cutter
(Dolomite Formation)
46
The average stress after about 30s is taken for comparison with the analytical data. The
average von Mises stress induced in PDC cutter with different shape of cutter for both
formations is tabulated in Table 4.13 below respectively.
TABLE 4.13: Average Stress for Different Shape of Cutter
Shape of Cutter Average Stress (MPa)
Sandstone Formation Dolomite Formation
Flat 3.50E+01 1.75E+01
Curved 2.80E+01 1.35E+01
Cone 2.39E+01 1.14E+01
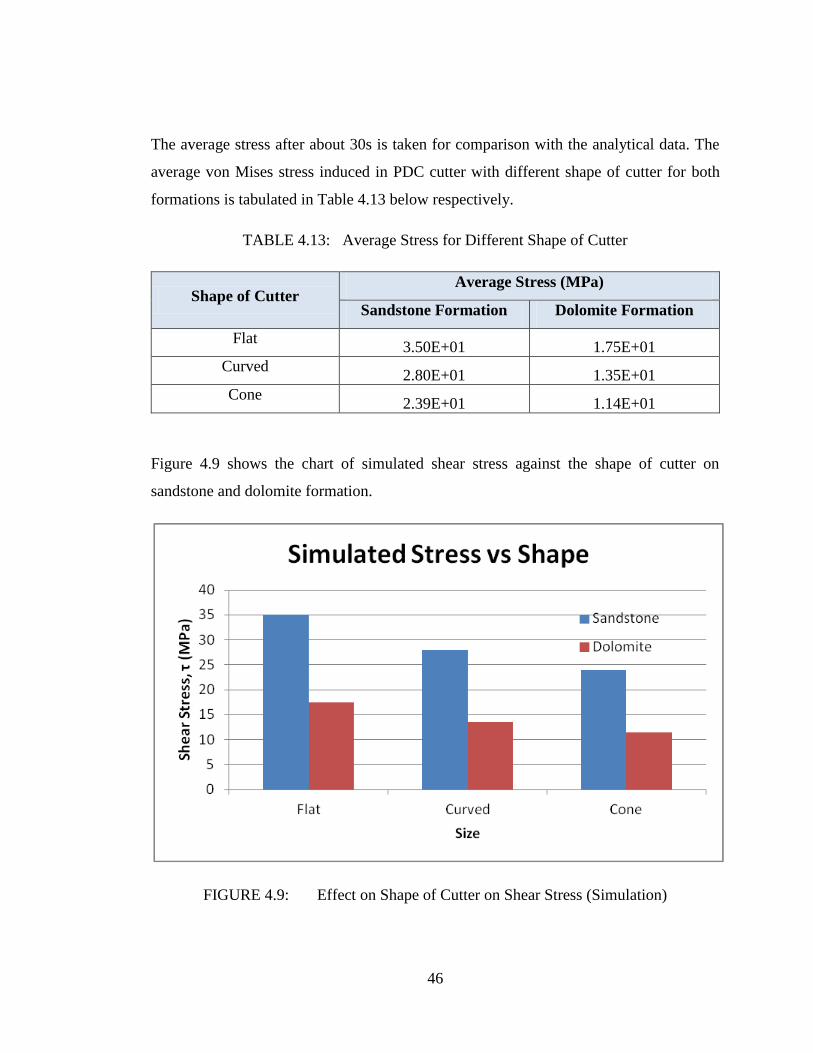
Figure 4.9 shows the chart of simulated shear stress against the shape of cutter on
sandstone and dolomite formation.
FIGURE 4.9: Effect on Shape of Cutter on Shear Stress (Simulation)
47
From the simulated result, the cutter with cone shape is best for the drilling application as
it has the lowest stress compared to the other 2 shapes. This is because the shear contact
area of cone shape cutter is the highest and with largest shear contact area, the least stress
is exerted on the cutter. The result is good, as it tally with the equation findings with the
analytical data and shows a same relationship. The result is then validated with the
comparison between the simulated data and analytical data.
Table 4.14 shows the comparison between the simulation data and the analytical data.
TABLE 4.14: Stress Values for Different Shape of Cutter
Sandstone Formation Dolomite Formation
Shape of
Cutter
Simulated
Stress (MPa)
Analytical
Stress (MPa)
Simulated
Stress (MPa)
Analytical
Stress (MPa)
Flat 3.50E+07 2.76E+07 1.75E+07 1.44E+07
Curved 2.80E+07 2.54E+07 1.35E+07 1.32E+07
Cone 2.39E+07 1.99E+07 1.14E+07 1.03E+07
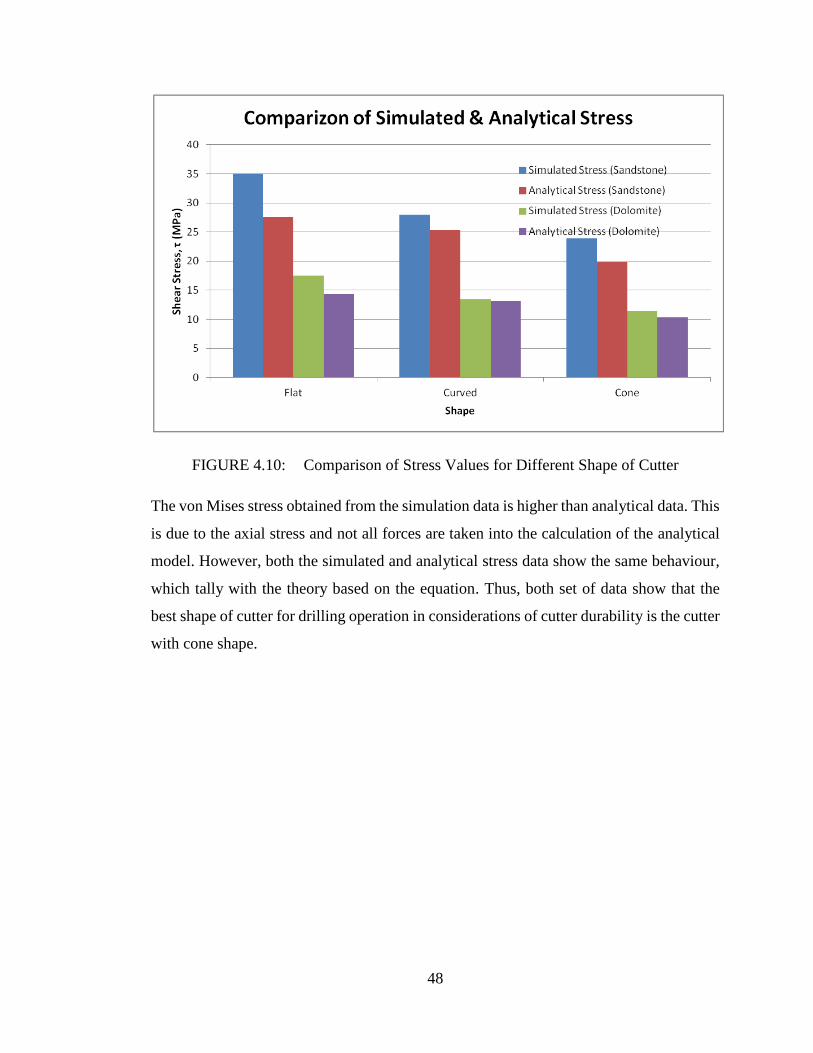
Figure 4.10 below shows the comparison between simulated stress and analytical stress
for different shape of cutter.
48
FIGURE 4.10: Comparison of Stress Values for Different Shape of Cutter
The von Mises stress obtained from the simulation data is higher than analytical data. This
is due to the axial stress and not all forces are taken into the calculation of the analytical
model. However, both the simulated and analytical stress data show the same behaviour,
which tally with the theory based on the equation. Thus, both set of data show that the
best shape of cutter for drilling operation in considerations of cutter durability is the cutter
with cone shape.
49
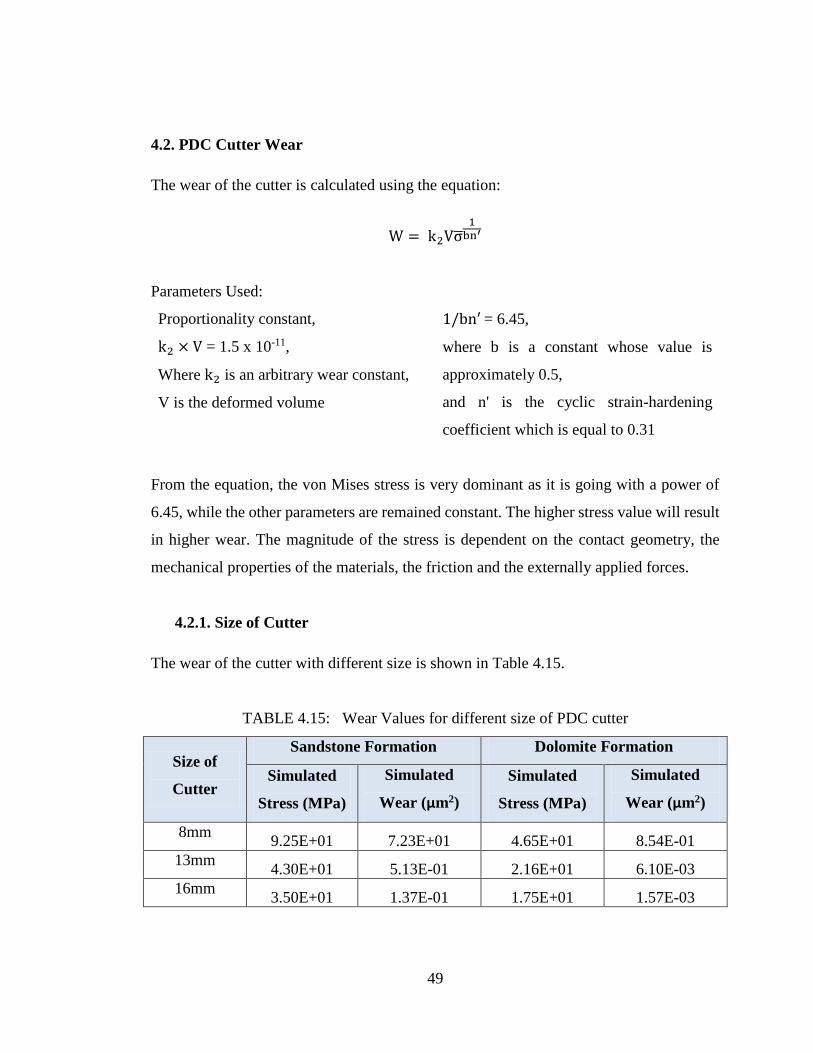
4.2. PDC Cutter Wear
The wear of the cutter is calculated using the equation:
W = k2Vσ̅1
bn′
Parameters Used:
Proportionality constant,
k2 × V = 1.5 x 10⁻¹¹,
Where k2 is an arbitrary wear constant,
V is the deformed volume
1/bn′ = 6.45,
where b is a constant whose value is
approximately 0.5,
and n' is the cyclic strain-hardening
coefficient which is equal to 0.31
From the equation, the von Mises stress is very dominant as it is going with a power of
6.45, while the other parameters are remained constant. The higher stress value will result
in higher wear. The magnitude of the stress is dependent on the contact geometry, the
mechanical properties of the materials, the friction and the externally applied forces.
4.2.1. Size of Cutter
The wear of the cutter with different size is shown in Table 4.15.
TABLE 4.15: Wear Values for different size of PDC cutter
Size of
Cutter
Sandstone Formation Dolomite Formation
Simulated
Stress (MPa)
Simulated
Wear (μm2)
Simulated
Stress (MPa)
Simulated
Wear (μm2)
8mm 9.25E+01 7.23E+01 4.65E+01 8.54E-01
13mm 4.30E+01 5.13E-01 2.16E+01 6.10E-03
16mm 3.50E+01 1.37E-01 1.75E+01 1.57E-03
50
Based on the Table 30, result shows that the cutter with size 16mm has the least wear
compared to other size of cutter. PDC bit cutter with size 16mm has the lowest stress value
and thus resulted in lowest wear.
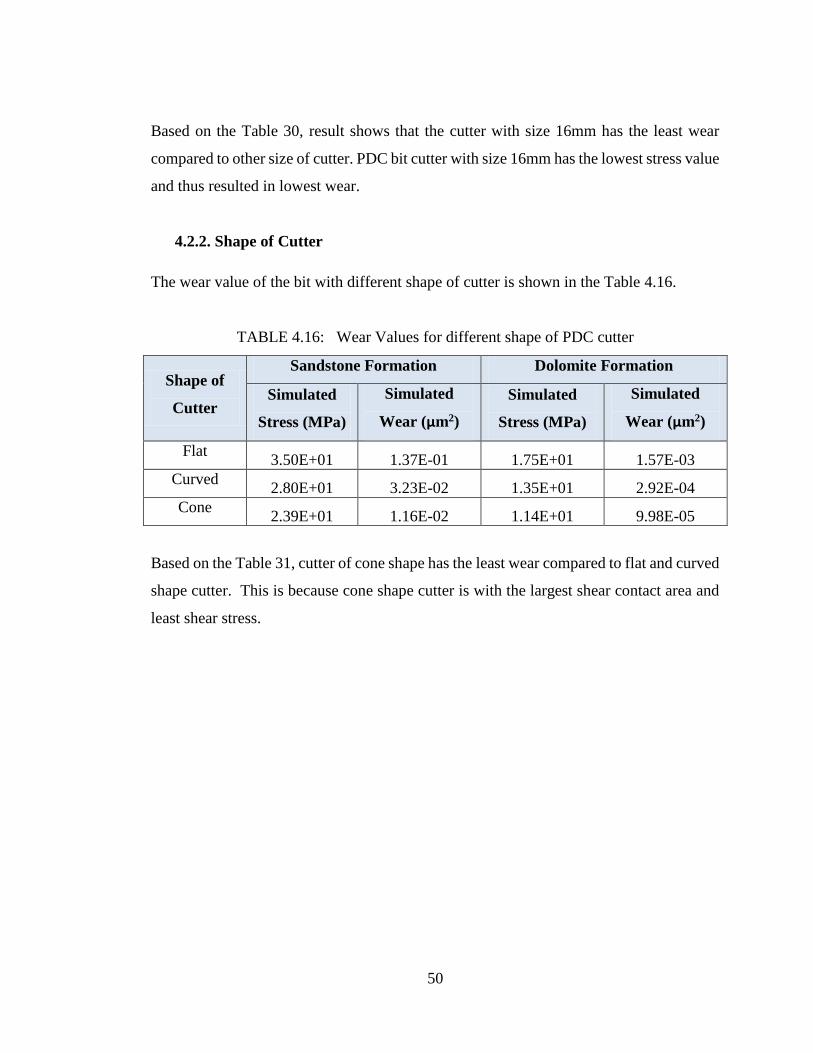
4.2.2. Shape of Cutter
The wear value of the bit with different shape of cutter is shown in the Table 4.16.
TABLE 4.16: Wear Values for different shape of PDC cutter
Shape of
Cutter
Sandstone Formation Dolomite Formation
Simulated
Stress (MPa)
Simulated
Wear (μm2)
Simulated
Stress (MPa)
Simulated
Wear (μm2)
Flat 3.50E+01 1.37E-01 1.75E+01 1.57E-03
Curved 2.80E+01 3.23E-02 1.35E+01 2.92E-04
Cone 2.39E+01 1.16E-02 1.14E+01 9.98E-05
Based on the Table 31, cutter of cone shape has the least wear compared to flat and curved
shape cutter. This is because cone shape cutter is with the largest shear contact area and
least shear stress.
51
Chapter 5
Conclusion & Recommendation
5.1. Conclusion
Rate of penetration is important in optimizing the drilling performance, but by selecting
suitable drill bit design which reduce the wear rate throughout the operation and increase
the run length of the drill bit is another approach too. Most of the drilling operation is
occurring at multi layer formation area which results in a more favorable choice to
optimize the performance in run length rather than penetration rate. However, a maximize
ROP is still favorable together with a suitable bit design for the multi layer formation
operation area. Analytical model using the combination of both cutter-rock interaction
model and Merchant’s cutting model is formed to study the force and stress in the PDC
cutter during drilling operation. Several bit design with different size and shape of cutter
are simulated in ABAQUS and the best design which produce minimum wear rate during
drilling operation is obtained. Results obtained that for this project, size of cutter with
16mm is best for cutter to increase the durability as the large shear contact area minimize
the stress and lead to less wear compared to other size of cutter. As for the shape of cutter,
cone shape is the best design to minimize wear and prolong the durability, as the same as
the size of cutter, cone shape is with the largest shear contact area, which result in least
stress and wear.
5.2. Recommendation
Due to the limitation of time and software, only simulation on the single cutter is done.
The project can be improved using a better version of software and run the simulation for
the whole bit instead of just on a single cutter. Further research can be made in the future
to include other and more design features of the bit. Research on the other factors that
would contribute to the bit wear rate can be explored too.
52
References
Bilgesu, H.I., Tetrick, L.T., Altmis, U., Mohaghegh, S., and Ameri, S., 1997. “A New
Approach for the Prediction of Rate of Penetration (ROP) Values” SPE Journal.
Bit Technology, 2012. Baker Hughes Incorporated.
Cheatham, C.A. and Loeb, D.A.,1985. “Effect of Field Wear on PDC Bit Performance”
SPE/IADC Journal.
Clayton, R., Chen, S., and Lefort, G., 2005. “New Bit Design, Cutter Technology Extend
PDC Applications to Hard Rock Drilling” SPE Journal.
Drilling Engineering Workbook, 1995. Baker Hughes INTEQ
Glowka, D. A., 1987. Development of a Method for Predicting the Performance and Wear
of PDC Drill Bits. Report SAND86-1745, Sandia Natl. Laboratories, New Mexico,
UCS.
Glowka, D.A. and Stone, C.M.,1986. “Effects of Thermal and Mechanical Loading on
PDC Bit Life” SPE Journal.
Fear, M.J., 1999. “How to Improve Rate of Penetration in Field Operations” SPE Journal
14 (1).
Muhammad Hariz, B.M.N., 2014. Optimizing PDC Bit Design Features for Improvement
in Rate of Penetration for Multi-layer Formation. Universiti Teknologi
PETRONAS, Perak, Malaysia.
53
Hareland, G., Yan, W., Nygaard, R., and Wise, J.L., 2009. “Cutting Efficiency of a Single
PDC Cutter on Hard Rock” Journal of Canadian Petroleum Technology, 48 (6).
Henry, T., Corp, A., Sherif, M. and Ahmed Ragheb, 2011. “New PDC Technologies
Increases Durability and Enables Fast Drilling in Hard Abrasive Formation” SPE
Jornal.
IADC Dull Grading System for Fixed Cutter Bits and Roller Cone Bits, 2012. Baker
Hughes Incorporated.
Introduction to PDC bits, 2002. Smith International Inc.
Jain, K.C. and Chitale, A.K., 2010. Textbook of Production Engineering - Theory of Metal
Cutting. PHI Learning Private Limited, New Delhi.
Li, X.H. and Hood, M., 1993. “Wear and damage to PDC bits” SPE Journal.
Motahhari, H.R., 2008. Improved Drilling Efficiency Technique Using Integrated PDM
and PDC Bit Parameters. University of Calgary, Calgary, Alberta.
Rajabov, V., Miska, S., Mortimer, L., Yu, M., and Ozbayoglu, E., 2012. “The Effects of
Back Rake and Side Rake Angles on Mechanical Specific Energy of Single PDC
Cutters with Selected Rocks at Varying Depth of Cuts and Confining Pressures”
SPE Journal.
Tangena, A.G., 1990. A Low Cycle Fatigue Wear Model and Its Application to Layered
Systems.
Tangena, A.G. and Wijhhoven P.J.M., 1988. The Correlation between Mechanical
Stresses and Wear in a Layered System. Wear, 121 p. 27.

54
Warrwn, T.M. and Armegost, W.K., 1988. “Laboratory Drilling Performance of PDC Bits”
SPE Journal.
Yahiaoui, M., Gerbaud, L. Paris, J-Y., Denape, J., and Dourfaye, A., 2012. A Study on
PDC Drill Bits Quality. Ecole Nationale d’Ingénieurs de Tarbes, Tarbes, France.


![ARM-based Flash MCU - produktinfo.conrad.com · 128-Byte RX UART1 PDC Real-time Events PIO High Speed MCI DMA PDC PDC PDC PDC Timer Counter A TC[0..2] UART0 TWCK0 TWD0 TWD1 UTXD0](https://img.pdfslide.us/doc/110x75/5c387e4109d3f23f308b764d/arm-based-flash-mcu-128-byte-rx-uart1-pdc-real-time-events-pio-high-speed.jpg)