Embed Size (px)
Citation preview
Engineering Structures 48 (2013) 281–291
Contents lists available at SciVerse ScienceDirect
Engineering Structures
journal homepage: www.elsevier .com/ locate /engstruct
Effect of local damage on the behavior of a laboratory-scale steeltruss bridge
0141-0296/$ - see front matter � 2012 Elsevier Ltd. All rights reserved.http://dx.doi.org/10.1016/j.engstruct.2012.09.017
⇑ Corresponding author.E-mail address: [email protected] (Y.J. Kim).
Garrett Brunell a, Yail J. Kim b,⇑a Ulteig, Minneapolis, MN 55421, USAb Department of Civil Engineering, University of Colorado Denver, Denver, CO 80217, USA
a r t i c l e i n f o a b s t r a c t
Article history:Received 13 August 2012Revised 13 September 2012Accepted 14 September 2012Available online 24 November 2012
Keywords:DamageTrussRedundancySafety index
This paper presents an investigation into the performance of a steel truss bridge subjected to local dam-age. An experimental program with 16 damage scenarios is conducted to study the behavior of damagedtruss systems. A three-dimensional numerical model is developed to predict the test results. Static anddynamic responses of the damaged trusses are compared with those of the control. Various technicalaspects are studied, including damage quantification using a damage index, load rating, variation of strainenergy, modal analysis, and structural safety based on simple reliability theory. Service performance ofthe truss bridge is significantly influenced by local damage (i.e., damage index >0.5) and the load-carryingcapacity is exponentially reduced with the increased damage index. A high mode shape such as the 4thmode is of use to diagnose local damage in the truss system. The global safety index derived using deflec-tion characteristics is an indicator to indirectly detect the presence of local damage in the system. Stressredistribution among the constituent truss members is found to be insignificant, except for those adja-cent to the damage. The global safety index of the system based on deflection characteristics is an indi-cator to diagnose the presence of local damage. The need for developing a repair method that can addressthe global redundancy of a damaged truss bridge is highlighted.
� 2012 Elsevier Ltd. All rights reserved.
1. Introduction
Deterioration of bridge infrastructure is a critical concern overthe world. According to the American Society of Civil Engineers[1], the average age of bridges in the US is 43 years old as of2010 and an overall grade of C was given to these bridges.Correspondingly, over 25% of bridges in the nation are classifiedas structurally deficient or functionally obsolete. Bridges classifiedby one of these two categories do not operate at their requiredcapacity and require restrictions which impede the public’s useof the bridge. Government agencies spend significant expendituresfor timely maintenance and rehabilitation to address these issues.In many cases, bridge insufficiencies can be attributed to aging,environmental damage, higher levels of demand and load beingrealized by bridges than what they were initially designed for,greater amounts of deicing agents in use, and shortfalls in the ini-tial design. In addition to numerous bridges not meeting currentstandards, catastrophic bridge failure events such as the I-35collapse in Minneapolis, MN, have generated an increased levelof attention towards the issues associated with existing bridges.Hao [2] reported that the I-35W bridge had collapsed because ofexcessive stresses accumulated in local members: inadequate
gusset plate design thickness and member side wall thicknesswhich were insufficient to support service load.
Effort has been made on studying the behavior of constructedtruss bridges. Lenett et al. [3] conducted an inspection project ona three-span truss bridge between Ironton, Ohio and Russell, Ken-tucky. The states of existing and repaired truss members werevisually examined. Strain responses of selected members weremonitored when subjected to known truck loads. Inspection dataprovided crucial information to the rating and posting of thebridge. Azizinamini [4] performed a full-scale load test using adecommissioned truss bridge. Load-carrying capacity of the bridgewas experimentally determined and the mode of failure was ob-served. Local failure of a diagonal tension member initiated abruptfailure of the truss system, highlighting that attention should bepaid to the local behavior of tension members in aged trussbridges. Alampalli and Kunin [5] examined the interaction be-tween the deck and truss system of a rehabilitated 50-year oldbridge. Several load combinations with heavy trucks were usedto measure the response of the bridge. Test results indicated thatthe response of the bridge deck was affected by the local behaviorof truss members. Hickey et al. [6] tested a 260 m truss bridge sit-uated between Pulaski and Hillsville, Virginia using two 25 tontrucks. Deflections and strains were measured and a numericalmodel was developed to predict the test data. Findings includedthat the bridge’s response was characterized by floor beams and
282 G. Brunell, Y.J. Kim / Engineering Structures 48 (2013) 281–291
stringers, and that local failure of truss members was a criticalconsideration.
More specific to truss bridges from a structural redundancy per-spective, Frangopol and Curley [7] identified that truss bridges wereoften classified as either multiple load path (fail-safe structures) orsingle load path (weakest-link structures). The type of classificationdepends on the structure’s ability to find suitable alternative loadpaths when damage is present. Structures that are classified asweakest-link lack system redundancy and therefore when subjectto damage become increasingly more susceptible to failure. Ghosnand Moses [8] proposed methodologies to examine the level ofredundancy in existing truss bridges. Several limit states were de-fined based on ultimate, service, and damage configurations. Sys-tem factors were suggested to evaluate structural redundancyand preliminary design provisions were discussed. Nagavi and Ak-tan [9] categorized trusses as either a light or heavy classification. Atruss system categorized into the light class was composed of pin-ended, solid bar, tension members, and small rolled shapes for com-pression members, while a system classified as the heavy class wasassembled from members of only hot rolled shapes and connectedby riveted gusset plates. Differences in performance between thesetwo classes were predominantly due to the pin-ended connectionin the light class truss where a lack of redundancy created a greaterfailure potential. Kim and Yoon [10] stated that a lack of redun-dancy in steel truss bridges could cause susceptibility to prematurefailure. This is because truss bridges are generally considered to be anon-redundant system as the failure of a single component oftenleads to the successive failure of multiple components and ulti-mately the failure of the entire system.
As discussed above, the global response of a truss bridge is sig-nificantly influenced by the local behavior of constituent members.Most research is concerned with non-destructive load tests ontruss bridges and corresponding responses. Limited informationis available regarding the effect of local damage on the behaviorof a truss system and experimental investigations are particularlyrare. This paper presents an experimental study to examine the re-sponse of a scaled truss bridge having various damage scenarios. Athree-dimensional numerical model was developed and validatedwith test data. The model was further used to expand laboratoryfindings. A simple reliability analysis was carried out to evaluatethe performance of damaged truss bridges.
2. Research significance
Truss bridges intrinsically lack structural redundancy when com-pared to slab-on-girder bridges. Reliability of such a system is signif-icantly influenced by local damage due to the alteration of load path.A catastrophic event may take place if increased distress exceeds thecapacity of a damaged system. The effect of local damage on thebehavior of a truss bridge needs further research. Current practiceand design standards for truss bridges do not explicitly take into con-sideration the interaction between constitutive members and globalresponse. These facts create the need to study the effects that damagehas on steel truss bridges. Although a few numerical investigationshave been conducted to examine the behavior of damaged trussbridges [2,8], experimental effort has been limitedly reported. Of pri-mary concern of this laboratory investigation combined with a mod-eling approach is the change in response of steel truss bridges fromintact to damaged conditions, including static and dynamic behavior.
3. Experimental program
3.1. Material and truss system
A deck-truss bridge scaled to 1:20 (L = 6.2 m) was designedusing different sizes of steel tubes (Grade A36), as shown in
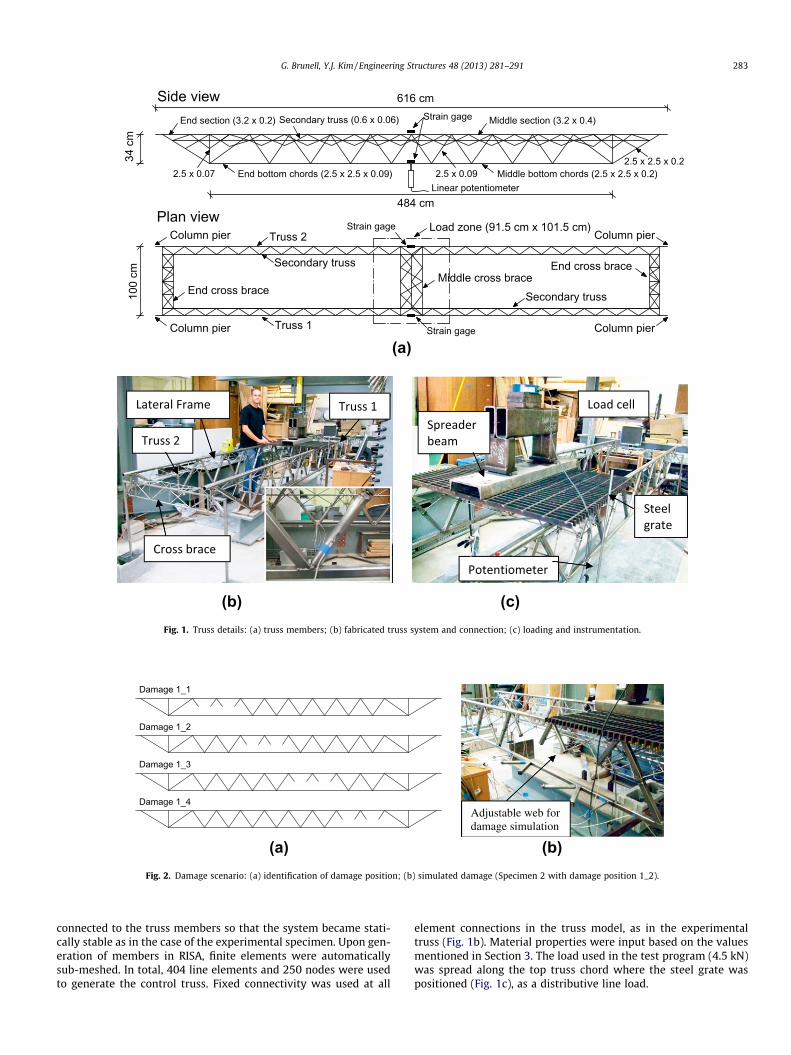
Fig. 1. Similar scale laboratory bridges were tested previously[11–13]. Given highway bridges show elastic behavior in serviceload, the scaled bridge having adjustable web members was ableto simulate various types of damage within an elastic load range(to be discussed). The material and bridge dimensions are dis-played in Fig. 1a. The truss system consisted of two main trusses(Trusses 1 and 2), lateral stiffening frames (secondary truss ele-ments) welded along the top chord of each truss to provide a stabletest environment, cross braces, and leg members. Several pieces oftruss parts comprising these elements were fabricated to form acomplete set of the designed truss bridge (Fig. 1b). The numberof cross braces was minimized during design by addition of the lat-eral frame that would prevent buckling of the top chord on eachtruss. The primary role of the brace members was to maintain sta-bility of the system when loaded. Steel components included thefollowing nominal properties: yield stress (ry) = 290 MPa, elasticmodulus (E) = 200 GPa, and Poissons ratio (t) = 0.3.
3.2. Damage simulation
Damage simulations were generated by removing web ele-ments from the truss. As mentioned in Section 1, local damage indiagonal members is an important consideration. Fig. 2a providesa schematic view of damage configurations. To represent signifi-cant damage in constructed truss bridges, a set of four adjacent ele-ments was removed per damage scenario, as typically shown inFig. 2b. It is worthwhile to note that laboratory research frequentlyassumes more severe damage than that could happen on site [14–16]. A total of 16 damage combinations were designed, dependingupon the location of damaged elements (Table 1). An identificationcode for each damage scenario indicated the location of damage ineither Truss 1 or 2, and the position of the damage within the truss(positions 1, 2, 3, and 4, as shown in Fig. 2a). For example, Speci-men 1_1 denotes that the location of damage was in Truss 1 withposition 1, while Specimens 1_2 and 2_3 calls out Truss 1 withdamage position 2 and Truss 2 with damage position 3.
3.3. Loading and instrumentation
The truss system was monotonically loaded at a typical serviceload of 4.5 kN (i.e., 25% of the predicted capacity of the controltruss). Each test category was loaded five times to ensure thereproducibility of experimental results. A 25 mm thick steel grate(915 mm � 1015 mm) was used near midspan of the truss, asshown in Fig. 1c. To achieve a uniform distribution of load fromthe hydraulic actuator along the length of the grate, a steel channelwas centered at the middle of the grate and spanned the length ofthe grate. Deflection of the test truss was recorded by linear poten-tiometers located at midspan of the truss. Strain gages werebonded to selected members in order to measure axial behavior(Fig. 1a). Structural responses of the control truss and each damagescenario were recorded using the Dataq data acquisition system.
4. Numerical modeling
Modeling the truss bridge was performed using RISA 3-D struc-tural analysis software. A complete three-dimensional model ofthe bridge was used for analysis, including two single span trusses,three cross braces, and four piers, as shown in Fig. 3. The respectiveelement cross section geometries were input into the software’smaterial database where the cross sectional properties were calcu-lated. Boundary conditions were established at the base of eachpier. The degrees of freedom that were restrained at each pierincluded translation in the longitudinal, lateral, and verticaldirections. It should be noted that the pier element was rigidly
616 cm
34cm
484 cm
100
cm
End cross brace
Column pier
Secondary truss
Secondary trussMiddle cross brace
Truss 2
Truss 1Column pier
Column pier
Column pier
End cross brace
Load zone (91.5 cm x 101.5 cm)
Side view
End bottom chords (2.5 x 2.5 x 0.09)2.5 x 0.072.5 x 2.5 x 0.2
2.5 x 0.09 Middle bottom chords (2.5 x 2.5 x 0.2)
Secondary truss (0.6 x 0.06)End section (3.2 x 0.2) Middle section (3.2 x 0.4)
Plan view
Strain gage
Linear potentiometer
Strain gage
Strain gage
(b) (c)
(a)
Fig. 1. Truss details: (a) truss members; (b) fabricated truss system and connection; (c) loading and instrumentation.
Damage 1_1
Damage 1_2
Damage 1_4
Damage 1_3
Adjustable web for damage simulation
(a) (b)Fig. 2. Damage scenario: (a) identification of damage position; (b) simulated damage (Specimen 2 with damage position 1_2).
G. Brunell, Y.J. Kim / Engineering Structures 48 (2013) 281–291 283
connected to the truss members so that the system became stati-cally stable as in the case of the experimental specimen. Upon gen-eration of members in RISA, finite elements were automaticallysub-meshed. In total, 404 line elements and 250 nodes were usedto generate the control truss. Fixed connectivity was used at all
element connections in the truss model, as in the experimentaltruss (Fig. 1b). Material properties were input based on the valuesmentioned in Section 3. The load used in the test program (4.5 kN)was spread along the top truss chord where the steel grate waspositioned (Fig. 1c), as a distributive line load.
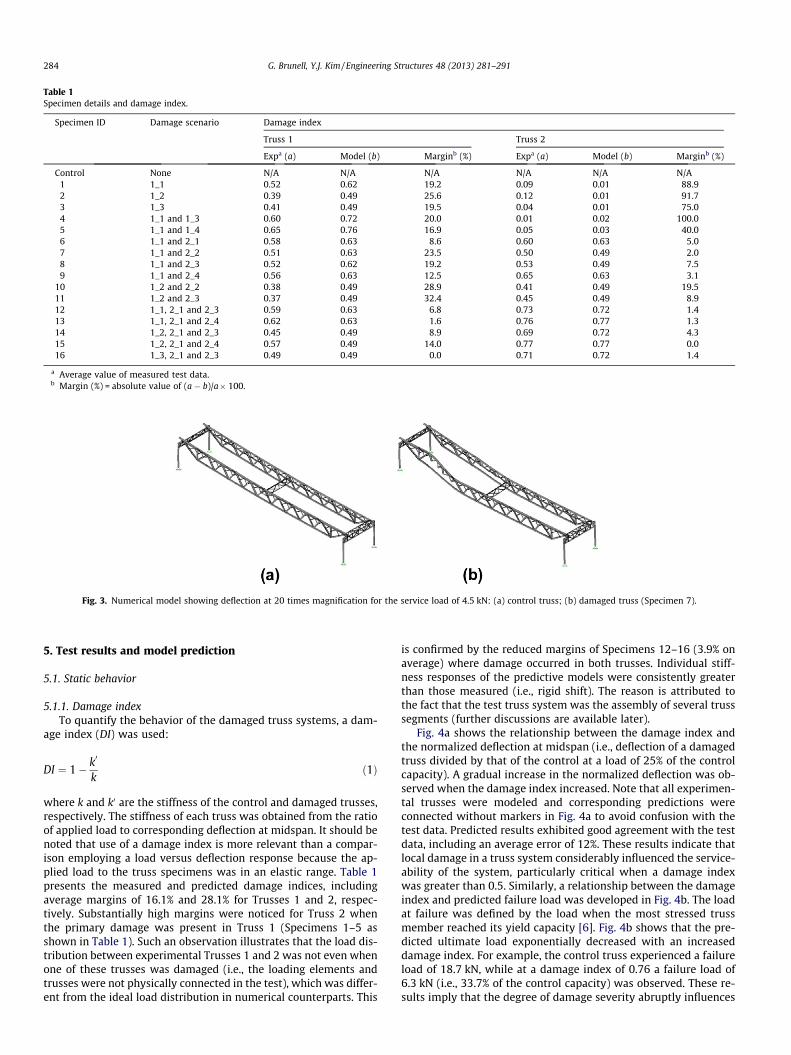
Table 1Specimen details and damage index.
Specimen ID Damage scenario Damage index
Truss 1 Truss 2
Expa (a) Model (b) Marginb (%) Expa (a) Model (b) Marginb (%)
Control None N/A N/A N/A N/A N/A N/A1 1_1 0.52 0.62 19.2 0.09 0.01 88.92 1_2 0.39 0.49 25.6 0.12 0.01 91.73 1_3 0.41 0.49 19.5 0.04 0.01 75.04 1_1 and 1_3 0.60 0.72 20.0 0.01 0.02 100.05 1_1 and 1_4 0.65 0.76 16.9 0.05 0.03 40.06 1_1 and 2_1 0.58 0.63 8.6 0.60 0.63 5.07 1_1 and 2_2 0.51 0.63 23.5 0.50 0.49 2.08 1_1 and 2_3 0.52 0.62 19.2 0.53 0.49 7.59 1_1 and 2_4 0.56 0.63 12.5 0.65 0.63 3.1
10 1_2 and 2_2 0.38 0.49 28.9 0.41 0.49 19.511 1_2 and 2_3 0.37 0.49 32.4 0.45 0.49 8.912 1_1, 2_1 and 2_3 0.59 0.63 6.8 0.73 0.72 1.413 1_1, 2_1 and 2_4 0.62 0.63 1.6 0.76 0.77 1.314 1_2, 2_1 and 2_3 0.45 0.49 8.9 0.69 0.72 4.315 1_2, 2_1 and 2_4 0.57 0.49 14.0 0.77 0.77 0.016 1_3, 2_1 and 2_3 0.49 0.49 0.0 0.71 0.72 1.4
a Average value of measured test data.b Margin (%) = absolute value of (a � b)/a� 100.
Fig. 3. Numerical model showing deflection at 20 times magnification for the service load of 4.5 kN: (a) control truss; (b) damaged truss (Specimen 7).
284 G. Brunell, Y.J. Kim / Engineering Structures 48 (2013) 281–291
5. Test results and model prediction
5.1. Static behavior
5.1.1. Damage indexTo quantify the behavior of the damaged truss systems, a dam-
age index (DI) was used:
DI ¼ 1� k0
kð1Þ
where k and k0 are the stiffness of the control and damaged trusses,respectively. The stiffness of each truss was obtained from the ratioof applied load to corresponding deflection at midspan. It should benoted that use of a damage index is more relevant than a compar-ison employing a load versus deflection response because the ap-plied load to the truss specimens was in an elastic range. Table 1presents the measured and predicted damage indices, includingaverage margins of 16.1% and 28.1% for Trusses 1 and 2, respec-tively. Substantially high margins were noticed for Truss 2 whenthe primary damage was present in Truss 1 (Specimens 1–5 asshown in Table 1). Such an observation illustrates that the load dis-tribution between experimental Trusses 1 and 2 was not even whenone of these trusses was damaged (i.e., the loading elements andtrusses were not physically connected in the test), which was differ-ent from the ideal load distribution in numerical counterparts. This
is confirmed by the reduced margins of Specimens 12–16 (3.9% onaverage) where damage occurred in both trusses. Individual stiff-ness responses of the predictive models were consistently greaterthan those measured (i.e., rigid shift). The reason is attributed tothe fact that the test truss system was the assembly of several trusssegments (further discussions are available later).
Fig. 4a shows the relationship between the damage index andthe normalized deflection at midspan (i.e., deflection of a damagedtruss divided by that of the control at a load of 25% of the controlcapacity). A gradual increase in the normalized deflection was ob-served when the damage index increased. Note that all experimen-tal trusses were modeled and corresponding predictions wereconnected without markers in Fig. 4a to avoid confusion with thetest data. Predicted results exhibited good agreement with the testdata, including an average error of 12%. These results indicate thatlocal damage in a truss system considerably influenced the service-ability of the system, particularly critical when a damage indexwas greater than 0.5. Similarly, a relationship between the damageindex and predicted failure load was developed in Fig. 4b. The loadat failure was defined by the load when the most stressed trussmember reached its yield capacity [6]. Fig. 4b shows that the pre-dicted ultimate load exponentially decreased with an increaseddamage index. For example, the control truss experienced a failureload of 18.7 kN, while at a damage index of 0.76 a failure load of6.3 kN (i.e., 33.7% of the control capacity) was observed. These re-sults imply that the degree of damage severity abruptly influences
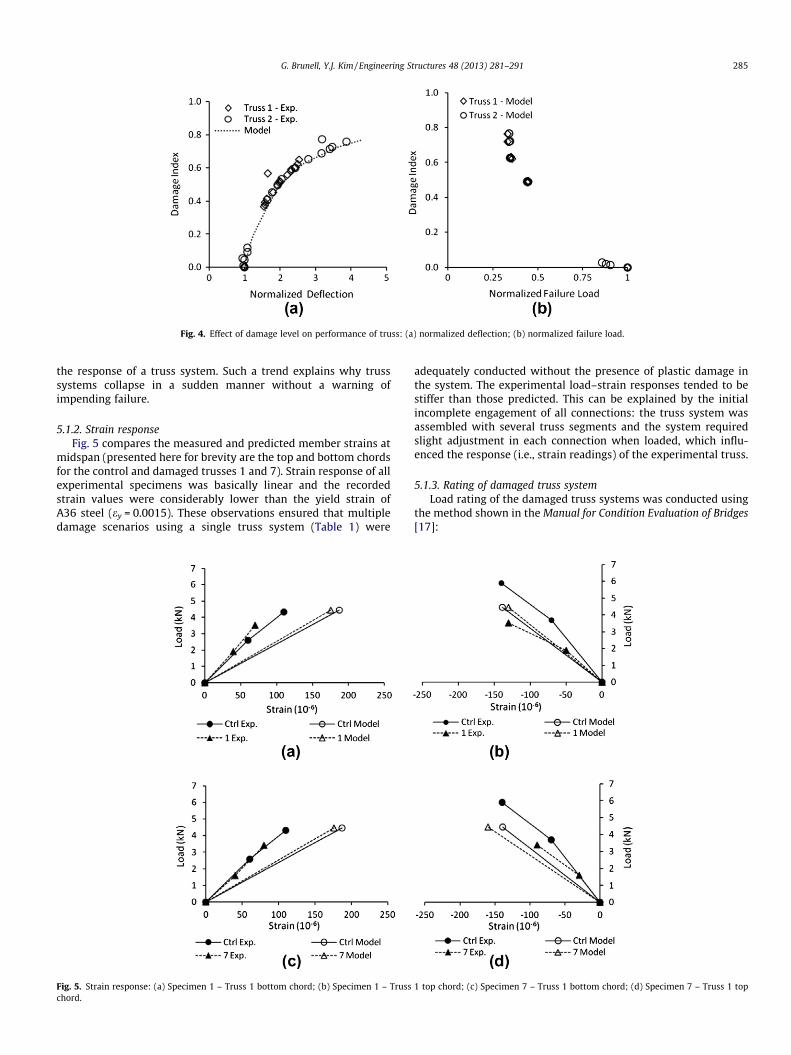
Fig. 4. Effect of damage level on performance of truss: (a) normalized deflection; (b) normalized failure load.
G. Brunell, Y.J. Kim / Engineering Structures 48 (2013) 281–291 285
the response of a truss system. Such a trend explains why trusssystems collapse in a sudden manner without a warning ofimpending failure.
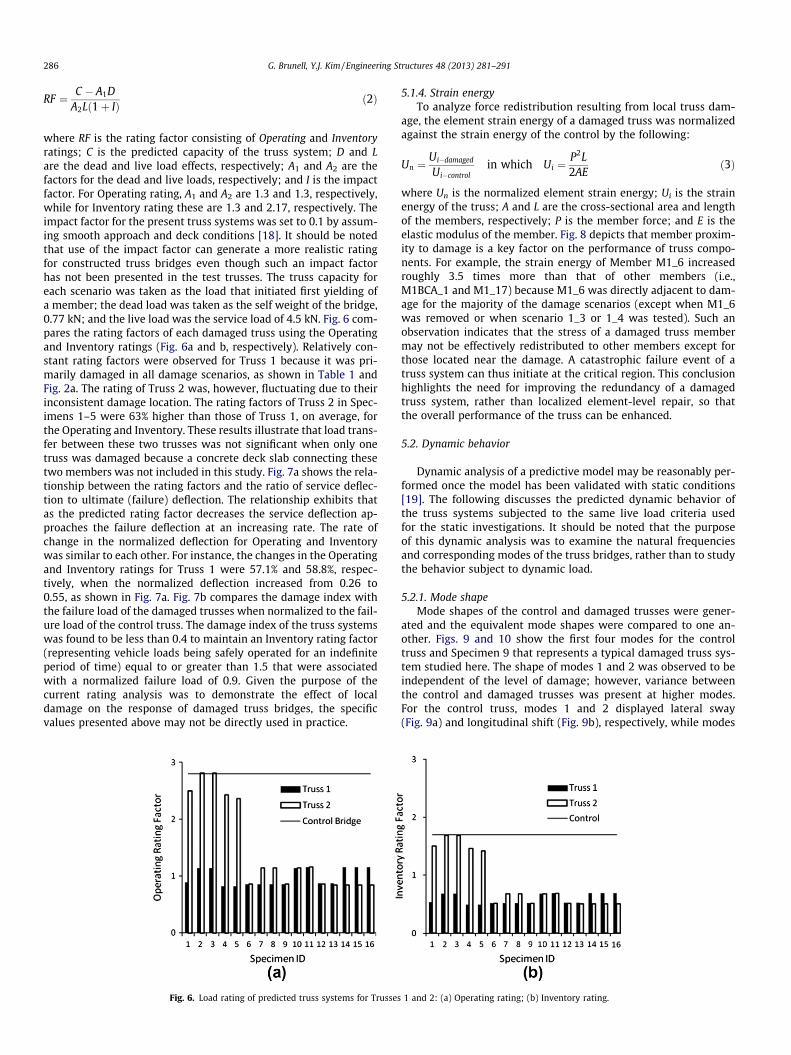
5.1.2. Strain responseFig. 5 compares the measured and predicted member strains at
midspan (presented here for brevity are the top and bottom chordsfor the control and damaged trusses 1 and 7). Strain response of allexperimental specimens was basically linear and the recordedstrain values were considerably lower than the yield strain ofA36 steel (ey = 0.0015). These observations ensured that multipledamage scenarios using a single truss system (Table 1) were
Fig. 5. Strain response: (a) Specimen 1 – Truss 1 bottom chord; (b) Specimen 1 – Trusschord.
adequately conducted without the presence of plastic damage inthe system. The experimental load–strain responses tended to bestiffer than those predicted. This can be explained by the initialincomplete engagement of all connections: the truss system wasassembled with several truss segments and the system requiredslight adjustment in each connection when loaded, which influ-enced the response (i.e., strain readings) of the experimental truss.
5.1.3. Rating of damaged truss systemLoad rating of the damaged truss systems was conducted using
the method shown in the Manual for Condition Evaluation of Bridges[17]:
1 top chord; (c) Specimen 7 – Truss 1 bottom chord; (d) Specimen 7 – Truss 1 top
286 G. Brunell, Y.J. Kim / Engineering Structures 48 (2013) 281–291
RF ¼ C � A1DA2Lð1þ IÞ ð2Þ
where RF is the rating factor consisting of Operating and Inventoryratings; C is the predicted capacity of the truss system; D and Lare the dead and live load effects, respectively; A1 and A2 are thefactors for the dead and live loads, respectively; and I is the impactfactor. For Operating rating, A1 and A2 are 1.3 and 1.3, respectively,while for Inventory rating these are 1.3 and 2.17, respectively. Theimpact factor for the present truss systems was set to 0.1 by assum-ing smooth approach and deck conditions [18]. It should be notedthat use of the impact factor can generate a more realistic ratingfor constructed truss bridges even though such an impact factorhas not been presented in the test trusses. The truss capacity foreach scenario was taken as the load that initiated first yielding ofa member; the dead load was taken as the self weight of the bridge,0.77 kN; and the live load was the service load of 4.5 kN. Fig. 6 com-pares the rating factors of each damaged truss using the Operatingand Inventory ratings (Fig. 6a and b, respectively). Relatively con-stant rating factors were observed for Truss 1 because it was pri-marily damaged in all damage scenarios, as shown in Table 1 andFig. 2a. The rating of Truss 2 was, however, fluctuating due to theirinconsistent damage location. The rating factors of Truss 2 in Spec-imens 1–5 were 63% higher than those of Truss 1, on average, forthe Operating and Inventory. These results illustrate that load trans-fer between these two trusses was not significant when only onetruss was damaged because a concrete deck slab connecting thesetwo members was not included in this study. Fig. 7a shows the rela-tionship between the rating factors and the ratio of service deflec-tion to ultimate (failure) deflection. The relationship exhibits thatas the predicted rating factor decreases the service deflection ap-proaches the failure deflection at an increasing rate. The rate ofchange in the normalized deflection for Operating and Inventorywas similar to each other. For instance, the changes in the Operatingand Inventory ratings for Truss 1 were 57.1% and 58.8%, respec-tively, when the normalized deflection increased from 0.26 to0.55, as shown in Fig. 7a. Fig. 7b compares the damage index withthe failure load of the damaged trusses when normalized to the fail-ure load of the control truss. The damage index of the truss systemswas found to be less than 0.4 to maintain an Inventory rating factor(representing vehicle loads being safely operated for an indefiniteperiod of time) equal to or greater than 1.5 that were associatedwith a normalized failure load of 0.9. Given the purpose of thecurrent rating analysis was to demonstrate the effect of localdamage on the response of damaged truss bridges, the specificvalues presented above may not be directly used in practice.
Fig. 6. Load rating of predicted truss systems for Trusses
5.1.4. Strain energyTo analyze force redistribution resulting from local truss dam-
age, the element strain energy of a damaged truss was normalizedagainst the strain energy of the control by the following:
Un ¼Ui�damaged
Ui�controlin which Ui ¼
P2L2AE
ð3Þ
where Un is the normalized element strain energy; Ui is the strainenergy of the truss; A and L are the cross-sectional area and lengthof the members, respectively; P is the member force; and E is theelastic modulus of the member. Fig. 8 depicts that member proxim-ity to damage is a key factor on the performance of truss compo-nents. For example, the strain energy of Member M1_6 increasedroughly 3.5 times more than that of other members (i.e.,M1BCA_1 and M1_17) because M1_6 was directly adjacent to dam-age for the majority of the damage scenarios (except when M1_6was removed or when scenario 1_3 or 1_4 was tested). Such anobservation indicates that the stress of a damaged truss membermay not be effectively redistributed to other members except forthose located near the damage. A catastrophic failure event of atruss system can thus initiate at the critical region. This conclusionhighlights the need for improving the redundancy of a damagedtruss system, rather than localized element-level repair, so thatthe overall performance of the truss can be enhanced.
5.2. Dynamic behavior
Dynamic analysis of a predictive model may be reasonably per-formed once the model has been validated with static conditions[19]. The following discusses the predicted dynamic behavior ofthe truss systems subjected to the same live load criteria usedfor the static investigations. It should be noted that the purposeof this dynamic analysis was to examine the natural frequenciesand corresponding modes of the truss bridges, rather than to studythe behavior subject to dynamic load.
5.2.1. Mode shapeMode shapes of the control and damaged trusses were gener-
ated and the equivalent mode shapes were compared to one an-other. Figs. 9 and 10 show the first four modes for the controltruss and Specimen 9 that represents a typical damaged truss sys-tem studied here. The shape of modes 1 and 2 was observed to beindependent of the level of damage; however, variance betweenthe control and damaged trusses was present at higher modes.For the control truss, modes 1 and 2 displayed lateral sway(Fig. 9a) and longitudinal shift (Fig. 9b), respectively, while modes
1 and 2: (a) Operating rating; (b) Inventory rating.
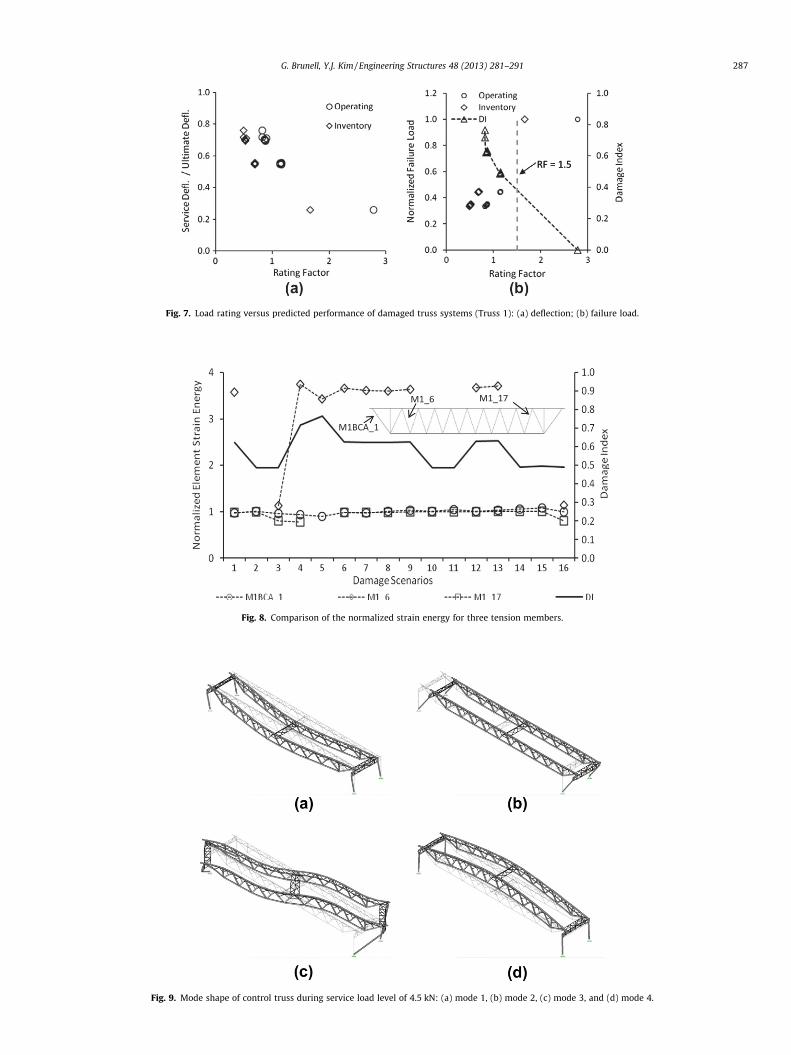
Fig. 7. Load rating versus predicted performance of damaged truss systems (Truss 1): (a) deflection; (b) failure load.
Fig. 8. Comparison of the normalized strain energy for three tension members.
Fig. 9. Mode shape of control truss during service load level of 4.5 kN: (a) mode 1, (b) mode 2, (c) mode 3, and (d) mode 4.
G. Brunell, Y.J. Kim / Engineering Structures 48 (2013) 281–291 287
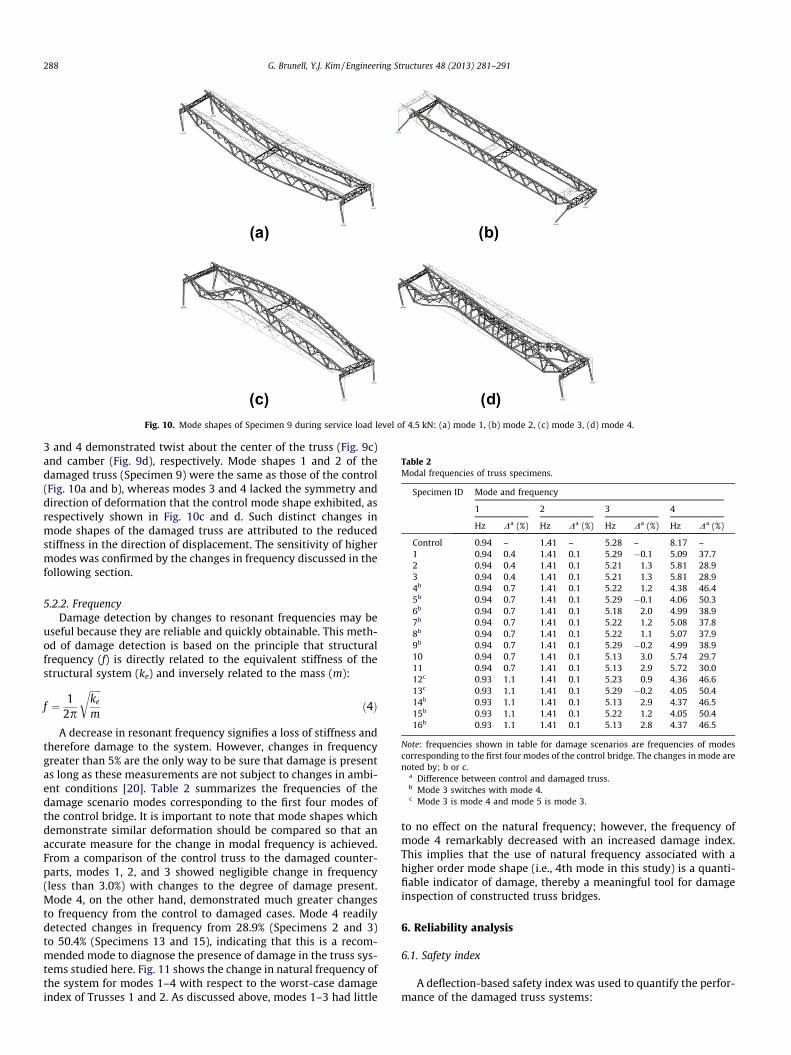
Fig. 10. Mode shapes of Specimen 9 during service load level of 4.5 kN: (a) mode 1, (b) mode 2, (c) mode 3, (d) mode 4.
Table 2Modal frequencies of truss specimens.
Specimen ID Mode and frequency
1 2 3 4
Hz Da (%) Hz Da (%) Hz Da (%) Hz Da (%)
Control 0.94 – 1.41 – 5.28 – 8.17 –1 0.94 0.4 1.41 0.1 5.29 �0.1 5.09 37.72 0.94 0.4 1.41 0.1 5.21 1.3 5.81 28.93 0.94 0.4 1.41 0.1 5.21 1.3 5.81 28.94b 0.94 0.7 1.41 0.1 5.22 1.2 4.38 46.45b 0.94 0.7 1.41 0.1 5.29 �0.1 4.06 50.36b 0.94 0.7 1.41 0.1 5.18 2.0 4.99 38.97b 0.94 0.7 1.41 0.1 5.22 1.2 5.08 37.88b 0.94 0.7 1.41 0.1 5.22 1.1 5.07 37.99b 0.94 0.7 1.41 0.1 5.29 �0.2 4.99 38.910 0.94 0.7 1.41 0.1 5.13 3.0 5.74 29.711 0.94 0.7 1.41 0.1 5.13 2.9 5.72 30.012c 0.93 1.1 1.41 0.1 5.23 0.9 4.36 46.613c 0.93 1.1 1.41 0.1 5.29 �0.2 4.05 50.414b 0.93 1.1 1.41 0.1 5.13 2.9 4.37 46.515b 0.93 1.1 1.41 0.1 5.22 1.2 4.05 50.416b 0.93 1.1 1.41 0.1 5.13 2.8 4.37 46.5
Note: frequencies shown in table for damage scenarios are frequencies of modescorresponding to the first four modes of the control bridge. The changes in mode arenoted by; b or c.
a Difference between control and damaged truss.b Mode 3 switches with mode 4.c Mode 3 is mode 4 and mode 5 is mode 3.
288 G. Brunell, Y.J. Kim / Engineering Structures 48 (2013) 281–291
3 and 4 demonstrated twist about the center of the truss (Fig. 9c)and camber (Fig. 9d), respectively. Mode shapes 1 and 2 of thedamaged truss (Specimen 9) were the same as those of the control(Fig. 10a and b), whereas modes 3 and 4 lacked the symmetry anddirection of deformation that the control mode shape exhibited, asrespectively shown in Fig. 10c and d. Such distinct changes inmode shapes of the damaged truss are attributed to the reducedstiffness in the direction of displacement. The sensitivity of highermodes was confirmed by the changes in frequency discussed in thefollowing section.
5.2.2. FrequencyDamage detection by changes to resonant frequencies may be
useful because they are reliable and quickly obtainable. This meth-od of damage detection is based on the principle that structuralfrequency (f) is directly related to the equivalent stiffness of thestructural system (ke) and inversely related to the mass (m):
f ¼ 12p
ffiffiffiffiffike
m
rð4Þ
A decrease in resonant frequency signifies a loss of stiffness andtherefore damage to the system. However, changes in frequencygreater than 5% are the only way to be sure that damage is presentas long as these measurements are not subject to changes in ambi-ent conditions [20]. Table 2 summarizes the frequencies of thedamage scenario modes corresponding to the first four modes ofthe control bridge. It is important to note that mode shapes whichdemonstrate similar deformation should be compared so that anaccurate measure for the change in modal frequency is achieved.From a comparison of the control truss to the damaged counter-parts, modes 1, 2, and 3 showed negligible change in frequency(less than 3.0%) with changes to the degree of damage present.Mode 4, on the other hand, demonstrated much greater changesto frequency from the control to damaged cases. Mode 4 readilydetected changes in frequency from 28.9% (Specimens 2 and 3)to 50.4% (Specimens 13 and 15), indicating that this is a recom-mended mode to diagnose the presence of damage in the truss sys-tems studied here. Fig. 11 shows the change in natural frequency ofthe system for modes 1–4 with respect to the worst-case damageindex of Trusses 1 and 2. As discussed above, modes 1–3 had little
to no effect on the natural frequency; however, the frequency ofmode 4 remarkably decreased with an increased damage index.This implies that the use of natural frequency associated with ahigher order mode shape (i.e., 4th mode in this study) is a quanti-fiable indicator of damage, thereby a meaningful tool for damageinspection of constructed truss bridges.
6. Reliability analysis
6.1. Safety index
A deflection-based safety index was used to quantify the perfor-mance of the damaged truss systems:
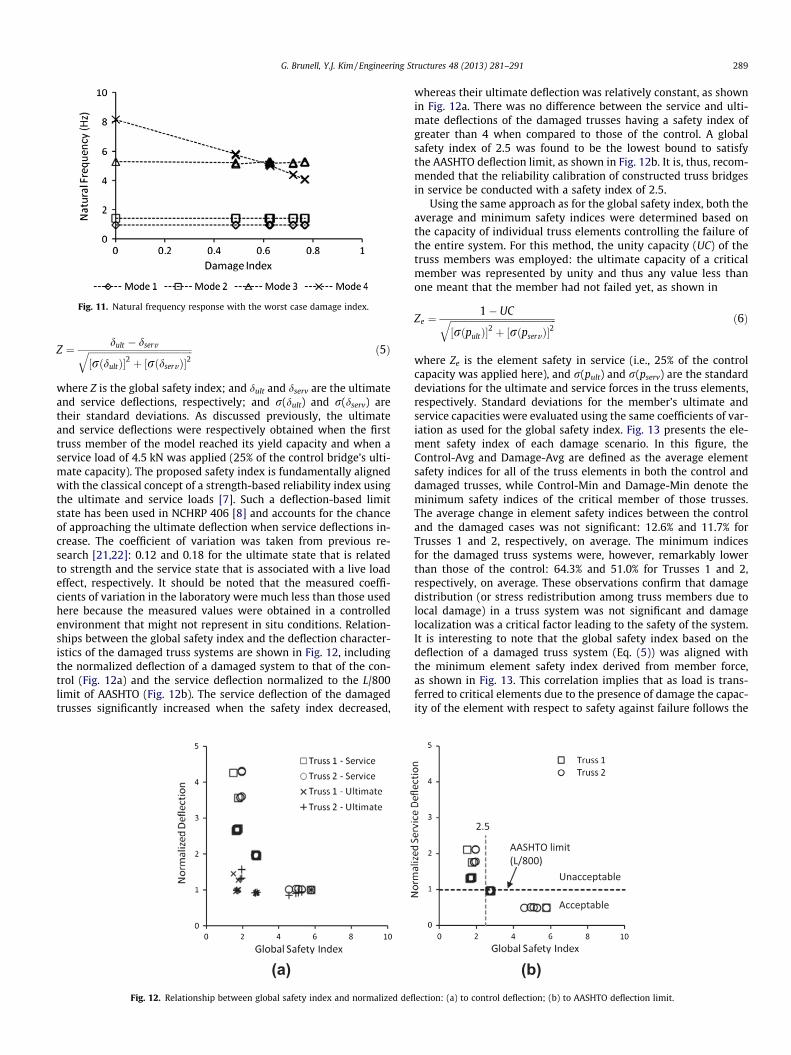
Fig. 11. Natural frequency response with the worst case damage index.
G. Brunell, Y.J. Kim / Engineering Structures 48 (2013) 281–291 289
Z ¼ dult � dservffiffiffiffiffiffiffiffiffiffiffiffiffiffiffiffiffiffiffiffiffiffiffiffiffiffiffiffiffiffiffiffiffiffiffiffiffiffiffiffiffiffiffiffiffi½rðdultÞ�2 þ ½rðdservÞ�2
q ð5Þ
where Z is the global safety index; and dult and dserv are the ultimateand service deflections, respectively; and r(dult) and r(dserv) aretheir standard deviations. As discussed previously, the ultimateand service deflections were respectively obtained when the firsttruss member of the model reached its yield capacity and when aservice load of 4.5 kN was applied (25% of the control bridge’s ulti-mate capacity). The proposed safety index is fundamentally alignedwith the classical concept of a strength-based reliability index usingthe ultimate and service loads [7]. Such a deflection-based limitstate has been used in NCHRP 406 [8] and accounts for the chanceof approaching the ultimate deflection when service deflections in-crease. The coefficient of variation was taken from previous re-search [21,22]: 0.12 and 0.18 for the ultimate state that is relatedto strength and the service state that is associated with a live loadeffect, respectively. It should be noted that the measured coeffi-cients of variation in the laboratory were much less than those usedhere because the measured values were obtained in a controlledenvironment that might not represent in situ conditions. Relation-ships between the global safety index and the deflection character-istics of the damaged truss systems are shown in Fig. 12, includingthe normalized deflection of a damaged system to that of the con-trol (Fig. 12a) and the service deflection normalized to the L/800limit of AASHTO (Fig. 12b). The service deflection of the damagedtrusses significantly increased when the safety index decreased,
(a)Fig. 12. Relationship between global safety index and normalized defl
whereas their ultimate deflection was relatively constant, as shownin Fig. 12a. There was no difference between the service and ulti-mate deflections of the damaged trusses having a safety index ofgreater than 4 when compared to those of the control. A globalsafety index of 2.5 was found to be the lowest bound to satisfythe AASHTO deflection limit, as shown in Fig. 12b. It is, thus, recom-mended that the reliability calibration of constructed truss bridgesin service be conducted with a safety index of 2.5.
Using the same approach as for the global safety index, both theaverage and minimum safety indices were determined based onthe capacity of individual truss elements controlling the failure ofthe entire system. For this method, the unity capacity (UC) of thetruss members was employed: the ultimate capacity of a criticalmember was represented by unity and thus any value less thanone meant that the member had not failed yet, as shown in
Ze ¼1� UCffiffiffiffiffiffiffiffiffiffiffiffiffiffiffiffiffiffiffiffiffiffiffiffiffiffiffiffiffiffiffiffiffiffiffiffiffiffiffiffiffiffiffiffiffiffi
½rðpultÞ�2 þ ½rðpservÞ�
2q ð6Þ
where Ze is the element safety in service (i.e., 25% of the controlcapacity was applied here), and r(pult) and r(pserv) are the standarddeviations for the ultimate and service forces in the truss elements,respectively. Standard deviations for the member’s ultimate andservice capacities were evaluated using the same coefficients of var-iation as used for the global safety index. Fig. 13 presents the ele-ment safety index of each damage scenario. In this figure, theControl-Avg and Damage-Avg are defined as the average elementsafety indices for all of the truss elements in both the control anddamaged trusses, while Control-Min and Damage-Min denote theminimum safety indices of the critical member of those trusses.The average change in element safety indices between the controland the damaged cases was not significant: 12.6% and 11.7% forTrusses 1 and 2, respectively, on average. The minimum indicesfor the damaged truss systems were, however, remarkably lowerthan those of the control: 64.3% and 51.0% for Trusses 1 and 2,respectively, on average. These observations confirm that damagedistribution (or stress redistribution among truss members due tolocal damage) in a truss system was not significant and damagelocalization was a critical factor leading to the safety of the system.It is interesting to note that the global safety index based on thedeflection of a damaged truss system (Eq. (5)) was aligned withthe minimum element safety index derived from member force,as shown in Fig. 13. This correlation implies that as load is trans-ferred to critical elements due to the presence of damage the capac-ity of the element with respect to safety against failure follows the
(b)ection: (a) to control deflection; (b) to AASHTO deflection limit.
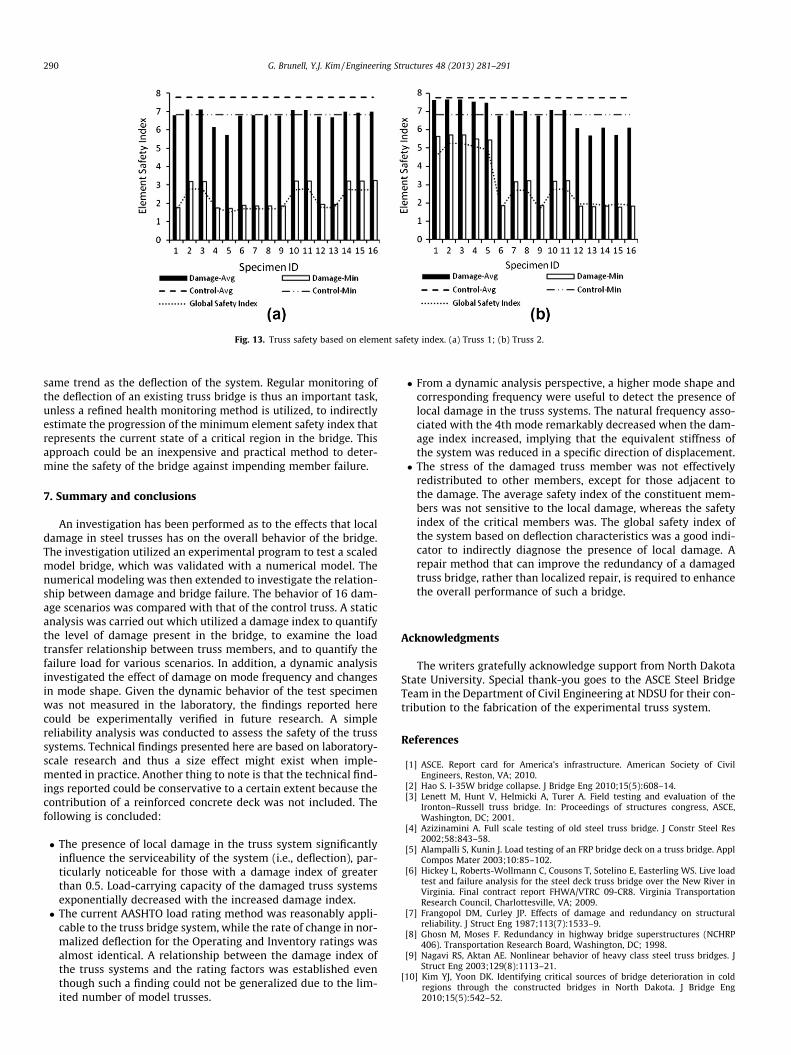
Fig. 13. Truss safety based on element safety index. (a) Truss 1; (b) Truss 2.
290 G. Brunell, Y.J. Kim / Engineering Structures 48 (2013) 281–291
same trend as the deflection of the system. Regular monitoring ofthe deflection of an existing truss bridge is thus an important task,unless a refined health monitoring method is utilized, to indirectlyestimate the progression of the minimum element safety index thatrepresents the current state of a critical region in the bridge. Thisapproach could be an inexpensive and practical method to deter-mine the safety of the bridge against impending member failure.
7. Summary and conclusions
An investigation has been performed as to the effects that localdamage in steel trusses has on the overall behavior of the bridge.The investigation utilized an experimental program to test a scaledmodel bridge, which was validated with a numerical model. Thenumerical modeling was then extended to investigate the relation-ship between damage and bridge failure. The behavior of 16 dam-age scenarios was compared with that of the control truss. A staticanalysis was carried out which utilized a damage index to quantifythe level of damage present in the bridge, to examine the loadtransfer relationship between truss members, and to quantify thefailure load for various scenarios. In addition, a dynamic analysisinvestigated the effect of damage on mode frequency and changesin mode shape. Given the dynamic behavior of the test specimenwas not measured in the laboratory, the findings reported herecould be experimentally verified in future research. A simplereliability analysis was conducted to assess the safety of the trusssystems. Technical findings presented here are based on laboratory-scale research and thus a size effect might exist when imple-mented in practice. Another thing to note is that the technical find-ings reported could be conservative to a certain extent because thecontribution of a reinforced concrete deck was not included. Thefollowing is concluded:
� The presence of local damage in the truss system significantlyinfluence the serviceability of the system (i.e., deflection), par-ticularly noticeable for those with a damage index of greaterthan 0.5. Load-carrying capacity of the damaged truss systemsexponentially decreased with the increased damage index.� The current AASHTO load rating method was reasonably appli-
cable to the truss bridge system, while the rate of change in nor-malized deflection for the Operating and Inventory ratings wasalmost identical. A relationship between the damage index ofthe truss systems and the rating factors was established eventhough such a finding could not be generalized due to the lim-ited number of model trusses.
� From a dynamic analysis perspective, a higher mode shape andcorresponding frequency were useful to detect the presence oflocal damage in the truss systems. The natural frequency asso-ciated with the 4th mode remarkably decreased when the dam-age index increased, implying that the equivalent stiffness ofthe system was reduced in a specific direction of displacement.� The stress of the damaged truss member was not effectively
redistributed to other members, except for those adjacent tothe damage. The average safety index of the constituent mem-bers was not sensitive to the local damage, whereas the safetyindex of the critical members was. The global safety index ofthe system based on deflection characteristics was a good indi-cator to indirectly diagnose the presence of local damage. Arepair method that can improve the redundancy of a damagedtruss bridge, rather than localized repair, is required to enhancethe overall performance of such a bridge.
Acknowledgments
The writers gratefully acknowledge support from North DakotaState University. Special thank-you goes to the ASCE Steel BridgeTeam in the Department of Civil Engineering at NDSU for their con-tribution to the fabrication of the experimental truss system.
References
[1] ASCE. Report card for America’s infrastructure. American Society of CivilEngineers, Reston, VA; 2010.
[2] Hao S. I-35W bridge collapse. J Bridge Eng 2010;15(5):608–14.[3] Lenett M, Hunt V, Helmicki A, Turer A. Field testing and evaluation of the
Ironton–Russell truss bridge. In: Proceedings of structures congress, ASCE,Washington, DC; 2001.
[4] Azizinamini A. Full scale testing of old steel truss bridge. J Constr Steel Res2002;58:843–58.
[5] Alampalli S, Kunin J. Load testing of an FRP bridge deck on a truss bridge. ApplCompos Mater 2003;10:85–102.
[6] Hickey L, Roberts-Wollmann C, Cousons T, Sotelino E, Easterling WS. Live loadtest and failure analysis for the steel deck truss bridge over the New River inVirginia. Final contract report FHWA/VTRC 09-CR8. Virginia TransportationResearch Council, Charlottesville, VA; 2009.
[7] Frangopol DM, Curley JP. Effects of damage and redundancy on structuralreliability. J Struct Eng 1987;113(7):1533–9.
[8] Ghosn M, Moses F. Redundancy in highway bridge superstructures (NCHRP406). Transportation Research Board, Washington, DC; 1998.
[9] Nagavi RS, Aktan AE. Nonlinear behavior of heavy class steel truss bridges. JStruct Eng 2003;129(8):1113–21.
[10] Kim YJ, Yoon DK. Identifying critical sources of bridge deterioration in coldregions through the constructed bridges in North Dakota. J Bridge Eng2010;15(5):542–52.

G. Brunell, Y.J. Kim / Engineering Structures 48 (2013) 281–291 291
[11] Matsuda K, Cooper KR, Tanaka H, Tokushige M, Iwasaki T. An investigation ofReynolds number effects on the steady and unsteady aerodynamic forces on a1:10 scale bridge deck section model. J Wind Eng 2001;89:619–32.
[12] Eckhoff EC, Eller VM, Watkinis SE, Hall RH. Interactive virtual laboratory forexperience with a smart bridge test. In: Proceedings of the 2002 Americansociety for engineering education annual conference and exposition, Montreal,QC, Canada; 2002.
[13] Bilello C, Bergman LA, Kuchma DK. Experimental investigation of a small-scalebridge model under a moving mass. J Struct Eng 2004;130(5):799–804.
[14] Stallings JM, Cousins TE, Stafford TE. Removal of diaphragms from three spansteel girder bridge. J Bridge Eng 1999;4(1):63–70.
[15] Eamon CD, Nowak AS. Effect of secondary elements on bridge structuralsystem reliability considering moment capacity. Struct Saf 2004;26:29–47.
[16] Shaat A, Fam A. Repair of cracked steel girders connected to concrete slabs usingcarbon–fiber-reinforced polymer sheets. J Compos Constr 2008;12(6):650–9.
[17] AASHTO. Manual for condition evaluation of bridges (2003 interim revisions).American Association of State Highway and Transportation Officials,Washington, DC; 2003.
[18] AASHTO. Guide specifications for strength evaluation of existing steel andconcrete bridges. American Association of State Highway and TransportationOfficials, Washington, DC; 1989.
[19] Zein AS, Gassman SL. Frequency spectrum analysis of impact-echo waveformsfor T-beams. J Bridge Eng 2010;15(6):705–14.
[20] Salawu OS. Detection of structural damage through changes in frequency: areview. Eng Struct 1997;19(9):718–23.
[21] Nowak AS. Calibration of LRFD bridge design code. NCHRP report 12-33.Transportation Research Board, Washington, DC; 1993.
[22] Nowak AS. Calibration of LRFD bridge code. J Struct Eng 1995;121(8):1245–51.