Embed Size (px)
Citation preview

The University of Manchester Research
Effect of load models on angular and frequency stability oflow inertia power networksDOI:10.1049/iet-gtd.2018.5542
Document VersionAccepted author manuscript
Link to publication record in Manchester Research Explorer
Citation for published version (APA):Adrees, A., & Milanovic, J. V. (2018). Effect of load models on angular and frequency stability of low inertia powernetworks. IET Generation, Transmission and Distribution. https://doi.org/10.1049/iet-gtd.2018.5542
Published in:IET Generation, Transmission and Distribution
Citing this paperPlease note that where the full-text provided on Manchester Research Explorer is the Author Accepted Manuscriptor Proof version this may differ from the final Published version. If citing, it is advised that you check and use thepublisher's definitive version.
General rightsCopyright and moral rights for the publications made accessible in the Research Explorer are retained by theauthors and/or other copyright owners and it is a condition of accessing publications that users recognise andabide by the legal requirements associated with these rights.
Takedown policyIf you believe that this document breaches copyright please refer to the University of Manchester’s TakedownProcedures [http://man.ac.uk/04Y6Bo] or contact [email protected] providingrelevant details, so we can investigate your claim.
Download date:03. Dec. 2020
ACCEPTED VERSION OF THE PAPER
1
Effect of Load Models on Angular and Frequency Stability of Low Inertia Power Networks
Atia Adrees 1, J V. Milanović 1*
1 School of Electrical and Electronic Engineering, The University of Manchester, Manchester, M60 1QD, UK *[email protected]
Abstract: This paper presents a thorough analysis of the effect of load models on frequency response, small and large disturbance stability of the power system, in order to identify the type of stability exhibiting the most sensitivity to load models, and for each type of studied stability, to pinpoint the load model that has the worst effect. The presented analysis shows clearly that transient stability is the most sensitive to load models. The number of unstable cases varies considerably with each type of studied load model. The effect of the load model magnifies with the reduction in headroom of synchronous generators. The results of the frequency response of the system following an active power disturbance demonstrate that the influence of constant power loads on the frequency response of the system can be significant if the system is operating with the reduced primary frequency response at high load. High integration of RES increases the variation in the damping of electromechanical modes due to increased uncertainties, and a high proportion of induction machines can reduce the damping of inter-area modes considerably, making a well stable mode unstable for certain operating points. The influence of load models has been illustrated using 68 bus NETS-NYPS system with 30% and 52% penetration of renewable energy sources.
List of Abbreviations and Symbols
RES Renewable generation sources
SG Synchronous generator
ZL Constant impedance load
PL Constant power load
PfL Constant power load with frequency dependence
ZIP ZIP load model
Cmp Composite load model
PDF Probability distribution function
FRT Fault ride through
fnadir Frequency nadir
RoCoF Rate of change of frequency
DFIG Doubly fed induction generator
FCC Full converter connected
1. Introduction
It has been recognized by both industry and academia
that load characteristics have a significant influence on both
steady-state and dynamic performance of power systems. A
lot of work has been done in the area of load modelling over
past decades [1-4].
The effect of load models (dynamic, composite and
exponential) and their parameters on the damping of
electromechanical modes has been widely studied and
reported in [5-7]. The results of time domain simulation
analysis of field measurements data of the Taiwan power
system showed that in the case of unstable low-frequency
oscillations event, a dynamic load model gives the largest
oscillation, followed by the composite load model and then
the exponential load model [5].
Although, it is well known that load characteristics
can have a significant effect on the rates of acceleration or
deceleration of individual generators during the fault and,
therefore, on the eventual stability of the system [8], very
few studies have discussed the impact of load models on
transient stability [8, 9].
The effect of load models on frequency stability is
completely unexplored. It is general practice in frequency
ACCEPTED VERSION OF THE PAPER
2
stability studies to look at the collective performance of all
generators in the network. The effects of the system loads
are lumped into a single damping constant D. The speed of
the equivalent generator represents the system frequency
[10-12].
The proliferation of wind and solar power generation
in electric power networks in various countries around the
world indicates that these are the fastest growing renewable
technologies [13, 14]. These renewable energy sources (RES)
are characterized by a converter connected interface, their
intermittency, and non-controllable behaviour. The
converted connected RES does not contribute to system
inertia and affects the dynamic behaviour of the power
system in a way that is different from conventional
synchronous generators (SG) following a disturbance. SG
can supply high short circuit currents to the fault location
and hold the voltage in the power system so that the low
voltage area is reduced [15]. Like a STATCOM, the line
side converter can regulate its terminal voltage by injecting
reactive currents independently of the active power.
However, the maximum reactive currents are limited by the
maximum rating of the converter [16]. The high integration
of RES affects power flows, voltage, and frequency in
power networks. Loads have always had a degree of
uncertainty associated with them that will further diversify
in the future due to the proliferation of the electric vehicle.
The high integration of RES in power networks adds another
layer of uncertainty resulting in increased uncertainties in
power system operations. A number of studies are
performed to assess the impact of the increased penetration
of RES on grid frequency and angular stability of the system
[13, 14, 17-19]. Authors previous works included
frameworks to estimate the critical inertia limits for grid
frequency and effect of renewable penetrations on transient
stability [20, 21]. The extent of the influence of load models
on angular stability, and the frequency response of the
power system with increased uncertainties and changed
dynamic behaviour due to RES, is entirely unexplored. The
paper aims to provide a thorough analysis of the impact of
load characteristics on frequency and angular stability of
power systems with a high proportion of RES. The studies
identify the load types which lead to the most optimistic and
the most pessimistic results for each type of stability. Finally,
the paper identifies the type of stability that is most sensitive
to load models in power systems with a high proportion of
RES.
2. Load Models
Existing load models can be broadly grouped into two
categories –static and dynamic. Further details on load
modelling and load models can be found in [1]. The studies
within this work are performed with the most frequently
used models in industrial practice [4] and are briefly
discussed below:-
2.1 Static load models
Static load models describe the relationship between
active and reactive power consumed by the load as an
algebraic function of voltage and frequency.
2.1.1 Exponential load model:
The most frequently used static load model is the
exponential load model [22], given by (1)
𝑃 = 𝑃𝑛 (𝑈
𝑈𝑛
)𝑘𝑝𝑢
(𝑓
𝑓𝑛
)𝑘𝑝𝑓
(1)
𝑄 = 𝑄𝑛 (𝑈
𝑈𝑛
)𝑘𝑞𝑢
(𝑓
𝑓𝑛
)𝑘𝑞𝑓
(2)
Where P and Q are the real and reactive power drawn by
the load at voltage U and frequency f. Pn and Qn are the real
and reactive power drawn at rated voltage Un and nominal
frequency fn. The exponents kpu, kqu, kpf, and kqf describe the
changes in load demand in response to variations in the
supply voltage and grid frequency. The effect of constant
power (PL) and constant impedance (ZL) load models are
studied within this work. The sensitivity of the load to
frequency and voltage is determined usually by continuously
measured data (data captured at a high sampling rate)”. The
details can be found in [1].
2.1.2 ZIP model:
Another static load model frequently used is the
second-order polynomial model. The variant with frequency
dependence neglected
𝑃 = 𝑃𝑛 [𝑝1 (𝑈
𝑈𝑛
)2
+ 𝑝2 (𝑈
𝑈𝑛
) + 𝑝3]
(3)
𝑄 = 𝑄𝑛 [𝑞1 (𝑈
𝑈𝑛
)2
+ 𝑞2 (𝑈
𝑈𝑛
) + 𝑞3] (4)
The parameters p1 and q1 represent the relative
participation of constant impedance, p2 and q2 correspond to
the relative participation of constant current load, and p3 and
q3 represent the relative participation of constant power load.
2.2 Dynamic load models
Dynamic loads exhibit time-dependent responses which
are determined by the previous conditions of both the
system and the load itself. The exponential dynamic load
model, the transfer function model of the induction motor
and the dynamic model of an induction motor, are the most
commonly used dynamic models [1]. The exponential
dynamic load model is typically used when the proportion of
residential load in the total load is significant, and the
participation of induction motors in the load mix is small
[23, 24]. The load at most bulk buses is a combination of
different static and dynamic devices; especially at buses that
supply industrial load, hence a model should incorporate
both static and induction model components [25]. A
composite load model consisting of an induction motor in
parallel with static load is used to represent this type of load
in this work [25]. In some countries, in particular those that
are economically well developed, participation of induction
motors in the total load demand can be 60-70% [1],
therefore, a composite load model combining static –
dynamic (30% - 70%) is used.
3. Methodology
The framework to assess the effect of load models
considering the uncertainties in low inertia system is
presented in Fig. 1. In order to study the effect of load
ACCEPTED VERSION OF THE PAPER
3
models on frequency and angular stability of the system, a
dynamic model of the test network, including RES units, is
developed in DIgSILENT/PowerFactory. The loads are
represented by ZL model. Uncertainty in wind and PV
power generation and load forecast are sampled using
appropriate probability distribution functions (pdfs), and
optimal power flow (OPF) is performed to determine the
power dispatches of SG. Finally, the simulations are
performed by introducing an active power disturbance in the
system, and grid frequency at all synchronous generation
buses, and the buses connected to tie-lines are recorded.
Frequency nadir fnadir and RoCoF are calculated in each
simulation.
Sampling of uncertainties in RES generation and load forecast
Run OPF
Power system dynamic model with 30% RES
Monte Carlo simulationsWith active power disturbance
Monte Carlo simulationsWith three phase fault
Monte Carlo simulations (eigenvalue analysis)
Obtain Rotor anglesObtain eigenvlaues
Constant impedance load model(Z)
Obtain frequency
fnadir & ROCOF
Change load model
Damping of inter-area modes No of unstable cases
Load model with the highest number of unstable cases
Load model with the least damping of inter_area modes
Load model with biggest drop in frequency
Power system dynamic model with 52% RES
No of unstable cases with 52% RES
fnadir & ROCOF with 52% RES
Damping of inter-area modesWith 52 % RES
Fig. 1: Flowchart of the methodology
For transient stability analysis the same set of
uncertainties in RES generation and load forecast is used.
The fault location is modelled using a uniform distribution
which means that the probability of fault on the lines in the
test network is the same. A normal distribution with a mean
value of 11cycles and a standard deviation of 6.67% is used
to model the fault duration. The rotor angles of each
generator are stored as the output of each simulation and are
used to calculate the number of unstable cases.
To study the effect of load models on small
disturbance stability, eigenvalue analysis is performed with
the same uncertainties in RES generation and load forecast.
The frequencies and damping of all electromechanical
modes are recorded in each simulation.
Once the performance of the network with the ZL
model is established, the load model is changed to constant
power, frequency response and rotor angle stability analysis
is performed again. It is to be noted that the uncertainties in
RES power generation and load forecast remains the same
with each load model. The process is iterated for the ZIP
and composite load models.
The results for individual load models are compared
for frequency and rotor angle stability. The load model
exhibiting the biggest drop in frequency is selected to
perform the frequency analysis with a high penetration of
RES. The load model leading to the highest number of
unstable cases is selected for transient stability, and the load
model resulting in the most reduction in damping of
electromechanical modes is chosen for small disturbance
stability.
The penetration of RES is increased to 52 % in the
network. Uncertainty in wind and PV power generation and
load forecast are sampled again, and optimal power flow
(OPF) is performed to determine the power dispatches of SG.
The frequency response and rotor angle stability analysis is
performed with a constant impedance model and selected
load models.
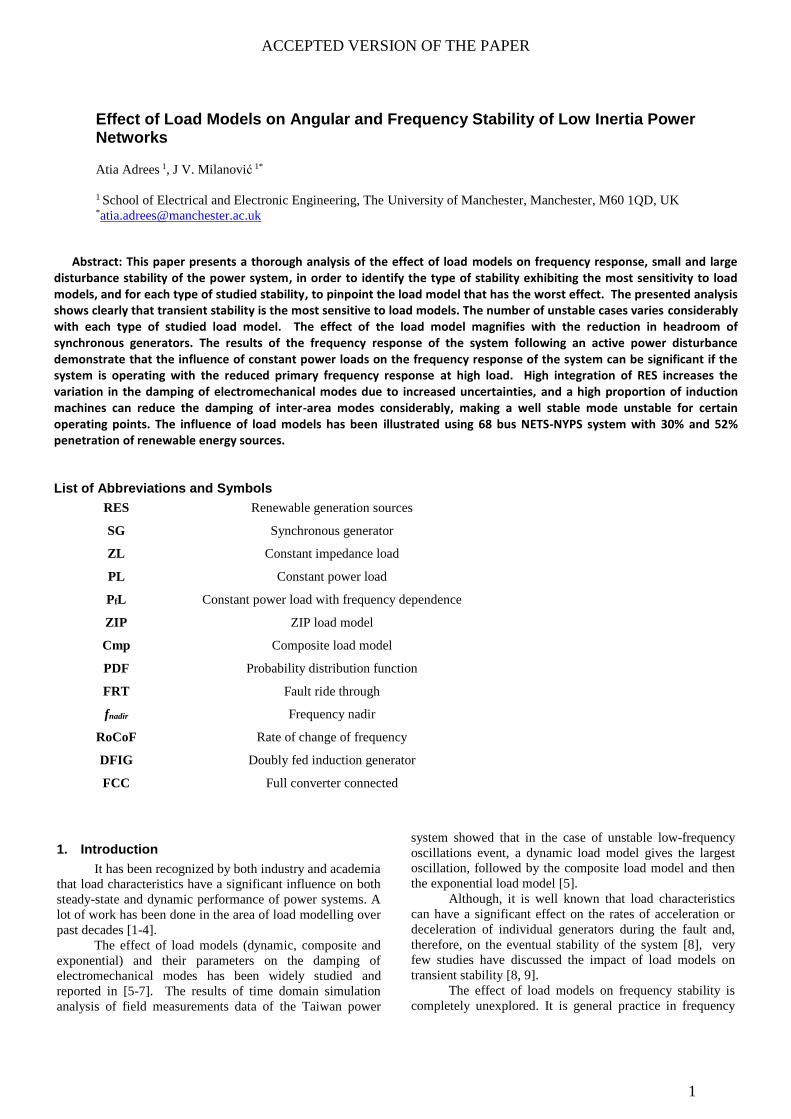
4. Test system
The test system within this work is the modified
version of the reduced order equivalent model of the New
England Test System (NETS) and the New York Power
System (NYPS) [26]. The network consists of five areas,
NETS (G1-G9), NYPS (G10-G13) and three distinct areas
represented by G14, G15, and G16. All generators, except
for generator G9, are under slow excitation (IEEE DC1A).
G9 is equipped with a fast-acting static exciter (IEEE STIA)
and power system stabilizer (PSS). All generators in the
network are equipped with governor systems. SGs are
represented by sixth order models. Transmission lines are
modelled with the standard π circuits.
G7
G6 G4
G5 G3 G2
G8 G1
G9
G16
G15
G14
G12 G13
G11
G10
NEW ENGLAND TEST SYSTEM NEW YORK POWER SYSTEM
9
29
28
26 25
8
54
1 53
47
48 40
10
31
46
49
1130
32
33
34
61
36
12
17
1343
44
39
4535 51
50
60
59
57
5552
27
37
3 2
4
57
6
22
21
23
68
24
20
19
62
6563
5864
6667 56
16
18
15
42
14
41
L44
L43
L71
L66
L69
L41
L42
L45
38
Fig. 2: Modified IEEE 68 bus system
The conventional part of the network is adopted from
[26]. Seven RES units are connected to the buses shown in
Fig. 2. The buses for the connection of RES are chosen to
have a minimum effect on power flows and the voltage
profile of the network. The load parameters are taken from
[1].
4.1 RES Models
A generic type 3 model is used in this paper to
represent DFIGs. The structure of the model is similar to the
one proposed by WECC and IEC [27, 28], and is available
in DIgSILENT – PowerFactory. It takes into account the
aerodynamic part and the shaft of the wind turbine generator
(WTG) as well as the pitch control of the blades. The rotor
side converter controller is modelled, including relevant
limitations, ramp rates and protection mechanisms, such as
the crowbar. The DFIG is represented by a typical 2nd order
model of an induction machine neglecting the stator
transients and including the mechanical equation [22]. The
rotor side converter controls the voltage in the rotor as in
[29]. Therefore, the model represents all the relevant parts
that influence the dynamic behaviour of DFIGs.
A type 4 wind generator model is used to represent
all full converted connected (FCC) units. Both wind
generators and PV units can be represented by a type 4
model in stability studies since the converter decouples the
dynamics of the generator [29, 30]. This is also suggested by
the WECC Renewable Energy Modeling Task Force [30].
ACCEPTED VERSION OF THE PAPER
4
Both DFIGs and FCC are handled as aggregated
units. All RES units have Fault Ride Through (FRT)
capabilities and remain connected during the fault. The
amount of connected RES for each area of the system, i.e.,
the installed capacity of RES, is given as a percentage of the
total installed conventional generation capacity of that area
before adding any RES. Eigenvalue analysis and all
dynamic simulations are performed using DIgSILENT –
PowerFactory software. All dynamic simulations are RMS
simulations.
4.2 Modelling of uncertainties
4.2.1 Uncertainty in load forecast:
The uncertainty in the load forecast is represented by a
normal distribution, with a standard deviation of 3.34%,
around the nominal operating point.
4.2.2 Uncertainty in wind and PV generation:
A Weibull distribution with α=2.2 & β=11.1 is used
to account for the uncertainty in the output power of the
wind farm. It is assumed that all PV plants follow a beta
distribution with a=13.7 and b= 1.3.
(Note: Other distributions including conditional loading or
historical data can be used to represent load, wind, and PV
power generation uncertainties without loss of generality of
the proposed approach.)
In order to establish the viable operating point of the
system, the distributions are sampled separately for each
load, wind and solar plant in a similar manner as [31]. After
considering the uncertainties, an optimal load flow solution
is then used to determine the corresponding output of SG.
4.2.3 Uncertainty in fault location and fault duration:
A uniform distribution is used to model fault location
which means that the probability of fault on the lines in the
test network is the same. A normal distribution with a mean
value of 11cycles and standard deviation of 6.67% is used to
model the fault duration.
4.3 Case studies
CS I: 30% SG is replaced by RES in NETS and
NYPS area. The average inertia of the system is 6.8 s1.
CS II: In CS I network, the load is reduced to 40%. 2/3 rd reduction in load is balanced by disconnecting SG
and 1/3 by de-loading SG. The penetration level increases to
52% (in NETS and NYPS area) and the average inertia of
the system reduces to 2.86 s.
CS III: In CS I network (30% RES), the load of the
network is reduced to 40%. All reduction in load is met by
de-loading SG. Hence, the inertia of the system remains the
same as in CS I, but PFR is increased by 8 times, due to
increased headroom of SGS, in CS III.
CS IV: In CS II network, the governors of G14 and
G16 are blocked. This reduces PFR to nearly the same
1 Including UK, many other countries have a binding target of 30% final
energy consumption from RES by 2020. Therefore, 30% proportion of RES
is used as a base case
amount as in CS I. The inertia of the system stays the same
as it is in CS II.
CS I is repeated with each type of model with the
same uncertainties for frequency response and rotor angle
stability of the system. CS II is performed only with ZL and
the load model showing the most significant change in
performance parameter, i.e., frequency nadir, number of
unstable cases, damping of electromechanical modes.
CS I differs from CS II in three aspects:- i) The
average headroom of SGs in CS II is increased by 1.4 times
than the average headroom of SGs in CS I. Hence primary
frequency response (PFR) is increased. ii) In CS II, the total
load in the network is 40% of the load in CS I iii) CS II has
lower inertia than CS I.
To clarify that the variation in the effect of the load
model due to PFR, CS III and CS IV, are developed.
Table 1 summarises CS performed within the paper.
Table 1: Case studies performed within this paper CS Load Model
Frequency stability
Small disturbance
stability
Large disturbance stability
CS I ZL, PL, PfL, ZIP and CMP
ZL, PL, PfL, ZIP and CMP
CS I: ZL, PL, PfL, ZIP and CMP
CS II ZL & PL ZL, CMP ZL &PL
CS III ZL, PL - -
CS IV ZL, PL - -
5. Results and analysis
5.1 Frequency stability
An active power disturbance of 800 MW which is 3%
of the peak load of 26.8 GW is introduced. Due to modelled
uncertainties in RES generation and load forecast, the
disturbance varies by ±10%. Frequency nadir (the minimum
frequency) fnadir and the rate of change of frequency
(RoCoF), following the disturbance, are recorded on each
bus directly connected to tie-lines and synchronous
generation buses. It is important to note fnadir is not
significantly different on the buses in the NETS and NYPS
area. Since the disturbance is introduced in the NETS area
and L41 is transferring the highest power, fnadir and RoCoF
results at bus 60 are discussed throughout this work.
49.5 49.6 49.7 49.8 49.9
0
50
100
150
Frequency nadir [Hz]
Pro
bability
Dis
trib
utio
n
ZL
PL
Pf L
ZIP
Cmp
0.06 0.08 0.1 0.12 0.14 0.16 0.18 0.2
0
100
200
300
ROCOF[Hz/s]
Pro
babi
lity
Dis
trib
utio
n
ZL
PL
Pf L
ZIP
Cmp
(a)
(b)
A
ACCEPTED VERSION OF THE PAPER
5
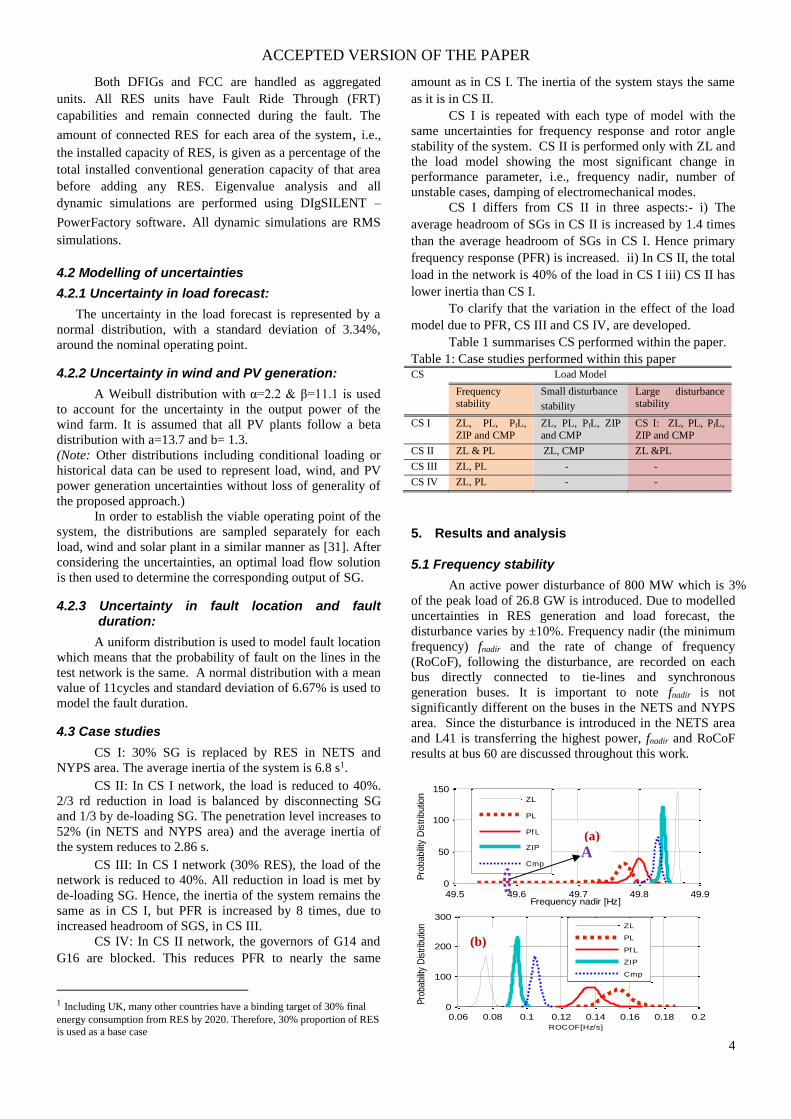
Fig. 3: 30% RES in the system (a) Effect of load models on
fnadir (b) Effect of load model on RoCoF
Fig. 3 (a) shows pdfs of fnadir with each type of
studied load model, and Table 2 summarizes the statistical
analysis of Fig. 3 (a). fnadir is governed by system inertia,
the amount of generation lost and governor response. In
each simulation, the inertia of the system stays the same.
However, the size of the disturbance varies by ±10% due to
modelled uncertainties in RES generation and load forecast.
The headroom of generators also varies due to the variation
in load and RES power generation.
Table 2: Statistical analysis of Fig. 3 Mean Range Constant Impedance (ZL) 49.86 0.027
Constant Power(PL) 49.78 0.28
Constant Power with frequency dependence(PfL) 49.8 0.103 [ZIP] 49.83 0.035
Composite load (static+ induction machine)(Cmp)
49.82 0.057
By looking at (Table 2) mean values of pdfs, it can be
observed that the largest drop in fnadir is observed with the
PL model. The mode of pdf of fnadir with PL occurs at 49.78
Hz, and the pdf spread is 0.28; fnadir varies between 49.82 Hz
- 49.54 Hz. When frequency dependence is added in loads,
the mode shifts to 49.8 Hz and spread of pdf reduces to
0.103. The mode of fnadir pdf shifts to 49.82 Hz when all
loads are represented by the composite load model. The
composite load model consists of 30% static load and 70%
dynamic (induction machine) load. Induction machines add
inertia to the system; their speed reduces as frequency drops.
This improves fnadir, and the spread of frequency nadir pdf
becomes 0.057. Further improvement in frequency nadir
pdf is observed when all the loads in the network are
represented by the ZIP model. The mode of the pdf moves to
49.83 Hz and the range of pdf becomes 0.035. The mode of
pdf with ZL shows the smallest drop, as expected, fnadir
improves to 49.86 Hz, the pdf becomes very narrow, and the
range becomes 0.027. Constant impedance loads reduce the
active power consumption as the bus voltage deviates below
1 pu and increase power consumption when the volatge
increases above per unit, hence, providing damping to
frequency excursions.
The RoCoF is directly proportional to the active
power disturbance and inversely proportional to the inertia
of the system. The RoCoF measured within tens of ms after
the disturbance is the same with each type of load model.
However, it starts to vary as the measurement time increases.
The RoCoF presented in Fig. 3 (b) is measured after 20
cycles. It can be observed that there is a small variation in
RoCoF due to different types of load model. The smallest
values of RoCoF occur with the ZL load model and the
largest with the PL model.
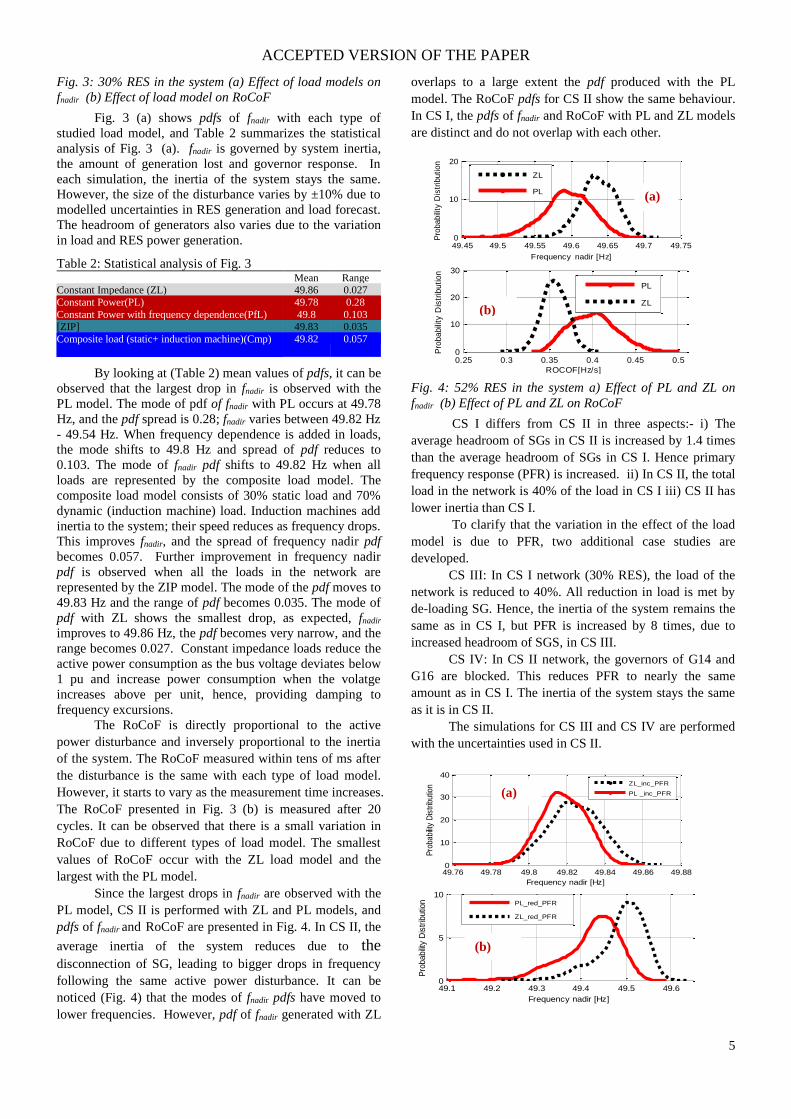
Since the largest drops in fnadir are observed with the
PL model, CS II is performed with ZL and PL models, and
pdfs of fnadir and RoCoF are presented in Fig. 4. In CS II, the
average inertia of the system reduces due to the disconnection of SG, leading to bigger drops in frequency
following the same active power disturbance. It can be
noticed (Fig. 4) that the modes of fnadir pdfs have moved to
lower frequencies. However, pdf of fnadir generated with ZL
overlaps to a large extent the pdf produced with the PL
model. The RoCoF pdfs for CS II show the same behaviour.
In CS I, the pdfs of fnadir and RoCoF with PL and ZL models
are distinct and do not overlap with each other.
Fig. 4: 52% RES in the system a) Effect of PL and ZL on
fnadir (b) Effect of PL and ZL on RoCoF
CS I differs from CS II in three aspects:- i) The
average headroom of SGs in CS II is increased by 1.4 times
than the average headroom of SGs in CS I. Hence primary
frequency response (PFR) is increased. ii) In CS II, the total
load in the network is 40% of the load in CS I iii) CS II has
lower inertia than CS I.
To clarify that the variation in the effect of the load
model is due to PFR, two additional case studies are
developed.
CS III: In CS I network (30% RES), the load of the
network is reduced to 40%. All reduction in load is met by
de-loading SG. Hence, the inertia of the system remains the
same as in CS I, but PFR is increased by 8 times, due to
increased headroom of SGS, in CS III.
CS IV: In CS II network, the governors of G14 and
G16 are blocked. This reduces PFR to nearly the same
amount as in CS I. The inertia of the system stays the same
as it is in CS II.
The simulations for CS III and CS IV are performed
with the uncertainties used in CS II.
49.45 49.5 49.55 49.6 49.65 49.7 49.750
10
20
Frequency nadir [Hz]
Pro
bab
ility
Dis
trib
ution
ZL
PL
0.25 0.3 0.35 0.4 0.45 0.50
10
20
30
ROCOF[Hz/s]
Pro
bab
ility
Dis
trib
ution
PL
ZL
49.76 49.78 49.8 49.82 49.84 49.86 49.880
10
20
30
40
Frequency nadir [Hz]
Pro
babilit
y D
istr
ibutio
n
ZL_inc_PFR
PL _inc_PFR
49.1 49.2 49.3 49.4 49.5 49.60
5
10
Frequency nadir [Hz]
Pro
bability
Dis
trib
utio
n
PL_red_PFR
ZL_red_PFR
(a)
(b)
(a)
(b)
ACCEPTED VERSION OF THE PAPER
6
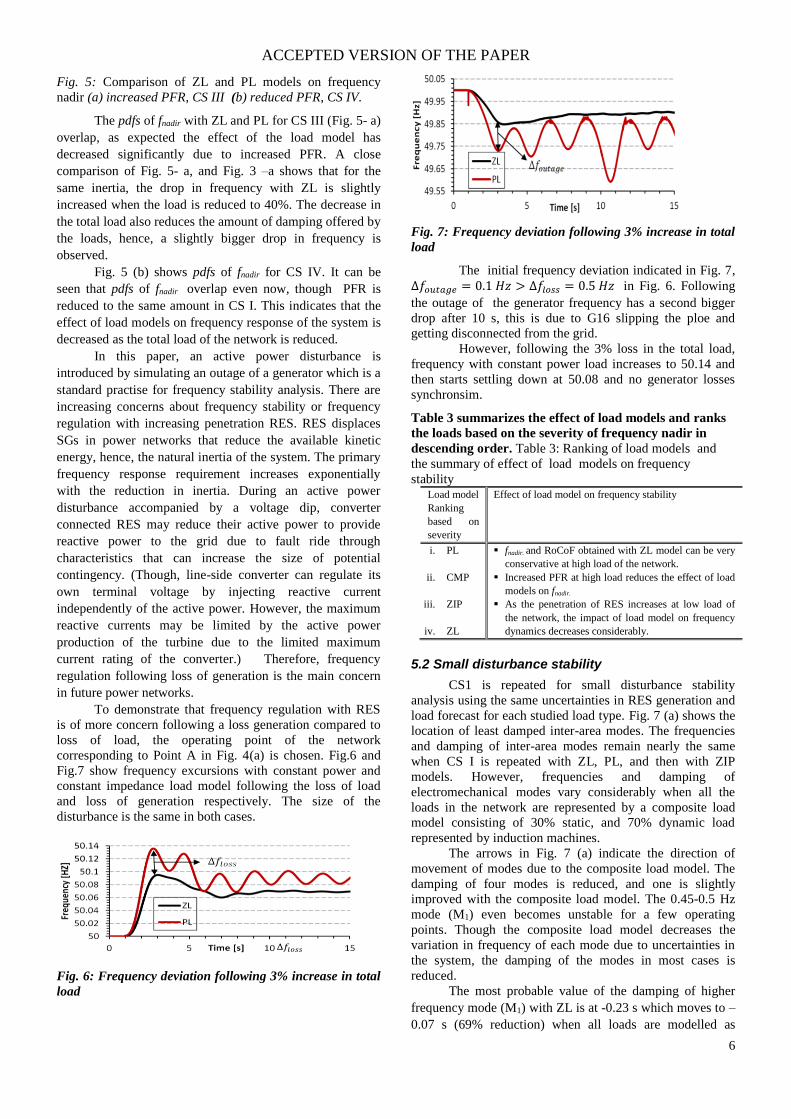
Fig. 5: Comparison of ZL and PL models on frequency
nadir (a) increased PFR, CS III (b) reduced PFR, CS IV.
The pdfs of fnadir with ZL and PL for CS III (Fig. 5- a)
overlap, as expected the effect of the load model has
decreased significantly due to increased PFR. A close
comparison of Fig. 5- a, and Fig. 3 –a shows that for the
same inertia, the drop in frequency with ZL is slightly
increased when the load is reduced to 40%. The decrease in
the total load also reduces the amount of damping offered by
the loads, hence, a slightly bigger drop in frequency is
observed.
Fig. 5 (b) shows pdfs of fnadir for CS IV. It can be
seen that pdfs of fnadir overlap even now, though PFR is
reduced to the same amount in CS I. This indicates that the
effect of load models on frequency response of the system is
decreased as the total load of the network is reduced.
In this paper, an active power disturbance is
introduced by simulating an outage of a generator which is a
standard practise for frequency stability analysis. There are
increasing concerns about frequency stability or frequency
regulation with increasing penetration RES. RES displaces
SGs in power networks that reduce the available kinetic
energy, hence, the natural inertia of the system. The primary
frequency response requirement increases exponentially
with the reduction in inertia. During an active power
disturbance accompanied by a voltage dip, converter
connected RES may reduce their active power to provide
reactive power to the grid due to fault ride through
characteristics that can increase the size of potential
contingency. (Though, line-side converter can regulate its
own terminal voltage by injecting reactive current
independently of the active power. However, the maximum
reactive currents may be limited by the active power
production of the turbine due to the limited maximum
current rating of the converter.) Therefore, frequency
regulation following loss of generation is the main concern
in future power networks.
To demonstrate that frequency regulation with RES
is of more concern following a loss generation compared to
loss of load, the operating point of the network
corresponding to Point A in Fig. 4(a) is chosen. Fig.6 and
Fig.7 show frequency excursions with constant power and
constant impedance load model following the loss of load
and loss of generation respectively. The size of the
disturbance is the same in both cases.
Fig. 6: Frequency deviation following 3% increase in total
load
Fig. 7: Frequency deviation following 3% increase in total
load
The initial frequency deviation indicated in Fig. 7,
∆𝑓𝑜𝑢𝑡𝑎𝑔𝑒 = 0.1 𝐻𝑧 > ∆𝑓𝑙𝑜𝑠𝑠 = 0.5 𝐻𝑧 in Fig. 6. Following
the outage of the generator frequency has a second bigger
drop after 10 s, this is due to G16 slipping the ploe and
getting disconnected from the grid.
However, following the 3% loss in the total load,
frequency with constant power load increases to 50.14 and
then starts settling down at 50.08 and no generator losses
synchronsim.
Table 3 summarizes the effect of load models and ranks
the loads based on the severity of frequency nadir in
descending order. Table 3: Ranking of load models and
the summary of effect of load models on frequency
stability Load model
Ranking
based on
severity
Effect of load model on frequency stability
i. PL
ii. CMP
iii. ZIP
iv. ZL
▪ fnadir. and RoCoF obtained with ZL model can be very
conservative at high load of the network.
▪ Increased PFR at high load reduces the effect of load
models on fnadir.
▪ As the penetration of RES increases at low load of
the network, the impact of load model on frequency
dynamics decreases considerably.
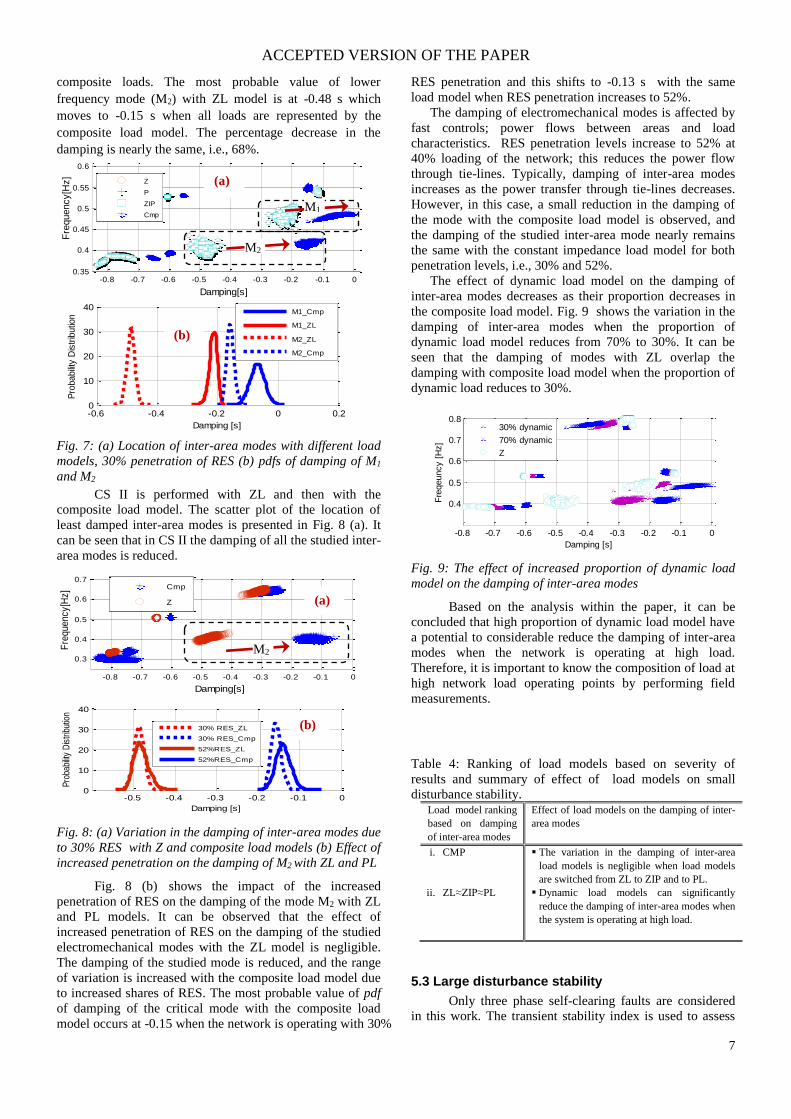
5.2 Small disturbance stability
CS1 is repeated for small disturbance stability
analysis using the same uncertainties in RES generation and
load forecast for each studied load type. Fig. 7 (a) shows the
location of least damped inter-area modes. The frequencies
and damping of inter-area modes remain nearly the same
when CS I is repeated with ZL, PL, and then with ZIP
models. However, frequencies and damping of
electromechanical modes vary considerably when all the
loads in the network are represented by a composite load
model consisting of 30% static, and 70% dynamic load
represented by induction machines. The arrows in Fig. 7 (a) indicate the direction of
movement of modes due to the composite load model. The
damping of four modes is reduced, and one is slightly
improved with the composite load model. The 0.45-0.5 Hz
mode (M1) even becomes unstable for a few operating
points. Though the composite load model decreases the
variation in frequency of each mode due to uncertainties in
the system, the damping of the modes in most cases is
reduced.
The most probable value of the damping of higher
frequency mode (M1) with ZL is at -0.23 s which moves to –
0.07 s (69% reduction) when all loads are modelled as
ACCEPTED VERSION OF THE PAPER
7
composite loads. The most probable value of lower
frequency mode (M2) with ZL model is at -0.48 s which
moves to -0.15 s when all loads are represented by the
composite load model. The percentage decrease in the
damping is nearly the same, i.e., 68%.
Fig. 7: (a) Location of inter-area modes with different load
models, 30% penetration of RES (b) pdfs of damping of M1
and M2
CS II is performed with ZL and then with the
composite load model. The scatter plot of the location of
least damped inter-area modes is presented in Fig. 8 (a). It
can be seen that in CS II the damping of all the studied inter-
area modes is reduced.
Fig. 8: (a) Variation in the damping of inter-area modes due
to 30% RES with Z and composite load models (b) Effect of
increased penetration on the damping of M2 with ZL and PL
Fig. 8 (b) shows the impact of the increased
penetration of RES on the damping of the mode M2 with ZL
and PL models. It can be observed that the effect of
increased penetration of RES on the damping of the studied
electromechanical modes with the ZL model is negligible.
The damping of the studied mode is reduced, and the range
of variation is increased with the composite load model due
to increased shares of RES. The most probable value of pdf
of damping of the critical mode with the composite load
model occurs at -0.15 when the network is operating with 30%
RES penetration and this shifts to -0.13 s with the same
load model when RES penetration increases to 52%.
The damping of electromechanical modes is affected by
fast controls; power flows between areas and load
characteristics. RES penetration levels increase to 52% at
40% loading of the network; this reduces the power flow
through tie-lines. Typically, damping of inter-area modes
increases as the power transfer through tie-lines decreases.
However, in this case, a small reduction in the damping of
the mode with the composite load model is observed, and
the damping of the studied inter-area mode nearly remains
the same with the constant impedance load model for both
penetration levels, i.e., 30% and 52%.
The effect of dynamic load model on the damping of
inter-area modes decreases as their proportion decreases in
the composite load model. Fig. 9 shows the variation in the
damping of inter-area modes when the proportion of
dynamic load model reduces from 70% to 30%. It can be
seen that the damping of modes with ZL overlap the
damping with composite load model when the proportion of
dynamic load reduces to 30%.
Fig. 9: The effect of increased proportion of dynamic load
model on the damping of inter-area modes
Based on the analysis within the paper, it can be
concluded that high proportion of dynamic load model have
a potential to considerable reduce the damping of inter-area
modes when the network is operating at high load.
Therefore, it is important to know the composition of load at
high network load operating points by performing field
measurements.
Table 4: Ranking of load models based on severity of
results and summary of effect of load models on small
disturbance stability. Load model ranking
based on damping
of inter-area modes
Effect of load models on the damping of inter-
area modes
i. CMP
ii. ZL≈ZIP≈PL
▪ The variation in the damping of inter-area
load models is negligible when load models
are switched from ZL to ZIP and to PL.
▪ Dynamic load models can significantly
reduce the damping of inter-area modes when
the system is operating at high load.
5.3 Large disturbance stability
Only three phase self-clearing faults are considered
in this work. The transient stability index is used to assess
-0.8 -0.7 -0.6 -0.5 -0.4 -0.3 -0.2 -0.1 00.35
0.4
0.45
0.5
0.55
0.6
Damping[s]
Fre
quency[H
z]
Z
P
ZIP
Cmp
-0.6 -0.4 -0.2 0 0.20
10
20
30
40
Damping [s]
Pro
bability
Dis
trib
utio
n
M1_Cmp
M1_ZL
M2_ZL
M2_Cmp
-0.8 -0.7 -0.6 -0.5 -0.4 -0.3 -0.2 -0.1 0
0.3
0.4
0.5
0.6
0.7
Damping[s]
Fre
quency[H
z]
Cmp
Z
-0.5 -0.4 -0.3 -0.2 -0.1 00
10
20
30
40
Damping [s]
Pro
babi
lity
Dis
trib
utio
n
30% RES_ZL
30% RES_Cmp
52%RES_ZL
52%RES_Cmp
-0.8 -0.7 -0.6 -0.5 -0.4 -0.3 -0.2 -0.1 0
0.4
0.5
0.6
0.7
0.8
Damping [s]
Fre
qeuncy [
Hz]
30% dynamic
70% dynamic
Z
M2
M1
M2
(a)
(a)
(b)
(b)
ACCEPTED VERSION OF THE PAPER
8
the effect of load models on large disturbance rotor angle
stability.
𝑇𝑆𝐼𝑖 =360 − 𝛿𝑚𝑎𝑥,𝑖
360 + 𝛿𝑚𝑎𝑥,𝑖
(5)
Where δmax,i is the maximum separation between the
rotor angles of any two generators. This index provides a
general overview of overall system dynamic behaviour for
the specific contingency. Negative values of the index
indicate that the separation between the rotor angles of at
least two generators is greater than 360 degrees and the
system is unstable.
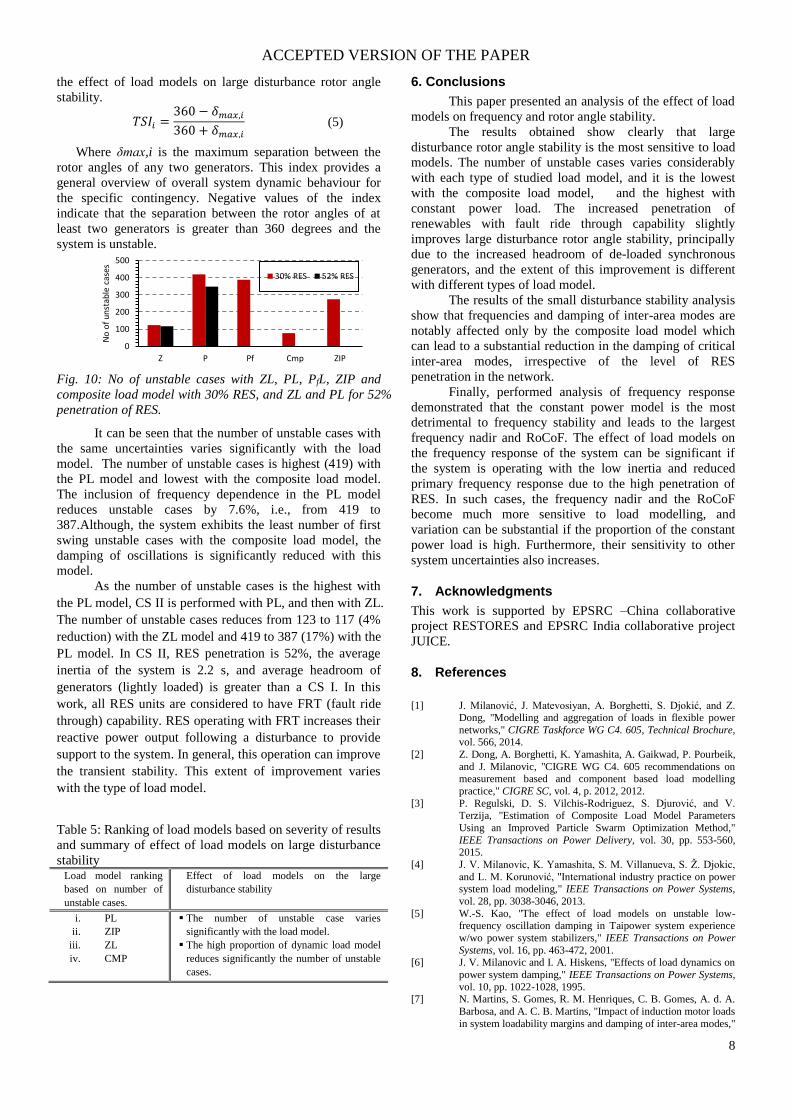
Fig. 10: No of unstable cases with ZL, PL, PfL, ZIP and
composite load model with 30% RES, and ZL and PL for 52%
penetration of RES.
It can be seen that the number of unstable cases with
the same uncertainties varies significantly with the load
model. The number of unstable cases is highest (419) with
the PL model and lowest with the composite load model.
The inclusion of frequency dependence in the PL model
reduces unstable cases by 7.6%, i.e., from 419 to
387.Although, the system exhibits the least number of first
swing unstable cases with the composite load model, the
damping of oscillations is significantly reduced with this
model.
As the number of unstable cases is the highest with
the PL model, CS II is performed with PL, and then with ZL.
The number of unstable cases reduces from 123 to 117 (4%
reduction) with the ZL model and 419 to 387 (17%) with the
PL model. In CS II, RES penetration is 52%, the average
inertia of the system is 2.2 s, and average headroom of
generators (lightly loaded) is greater than a CS I. In this
work, all RES units are considered to have FRT (fault ride
through) capability. RES operating with FRT increases their
reactive power output following a disturbance to provide
support to the system. In general, this operation can improve
the transient stability. This extent of improvement varies
with the type of load model.
Table 5: Ranking of load models based on severity of results
and summary of effect of load models on large disturbance
stability Load model ranking
based on number of
unstable cases.
Effect of load models on the large
disturbance stability
i. PL
ii. ZIP
iii. ZL
iv. CMP
▪ The number of unstable case varies
significantly with the load model.
▪ The high proportion of dynamic load model
reduces significantly the number of unstable
cases.
6. Conclusions
This paper presented an analysis of the effect of load
models on frequency and rotor angle stability.
The results obtained show clearly that large
disturbance rotor angle stability is the most sensitive to load
models. The number of unstable cases varies considerably
with each type of studied load model, and it is the lowest
with the composite load model, and the highest with
constant power load. The increased penetration of
renewables with fault ride through capability slightly
improves large disturbance rotor angle stability, principally
due to the increased headroom of de-loaded synchronous
generators, and the extent of this improvement is different
with different types of load model.
The results of the small disturbance stability analysis
show that frequencies and damping of inter-area modes are
notably affected only by the composite load model which
can lead to a substantial reduction in the damping of critical
inter-area modes, irrespective of the level of RES
penetration in the network.
Finally, performed analysis of frequency response
demonstrated that the constant power model is the most
detrimental to frequency stability and leads to the largest
frequency nadir and RoCoF. The effect of load models on
the frequency response of the system can be significant if
the system is operating with the low inertia and reduced
primary frequency response due to the high penetration of
RES. In such cases, the frequency nadir and the RoCoF
become much more sensitive to load modelling, and
variation can be substantial if the proportion of the constant
power load is high. Furthermore, their sensitivity to other
system uncertainties also increases.
7. Acknowledgments
This work is supported by EPSRC –China collaborative
project RESTORES and EPSRC India collaborative project
JUICE.
8. References
[1] J. Milanović, J. Matevosiyan, A. Borghetti, S. Djokić, and Z.
Dong, "Modelling and aggregation of loads in flexible power
networks," CIGRE Taskforce WG C4. 605, Technical Brochure, vol. 566, 2014.
[2] Z. Dong, A. Borghetti, K. Yamashita, A. Gaikwad, P. Pourbeik,
and J. Milanovic, "CIGRE WG C4. 605 recommendations on measurement based and component based load modelling
practice," CIGRE SC, vol. 4, p. 2012, 2012.
[3] P. Regulski, D. S. Vilchis-Rodriguez, S. Djurović, and V. Terzija, "Estimation of Composite Load Model Parameters
Using an Improved Particle Swarm Optimization Method,"
IEEE Transactions on Power Delivery, vol. 30, pp. 553-560, 2015.
[4] J. V. Milanovic, K. Yamashita, S. M. Villanueva, S. Ž. Djokic,
and L. M. Korunović, "International industry practice on power system load modeling," IEEE Transactions on Power Systems,
vol. 28, pp. 3038-3046, 2013.
[5] W.-S. Kao, "The effect of load models on unstable low-frequency oscillation damping in Taipower system experience
w/wo power system stabilizers," IEEE Transactions on Power
Systems, vol. 16, pp. 463-472, 2001. [6] J. V. Milanovic and I. A. Hiskens, "Effects of load dynamics on
power system damping," IEEE Transactions on Power Systems,
vol. 10, pp. 1022-1028, 1995. [7] N. Martins, S. Gomes, R. M. Henriques, C. B. Gomes, A. d. A.
Barbosa, and A. C. B. Martins, "Impact of induction motor loads
in system loadability margins and damping of inter-area modes,"
0
100
200
300
400
500
Z P Pf Cmp ZIP
No
of
un
stab
le c
ases
30% RES 52% RES
ACCEPTED VERSION OF THE PAPER
9
in 2003 IEEE Power Engineering Society General Meeting
(IEEE Cat. No.03CH37491), 2003, pp. 1-1384 Vol. 3. [8] C. Concordia and S. Ihara, "Load Representation in Power
System Stability Studies," IEEE Transactions on Power
Apparatus and Systems, vol. PAS-101, pp. 969 - 977 1982. [9] J. Gim, T. Oyama, M.-S. Chen, G.-J. Lee, K.-I. Kim, and T.-W.
Kwon, "EFFECTS OF LOAD CHARACTERISTICS ON THE
TRANSIENT STABILITY OF KEPCO'S SYSTEM A2 - AHN, UHI," in Power Systems and Power Plant Control 1989, ed
Oxford: Pergamon, 1990, pp. 159-164.
[10] R.-C. S. P. D. S. Group, "Frequency Stability Evaluation Criteria for the Synchronous Zone of Continental Europe –
Requirements and impacting factors –," REE, Terna,
TransnetBW, 50HertzTransmission, RTE, Swissgrid and Energinet.dk.March 2016.
[11] H. E. Joseph and e. al, "Use of frequency response metrics to
assess the planning and operating requirements for reliable integration of variable renewable generation," Ernest Orlando
Lawrence Berkeley National Laboratory, Berkeley,Dec. 2010.
[12] A. Ulbig, T. S. Borsche, and G. Andersson, "Analyzing Rotational Inertia, Grid Topology and their Role for Power
System Stability," IFAC-PapersOnLine, vol. 48, pp. 541-547,
2015/01/01 2015.
[13] D. Gautam, V. Vittal, and T. Harbour, "Impact of Increased
Penetration of DFIG-Based Wind Turbine Generators on
Transient and Small Signal Stability of Power Systems," IEEE Transactions on Power Systems, vol. 24, pp. 1426-1434, 2009.
[14] S. Eftekharnejad, V. Vittal, G. T. Heydt, B. Keel, and J. Loehr,
"Impact of increased penetration of photovoltaic generation on power systems," IEEE Transactions on Power Systems, vol. 28,
pp. 893-901, 2013.
[15] X. Zhang, X. Cao, W. Wang, and C. Yun, "Fault ride-through study of wind turbines," Journal of Power and Energy
Engineering, vol. 1, p. 25, 2013.
[16] R. J. Nelson, H. Ma, and N. M. Goldenbaum, "Fault ride-through capabilities of siemens full-converter wind turbines," in
2011 IEEE Power and Energy Society General Meeting, 2011,
pp. 1-5. [17] J. Quintero, V. Vittal, G. T. Heydt, and Z. Hui, "The Impact of
Increased Penetration of Converter Control-Based Generators on
Power System Modes of Oscillation," IEEE Transactions on Power Systems, vol. 29, pp. 2248-2256, 2014.
[18] N. Miller, M. Shao, S. Pajic, and R. D’Aquila, "Western wind
and solar integration study phase 3-frequency response and transient stability," 2014.
[19] N. W. Miller, M. Shao, S. Venkataraman, C. Loutan, and M.
Rothleder, "Frequency response of California and WECC under high wind and solar conditions," in 2012 IEEE Power and
Energy Society General Meeting, 2012, pp. 1-8.
[20] A. Adrees, P. N. Papadopoulos, and J. V. Milanovic, "A framework to assess the effect of reduction in inertia on system
frequency response," in Power and Energy Society General Meeting (PESGM), 2016, 2016, pp. 1-5.
[21] P. N. Papadopoulos and J. V. Milanović, "Probabilistic
Framework for Transient Stability Assessment of Power Systems With High Penetration of Renewable Generation,"
IEEE Transactions on Power Systems, vol. 32, pp. 3078-3088,
2017. [22] P.Kundur, Power System Stability & Control. New York,
London: McGraw Hill, 1994.
[23] H.-D. Chiang, J.-C. Wang, C.-T. Huang, Y.-T. Chen, and C.-H.
Huang, "Development of a dynamic ZIP-motor load model from
on-line field measurements," International Journal of Electrical
Power & Energy Systems, vol. 19, pp. 459-468, 1997. [24] I. R. Navarro, O. Samuelsson, and S. Lindahl, "Automatic
determination of parameters in dynamic load models from
normal operation data," in Power Engineering Society General Meeting, 2003, IEEE, 2003, pp. 1375-1378.
[25] W. Jin-Cheng, C. Hsiao-Dong, C. Chung-Liang, L. Ah-Hsing, H.
Chang-Horng, and H. Chiung-Yi, "Development of a frequency-dependent composite load model using the measurement
approach," IEEE Transactions on Power Systems, vol. 9, pp.
1546-1556, 1994. [26] P. Pal and B. Chauduri, Robust Control in Power Systems. New
York: Springer Science & Business Media, 2005.
[27] W. R. E. M. T. Force, "WECC wind plant dynamic modeling guidelines," Western Electricity Coordinating Council Modeling
and Validation Work Group, vol. 17, 2014.
[28] P. Sorensen, J. Fortmann, F. Buendia, J. Bech, A. Morales, and
C. Ivanov, Final Draft International Standard IEC 61400-27-1, 2014.
[29] J. Fortmann, S. Engelhardt, J. Kretschmann, C. Feltes, and I.
Erlich, "New generic model of DFG-based wind turbines for RMS-type simulation," IEEE Transactions on Energy
Conversion, vol. 29, pp. 110-118, 2014.
[30] W. R. E. M. T. Force, "WECC PV Power Plant Dynamic Modeling Guide " May 2014.
[31] V. Krishnan, J. D. McCalley, S. Henry, and S. Issad, "Efficient
database generation for decision tree based power system security assessment," IEEE Transactions on Power Systems, vol.
26, pp. 2319-2327, 2011.