Embed Size (px)
Citation preview

25/06/201524-26 June, 2015
1
Researcher: A.D. Chukalla, PhD candidate
Supervisor: Dr. M. S. Krol, Associate Professor
Promoter: Prof. Dr. Ir. A.Y. Hoekstra, Professor
Effect of fertilizer strategies on the
grey water footprint in rain-fed and
irrigated agriculture
SWAT 2015
PULA/SARDINIA/ITALY

Content
Introduction
Objective
Data
Methods
Results
Conclusions
Footer text: to modify choose 'View' (Office 2003 or earlier) or
'Insert' (Office 2007 or later) then 'Header & Footer'
2

Introduction
The water footprint is a comprehensive indicator of freshwater resources appropriation, showing water consumption volumes by source and polluted volumes by type of pollution. It composes the green, blue and grey components. (Hoekstra, 2011).
Water footprint(WF) reduction is increasingly required in the face of increasing water scarcity and in the move to close supply-demand gap for fresh water.
Footer text: to modify choose 'View' (Office 2003 or earlier) or
'Insert' (Office 2007 or later) then 'Header & Footer'

Introduction
Green/Blue WF
Grey WF
for nonpoint
source
Footer text: to modify choose 'View' (Office 2003 or earlier) or
'Insert' (Office 2007 or later) then 'Header & Footer'
4
Understanding water resources use by source (rainwater,
irrigation water from surface and groundwater, water from
capillary rise) is vital for water resources management.
Falkenmark and Rockström (2006) and Hoekstra et al.
(2011).
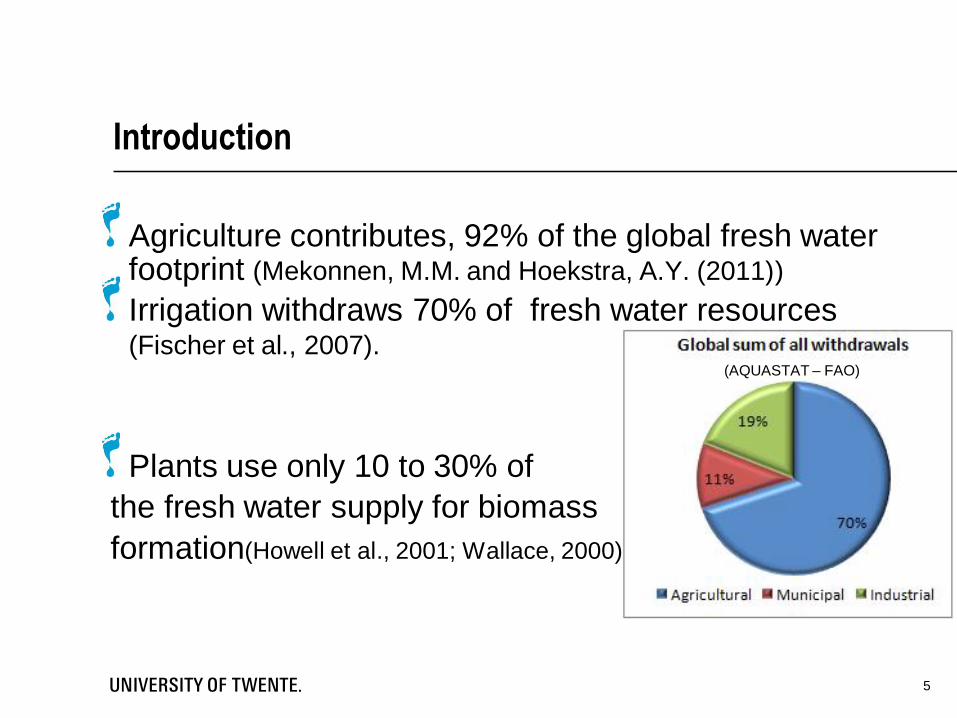
Introduction
Agriculture contributes, 92% of the global fresh water footprint (Mekonnen, M.M. and Hoekstra, A.Y. (2011))
Irrigation withdraws 70% of fresh water resources (Fischer et al., 2007).
Plants use only 10 to 30% of
the fresh water supply for biomass
formation(Howell et al., 2001; Wallace, 2000).
Footer text: to modify choose 'View' (Office 2003 or earlier) or
'Insert' (Office 2007 or later) then 'Header & Footer'
5
(AQUASTAT – FAO)
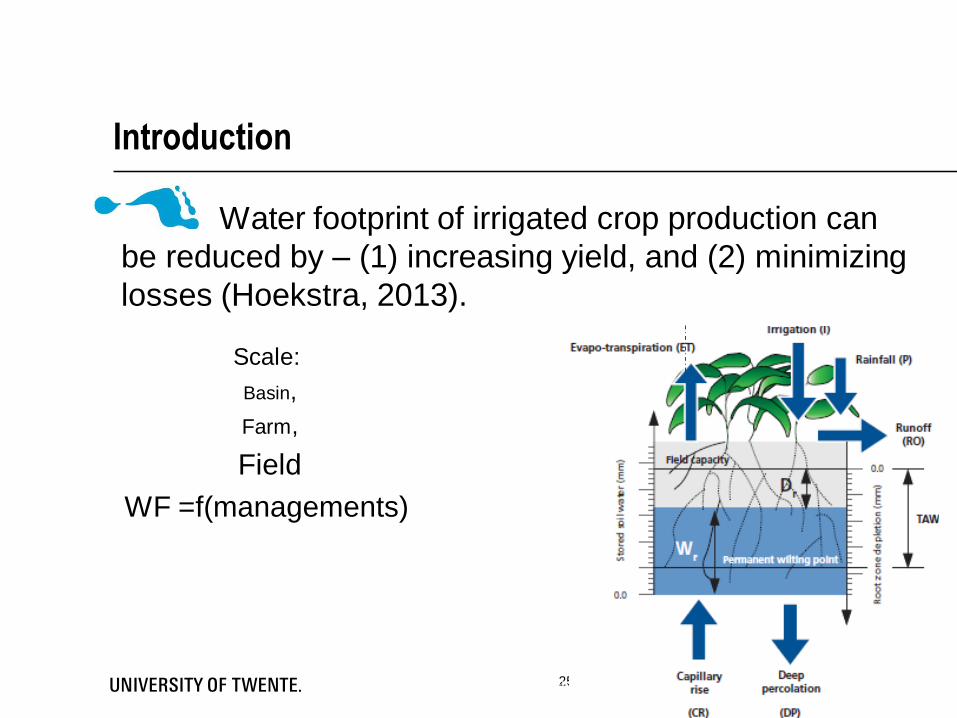
Introduction
Water footprint of irrigated crop production can
be reduced by – (1) increasing yield, and (2) minimizing
losses (Hoekstra, 2013).
25/06/2015Footer text: to modify choose 'View' (Office 2003 or earlier) or
'Insert' (Office 2007 or later) then 'Header & Footer'
6
Scale:
Basin,
Farm,
Field
WF =f(managements)

Objective
to explore the scope for reducing the water footprints of growing crops by a systematic model based assessment of management practises at field and basin scale.
(1) to explored the potential for reducing the green-blue water footprints of growing crops (p1).
(2) to explore the effect of fertilizer strategies on the grey water footprint of growing crops (p2).
7

DataHumid
Arid
Climate
http://climexp.knmi.nl/selectdailyseries.cgi
Crop parameters
(Potato, tomato and maize
FAO database and
local conditions
Soilhttp://eusoils.jrc.ec.europa.eu/ESDB
and field data measurement
Groundwater

Footer text: to modify choose 'View' (Office 2003 or earlier) or
'Insert' (Office 2007 or later) then 'Header & Footer'
Green and
Blue WF of
growing
crops
1. Four irrigation techniques: Furrow, Sprinkler, Drip
and Subsurface drip (SSD);
2. Three irrigation strategies: full irrigation, deficit
irrigation & supplementary irrigation; + rain-fed;
3. Three mulching practices: no mulching, organic &
synthetic mulching.
EffectsManagement options
AquaCrop
&
WF
accounting
Modelling
Method (p1)
Cases: Four environments, three types of years, three soils and three crops

Environment
(Location)
Soil Type of
years
Crops Groundwat
er
Arid
(Eilat , Israel)
Loam
Sandy loam
Silty-clay-loam
Dry
Normal
Wet
Maize, potato
and tomato
Deep
Semi-arid
(Badajoz,
Spain)
Loam
Sandy loam
Silty-clay-loam
Dry
Normal
Wet
Maize, potato
and tomato
Deep
Sub-humid
(Bologna, Italy)
Loam
Sandy loam
Silty-clay-loam
Dry
Normal
Wet
Maize, potato
and tomato
average 1.5
m
Humid
(Eden, United
Kingdom)
Loam
Sandy loam
Silty-clay-loam
Dry
Normal
Wet
Maize, potato
and tomato
Deep
Cases: Four environments, three types of years, three soils and three crops

Footer text: to modify choose 'View' (Office 2003 or earlier) or
'Insert' (Office 2007 or later) then 'Header & Footer'
Method
RI
R RO
S
S )ET(DrR
t
S gg
d
d
S
S ET)(DrR
t
S CR-bCR-b Cd
d
RI
I RO
S
S ET)(DrI
t
S I-bI-b
d
d
Green and blue soil water separation
n
i
ig
g
Y
ETWF
1
)(
n
1i Y
i)CRb(ET
CRbWF
n
1i Y
i)Ib(ET
IbWF
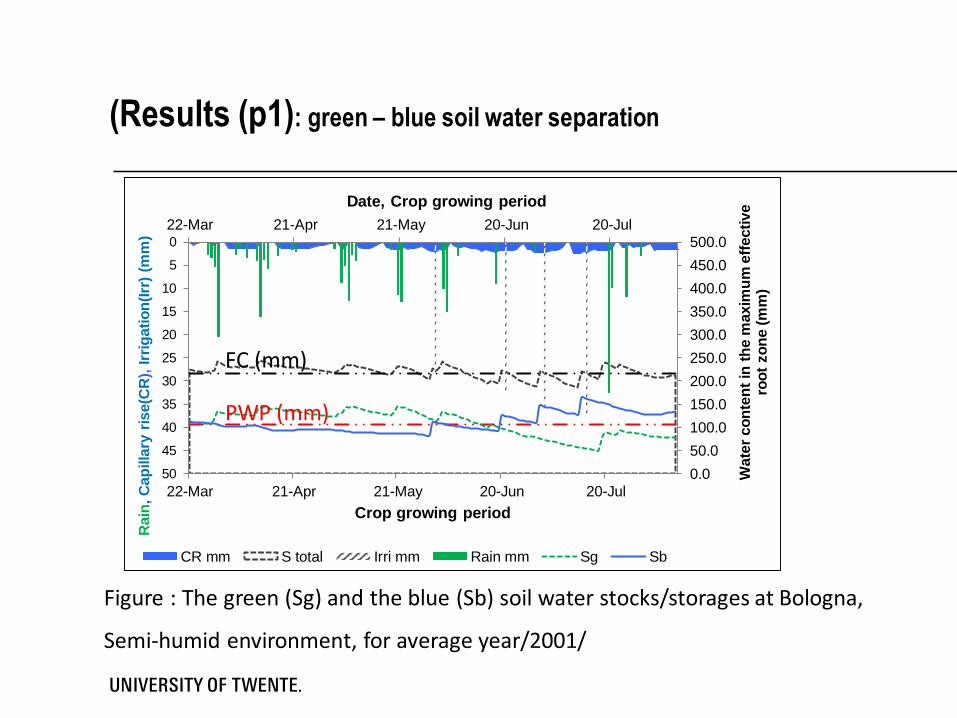
(Results (p1): green – blue soil water separation
22-Mar 21-Apr 21-May 20-Jun 20-Jul0.0
50.0
100.0
150.0
200.0
250.0
300.0
350.0
400.0
450.0
500.00
5
10
15
20
25
30
35
40
45
50
22-Mar 21-Apr 21-May 20-Jun 20-Jul
Crop growing period
Wate
r co
nte
nt
in t
he m
axim
um
eff
ecti
ve
roo
t zo
ne (
mm
)
Rain
, C
ap
illa
ry r
ise(C
R),
Irr
igati
on
(Irr
) (m
m)
Date, Crop growing period
CR mm S total Irri mm Rain mm Sg Sb
Figure : The green (Sg) and the blue (Sb) soil water stocks/storages at Bologna,
Semi-humid environment, for average year/2001/
PWP (mm)
FC (mm)

(Results (p1): Effect of the management options on ET, Y and WF
0
200
400
600
800
1000
1200
1400
0 200 400 600 800 1000
WF
(m
3/t
)
Evapotranspiration (mm)
Maize Potato Tomato
Figure: Effects on WF from the whole experiment

14
15
20
25
200 250 300 350 400 450
Yie
ld (
ton
/ha)
Evapotranspiration (mm)
Sprinkler Furrow Drip SubsurfaceDrip
Full
Deficit
Supplementary
5
9
13
17
21
25
150 200 250 300 350 400
Yie
ld (
ton
/ha)
Evapotranspiration (mm)
Without mulching Organic Synthetic
Rain-fed
supplementary
deficit
Full
Figure: ET-Y plot for
mulching practices at
rain-fed and drip
irrigated field.
Figure: ET-Y
relationship for irrigation
techniques with no
mulching practice.
Results (p1): Effect of the management options on ET, Y and WF
Case: potato, loam soil,
normal year, Semi-arid
environment (Badajoz –
Spain).
ET↓= saving
Y↑=f(T↑)=yield increase

Results (p1) Effect of the management options on ET, Y and WF
44 43
84 89
0
50
100
150
Rain-fed Supplementaryirrigation
Deficitirrigation
Fullirrigation
Green WF Blue WF (m3/t)(m3/t)
0
50
100
150
200
250
300
Rainfed Supplementaryirrigation
Deficitirrigation
Fullirrigation
ET-green (mm) ET-blue (mm)
Blue Water saving 144m3/ha
Yield reduction 1ton/ha
Blue water added 215m3/ha
Yield increase 7ton/ha
Figure: Effects of the irrigation strategies with drip on Yield, green and blue WF. Case: potato, loam soil, normal year, Semi-arid environment i.e. Badajoz – Spain.
11 ton /ha18 ton/ha
26 ton/ha 27 ton/ha
Rainfed Supplementaryirrigation
Deficitirrigation
Fullirrigation
Yield (ton/ha)

16
Results (p1): Reduction in the total WF
Reference (furrow irrigation with full irrigation and without mulching practice)
a
b c
The box and whisker
plot shows the WF-
reduction values for the
whole cases:
(a) whole management
practices;
(b) four irrigation
techniques, with FI
and NoML; and
(a) four irrigation
techniques, with DI
and NoML.

17
-40.0
-30.0
-20.0
-10.0
0.0
10.0
20.0
Furr
ow
Sp
rin
kle
r
Dri
p
Su
bS
Dri
p
Furr
ow
Sp
rin
kle
r
Dri
p
Su
bS
Dri
p
Furr
ow
Sp
rin
kle
r
Dri
p
Su
bS
Dri
p
Furr
ow
Sp
rin
kle
r
Dri
p
Su
bS
Dri
p
Dri
p &
Sub
SD
rip
Dri
p &
Sub
SD
rip
To
tal
WF
re
du
cti
on
(%
)Arid Semi arid Subhumid Humid Avg of all cases
FI DI
Synthetic
mulching
Full Irrigation No mulching
Deficit Irrigation No mulching
Full Irrigation Organic mulching
Deficit Irrigation Organic mulching
Figure: The mean total WF reduction categorized by the environments for the
whole cases
Results (p1): Reduction in the total WF

18
-50.0
-40.0
-30.0
-20.0
-10.0
0.0
10.0
20.0
Furr
ow
Sp
rin
kle
r
Dri
p
Su
bS
Dri
p
Furr
ow
Sp
rin
kle
r
Dri
p
Su
bS
Dri
p
Furr
ow
Sp
rin
kle
r
Dri
p
Su
bS
Dri
p
Furr
ow
Sp
rin
kle
r
Dri
p
Su
bS
Dri
p
Dri
p &
Sub
SD
rip
Dri
p &
Sub
SD
rip
To
tal
WF
re
du
cti
on
(%
)
Green WF reduction Blue WF reduction Total WF reduction
Full Irrigation No mulching
Deficit IrrigationNo mulching
Full IrrigationOrganic mulching
Deficit IrrigationOrganic mulching
FI DISynthetic mulching
Figure: The mean green, blue and total WF reduction; for the whole cases
Results (p1): Reduction in the green-blue WF

Conclusions
The average reduction in the consumptive WF is: 8-
10% if we change from the reference to drip or SSD;
13% when changing to OML; 17-18% when moving to
drip or SSD in combination with OML; and 28% for
drip or SSD in combination with SML.
Reduction in overall consumptive WF always goes
together with an increasing ratio of green to blue WF.
The WF of growing a crop for a particular environment
is smallest under DI, followed by FI, SI and rain-fed.

Conclusions
Growing crops with sprinkler irrigation has the largest
consumptive WF, followed by furrow, drip and SSD.
Furrow irrigation has a smaller consumptive WF
compared with sprinkler, even though the classical
measure of ‘irrigation efficiency’ for furrow is lower.
Grey water footprint component
Simulating the effect of fertilizer strategies on the grey
water footprint of growing crops (p2).
Footer text: to modify choose 'View' (Office 2003 or earlier) or
'Insert' (Office 2007 or later) then 'Header & Footer'
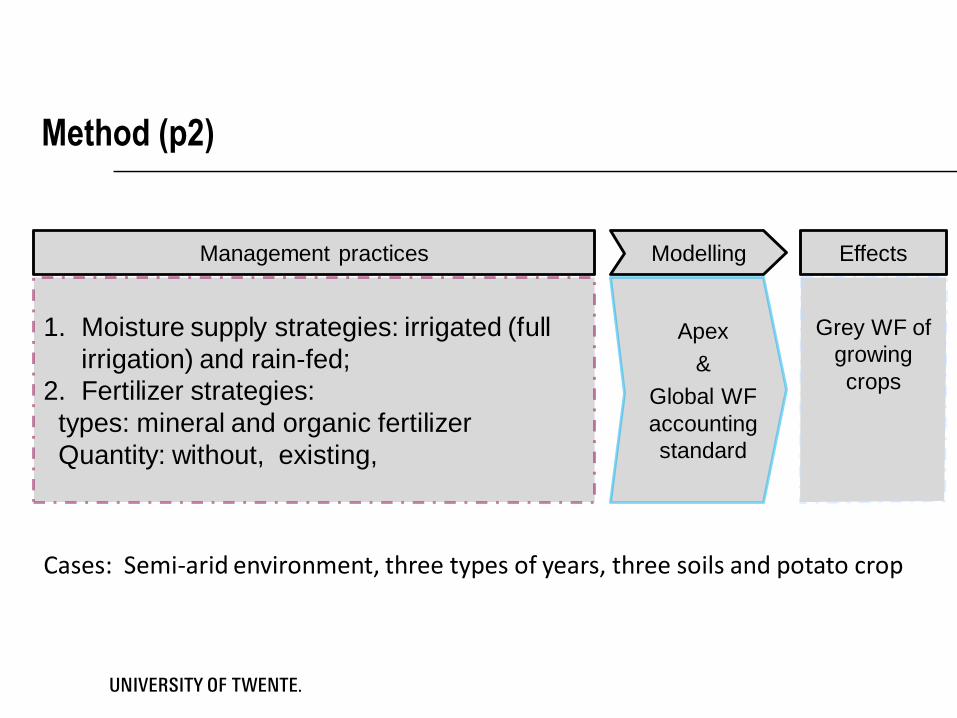
Grey WF of
growing
crops
1. Moisture supply strategies: irrigated (full
irrigation) and rain-fed;
2. Fertilizer strategies:
types: mineral and organic fertilizer
Quantity: without, existing,
EffectsManagement practices
Apex
&
Global WF
accounting
standard
Modelling
Method (p2)
Cases: Semi-arid environment, three types of years, three soils and potato crop
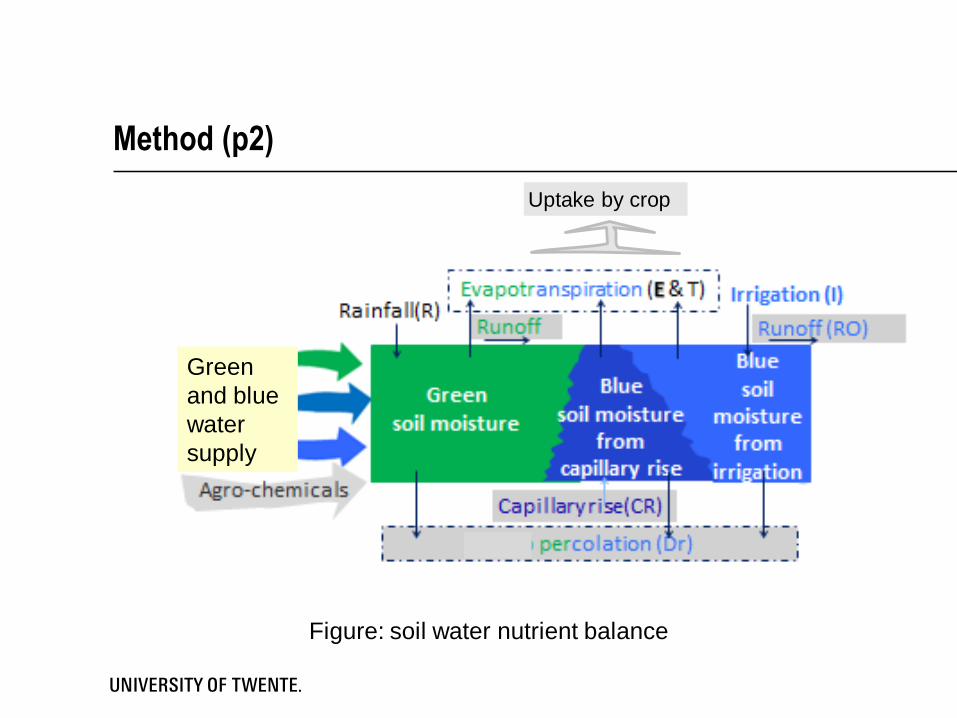
Method (p2)
Green
and blue
water
supply
Uptake by crop
Figure: soil water nutrient balance


Thank You