Embed Size (px)
Citation preview

Argus FMB Fertilizer Production Chart
illuminating the markets
FertilizerMarket Reporting
ConsultingEvents
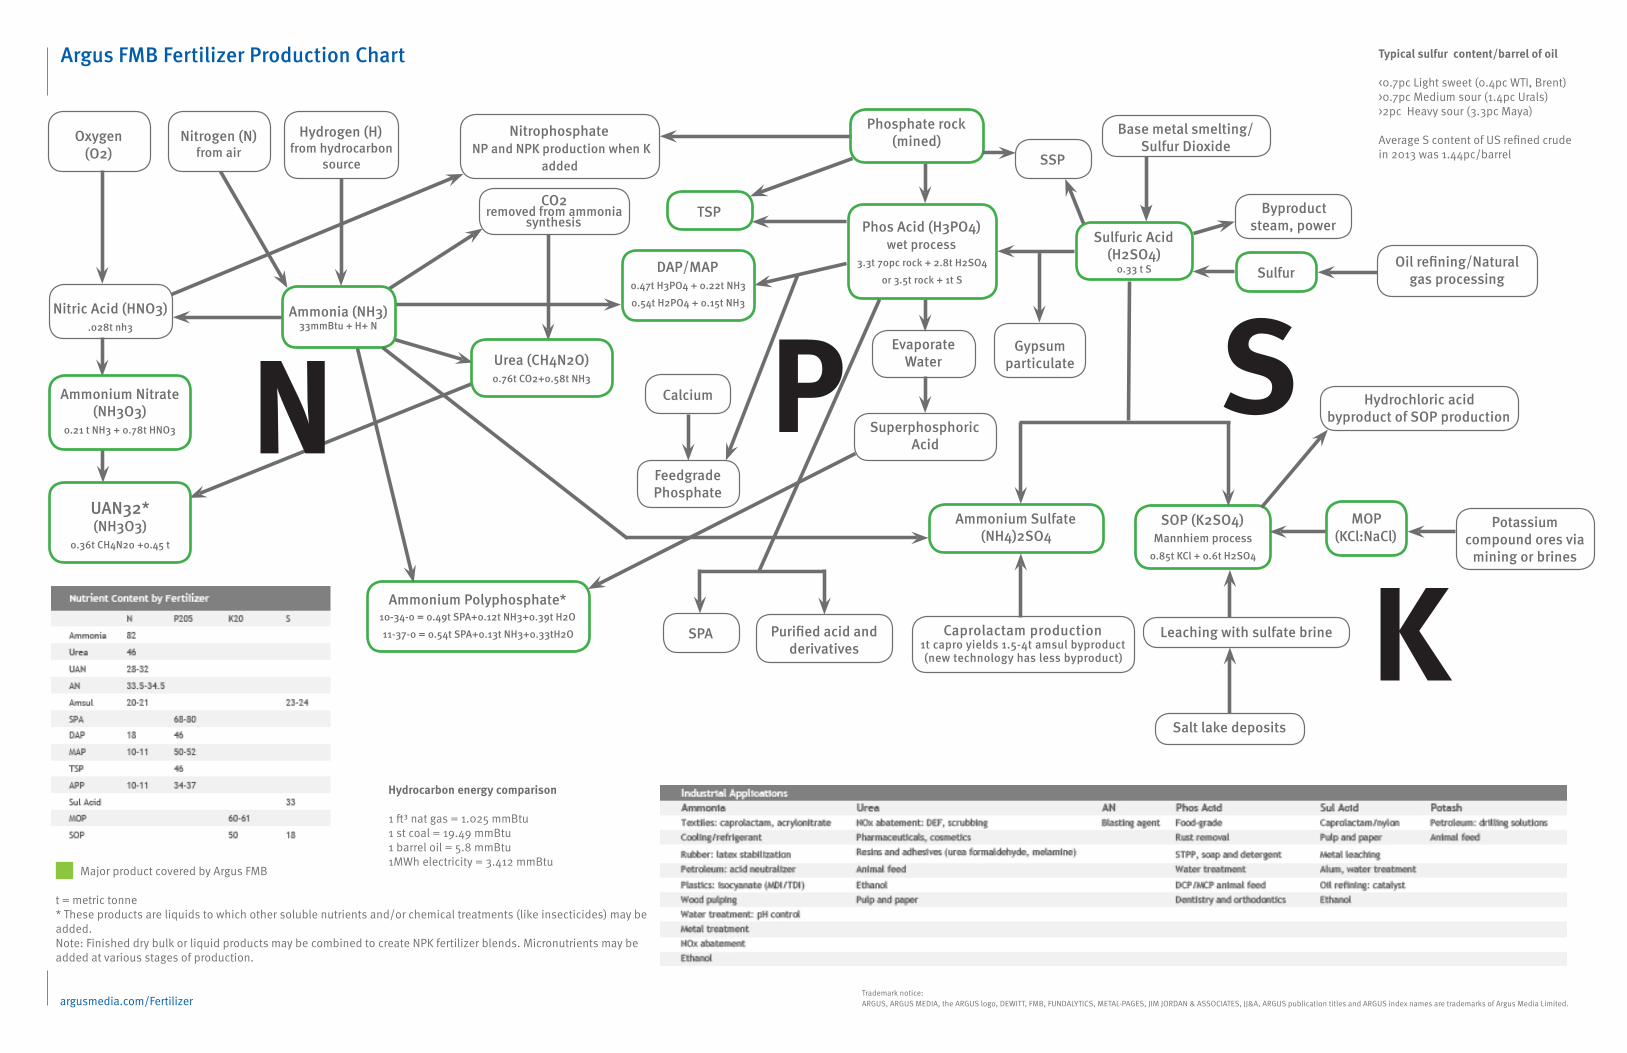
t = metric tonne * These products are liquids to which other soluble nutrients and/or chemical treatments (like insecticides) may be added.Note: Finished dry bulk or liquid products may be combined to create NPK fertilizer blends. Micronutrients may be added at various stages of production.
Ammonia (NH3)33mmBtu + H+ N
Argus FMB Fertilizer Production Chart
argusmedia.com/FertilizerTrademark notice:ARGUS, ARGUS MEDIA, the ARGUS logo, DEWITT, FMB, FUNDALYTICS, METAL-PAGES, JIM JORDAN & ASSOCIATES, JJ&A, ARGUS publication titles and ARGUS index names are trademarks of Argus Media Limited.
Oxygen(O2)
Nitrogen (N) from air
Hydrogen (H)from hydrocarbon
source
CO2 removed from ammonia
synthesis
Nitric Acid (HNO3).028t nh3
Ammonium Nitrate (NH3O3)
0.21 t NH3 + 0.78t HNO3
Urea (CH4N2O)0.76t CO2+0.58t NH3
UAN32*(NH3O3)
0.36t CH4N20 +0.45 t
Nitrophosphate NP and NPK production when K
added
DAP/MAP 0.47t H3PO4 + 0.22t NH30.54t H2PO4 + 0.15t NH3
Phosphate rock (mined)
Typical sulfur content/barrel of oil
<0.7pc Light sweet (0.4pc WTI, Brent)>0.7pc Medium sour (1.4pc Urals)>2pc Heavy sour (3.3pc Maya)
Average S content of US refined crude in 2013 was 1.44pc/barrel
EvaporateWater
Phos Acid (H3PO4) wet process
3.3t 70pc rock + 2.8t H2SO4or 3.5t rock + 1t S
Ammonium Polyphosphate*10-34-0 = 0.49t SPA+0.12t NH3+0.39t H2O11-37-0 = 0.54t SPA+0.13t NH3+0.33tH2O
Superphosphoric Acid
Base metal smelting/Sulfur Dioxide
Sulfuric Acid (H2SO4)
0.33 t S
Gypsum particulate
Oil refining/Natural gas processingSulfur
Hydrochloric acidbyproduct of SOP production
SOP (K2SO4)Mannhiem process
0.85t KCl + 0.6t H2SO4
Ammonium Sulfate (NH4)2SO4
Caprolactam production 1t capro yields 1.5-4t amsul byproduct (new technology has less byproduct)
Salt lake deposits
MOP (KCl:NaCl)
Leaching with sulfate brine
Calcium
Feedgrade Phosphate
Potassium compound ores via
mining or brines
Byproduct steam, power
Major product covered by Argus FMB
N P S
KHydrocarbon energy comparison
1 ft³ nat gas = 1.025 mmBtu1 st coal = 19.49 mmBtu1 barrel oil = 5.8 mmBtu1MWh electricity = 3.412 mmBtu
TSP
SSP
Purified acid and derivatives
SPA

Copyright © 2014 Argus Media Ltdilluminating the markets
Argus FMB Fertilizer Production Chart
Argus FMB
Houston2929 Allen Parkway, Suite 700Houston, TX 77019Tel: +1 713 968 0000 Fax: +1 713 622 2991
New York500 Fifth Avenue, Suite 2400New York, NY 10110Tel: + 1 646 376 6130Fax: +1 646 376 6143
Washington 1012 Fourteenth Street NW, Suite 1500Washington, DC 20005Tel: + 1 202 775 0240Fax: + 1 202 872 8045
Rio de Janeiro Av. Nossa Senhora de Copacabana330 – salas 1003/1004CopacabanaRio de Janeiro, RJBrasil - 22020 - 001Tel: + 55 21 3514 1450
Email: [email protected]: www.argusmedia.com/FertilizerTwitter: @ArgusFMB