Embed Size (px)
Citation preview
Effect of Electrodeposition Parameters on the Microstructureand Corrosion Behavior of DCPD Coatings on BiodegradableMg–Ca–Zn Alloy
Hamid Reza Bakhsheshi-Rad,* Esah Hamzah, and Safaa N. Saud
Department of Materials, Manufacturing and Industrial Engineering, Faculty of Mechanical Engineering, UniversitiTeknologi Malaysia, 81310, Johor Bahru, Johor, Malaysia
Mamoun Medraj
Department of Mechanical Engineering, Concordia University, 1455 De Maisonneuve Blvd. West, Montreal, QC, H3G1M8, Canada
In this study, DCPD (Brushite, CaHPO4.2H2O) coatings were prepared on the surface of a Mg–Ca–Zn alloy using
different current density (0.15–1.2 mA/cm2) and deposition time (5–90 min). The results revealed that DCPD with needle-likemorphology was observed for the current density between 0.15 and 0.4 mA/cm2, whereas plate-like morphology was obtained atcurrent density above 0.8 mA/cm2. The results showed that surface roughness increased with increasing current density. The low-
est corrosion rate of 0.14 mm/year was obtained for the dense and uniform DCPD coating at 0.4 mA/cm2, while furtherincrease has deleterious effect on the corrosion resistance.
Introduction
Mg and its alloy are receiving great attention as bio-degradable materials for implant application particularlyas a temporary stent. Due to Mg, alloys can be dissolvedand absorbed in the human body and do not require sec-ond surgical procedure for implant removal.1,2 Mg alloysalso have similar mechanical properties to natural bone,good biological performance, and biodegradability inthe physiological environment.3,4 However, the mainobstacle to the use of Mg alloys is their high electro-chemical activity and hence fast corrosion rate.1,5 Thus,the corrosion rate of Mg alloys must be controlled for itsfeasible use as implant materials.1,6 To achieve this aim,calcium phosphates (Ca-P) are extensively used for coat-ing of Mg alloys to slow down its corrosion rate.1,6,7
Different kinds of the Ca-P, such as monocalciumphosphate monohydrate, dicalcium phosphate dihydrate,hydroxyapatite, and tricalcium phosphate, were used ascoating materials.6,7 Among these, hydroxyapatite (HA,Ca10(PO4)6(OH)2) is the most fascinating form of Ca-Pdue to the its excellent biocompatibility, bioaffinity, andosseoconductivity.8,9 HA also has similar chemical andbiological properties to human hard tissues as well asHA coating improved corrosion resistance of Mg alloys
in biological environment by providing barrier film onthe alloy surface.10–13 However, the synthesis of HA viaprecipitation method leads to the formation of agglomer-ate crystals whose size is often difficult to control.6 UsingDCPD (CaHPO4.2H2O) as a precursor, it is feasible tocontrol the crystal size of DCPD and subsequently con-vert it directly to HA.7 DCPD is frequently applied asthe initial component of bone cements, and it is a prom-ising coating for clinical use.7 DCPD is also biocompati-ble with different cell lines such as murine fibroblastcells.7,12 Different methods 1,2,5,10 such as fluoride con-version coating, polymer coating, hot spraying, phosphat-ing treatment, laser cladding, and electrodeposition wereinvestigated to improve the corrosion resistance of Mgalloys. Among these techniques, electrodeposition used asa process having low temperature, low cost, ability todeposit on complex shapes materials, and simple controlof parameter.14 Hu et al.14 investigated the electrochemi-cal deposition behavior of calcium phosphate (Ca-P)coating at different current densities (0.25–1.75 mA/cm2) for 1 h. Djosic et al.15 studied calcium phosphatecoating at different current densities (5–10 mA/cm2) andvarious times (1–30 min). However, Wang et al.16 stud-ied calcium phosphate coating on Ti alloy by electro-chemical deposition method at various voltages (4–10 V)for different times (20–120 min). In this regard, Jameshet al.17 investigated electrodeposition of Ca-P coating onMg alloy at 100 mV. Other researcher 18–20 coated Ca-P on
*[email protected]; [email protected]
© 2014 The American Ceramic Society
Int. J. Appl. Ceram. Technol., 1–11 (2014)DOI:10.1111/ijac.12301
Mg alloy at current density between 0.4 and 0.5 mA/cm2
for 1 h. As mentioned, several studied 6,7,14 werereported on the fabricating of Ca-P coating on Mg andTi alloy, but the mechanism of electrodeposition ofDCPD onto Mg alloys has not been entirely clarified.Therefore, in this research, DCPD coatings at variouscurrent densities (0.15–1.2 mA/cm2) and depositiontime (5–90 min) were applied, and their effects on themicrostructure and corrosion behavior of Mg–Zn–Caalloy were investigated.
Materials and Methods
Pure magnesium ingot (99.98 wt%, Fushun Alu-minium Alloy Company, China), high purity Zn chip(99.999 wt%, National Chemical Reagent Company,Shenyang, China), and Mg–32 wt% Ca master (98 wt%,Shanghai ruizheng chemical technology, Shanghai,China) were used to prepare magnesium alloys. Themelting was conducted in an electronic resistance furnaceunder argon gas in a mild steel crucible coated withboron nitride. The melting temperature was set at760°C for 45 min. The first 30 min was for melting,and the remaining 15 min for complete melt homogeni-zation. Then, the melt with a constant concentration ofCa (0.5 wt%) and Zn (3 wt%) was cast into a 300°Cpreheated stainless steel mold to obtain ingots and speci-mens test for microstructural observation.21 Specimens10 9 10 9 5 mm in size were prepared from the as-castalloys ingots, and the samples were then mechanicallywet-ground for microstructural observation. DCPD coat-ing was produced via electrodeposition at 70°C for dif-ferent deposition duration between 5 and 90 min. Aconventional cell was fitted with a graphite rod as theanode and the Mg–Ca–Zn sheet (10 9 10 9 5 mm) asthe cathode. Saturated calomel electrode (SCE) served asa reference electrode along with a potentiostat/galvano-stat instrument for electrochemical measurements. Forpreparing DCPD on Mg alloy, the current density wasvaried between 0.15 and 1.2 mA/cm2. The solution con-centration was kept uniform using a magnetic stirrercontrolled at 120 rpm. The electrolyte was prepared bydissolution of Ca(NO3)2 (0.042 mol/L), NH4H2PO4
(0.025 mol/L), NaNO3 (0.1 mol/L), and H2O2
(10 mol/L) at pH 5 in room temperature. Each experi-ment was repeated twice to check the reproducibility ofthe results. Microstructure observation was performedusing a scanning electron microscope (SEM; JEOL JSM-6380LA, Tokyo, Japan) equipped with Oxford energydispersive X-ray spectrometer (EDS) analysis with anoperating voltage of 20 kV and transmission electron
microscope (TEM HT7700; Hitachi, Tokyo, Japan). AnX-ray diffractometer (XRD; Siemens-D5000, Munich,Germany) was used to evaluate the phase transformationand crystallite size of the specimens using Cu-Ka radia-tion (k = 1.5405 �A) generated at 35 kV and 25 mAoperated at the step size of 0.02° and scan speed of 2°min�1. Electrochemical polarization test was carried outusing PARSTAT 2263 potentiostat/galvanostat (Prince-ton Applied Research, Oak Ridge, TN) advanced electro-chemical system. The surface topography of the coatedand uncoated specimens was evaluated using atomic-force microscopy (AFM; NanoScope IV, Digital Instru-ments). AFM imaging was performed in the tappingmode at room temperature using a standard siliconnitride probe with a spring constant of 0.58 N/m and atypical radius of 10 nm. The scanning area selected was10 9 10 lm. Fourier-transform infrared (FTIR;ALPHA-T, Bruker, Ettlingen, Germany) spectroscopywas used to determine the surface functional groups ofthe coated sample. All the spectra in these experimentswere obtained by adding 64 interferograms at a resolu-tion of 8 cm�1 in the spectral range of 3950–450 cm�1.The bonding strength of the coated specimens was mea-sured according to ASTM F1044 standard using univer-sal testing machine (Instron 5569, Norwood, MA).Rectangular specimens with the dimensions of30 910 mm were prepared. The cross-head displace-ment rate was 1 mm/min with a 10 kN load cell. Threecoated specimens were tested, and the average value wasreported. Electrochemical cell consisted of the sample asworking electrode, a saturated calomel electrode (SCE)as reference electrode, and a platinum rod as counterelectrode. Each sample was masked by paraffin wax suchthat a surface area of 1.0 9 1.0 cm2 with a scan rate of0.5 mV/s initiated at �250 mV below the open-circuitpotential. The test was conducted at 37°C in an openair glass cell containing 350 mL Kokubo solution at pH7.66. The simulated body fluid (SBF) was preparedaccording to the previously reported method.22
Result and Discussion
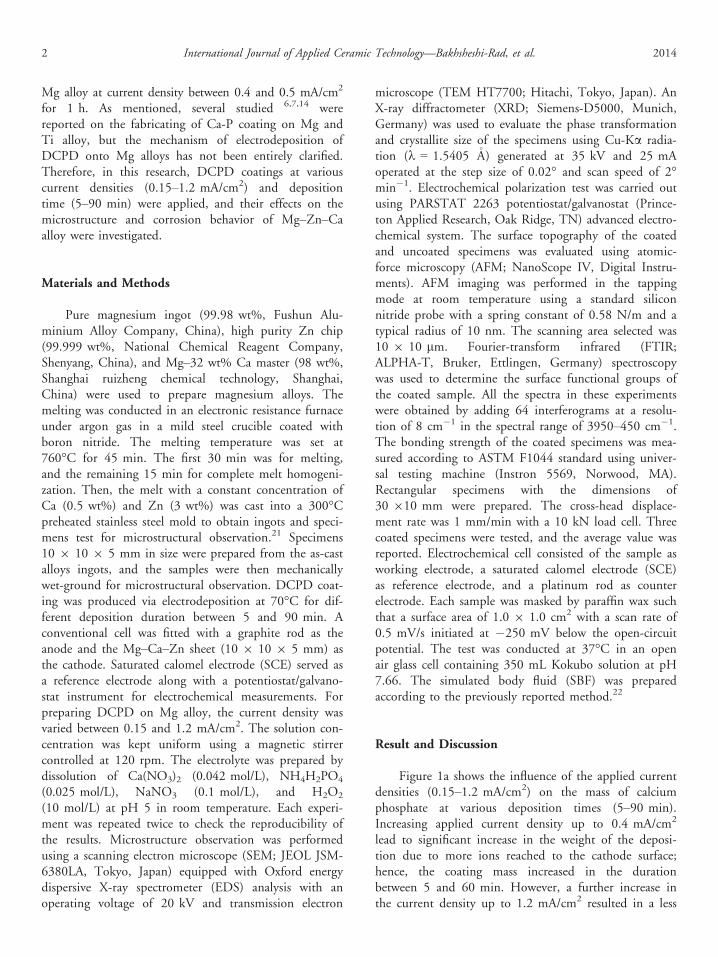
Figure 1a shows the influence of the applied currentdensities (0.15–1.2 mA/cm2) on the mass of calciumphosphate at various deposition times (5–90 min).Increasing applied current density up to 0.4 mA/cm2
lead to significant increase in the weight of the deposi-tion due to more ions reached to the cathode surface;hence, the coating mass increased in the durationbetween 5 and 60 min. However, a further increase inthe current density up to 1.2 mA/cm2 resulted in a less
2 International Journal of Applied Ceramic Technology—Bakhsheshi-Rad, et al. 2014
significant increase in mass gain. When current densityamplifies, the rate of H2 generation increased on thesurface of cathode, which leads to more hydrogen bub-bles accumulating on the cathode surface. This phenom-enon caused decrease in phosphate precipitation on thecathode surface.15,23
Figure 1b shows the influence of the electrodeposit-ion time on the mass of calcium phosphate at differentcurrent density (0.15–1.2 mA/cm2). As the depositiontime increased to 30 min, the mass of coating increasedto 3.1 mg when the current density increased from 0.15to 0.4 mA/cm2. For current density at 0.4 mA/cm2, asthe deposition time increases to 60 min, the coatingmass significantly increased to 4.7 mg due to high reac-tion rate. However, further increase in deposition timeto 90 min leads to weight of the deposition decreases to4.1 mg due to generation of large amount H2 on thesurface of cathode which resulted in accumulation ofhydrogen bubbles on the surface of cathode and thuspreventing the formation of phosphate on the cathodesurface.15 The depletion of the coating film via H2 gen-eration could be another reason of deposit weight loss.However, the weight gain of the deposition could beattributed to the phosphate deposition and its growth, inaddition to the electrochemical reaction of H2 genera-tion. Higher current density accompanied by further
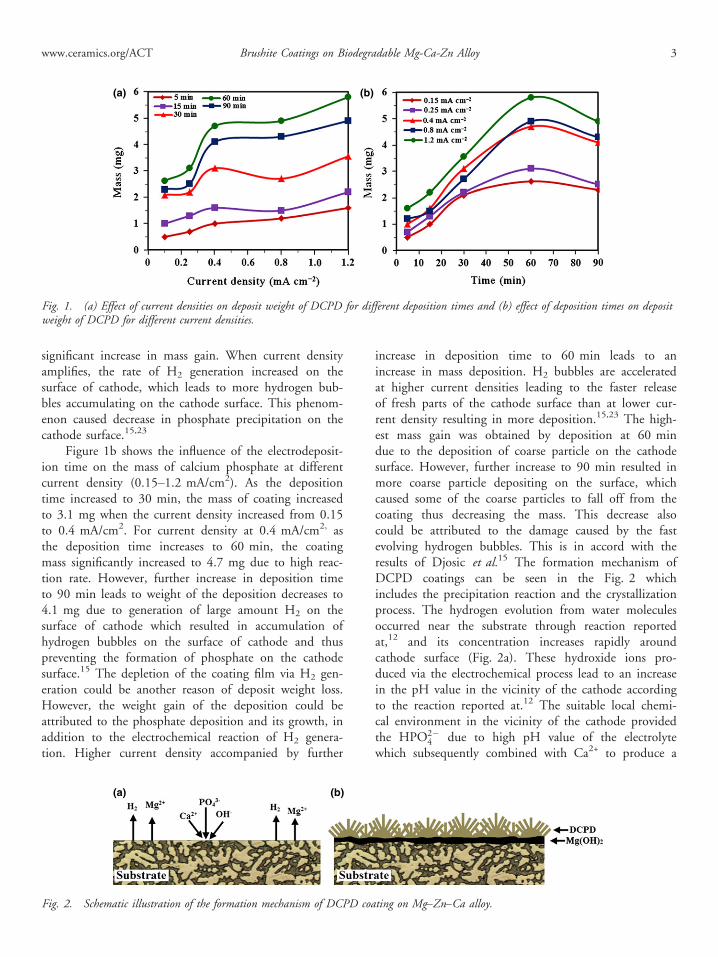
increase in deposition time to 60 min leads to anincrease in mass deposition. H2 bubbles are acceleratedat higher current densities leading to the faster releaseof fresh parts of the cathode surface than at lower cur-rent density resulting in more deposition.15,23 The high-est mass gain was obtained by deposition at 60 mindue to the deposition of coarse particle on the cathodesurface. However, further increase to 90 min resulted inmore coarse particle depositing on the surface, whichcaused some of the coarse particles to fall off from thecoating thus decreasing the mass. This decrease alsocould be attributed to the damage caused by the fastevolving hydrogen bubbles. This is in accord with theresults of Djosic et al.15 The formation mechanism ofDCPD coatings can be seen in the Fig. 2 whichincludes the precipitation reaction and the crystallizationprocess. The hydrogen evolution from water moleculesoccurred near the substrate through reaction reportedat,12 and its concentration increases rapidly aroundcathode surface (Fig. 2a). These hydroxide ions pro-duced via the electrochemical process lead to an increasein the pH value in the vicinity of the cathode accordingto the reaction reported at.12 The suitable local chemi-cal environment in the vicinity of the cathode providedthe HPO2�
4 due to high pH value of the electrolytewhich subsequently combined with Ca2+ to produce a
(a) (b)
Fig. 1. (a) Effect of current densities on deposit weight of DCPD for different deposition times and (b) effect of deposition times on depositweight of DCPD for different current densities.
(a) (b)
Fig. 2. Schematic illustration of the formation mechanism of DCPD coating on Mg–Zn–Ca alloy.
www.ceramics.org/ACT Brushite Coatings on Biodegradable Mg-Ca-Zn Alloy 3
DCPD which precipitated on the surface of the sub-strate through reaction reported at.12 In addition, insol-uble Mg(OH)2 film formed due to readily reaction ofMg with OH (Eq. 1) at the interface DCPD coatingwith the Mg–Zn–Ca alloy substrate. With increasingcurrent density to 1.2 mA/cm2, more DCPD will beformed on the surface of the alloy (Fig. 2b).
Mgþ 2H2O ! MgðOHÞ2 # þH2 " ð1Þ
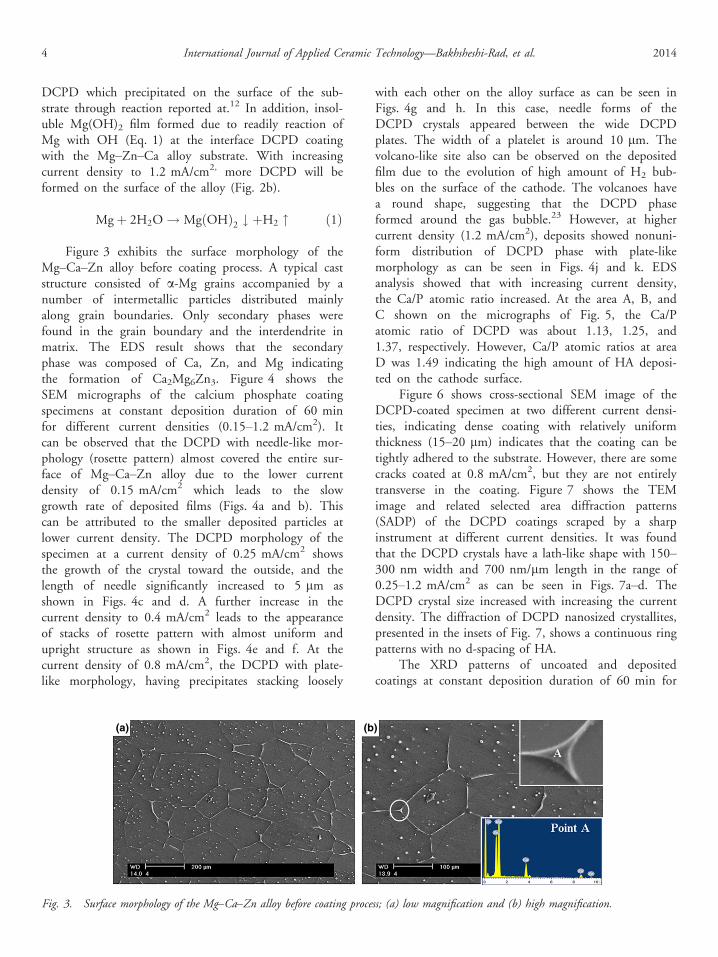
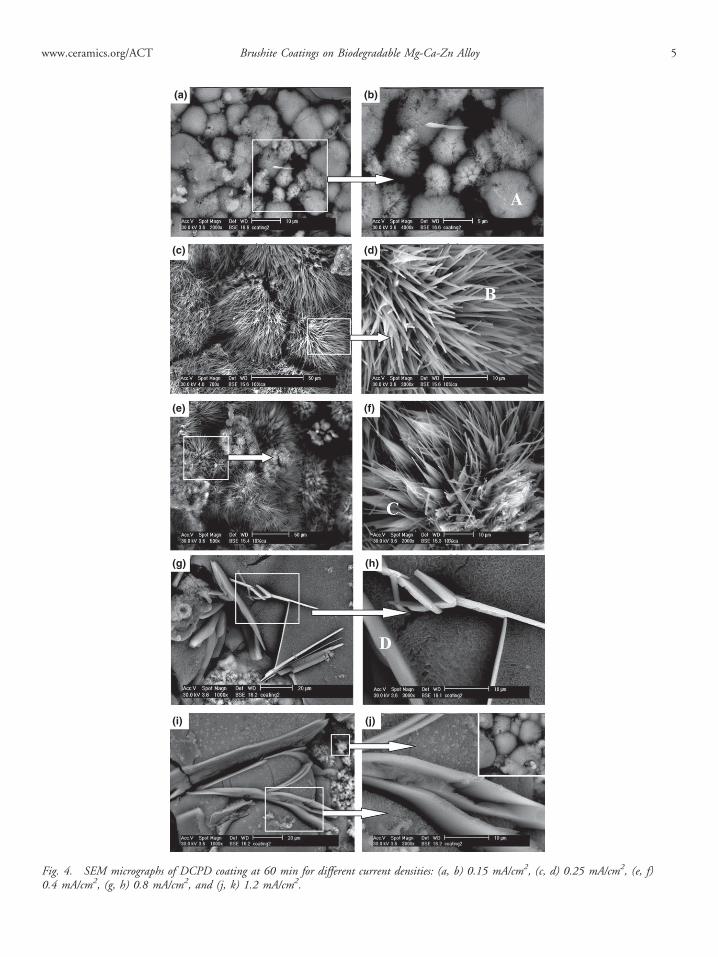
Figure 3 exhibits the surface morphology of theMg–Ca–Zn alloy before coating process. A typical caststructure consisted of a-Mg grains accompanied by anumber of intermetallic particles distributed mainlyalong grain boundaries. Only secondary phases werefound in the grain boundary and the interdendrite inmatrix. The EDS result shows that the secondaryphase was composed of Ca, Zn, and Mg indicatingthe formation of Ca2Mg6Zn3. Figure 4 shows theSEM micrographs of the calcium phosphate coatingspecimens at constant deposition duration of 60 minfor different current densities (0.15–1.2 mA/cm2). Itcan be observed that the DCPD with needle-like mor-phology (rosette pattern) almost covered the entire sur-face of Mg–Ca–Zn alloy due to the lower currentdensity of 0.15 mA/cm2 which leads to the slowgrowth rate of deposited films (Figs. 4a and b). Thiscan be attributed to the smaller deposited particles atlower current density. The DCPD morphology of thespecimen at a current density of 0.25 mA/cm2 showsthe growth of the crystal toward the outside, and thelength of needle significantly increased to 5 lm asshown in Figs. 4c and d. A further increase in thecurrent density to 0.4 mA/cm2 leads to the appearanceof stacks of rosette pattern with almost uniform andupright structure as shown in Figs. 4e and f. At thecurrent density of 0.8 mA/cm2, the DCPD with plate-like morphology, having precipitates stacking loosely
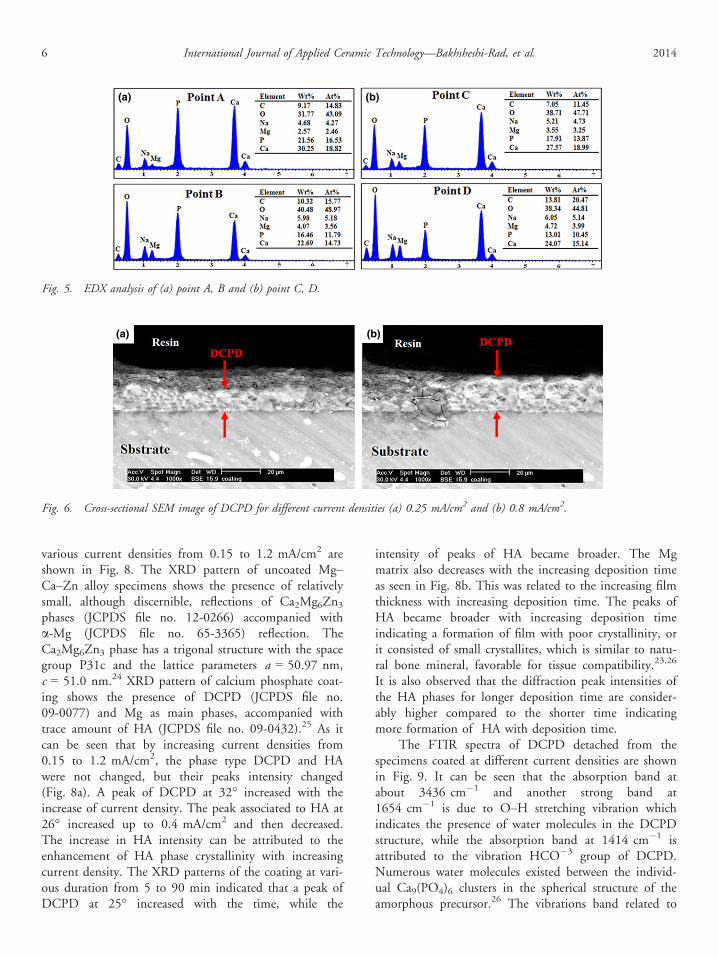
with each other on the alloy surface as can be seen inFigs. 4g and h. In this case, needle forms of theDCPD crystals appeared between the wide DCPDplates. The width of a platelet is around 10 lm. Thevolcano-like site also can be observed on the depositedfilm due to the evolution of high amount of H2 bub-bles on the surface of the cathode. The volcanoes havea round shape, suggesting that the DCPD phaseformed around the gas bubble.23 However, at highercurrent density (1.2 mA/cm2), deposits showed nonuni-form distribution of DCPD phase with plate-likemorphology as can be seen in Figs. 4j and k. EDSanalysis showed that with increasing current density,the Ca/P atomic ratio increased. At the area A, B, andC shown on the micrographs of Fig. 5, the Ca/Patomic ratio of DCPD was about 1.13, 1.25, and1.37, respectively. However, Ca/P atomic ratios at areaD was 1.49 indicating the high amount of HA deposi-ted on the cathode surface.
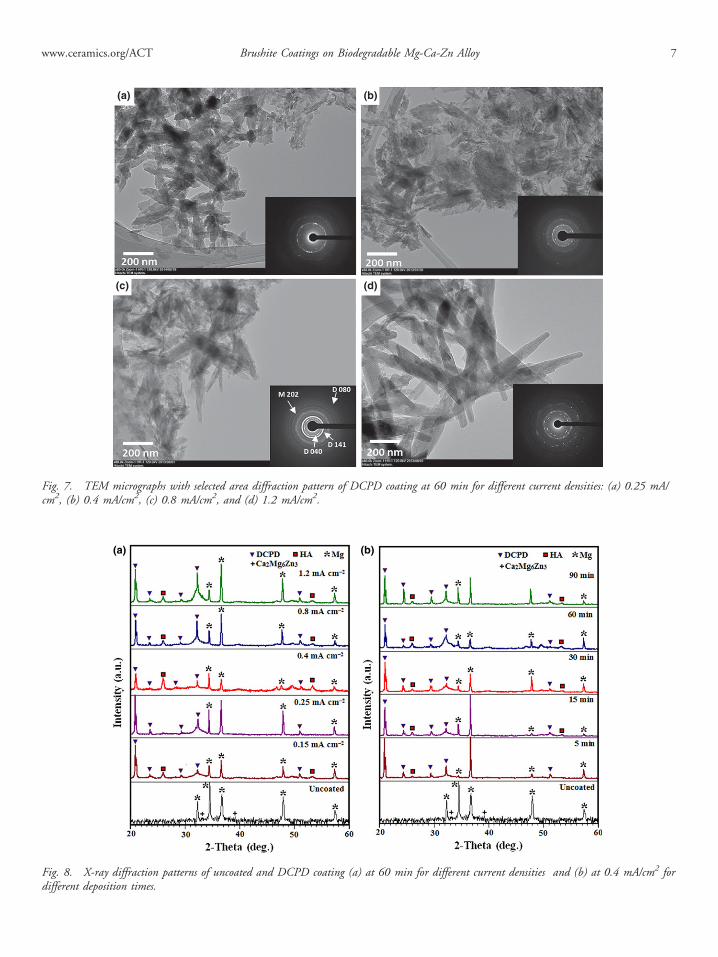
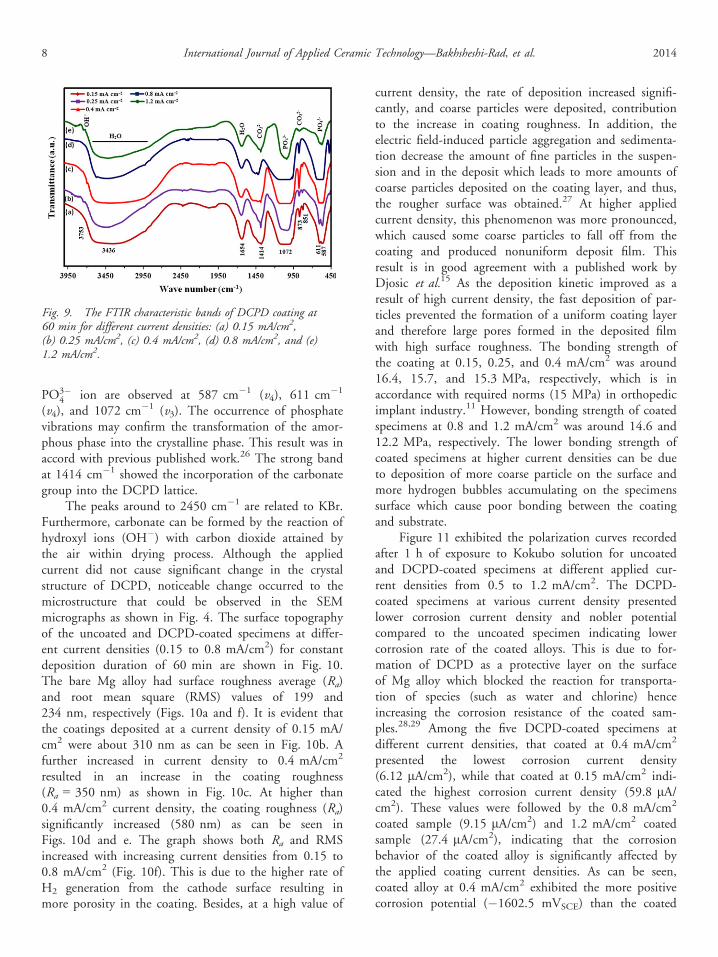
Figure 6 shows cross-sectional SEM image of theDCPD-coated specimen at two different current densi-ties, indicating dense coating with relatively uniformthickness (15–20 lm) indicates that the coating can betightly adhered to the substrate. However, there are somecracks coated at 0.8 mA/cm2, but they are not entirelytransverse in the coating. Figure 7 shows the TEMimage and related selected area diffraction patterns(SADP) of the DCPD coatings scraped by a sharpinstrument at different current densities. It was foundthat the DCPD crystals have a lath-like shape with 150–300 nm width and 700 nm/lm length in the range of0.25–1.2 mA/cm2 as can be seen in Figs. 7a–d. TheDCPD crystal size increased with increasing the currentdensity. The diffraction of DCPD nanosized crystallites,presented in the insets of Fig. 7, shows a continuous ringpatterns with no d-spacing of HA.
The XRD patterns of uncoated and depositedcoatings at constant deposition duration of 60 min for
(a) (b)
Fig. 3. Surface morphology of the Mg–Ca–Zn alloy before coating process; (a) low magnification and (b) high magnification.
4 International Journal of Applied Ceramic Technology—Bakhsheshi-Rad, et al. 2014
(a) (b)
(c) (d)
(e) (f)
(g) (h)
(i) (j)
Fig. 4. SEM micrographs of DCPD coating at 60 min for different current densities: (a, b) 0.15 mA/cm2, (c, d) 0.25 mA/cm2, (e, f)0.4 mA/cm2, (g, h) 0.8 mA/cm2, and (j, k) 1.2 mA/cm2.
www.ceramics.org/ACT Brushite Coatings on Biodegradable Mg-Ca-Zn Alloy 5
various current densities from 0.15 to 1.2 mA/cm2 areshown in Fig. 8. The XRD pattern of uncoated Mg–Ca–Zn alloy specimens shows the presence of relativelysmall, although discernible, reflections of Ca2Mg6Zn3phases (JCPDS file no. 12-0266) accompanied witha-Mg (JCPDS file no. 65-3365) reflection. TheCa2Mg6Zn3 phase has a trigonal structure with the spacegroup P31c and the lattice parameters a = 50.97 nm,c = 51.0 nm.24 XRD pattern of calcium phosphate coat-ing shows the presence of DCPD (JCPDS file no.09-0077) and Mg as main phases, accompanied withtrace amount of HA (JCPDS file no. 09-0432).25 As itcan be seen that by increasing current densities from0.15 to 1.2 mA/cm2, the phase type DCPD and HAwere not changed, but their peaks intensity changed(Fig. 8a). A peak of DCPD at 32° increased with theincrease of current density. The peak associated to HA at26° increased up to 0.4 mA/cm2 and then decreased.The increase in HA intensity can be attributed to theenhancement of HA phase crystallinity with increasingcurrent density. The XRD patterns of the coating at vari-ous duration from 5 to 90 min indicated that a peak ofDCPD at 25° increased with the time, while the
intensity of peaks of HA became broader. The Mgmatrix also decreases with the increasing deposition timeas seen in Fig. 8b. This was related to the increasing filmthickness with increasing deposition time. The peaks ofHA became broader with increasing deposition timeindicating a formation of film with poor crystallinity, orit consisted of small crystallites, which is similar to natu-ral bone mineral, favorable for tissue compatibility.23,26
It is also observed that the diffraction peak intensities ofthe HA phases for longer deposition time are consider-ably higher compared to the shorter time indicatingmore formation of HA with deposition time.
The FTIR spectra of DCPD detached from thespecimens coated at different current densities are shownin Fig. 9. It can be seen that the absorption band atabout 3436 cm�1 and another strong band at1654 cm�1 is due to O–H stretching vibration whichindicates the presence of water molecules in the DCPDstructure, while the absorption band at 1414 cm�1 isattributed to the vibration HCO�3 group of DCPD.Numerous water molecules existed between the individ-ual Ca9(PO4)6 clusters in the spherical structure of theamorphous precursor.26 The vibrations band related to
(a) (b)
Fig. 5. EDX analysis of (a) point A, B and (b) point C, D.
(a) (b)
Fig. 6. Cross-sectional SEM image of DCPD for different current densities (a) 0.25 mA/cm2 and (b) 0.8 mA/cm2.
6 International Journal of Applied Ceramic Technology—Bakhsheshi-Rad, et al. 2014
(a) (b)
(c) (d)
Fig. 7. TEM micrographs with selected area diffraction pattern of DCPD coating at 60 min for different current densities: (a) 0.25 mA/cm2, (b) 0.4 mA/cm2, (c) 0.8 mA/cm2, and (d) 1.2 mA/cm2.
(a) (b)
Fig. 8. X-ray diffraction patterns of uncoated and DCPD coating (a) at 60 min for different current densities and (b) at 0.4 mA/cm2 fordifferent deposition times.
www.ceramics.org/ACT Brushite Coatings on Biodegradable Mg-Ca-Zn Alloy 7
PO3�4 ion are observed at 587 cm�1 (v4), 611 cm�1
(v4), and 1072 cm�1 (v3). The occurrence of phosphatevibrations may confirm the transformation of the amor-phous phase into the crystalline phase. This result was inaccord with previous published work.26 The strong bandat 1414 cm�1 showed the incorporation of the carbonategroup into the DCPD lattice.
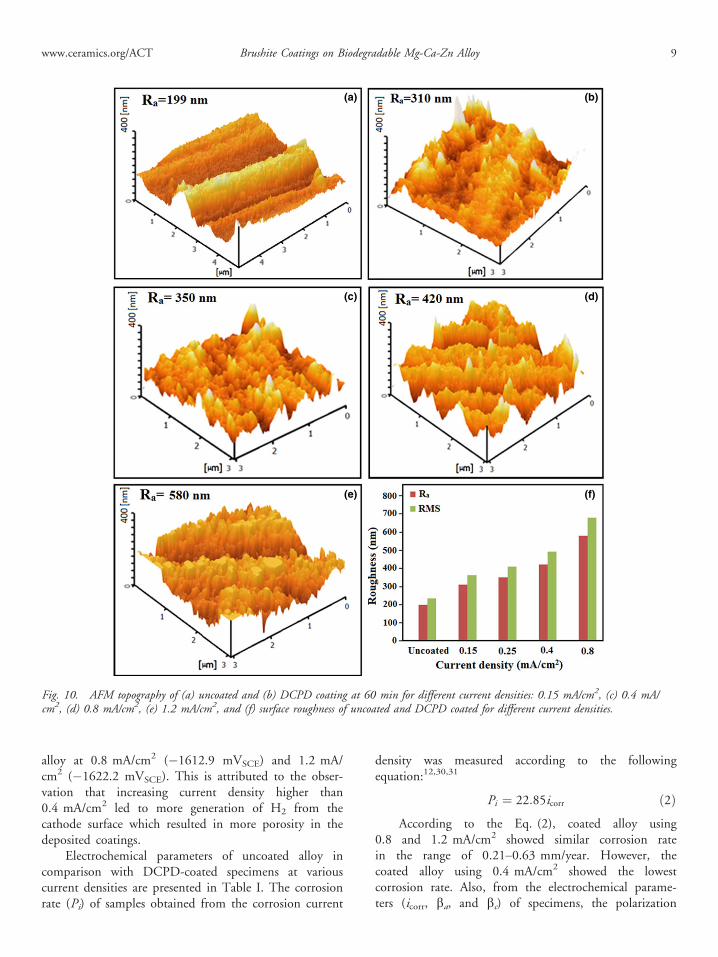
The peaks around to 2450 cm�1 are related to KBr.Furthermore, carbonate can be formed by the reaction ofhydroxyl ions (OH�) with carbon dioxide attained bythe air within drying process. Although the appliedcurrent did not cause significant change in the crystalstructure of DCPD, noticeable change occurred to themicrostructure that could be observed in the SEMmicrographs as shown in Fig. 4. The surface topographyof the uncoated and DCPD-coated specimens at differ-ent current densities (0.15 to 0.8 mA/cm2) for constantdeposition duration of 60 min are shown in Fig. 10.The bare Mg alloy had surface roughness average (Ra)and root mean square (RMS) values of 199 and234 nm, respectively (Figs. 10a and f). It is evident thatthe coatings deposited at a current density of 0.15 mA/cm2 were about 310 nm as can be seen in Fig. 10b. Afurther increased in current density to 0.4 mA/cm2
resulted in an increase in the coating roughness(Ra = 350 nm) as shown in Fig. 10c. At higher than0.4 mA/cm2 current density, the coating roughness (Ra)significantly increased (580 nm) as can be seen inFigs. 10d and e. The graph shows both Ra and RMSincreased with increasing current densities from 0.15 to0.8 mA/cm2 (Fig. 10f). This is due to the higher rate ofH2 generation from the cathode surface resulting inmore porosity in the coating. Besides, at a high value of
current density, the rate of deposition increased signifi-cantly, and coarse particles were deposited, contributionto the increase in coating roughness. In addition, theelectric field-induced particle aggregation and sedimenta-tion decrease the amount of fine particles in the suspen-sion and in the deposit which leads to more amounts ofcoarse particles deposited on the coating layer, and thus,the rougher surface was obtained.27 At higher appliedcurrent density, this phenomenon was more pronounced,which caused some coarse particles to fall off from thecoating and produced nonuniform deposit film. Thisresult is in good agreement with a published work byDjosic et al.15 As the deposition kinetic improved as aresult of high current density, the fast deposition of par-ticles prevented the formation of a uniform coating layerand therefore large pores formed in the deposited filmwith high surface roughness. The bonding strength ofthe coating at 0.15, 0.25, and 0.4 mA/cm2 was around16.4, 15.7, and 15.3 MPa, respectively, which is inaccordance with required norms (15 MPa) in orthopedicimplant industry.11 However, bonding strength of coatedspecimens at 0.8 and 1.2 mA/cm2 was around 14.6 and12.2 MPa, respectively. The lower bonding strength ofcoated specimens at higher current densities can be dueto deposition of more coarse particle on the surface andmore hydrogen bubbles accumulating on the specimenssurface which cause poor bonding between the coatingand substrate.
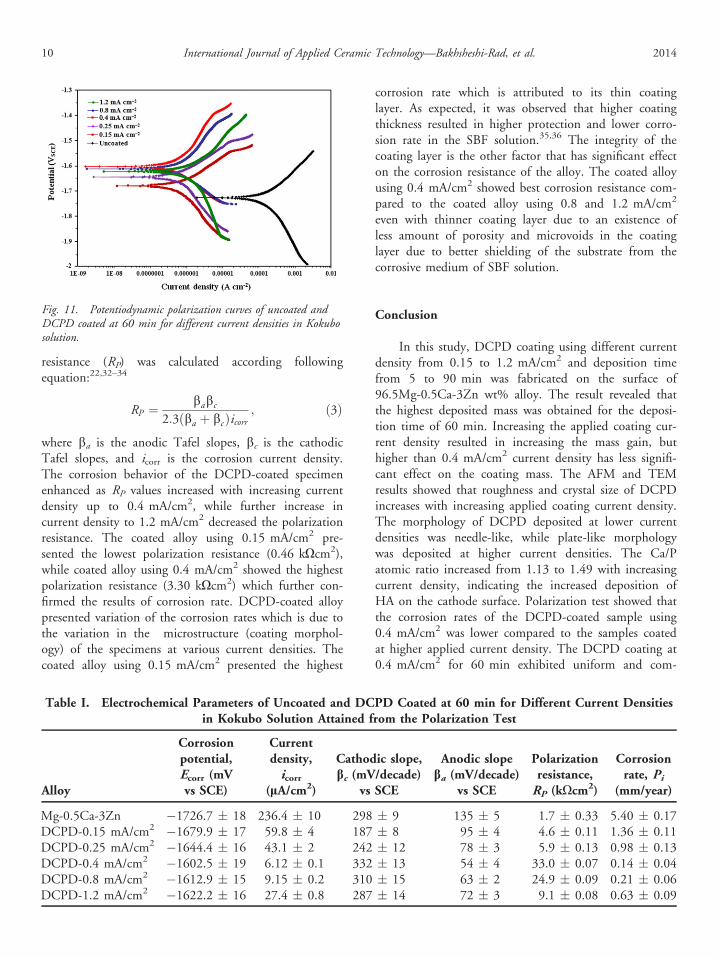
Figure 11 exhibited the polarization curves recordedafter 1 h of exposure to Kokubo solution for uncoatedand DCPD-coated specimens at different applied cur-rent densities from 0.5 to 1.2 mA/cm2. The DCPD-coated specimens at various current density presentedlower corrosion current density and nobler potentialcompared to the uncoated specimen indicating lowercorrosion rate of the coated alloys. This is due to for-mation of DCPD as a protective layer on the surfaceof Mg alloy which blocked the reaction for transporta-tion of species (such as water and chlorine) henceincreasing the corrosion resistance of the coated sam-ples.28,29 Among the five DCPD-coated specimens atdifferent current densities, that coated at 0.4 mA/cm2
presented the lowest corrosion current density(6.12 lA/cm2), while that coated at 0.15 mA/cm2 indi-cated the highest corrosion current density (59.8 lA/cm2). These values were followed by the 0.8 mA/cm2
coated sample (9.15 lA/cm2) and 1.2 mA/cm2 coatedsample (27.4 lA/cm2), indicating that the corrosionbehavior of the coated alloy is significantly affected bythe applied coating current densities. As can be seen,coated alloy at 0.4 mA/cm2 exhibited the more positivecorrosion potential (�1602.5 mVSCE) than the coated
Fig. 9. The FTIR characteristic bands of DCPD coating at60 min for different current densities: (a) 0.15 mA/cm2,(b) 0.25 mA/cm2, (c) 0.4 mA/cm2, (d) 0.8 mA/cm2, and (e)1.2 mA/cm2.
8 International Journal of Applied Ceramic Technology—Bakhsheshi-Rad, et al. 2014
alloy at 0.8 mA/cm2 (�1612.9 mVSCE) and 1.2 mA/cm2 (�1622.2 mVSCE). This is attributed to the obser-vation that increasing current density higher than0.4 mA/cm2 led to more generation of H2 from thecathode surface which resulted in more porosity in thedeposited coatings.
Electrochemical parameters of uncoated alloy incomparison with DCPD-coated specimens at variouscurrent densities are presented in Table I. The corrosionrate (Pi) of samples obtained from the corrosion current
density was measured according to the followingequation:12,30,31
Pi ¼ 22:85icorr ð2ÞAccording to the Eq. (2), coated alloy using
0.8 and 1.2 mA/cm2 showed similar corrosion ratein the range of 0.21–0.63 mm/year. However, thecoated alloy using 0.4 mA/cm2 showed the lowestcorrosion rate. Also, from the electrochemical parame-ters (icorr, ba, and bc) of specimens, the polarization
(a) (b)
(c) (d)
(e) (f)
Fig. 10. AFM topography of (a) uncoated and (b) DCPD coating at 60 min for different current densities: 0.15 mA/cm2, (c) 0.4 mA/cm2, (d) 0.8 mA/cm2, (e) 1.2 mA/cm2, and (f) surface roughness of uncoated and DCPD coated for different current densities.
www.ceramics.org/ACT Brushite Coatings on Biodegradable Mg-Ca-Zn Alloy 9
resistance (RP) was calculated according followingequation:22,32–34
RP ¼ babc2:3ðba þ bcÞicorr
; ð3Þ
where ba is the anodic Tafel slopes, bc is the cathodicTafel slopes, and icorr is the corrosion current density.The corrosion behavior of the DCPD-coated specimenenhanced as RP values increased with increasing currentdensity up to 0.4 mA/cm2, while further increase incurrent density to 1.2 mA/cm2 decreased the polarizationresistance. The coated alloy using 0.15 mA/cm2 pre-sented the lowest polarization resistance (0.46 kOcm2),while coated alloy using 0.4 mA/cm2 showed the highestpolarization resistance (3.30 kOcm2) which further con-firmed the results of corrosion rate. DCPD-coated alloypresented variation of the corrosion rates which is due tothe variation in the microstructure (coating morphol-ogy) of the specimens at various current densities. Thecoated alloy using 0.15 mA/cm2 presented the highest
corrosion rate which is attributed to its thin coatinglayer. As expected, it was observed that higher coatingthickness resulted in higher protection and lower corro-sion rate in the SBF solution.35,36 The integrity of thecoating layer is the other factor that has significant effecton the corrosion resistance of the alloy. The coated alloyusing 0.4 mA/cm2 showed best corrosion resistance com-pared to the coated alloy using 0.8 and 1.2 mA/cm2
even with thinner coating layer due to an existence ofless amount of porosity and microvoids in the coatinglayer due to better shielding of the substrate from thecorrosive medium of SBF solution.
Conclusion
In this study, DCPD coating using different currentdensity from 0.15 to 1.2 mA/cm2 and deposition timefrom 5 to 90 min was fabricated on the surface of96.5Mg-0.5Ca-3Zn wt% alloy. The result revealed thatthe highest deposited mass was obtained for the deposi-tion time of 60 min. Increasing the applied coating cur-rent density resulted in increasing the mass gain, buthigher than 0.4 mA/cm2 current density has less signifi-cant effect on the coating mass. The AFM and TEMresults showed that roughness and crystal size of DCPDincreases with increasing applied coating current density.The morphology of DCPD deposited at lower currentdensities was needle-like, while plate-like morphologywas deposited at higher current densities. The Ca/Patomic ratio increased from 1.13 to 1.49 with increasingcurrent density, indicating the increased deposition ofHA on the cathode surface. Polarization test showed thatthe corrosion rates of the DCPD-coated sample using0.4 mA/cm2 was lower compared to the samples coatedat higher applied current density. The DCPD coating at0.4 mA/cm2 for 60 min exhibited uniform and com-
Fig. 11. Potentiodynamic polarization curves of uncoated andDCPD coated at 60 min for different current densities in Kokubosolution.
Table I. Electrochemical Parameters of Uncoated and DCPD Coated at 60 min for Different Current Densitiesin Kokubo Solution Attained from the Polarization Test
Alloy
Corrosionpotential,Ecorr (mVvs SCE)
Currentdensity,icorr
(lA/cm2)
Cathodic slope,bc (mV/decade)
vs SCE
Anodic slopeba (mV/decade)
vs SCE
Polarizationresistance,RP (kOcm2)
Corrosionrate, Pi
(mm/year)
Mg-0.5Ca-3Zn �1726.7 � 18 236.4 � 10 298 � 9 135 � 5 1.7 � 0.33 5.40 � 0.17DCPD-0.15 mA/cm2 �1679.9 � 17 59.8 � 4 187 � 8 95 � 4 4.6 � 0.11 1.36 � 0.11DCPD-0.25 mA/cm2 �1644.4 � 16 43.1 � 2 242 � 12 78 � 3 5.9 � 0.13 0.98 � 0.13DCPD-0.4 mA/cm2 �1602.5 � 19 6.12 � 0.1 332 � 13 54 � 4 33.0 � 0.07 0.14 � 0.04DCPD-0.8 mA/cm2 �1612.9 � 15 9.15 � 0.2 310 � 15 63 � 2 24.9 � 0.09 0.21 � 0.06DCPD-1.2 mA/cm2 �1622.2 � 16 27.4 � 0.8 287 � 14 72 � 3 9.1 � 0.08 0.63 � 0.09
10 International Journal of Applied Ceramic Technology—Bakhsheshi-Rad, et al. 2014
pact film with needle-like morphology offering highestcorrosion resistance.
Acknowledgments
The authors would like to acknowledge the Univer-siti Teknologi Malaysia (UTM) and Nippon Sheet GlassFoundation for providing research facilities and financialsupport under Grant No. R.J.130000.7324.4B136.
References
1. X. N. Gu, N. Li, W. R. Zhou, Y. F. Zheng, and X. Zhao, Acta Biomater., 71880–1889 (2011).
2. L. H. Li, et al., Surf. Interface Anal., 46 7–15 (2014).3. Z. Wei, H. Du, and E. Zhang, Surf. Interface Anal., 43 791–794 (2011).4. H. Cao and X. Liu, Int. J. Appl. Ceram. Technol., 10 1–10 (2013).5. R. Amini and A. A. Sarabi, Appl. Surf. Sci., 257 7134–7139 (2011).6. Y. Shi, M. Qi, Y. Chen, and P. Shi, Mater. Lett., 65 2201–2204 (2011).7. S. Shadanbaz and G. J. Dias, Acta Biomater., 8 20–30 (2012).8. H. R. Bakhsheshi-Rad, E. Hamzah, M. Daroonparvar, R. E. Kahrizsangi,
and M. Medraj, Ceram. Int., 40 7971–7982 (2014).9. H. Farnoush, J. A. Mohandesi, and D. H. Fatmehsari, Int. J. Appl. Ceram.
Technol., 10 87–96 (2013).10. E. A. Abdel-Aal, D. Dietrich, S. Steinhaeuser, and B. Wielage, Surf. Coat.
Technol., 202 5895–5900 (2008).11. M. Esnaashary, M. Fathi, and M. Ahmadian, Int. J. Appl. Ceram. Technol.,
11 47–56 (2014).12. H. R. Bakhsheshi-Rad, M. H. Idris, and M. R. Abdul-Kadir, Surf. Coat.
Technol., 222 79–89 (2013).13. A. Dey, Int. J. Appl. Ceram. Technol., 11 65–82 (2014).
14. R. Hu, C. Lin, H. Shi, and H. Wang, Mater. Chem. Phys., 115 718–723(2009).
15. M. S. Djosic, V. Panic, J. Stojanovic, M. Mitric, and V. B. Miˇskovi0c-Stankovic, Colloids Surf. A Physicochem. Eng. Asp., 400 36–43 (2012).
16. M. C. Wang, W. J. Shih, K. M. Chang, S. H. Wang, W. L. Li, and H. H.Huang, J. Non-Cryst. Solids, 356 1546–1553 (2010).
17. M. Jamesh, K. Satendra, and T. S. N. S. Narayanan, J. Coating. Tech. Res, 9495–502 (2012).
18. C. Wen, S. Guan, L. Peng, C. Ren, X. Wang, and Z. Hu, Appl. Surf. Sci.,255 6433–6438 (2009).
19. Y. Song, S. Zhang, J. Li, C. Zhao, and X. Zhang, Acta Biomater., 6 1736–1742 (2010).
20. J. Li, Y. Song, and S. Zhang, Biomaterials, 31 5782–5788 (2010).21. Y. Li, et al., Acta Biomater., 8 3177–3188 (2012).22. H. R. Bakhsheshi-Rad, et al., Mater. Design, 53 283–292 (2014).23. S. H. Wang, W. J. Shih, and W. L. Li, J. Eur. Ceram. Soc., 25 3287–3292
(2005).24. P. M. Jardim, G. Sol�orzano, and J. B. Vander Sande, Microsc. Microanal., 8
487–496 (2002).25. H. Wang, S. Zhu, L. Wang, Y. Feng, X. Ma, and S. Guan, Appl. Surf. Sci.,
307 92–100 (2014).26. S. R€ossler, A. Sewing, M. St€olzel, R. Born, D. Scharnweber, M. Dard, and
H. Worch, J. Biomed. Mater. Res. A, 64 655–663 (2003).27. I. Zhitomirsky, Mater. Lett., 42 262–271 (2000).28. W. Zhou, D. Shan, E. H. Han, and W. Ke, Corros. Sci., 50 329–337 (2008).29. H. R. Bakhsheshi-Rad, E. Hamzah, M. Daroonparvar, M. Kasiri-Asgarani,
and M. Medraj, Ceram. Int., 40 7971–7982 (2014).30. Z. Shi, M. Liu, and A. Atrens, Corros. Sci., 52 579–588 (2010).31. Z. Shi and A. Atrens, Corros. Sci., 53 226–246 (2011).32. G. R. Argade, K. Kandasamy, S. K. Panigrahi, and R. S. Mishra, Corros.
Sci., 58 321–326 (2012).33. M. Liu, P. Schmutz, P. J. Uggowitzer, G. Song, and A. Atrens, Corros. Sci.,
52 3687–3701 (2010).34. H. R. Bakhsheshi-Rad, M. R. Abdul-Kadir, M. H. Idris, and S. Farahany,
Corros. Sci., 64 184–197 (2012).35. X. N. Gu, W. Zheng, Y. Cheng, and Y. F. Zheng, Acta Biomater., 5 2790–
2799 (2009).36. H. R. Bakhsheshi-Rad, E. Hamzah, M. Daroonparvar, M. Kasiri-Asgarani,
and M. Medraj, Ceram. Int., 40 14009–14018 (2014).
www.ceramics.org/ACT Brushite Coatings on Biodegradable Mg-Ca-Zn Alloy 11


![Electrodeposition of Zn-Mn alloys from recycling battery leach … · 2014. 5. 20. · recovery by electrodeposition [1–4] is currently being studied in our laboratory [5]. Electrodeposition](https://img.pdfslide.us/doc/110x75/6112e3e4b1654c15ca54266d/electrodeposition-of-zn-mn-alloys-from-recycling-battery-leach-2014-5-20-recovery.jpg)