Embed Size (px)
Citation preview
Effect of continued treatment with pirfenidone following clinically
meaningful declines in forced vital capacity: Analysis of data from three
phase 3 trials in patients with idiopathic pulmonary fibrosis
Steven D. Nathan, Carlo Albera, Williamson Z. Bradford, Ulrich Costabel,
Roland M. du Bois, Elizabeth A. Fagan, Robert S. Fishman, Ian Glaspole, Marilyn K.
Glassberg, Kenneth F. Glasscock, Talmadge E. King, Jr., Lisa Lancaster, David J. Lederer,
Zhengning Lin, Carlos A. Pereira, Jeffrey J. Swigris, Dominique Valeyre, Paul W. Noble,
Athol U. Wells
Online Data Supplement

Table of Contents
Table S1 Demographics and baseline characteristics
Table S2 Categorical shift analysis of absolute change in percent predicted FVC
during consecutive 6 month intervals in the pooled placebo population
using 5% categorical thresholds
Table S3 Categorical shift analysis of relative change in percent predicted FVC
during consecutive 6-month intervals in the pooled placebo population
Figure S1 Difference between changes in percent predicted FVC during consecutive
6-month intervals in the pooled placebo population
Table S4 Outcomes between month 3 and month 9 in patients with an initial decline
in percent predicted FVC ≥10% between baseline and month 3
Table S5 Outcomes between month 6 and month 12 in patients with an initial
decline in percent predicted FVC ≥10% between month 3 and month 6
Table S6 Summary of FVC measurements at the end of the second 6-month
assessment period
Table S7 Sensitivity analyses of treatment outcomes using alternative methods for
handling missing data
Table S8 Outcomes after 6 months of continued treatment following an initial
relative decline in percent predicted FVC ≥10%
Table S9 Outcomes after 6 months of continued treatment following an initial
decline in percent predicted FVC ≥10% (on-treatment analysis)
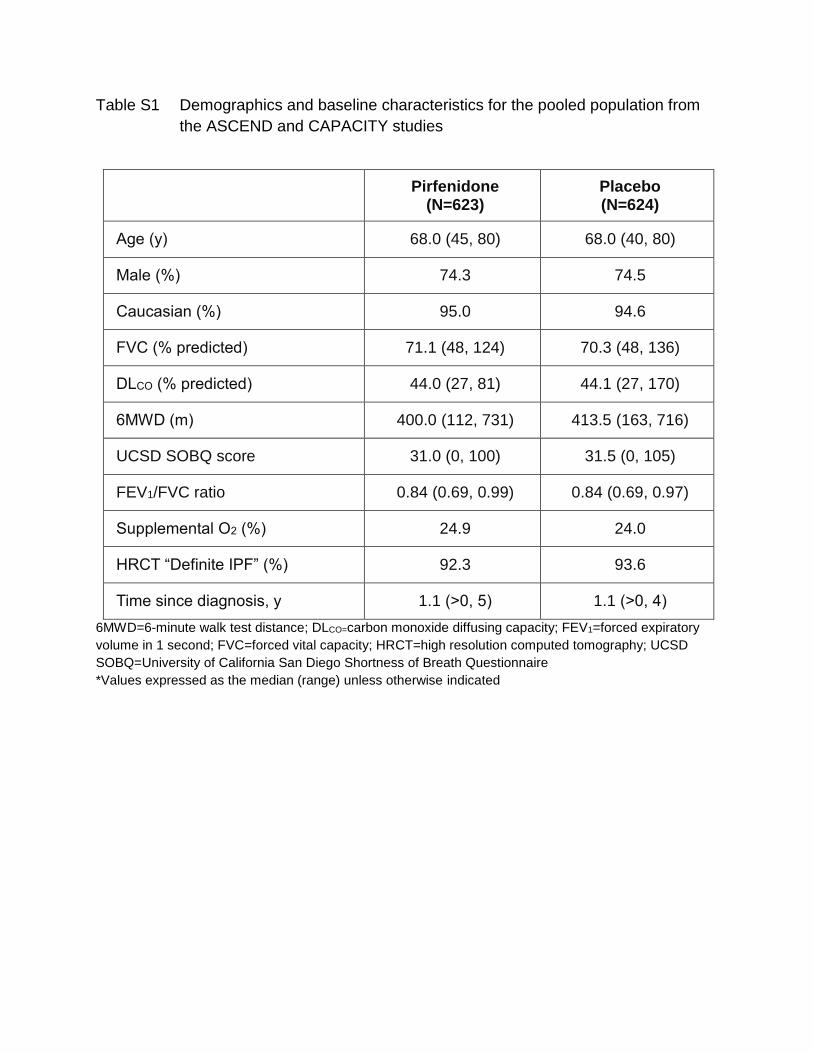
Table S1 Demographics and baseline characteristics for the pooled population from
the ASCEND and CAPACITY studies
Pirfenidone (N=623)
Placebo (N=624)
Age (y) 68.0 (45, 80) 68.0 (40, 80)
Male (%) 74.3 74.5
Caucasian (%) 95.0 94.6
FVC (% predicted) 71.1 (48, 124) 70.3 (48, 136)
DLCO (% predicted) 44.0 (27, 81) 44.1 (27, 170)
6MWD (m) 400.0 (112, 731) 413.5 (163, 716)
UCSD SOBQ score 31.0 (0, 100) 31.5 (0, 105)
FEV1/FVC ratio 0.84 (0.69, 0.99) 0.84 (0.69, 0.97)
Supplemental O2 (%) 24.9 24.0
HRCT “Definite IPF” (%) 92.3 93.6
Time since diagnosis, y 1.1 (>0, 5) 1.1 (>0, 4)
6MWD=6-minute walk test distance; DLCO=carbon monoxide diffusing capacity; FEV1=forced expiratory
volume in 1 second; FVC=forced vital capacity; HRCT=high resolution computed tomography; UCSD
SOBQ=University of California San Diego Shortness of Breath Questionnaire
*Values expressed as the median (range) unless otherwise indicated
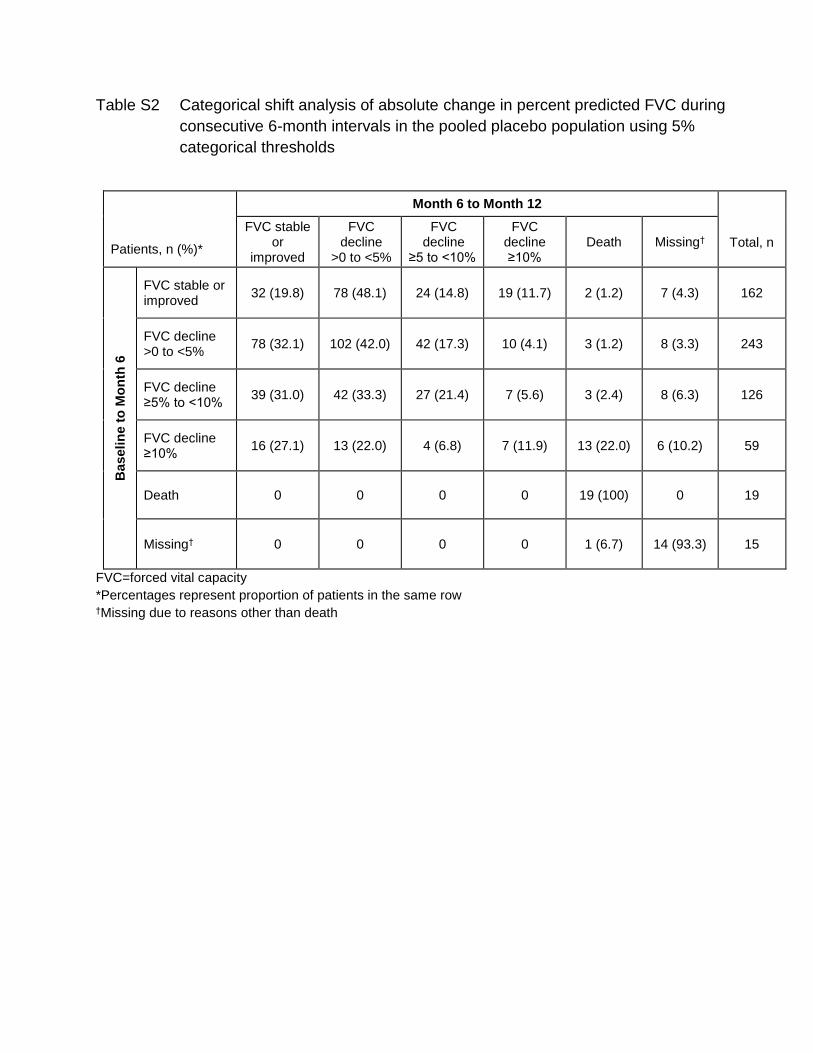
Table S2 Categorical shift analysis of absolute change in percent predicted FVC during
consecutive 6-month intervals in the pooled placebo population using 5%
categorical thresholds
Patients, n (%)*
Month 6 to Month 12
Total, n
FVC stable or
improved
FVC decline
>0 to <5%
FVC decline
≥5 to <10%
FVC decline ≥10%
Death Missing†
Baseli
ne t
o M
on
th 6
FVC stable or improved
32 (19.8) 78 (48.1) 24 (14.8) 19 (11.7) 2 (1.2) 7 (4.3) 162
FVC decline >0 to <5%
78 (32.1) 102 (42.0) 42 (17.3) 10 (4.1) 3 (1.2) 8 (3.3) 243
FVC decline ≥5% to <10%
39 (31.0) 42 (33.3) 27 (21.4) 7 (5.6) 3 (2.4) 8 (6.3) 126
FVC decline ≥10%
16 (27.1) 13 (22.0) 4 (6.8) 7 (11.9) 13 (22.0) 6 (10.2) 59
Death 0 0 0 0 19 (100) 0 19
Missing† 0 0 0 0 1 (6.7) 14 (93.3) 15
FVC=forced vital capacity
*Percentages represent proportion of patients in the same row†Missing due to reasons other than death
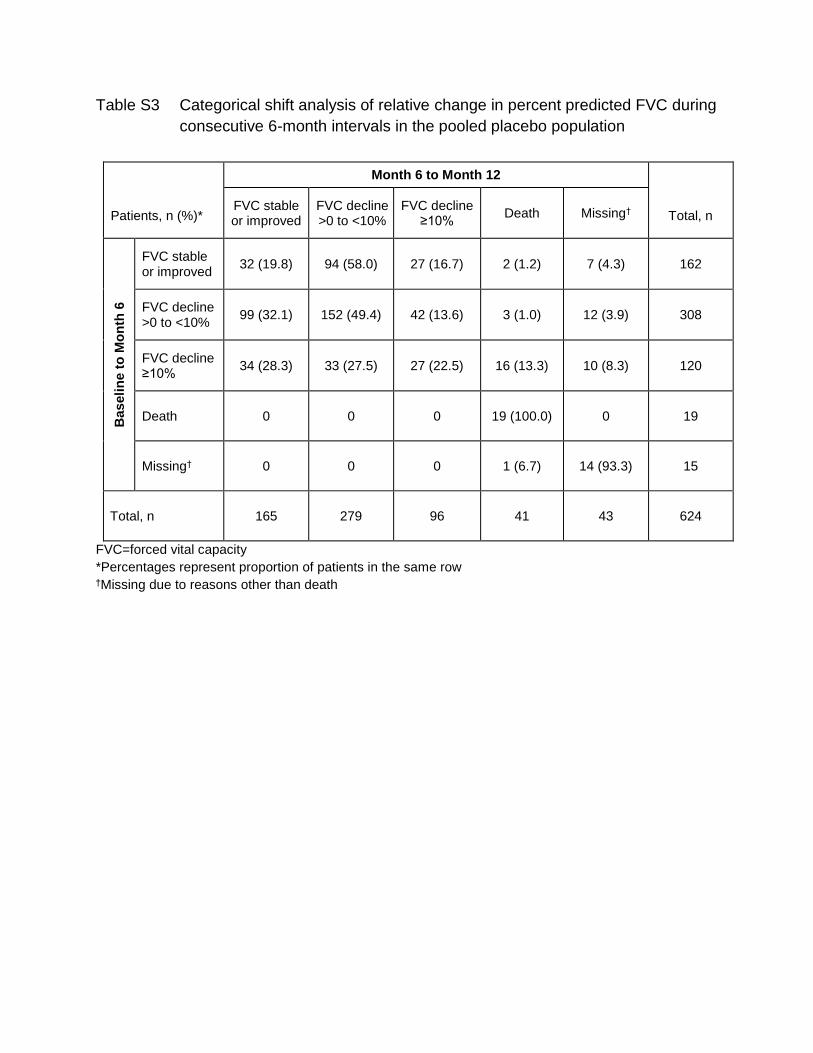
Table S3 Categorical shift analysis of relative change in percent predicted FVC during
consecutive 6-month intervals in the pooled placebo population
Patients, n (%)*
Month 6 to Month 12
Total, n FVC stable or improved
FVC decline >0 to <10%
FVC decline ≥10%
Death Missing†
Baseli
ne t
o M
on
th 6
FVC stable or improved
32 (19.8) 94 (58.0) 27 (16.7) 2 (1.2) 7 (4.3) 162
FVC decline >0 to <10%
99 (32.1) 152 (49.4) 42 (13.6) 3 (1.0) 12 (3.9) 308
FVC decline ≥10%
34 (28.3) 33 (27.5) 27 (22.5) 16 (13.3) 10 (8.3) 120
Death 0 0 0 19 (100.0) 0 19
Missing† 0 0 0 1 (6.7) 14 (93.3) 15
Total, n 165 279 96 41 43 624
FVC=forced vital capacity
*Percentages represent proportion of patients in the same row†Missing due to reasons other than death

Figure S1 Difference between changes in percent predicted FVC during consecutive
6-month intervals in the pooled placebo population (N=540)*
FVC=forced vital capacity
*Excludes 84 patients with missing values at either the month 6 or month 12 study visit†Interval 1=baseline to month 6; Interval 2=month 6 to month 12
Data summary: Difference in the change in %FVC (Interval 2 vs. Interval 1)*
ΔFVC Difference (Interval 2 vs. Interval 1)*†
Pooled Placebo (N=540)‡
>15% 14 (2.6%)
>10% to 15% 29 (5.4%)
>5% to 10% 84 (15.6%)
>0% to 5% 147 (27.2%)
=0% 0
<0% to −5% 147 (27.2%)
<−5% to −10% 74 (13.7%)
<‒10% to −15% 24 (4.4%)
<−15% 21 (3.9%)
*Interval 1=baseline to month 6; Interval 2=month 6 to month 12†Difference calculated as ΔFVC(Interval 2) − ΔFVC(Interval 1) ‡Excludes 84 patients with missing FVC values at either month 6 or month 12

Table S4 Outcomes between month 3 and month 9 in patients with an initial decline in
percent predicted FVC ≥10% between baseline and month 3*
Pirfenidone (N=14)
Placebo (N=24)
Relative Difference
≥10% decline in FVC or death 1 (7.1%) 5 (20.8%) −65.7%
No further decline in FVC† 9 (64.3%) 12 (50.0%) 28.6%
Death 0 (0.0%) 4 (16.7%) −100%
Change in %FVC, Mean (SD)
0.9 (7.2) −7.3 (19.3)
NA Change in %FVC, Median (range)
0 (−11, 16)
0 (−57, 11)
FVC=forced vital capacity
*Initial decline in percent predicted FVC ≥10% calculated as absolute change from baseline†Either no decline or increase in FVC
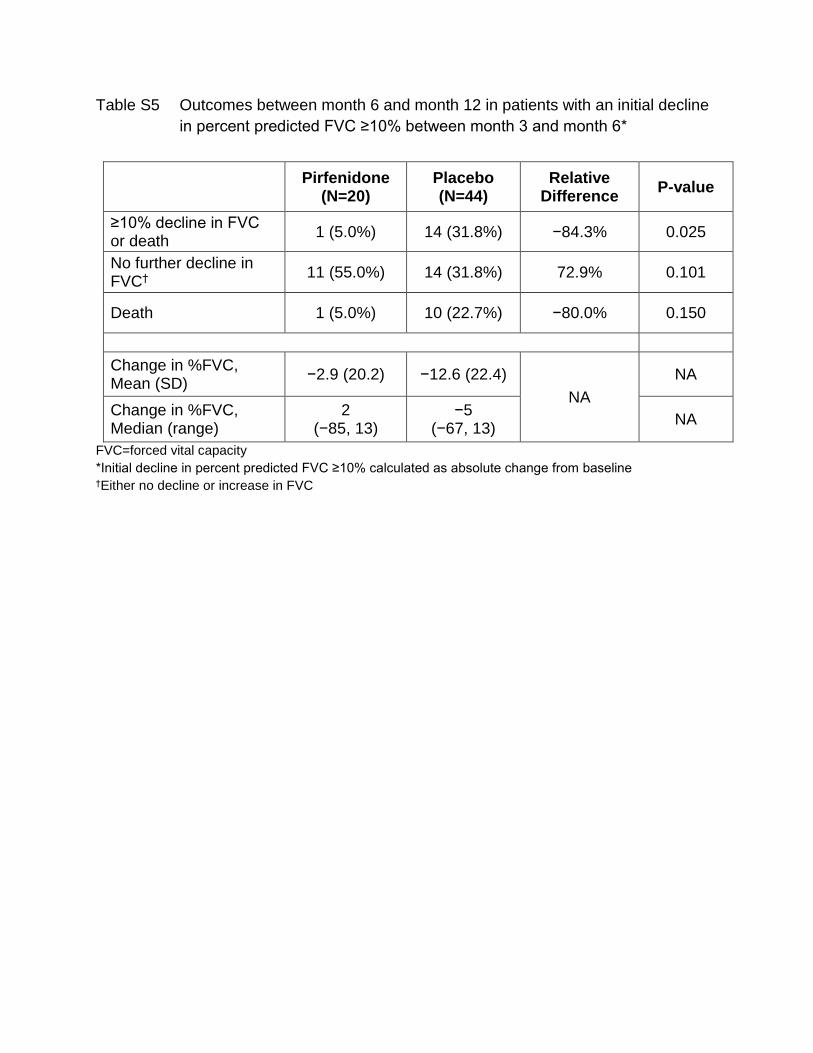
Table S5 Outcomes between month 6 and month 12 in patients with an initial decline
in percent predicted FVC ≥10% between month 3 and month 6*
Pirfenidone (N=20)
Placebo (N=44)
Relative Difference
P-value
≥10% decline in FVC or death
1 (5.0%) 14 (31.8%) −84.3% 0.025
No further decline in FVC†
11 (55.0%) 14 (31.8%) 72.9% 0.101
Death 1 (5.0%) 10 (22.7%) −80.0% 0.150
Change in %FVC, Mean (SD)
−2.9 (20.2) −12.6 (22.4)
NA
NA
Change in %FVC, Median (range)
2 (−85, 13)
−5 (−67, 13)
NA
FVC=forced vital capacity
*Initial decline in percent predicted FVC ≥10% calculated as absolute change from baseline†Either no decline or increase in FVC
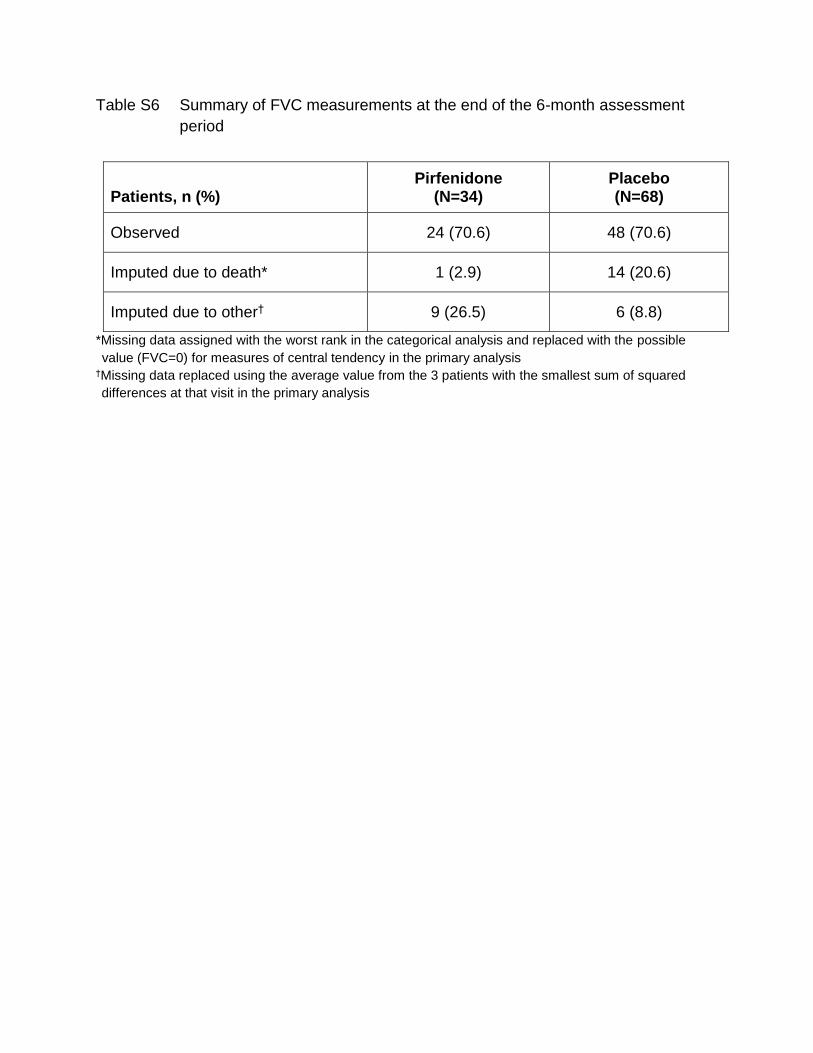
Table S6 Summary of FVC measurements at the end of the 6-month assessment
period
Patients, n (%) Pirfenidone
(N=34) Placebo (N=68)
Observed 24 (70.6) 48 (70.6)
Imputed due to death* 1 (2.9) 14 (20.6)
Imputed due to other† 9 (26.5) 6 (8.8)
*Missing data assigned with the worst rank in the categorical analysis and replaced with the possible
value (FVC=0) for measures of central tendency in the primary analysis†Missing data replaced using the average value from the 3 patients with the smallest sum of squared
differences at that visit in the primary analysis

Table S7 Sensitivity analyses of treatment outcomes using alternative methods for
handling missing data
(A) Missing due to death imputed using FVC=30%; missing due to reasons other than
death imputed using SSD*
Pirfenidone (N=34)
Placebo (N=68)
Relative Difference P-value
≥10% decline in FVC or death
2 (5.9%) 19 (27.9%) −78.9% 0.009†
No further decline in FVC‡
20 (58.8%) 26 (38.2%) 53.8% 0.059†
Death 1 (2.9%) 14 (20.6%) −85.7% 0.018†
Change in %FVC Mean (SD)
−0.5 (11.6) −4.5 (10.7)
NA 0.025‖ Change in %FVC Median (range)
1.0 (−54.6, 16.2)
−3.0 (−37.3, 13.0)
FVC=forced vital capacity; SD=standard deviation; SSD=sum of squared differences
*Initial decline in percent predicted FVC ≥10% occurring during the first 6 months of study†Fisher’s exact test ‡Either no decline or increase in FVC ‖Rank ANCOVA (pirfenidone 2403 mg/d vs. placebo)
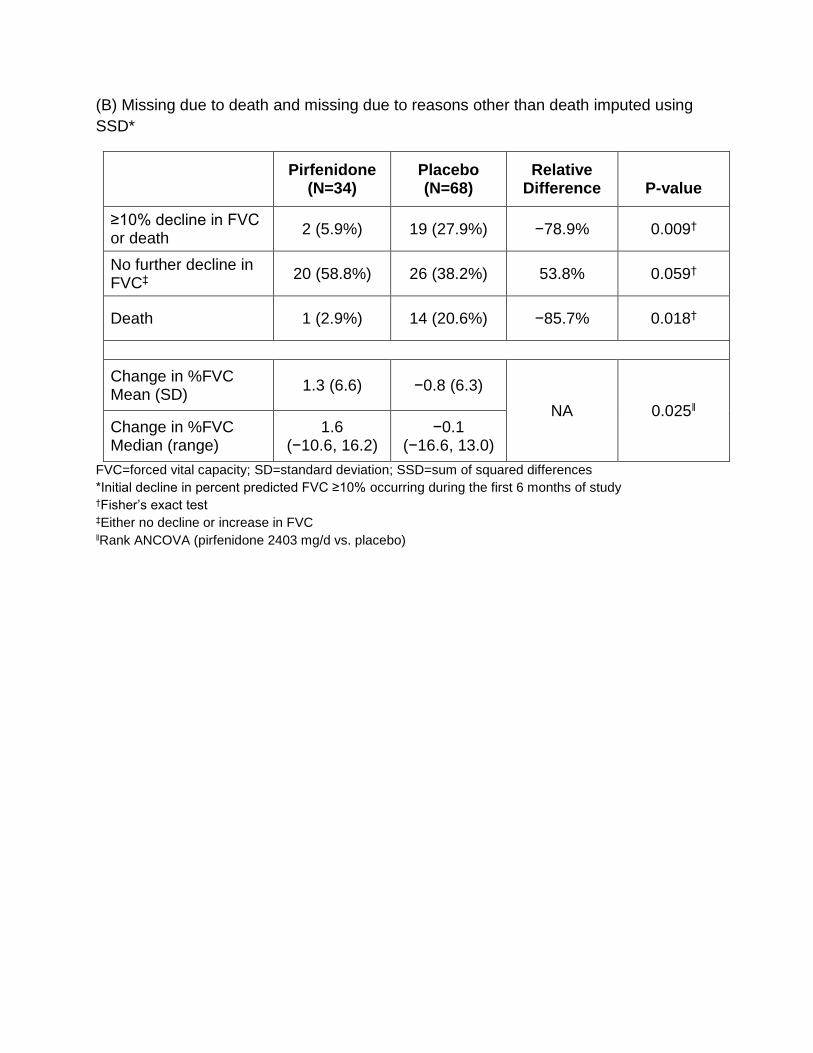
(B) Missing due to death and missing due to reasons other than death imputed using
SSD*
Pirfenidone (N=34)
Placebo (N=68)
Relative Difference P-value
≥10% decline in FVC or death
2 (5.9%) 19 (27.9%) −78.9% 0.009†
No further decline in FVC‡
20 (58.8%) 26 (38.2%) 53.8% 0.059†
Death 1 (2.9%) 14 (20.6%) −85.7% 0.018†
Change in %FVC Mean (SD)
1.3 (6.6) −0.8 (6.3)
NA 0.025‖ Change in %FVC Median (range)
1.6 (−10.6, 16.2)
−0.1 (−16.6, 13.0)
FVC=forced vital capacity; SD=standard deviation; SSD=sum of squared differences
*Initial decline in percent predicted FVC ≥10% occurring during the first 6 months of study†Fisher’s exact test ‡Either no decline or increase in FVC ‖Rank ANCOVA (pirfenidone 2403 mg/d vs. placebo)
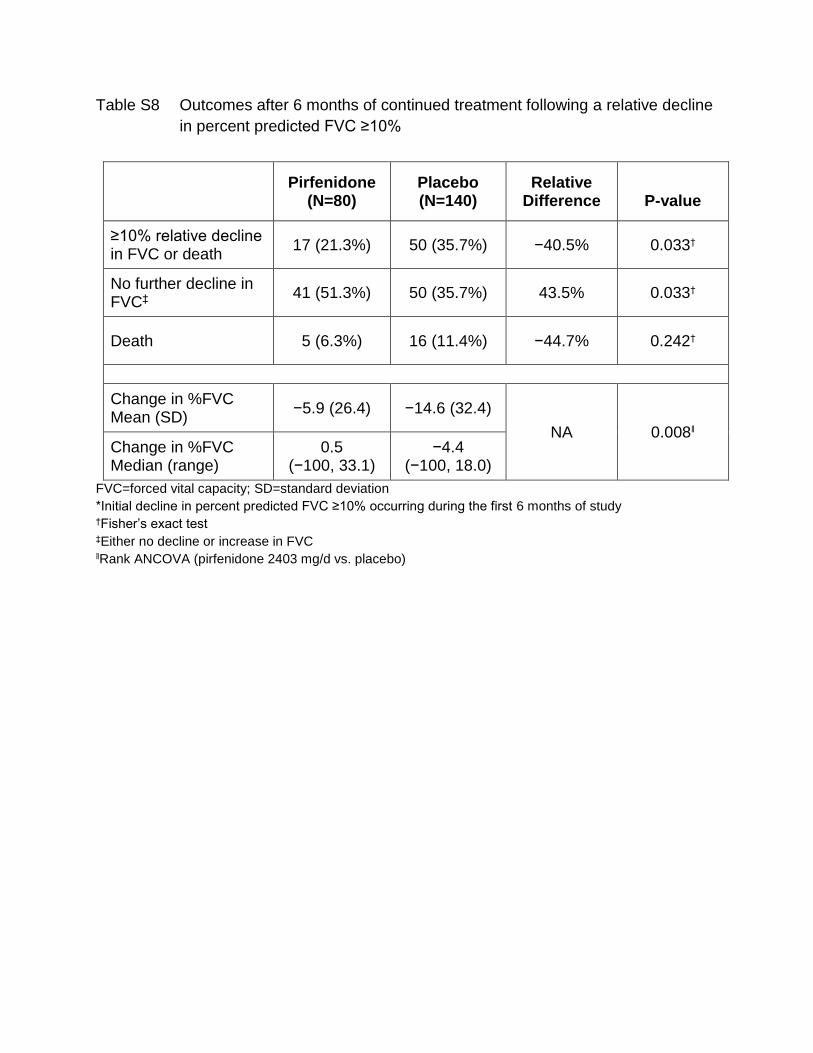
Table S8 Outcomes after 6 months of continued treatment following a relative decline
in percent predicted FVC ≥10%
Pirfenidone (N=80)
Placebo (N=140)
Relative Difference P-value
≥10% relative decline in FVC or death
17 (21.3%) 50 (35.7%) −40.5% 0.033†
No further decline in FVC‡
41 (51.3%) 50 (35.7%) 43.5% 0.033†
Death 5 (6.3%) 16 (11.4%) −44.7% 0.242†
Change in %FVC Mean (SD)
−5.9 (26.4) −14.6 (32.4)
NA 0.008‖ Change in %FVC Median (range)
0.5 (−100, 33.1)
−4.4 (−100, 18.0)
FVC=forced vital capacity; SD=standard deviation
*Initial decline in percent predicted FVC ≥10% occurring during the first 6 months of study†Fisher’s exact test ‡Either no decline or increase in FVC ‖Rank ANCOVA (pirfenidone 2403 mg/d vs. placebo)
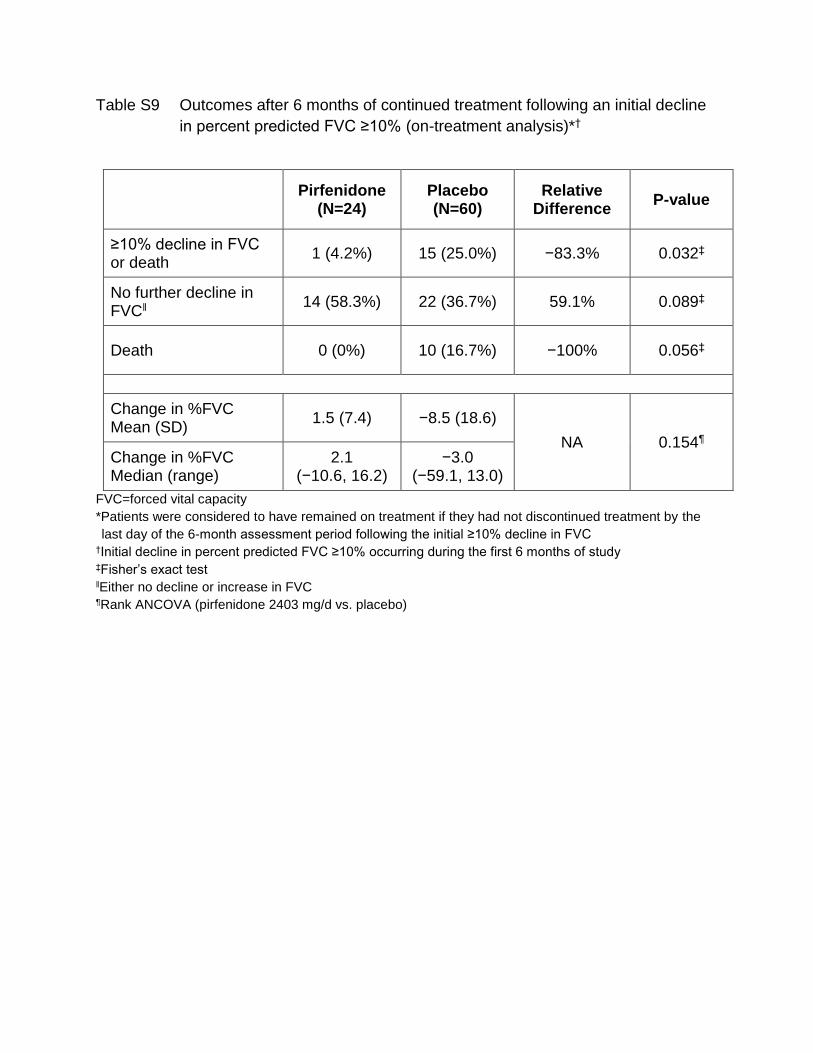
Table S9 Outcomes after 6 months of continued treatment following an initial decline
in percent predicted FVC ≥10% (on-treatment analysis)*†
Pirfenidone (N=24)
Placebo (N=60)
Relative Difference
P-value
≥10% decline in FVC or death
1 (4.2%) 15 (25.0%) −83.3% 0.032‡
No further decline in FVC‖
14 (58.3%) 22 (36.7%) 59.1% 0.089‡
Death 0 (0%) 10 (16.7%) −100% 0.056‡
Change in %FVC Mean (SD)
1.5 (7.4) −8.5 (18.6)
NA 0.154¶ Change in %FVC Median (range)
2.1 (−10.6, 16.2)
−3.0 (−59.1, 13.0)
FVC=forced vital capacity
*Patients were considered to have remained on treatment if they had not discontinued treatment by the
last day of the 6-month assessment period following the initial ≥10% decline in FVC†Initial decline in percent predicted FVC ≥10% occurring during the first 6 months of study‡Fisher’s exact test ‖Either no decline or increase in FVC ¶Rank ANCOVA (pirfenidone 2403 mg/d vs. placebo)