Embed Size (px)
Citation preview

AQUATIC BIOLOGYAquat Biol
Vol. 22: 43–57, 2014doi: 10.3354/ab00606
Published November 20
INTRODUCTION
The ocean plays an important role in counteractingthe accumulation of anthropogenic CO2 in the atmo -sphere (Sabine et al. 2004). Carbon fixation into par-ticulate organic carbon (POC) performed by marine
photosynthetic organisms and the subsequent sink-ing of POC which is sequestered in deep waters (theso-called biological pump) are 2 of the main organ-ism-mediated processes that are involved in this CO2
sink effect. In pelagic ecosystems, a large proportionof the POC produced by the phytoplankton is re -
© The authors 2014. Open Access under Creative Commons byAttribution Licence. Use, distribution and reproduction are un -restricted. Authors and original publication must be credited.
Publisher: Inter-Research · www.int-res.com
*Corresponding author: [email protected]
Effect of CO2, nutrients and light on coastal plankton. II. Metabolic rates
J. M. Mercado1,*, C. Sobrino2, P. J. Neale3, M. Segovia4, A. Reul4, A. L. Amorim1, P. Carrillo5, P. Claquin6, M. J. Cabrerizo5, P. León1, M. R. Lorenzo4, J. M. Medina-Sánchez7,
V. Montecino8, C. Napoleon6, O. Prasil9, S. Putzeys1, S. Salles1, L. Yebra1
1Centro Oceanográfico de Málaga, Instituto Español de Oceanografía, Puerto Pesquero s/n, 29640 Fuengirola, Málaga, Spain2Department of Ecology and Animal Biology, Faculty of Sciences, University of Vigo, 36310 Vigo, Spain
3Smithsonian Environmental Research Center, Edgewater, Maryland 21037, USA4Department of Ecology, Faculty of Sciences, University of Málaga, 29071 Málaga, Spain
5Instituto del Agua, Universidad de Granada, Granada, Spain6Université Caen Basse-Normandie, BIOMEA FRE3484 CNRS, 14032 Caen Cedex, France
7Departamento de Ecología, Facultad de Ciencias, Universidad de Granada, Granada, Spain8Departamento de Ciencias Ecológicas, Facultad de Ciencias, Universidad de Chile, Santiago, Chile
9Laboratory of Photosynthesis, CenterAlgatech, Institute of Microbiology ASCR, 37981 Trebon, Czech Republic
ABSTRACT: We conducted a microcosm experiment aimed at studying the interactive effectsof high CO2, nutrient loading and irradiance on the metabolism of a planktonic communitysampled in the Western Mediterranean near the coast of Málaga. Changes in the metabolismof phytoplankton and bacterioplankton were observed for 7 d under 8 treatment conditions,representing the full factorial combinations of 2 levels each of CO2, nutrient concentrationand solar radiation exposure. The initial plankton sample was collected at the surface froma stratified water column, indicating that phytoplankton were naturally acclimated to highirradiance and low nutrient concentrations. Nutrient addition combined with high irradianceresulted in a significant increase in primary production. Nitrate uptake by phytoplankton wasalso stimulated under high nutrient conditions. High nutrients, high irradiance and the combi-nation of low CO2 and high irradiance positively affected bacterial production. Light was themain factor affecting the respiration rates of the community, which were higher at the highlight level. After 7 d of incubation, nutrient loading was the only factor that significantlyaffected the amount of particulate organic carbon (POC) accumulated in the microcosms.Therefore, the changes in metabolic rates produced at high CO2 had no effect on net produc-tion of particulate organic matter. If these results are extrapolated to the natural environment,it could be hypothesized that high levels of CO2 will have a limited impact on biologicalpump activity in the northern Alboran Sea since it is assumed that POC export towards deeperlayers determines the potential for carbon sequestration.
KEY WORDS: Acidification · Bacterioplankton · Nutrients · Phytoplankton · Primary productivity · Respiration · UVR
Contribution to the Theme Section ‘Environmental forcing of aquatic primary productivity’ OPENPEN ACCESSCCESS

Aquat Biol 22: 43–57, 2014
mineralized by respiration in the surface layer andtransferred back into the dissolved inorganic carbon(DIC) pool (Marañón et al. 2005). Phytoplankton alsorelease some fixed carbon as dissolved organic car-bon (DOC), most of which is remineralized by bacte-ria. Only a small part of the fixed carbon is exportedtowards deeper layers in the particulate form of zoo-plankton faecal pellets (Fowler & Knauer 1986), mar-ine snow aggregates (Kiørboe 2001) and transparentexopolymer particles (TEP, formed by aggregation ofdissolved polysaccharides; Passow 2002). The net bal-ance between primary production and respiration inthe upper layer of the ocean determines its potentialfor carbon sequestration (del Giorgio & Duarte 2002).
The Mediterranean Sea is an oligotrophic basinwhere primary production has been long recognisedto be limited by phosphorus (Krom et al. 1991, 2004,Siokou-Frangou et al. 2010), although some morerecent studies have qualified this paradigm (Tanakaet al. 2013). A large proportion of the organic carbonenters the DOC pool with limited contribution to thebiological pump (Thingstad & Rassoulzadegan 1995).However, this overall productivity pattern is modi-fied locally in areas affected by coastal upwellingand fronts caused by geostrophic currents wherephytoplankton biomass and productivity rates are anorder of magnitude higher than in the Mediterraneanoligotrophic areas (D’Ortenzio & Ribera d’Alcalà2009). One of these areas is the northwestern Albo-ran Sea (the westernmost basin in the MediterraneanSea), where wind-induced upwelling injects CO2
and nutrients into the euphotic zone triggering thegrowth of large-sized phytoplankton with high sink-ing rates (Goldman 1993, Mercado et al. 2007). Thephytoplankton response to these nutrient enrichmentepisodes is quite rapid (24 to 48 h), and bloom declineoccurs within 5 to 6 d after reaching the biomasspeak. Ramírez et al. (2006) reported enhanced plank-ton respiratory activity during upwelling episodes,but this increase was comparatively lower than theprimary production increase. Consequently, the up -welling significantly increases net production ofexportable POC in the Alboran Sea (a common phe-nomenon in other upwelling areas; Martínez 1997).
Ocean acidification will potentially modulate thebio logical pump activity by means of changes in pro-duction and carbon consumption in the upper oceanlayer (Riebesell & Tortell 2011, Passow & Carlson2012). However, results of experiments where naturalplankton assemblages were subject to elevated CO2
concentrations indicate that the response to acidifica-tion could be community-specific. Primary productiv-ity increased in most natural phytoplankton assem-
blages subjected to elevated CO2 (Hein & Sand-Jensen 1997, Tortell et al. 2002, 2008, Engel et al.2013), although some other communities showed noresponse (Tortell et al. 2000). Egge et al. (2009),Motegi et al. (2012) and Tanaka et al. (2013) found noeffects of elevated CO2 on respiration at the planktoncommunity level. Therefore, the increase of primaryproduction at elevated CO2 could add synergisticallyto the phytoplankton production stimulation inducedby nutrient enrichment, and the biological pumpshould then strengthen. Furthermore, Piontek et al.(2013) reported that both heterotrophic use of carbonand phytoplankton production increased at elevatedCO2, resulting in an in crease of exportable POC.
In the present work, the hypothesis that stimulationof POC production following a nutrient enrichmentepisode is increased at elevated CO2 was tested inexperiments carried out with natural coastal plank-ton assemblages sampled at the northern AlboranSea. For this objective, the short-term metabolic re -sponses of bacterioplankton and phytoplankton wereresearched at present and at elevated (1000 ppmv)CO2 concentrations. The experiments were done usingsurface plankton which were subjected to a combi-nation of different treatments including 2 levels ofnutrients and irradiance. The experimental set-upand levels of the tested factors, as well as the physicaland chemical responses are described in detail inNeale et al. (2014, this Theme Section). The effects ofthe treatments on phytoplankton abundance, compo-sition and size structure are discussed in Reul et al.(2014, this Theme Section). The changes in cell via-bility and DOC excretion are discussed in Sobrino etal. (2014, this Theme Section). In the present study,the changes in net production of POC, bacterial pro-duction and respiration are presented and discussed.
MATERIALS AND METHODS
Experimental design
The plankton community was sampled in a coastalstation located offshore of Fuengirola (southernSpain), in the northwestern Alboran Sea 36.54° N,4.60° W). The experimental setup is described indetail by Neale et. al (2014). To remove mesozoo-plankton, the seawater samples were pre-screenedthrough a 200 µm mesh (this procedure did not sub-stantially affect the composition of the phytoplanktoncommunity as abundance of chain-forming and largediatoms in the initial sample was low; Neale et al.2014). The effects of elevated CO2 and nutrient addi-
44

Mercado et al.: High CO2 effects on plankton metabolism
tions on the metabolism of the planktonic communitywere tested under 2 levels of solar irradiance for 7 d.Different combinations of 3 factors were assayed:CO2 (C), nutrient (N) and light (L). Two levels of each factor (referred as H and L for high and low level,respectively) were tested. The incubations at low(present) and high CO2 (LC and HC) consisted ofbubbling the cultures with normal air and CO2-enriched air (1000 ppm), respectively. In the high-nutrient treatments (HN), additions of a combinationof nitrate, phosphate and organic nutrients weremade on the first (Day 0) and the third (Day 2) dayof incubation. Prior to the C and N treatments, the samples were acclimated to high light (HL) and lowlight (LL) conditions for 24 h (Day −1). HL (61% offull solar irradiance) and LL (32%) were carried outusing neutral density screen mesh. Samples weremaintained in UVR-transparent 20 l LDPE cubitain-ers, so both UVR and photosynthetically active radia-tion (PAR) were in cluded in the spectra. In total, 8treatments were tested and 3 independent replicatesof each treatment were performed.
Chlorophyll a (chl a) concentration and abundanceof bacteria and autotrophic picoplankton were meas-ured each day. Additionally, the abundance and taxonomic composition of >5 µm phytoplankton wereanalysed on Days 0, 2, 4 and 6 (final day); these dataare presented and discussed in more detail in Reul etal. (2014). Primary production of the plankton sizefractions <20 and >20 µm and bacterial productionwere estimated on Days 0, 2, 4 and 6, as well as respiration rates of the whole plankton community.Carbon and nitrogen contents of particulate organicmatter (POM) and uptake rates of DIC and nitratewere estimated on Days 0 and 6.
Biomass calculations of different plankton fractions
Biomass of heterotrophic picoplankton (includingbacterial and micro-zooplankton) as well as <20 and>20 µm autotrophs were estimated from the abun-dance data obtained by flow cytometry and micro -scopy techniques as described in Reul et al. (2014)and Neale et al. (2014). Heterotrophic picoplank -ton biomass was calculated by multiplying bacterialabundance by the cell carbon content calculated frombacterial biovolume according to Loferer-Krößbacheret al. (1998). Bacterial cell biovolume was estimatedin each treatment from the inverted microscopemeasurements of cell size performed on at least 10individuals of each bacterial morphotype (i.e. smallcocci, small bacilli, large bacilli and vibrio).
Biovolumes of Synechococcus, Prochlorococcus andpicoeukaryotes were calculated using the valuesgiven in Ribes et al. (1999) for samples collectedin the northwestern Mediterranean Sea. Cell bio -volumes corresponding to the most abundant spe-cies, genus and taxa of phytoplankton and hetero-trophs identified by the inverted microscope methodwere calculated by using the appropriate formulaaccording to their geometric shape (Sun & Liu 2003,Olenina et al. 2006, Vadrucci et al. 2007). Biovolumevalues were converted into biomass using the formu-lae proposed by Morel et al. (1993) for Prochlorococ-cus, Kana & Glibert (1987) for Synechococcus, Verityet al. (1992) for <15 µm eukaryotic phytoplanktonand Menden-Deuer & Lessard (2000) for >15 µmdinoflagellates and diatoms.
Primary production and nitrate uptake rates
Rates of POC production were estimated by meansof 14C experiments. Methods of incubation, analysisof 14C in the incubated samples and calculation of 14Cuptake rates are described in Sobrino et al. (2014).
For simultaneous determination of 13C and 15N up-take rates, 250 ml samples from each microcosm wereincubated in 1 l polycarbonate transparent bottles un-der the same conditions of temperature and PAR as inthe incubation tanks on Day 6. Before the measure-ments, solutions of sodium bicarbonate enriched in13C and potassium nitrate enriched in 15N were addedto reach isotope final concentrations of 150 µM and0.05 µM, respectively, which resulted in increases ofDIC by 7% and of nitrate by 1 to 55% (depending onthe nitrate concentration in the initial sample). Foreach microcosm, 2 independent incubations plus acontrol (i.e. sample without addition of 15N) were in-cubated for 4 to 5 h. The isotope enrichment and theconcentration of the POC and particulate organic ni-trogen (PON) were estimated at the beginning of theexperiment by filtering 0.5 l of initial non-incubatedseawater (i.e. without 13C or 15N added) through25 mm glass microfibre filter (Whatman GF/F). Afterincubation, the samples were filtered through pre-combusted (450°C for 2 h) Whatman GF/F filters. Thefilters were frozen until they were exposed to HClfumes overnight and then dried and pelleted for isotopic analysis. POC and PON were analyzed witha Carlo Erba Instrument C:N:H analyzer. Carbon andnitrogen stable isotope natural abundance measure-ments were made by continuous flow isotope-ratiomass spectrometry with a Delta plus Finnigan MATmass spectrometer connected to the C:N:H analyzer.
45
Aquat Biol 22: 43–57, 2014
The calculations of 13C and nitrate uptake rateswere performed according to Dugdale & Wilkerson(1986) and Knap et al. (1996), respectively. POC andPON concentration in non-incubated samples wereused for the calculations, as they varied by less than10% after incubation. For the samples coming fromthe LN treatments in which addition of 15N increasedthe nitrate concentration above 10%, the uptakerates were corrected following the procedure pro-posed by MacIsaac & Dugdale (1972). Note that13C uptake measured by this method is not fully comparable with carbon uptake measured by 14C inSobrino et al. (2014) since the UVR transparency islower in polycarbonate bottles (used for 13C uptakeexperiments) than in Teflon-FEP flasks (used for 14Cuptake experiments).
Concentration of TEPs
The concentration of TEP was determined by themethod of Claquin et al. (2008), which is a modifica-tion of the method of Passow & Alldredge (1995). Inshort, 100 ml samples were filtered through 0.4 µmpolycarbonate filters at low vacuum pressure andthen frozen at −20°C until analysis. Each filter con-taining cells and TEP was mixed with a 2 ml solutionof 0.02% Alcian Blue (Sigma) dissolved in 0.06%acetic acid and immediately centrifuged (3200 × g, at20°C for 30 min) to remove the excess dye. The pelletwas rinsed with 1 ml of Milli-Q water and centrifugedat 3200 × g for 30 min. This procedure was repeatedseveral times until the pellet was uncolored. Thesupernatant was removed after each centrifugationcycle. Then 4 ml of 80% H2SO4 was added to the pel-let. After 2 h incubation, absorbance of the stainedsample was measured spectrophotometrically at787 nm. TEP concentrations in terms of xanthan gumequivalent weight (mg Xequival l−1) were calculatedby interpolating the absorbance values onto a stan-dard regression line built with known concentrationsof xanthan gum (Claquin et al. 2008).
Bacterial production
Heterotrophic bacterial production (BP) was deter-mined by incorporating 3H-thymidine (specific activ-ity = 49.2 Ci mmol−1, Perkin Elmer) into the bacterialDNA (Fuhrman & Azam 1982). 3H-thymidine wasadded to each tube containing 1.5 ml of sample (3replicates and 2 blanks for each experimental treat-ment) to 30 nM saturating final concentration. Vials
were incubated at in situ temperature for 60 min indarkness. Extraction was carried out with 5% (finalconc.) cold trichloroacetic acid (TCA). The tubeswere centrifuged at 16 000 × g, rinsed twice with5% TCA and measured in a scintillation counterequipped with autocalibration (Beckman LS 6000TA). In all calculations, data were corrected byblanks (killed with 5% TCA before addition ofthe radiotracer). The factors used to convert incorpo-rated tracers to BP in terms of cell carbon were 1 ×10¹⁸ cells mol−1 of thymidine (Bell 1993) and 2 ×10⁻¹⁴ g C cell−1 (Lee & Fuhrman 1987).
Oxygen consumption rates
Oxygen consumption measurements in darknesswere performed using a PreSens system consisting ofsensor-spot optodes (SP-PSt3-NAU-D5-YOP) and anoptic-fiber oxygen transmitter (Fibox 3) connected toa computer equipped with the software Oxyview6.02 (Marchand et al. 2009). Before each measure-ment, a 2-point calibration of the electrodes was car-ried out with a sodium sulphite saturated seawatersolution (0% oxygen saturation) and oxygen satu-rated sterilized seawater. Three independent sub-replicates of each microcosm were measured at 21°C.A respiratory quotient equal to 1 was used to convertoxygen consumption rates to respiratory CO2 pro-duction (Packard & Williams 1981).
Statistical analysis
Statistical significance of treatment effects wastested using repeated measures ANOVA. Calcula-tions were performed using a generalised linearmodel (GLM) procedure with main effects, time(repeated measure) and interaction terms. For thevariables that were measured on Day 6, ANOVAs formain effects were done. The relationships betweensome variables were tested by Pearson’s correlationanalyses. p-values for the correlation coefficientswere calculated in order to determine their statisticalsignificance. ANCOVA with a separate slope modelwas used in order to assess the difference in theslopes of linear regression models used to test therelationship between changes in POC and PON inthe HN and LN treatments. Prior to conducting these statistical tests, the normality and homogeneity ofvariance of the variables were assessed. Normalitywas evaluated from the normal probability plot ofthe residuals of each variable. Homoscedasticity (by
46

Mercado et al.: High CO2 effects on plankton metabolism
Cochran’s and Levene’s tests) and correlation be -tween means and standard deviations were checkedin order to verify the assumptions of the repeatedmeasures ANOVA. The assumptions of the para -metric correlations and ANOVA were satisfied byall variables. The software package Statistica v.7.1(Statsoft) was used for all statistical analyses.
RESULTS
Plankton biomass
Autotrophic plankton biomass increased signifi-cantly in all treatments in comparison with the initialbiomass (Day 0) (Fig. 1a). Maximal autotrophic bio-mass was obtained by Day 4 in most of the treatmentswith the exception of LC LN HL and HC LN LL, inwhich maximal autotrophic biomasses were obtainedby Days 2 and 6, respectively. In all 4 LC treatmentsbiomass decreased by Day 6 in comparison withDay 4. Among the HC treatments, plankton biomassdecreased by Day 6 only at high irradiance.
Bacteria accounted for more than 70% of heterotro-phic biomass in all samples analysed (Fig. 1b) with theexception of the HC HN HL treatment on Day 4 (wherebacteria accounted for 54% of biomass). Total hetero-trophic biomass increased by Day 2 in com parisonwith Day 0 in HN treatments, and decreased in the LNtreatments (with the exception of the HC LN LL treat-ment). In all treatments, biomass of heterotrophs de-creased steeply by Day 4 and recovered afterwards,reaching values higher than those ob tained on Day 0with the exception of the LC LN LL treatment.
In terms of biomass, >20 µm autotrophic cells werethe main plankton fraction in all the analysed sam-ples, including the initial one (Day 0). Therefore, thevariations in plankton biomass among the treatmentsand within each treatment (i.e. over the incubationtime) were mainly caused by changes in the large(>20 µm) phytoplankton. Contribution of >20 µmphytoplankton to plankton total biomass increasedsteeply from Day 0 to Day 4, when about 80% ofplankton biomass was attributable to this fraction.Contribution of >20 µm phytoplankton to planktonbiomass was reduced at Day 6 because of both adecrease in the abundance of cells >20 µm and anincrease in the small cell fraction (<20 µm).
The main effects of the experimental factors andtheir interactions on the biomass of each planktonfraction were not statistically significant, with theexception of bacterial biomass, which was sig nifi -cantly higher at HN (data not shown).
Primary production
Primary production (PP) increased in all the treat-ments by Day 2 in comparison with Day 0 (Fig. 2a) andcontinued increasing until Day 6. Contribution to PPof the 2 analysed phytoplankton size frac tions variedconsiderably over the experiment. The >20 µm cellscontributed 27 to 40% to the PP at Day 2; their contri-bution increased by 50 to 83% on Day 4 and wasreduced at Day 6 (19 to 70%). The highest contribu-tion of the <20 µm phytoplankton to PP occurred onDay 2. The linear regression between PP and bio-mass of cells >20 µm was statistically significant (r =0.66, p < 0.01), indicating that changes in PP overtime and its variability among treatments weremainly due to shifts in the biomass of larger sizephytoplankton.
47
0
50
100
150
200
250
300
350
400
450
0102030405060708090
100
Bio
mas
s (µ
g C
l–1)
a
b
Autotrophic plankton
Heterotrophic plankton
HC LC
HC LC
HN LN HN LNHL LL
HN LN HN LNHL LL
HN LN HN LNHL LL
HN LN HN LNHL LL
>20 µm
<20 µm
Bacteria
Other het.
Fig. 1. Temporal evolution of biomass of (a) phytoplanktonand (b) heterotrophic plankton under the different experi-mental conditions (high and low CO2 concentrations, HCand LC; high and low nutrient concentrations, HN and LN;high and low irradiance, HL and LL). For each treatment,the 3 columns represent Day 2, 4 and 6 data. The horizontallines in panel (a) indicate initial biomass (Day 0) of >20 µmcells (continuous line) and <20 µm cells (dashed line).In panel (b), the horizontal line indicates initial bacterial
biomass (Day 0)
Aquat Biol 22: 43–57, 2014
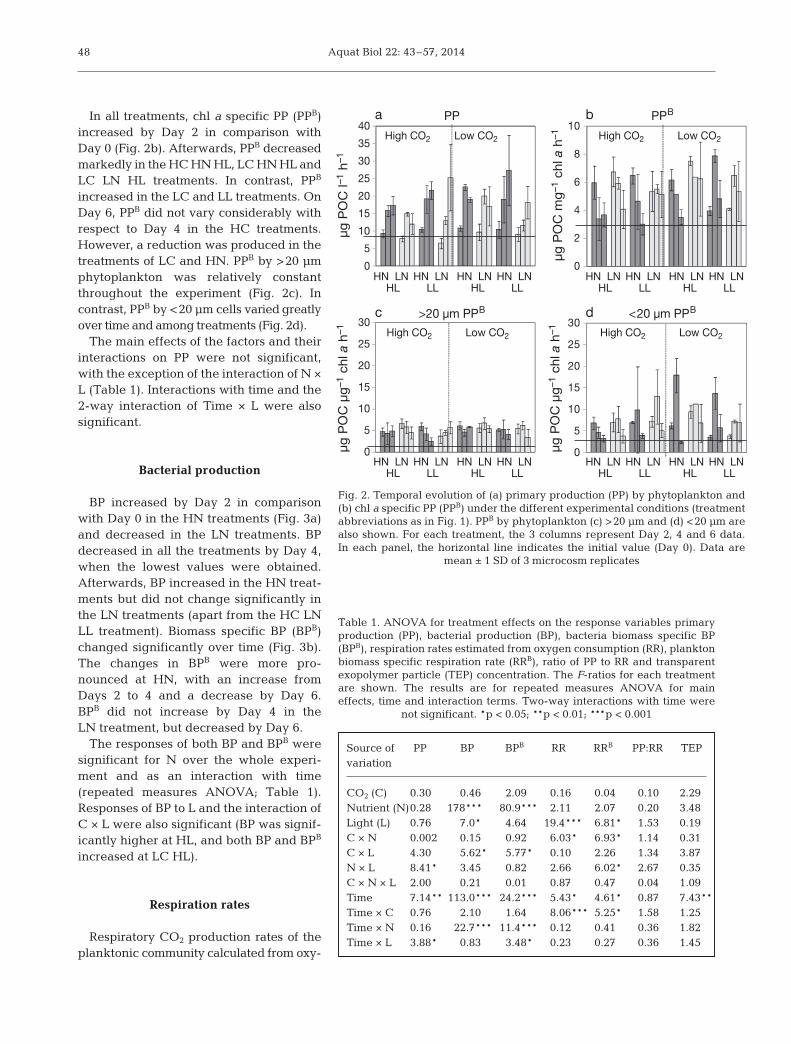
In all treatments, chl a specific PP (PPB)increased by Day 2 in comparison withDay 0 (Fig. 2b). Afterwards, PPB de creasedmarkedly in the HC HN HL, LC HN HL andLC LN HL treatments. In contrast, PPB
increased in the LC and LL treatments. OnDay 6, PPB did not vary considerably withrespect to Day 4 in the HC treatments.However, a reduction was produced in thetreatments of LC and HN. PPB by >20 µmphytoplankton was relatively constantthrough out the experiment (Fig. 2c). Incontrast, PPB by <20 µm cells varied greatlyover time and among treatments (Fig. 2d).
The main effects of the factors and theirinter actions on PP were not significant,with the exception of the interaction of N ×L (Table 1). Interactions with time and the2-way interaction of Time × L were alsosignificant.
Bacterial production
BP increased by Day 2 in comparisonwith Day 0 in the HN treatments (Fig. 3a)and decreased in the LN treatments. BPdecreased in all the treatments by Day 4,when the lowest values were obtained.Afterwards, BP increased in the HN treat-ments but did not change significantly inthe LN treatments (apart from the HC LNLL treatment). Biomass specific BP (BPB)changed significantly over time (Fig. 3b).The changes in BPB were more pro-nounced at HN, with an increase fromDays 2 to 4 and a decrease by Day 6.BPB did not increase by Day 4 in theLN treatment, but decreased by Day 6.
The responses of both BP and BPB weresignificant for N over the whole experi-ment and as an interaction with time(repeated measures ANOVA; Table 1).Responses of BP to L and the interaction ofC × L were also significant (BP was signif-icantly higher at HL, and both BP and BPB
increased at LC HL).
Respiration rates
Respiratory CO2 production rates of theplanktonic community calculated from oxy-
48
0
5
10
15
20
25
30
35
40PP a b PPB
>20 µm PPB c d <20 µm PPB
High CO2 Low CO2 High CO2 Low CO2
High CO2 Low CO2 High CO2 Low CO2
HN LN HN LN HN LN HN LNHL LL HL LL
HN LN HN LN HN LN HN LNHL LL HL LL
HN LN HN LN HN LN HN LNHL LL HL LL
HN LN HN LN HN LN HN LNHL LL HL LL
0
2
4
6
8
10
µg P
OC
mg
–1 c
hl a
h–1
µg P
OC
µg
–1 c
hl a
h–1
µg P
OC
l–1
h–1
µg P
OC
µg
–1 c
hl a
h–1
0
5
10
15
20
25
30
0
5
10
15
20
25
30
Fig. 2. Temporal evolution of (a) primary production (PP) by phyto plankton and(b) chl a specific PP (PPB) under the different experimental conditions (treatmentabbreviations as in Fig. 1). PPB by phytoplankton (c) >20 µm and (d) <20 µm arealso shown. For each treatment, the 3 columns represent Day 2, 4 and 6 data.In each panel, the horizontal line indicates the initial value (Day 0). Data are
mean ± 1 SD of 3 microcosm replicates
Source of PP BP BPB RR RRB PP:RR TEPvariation
CO2 (C) 0.30 0.46 2.09 0.16 0.04 0.10 2.29Nutrient (N)0.28 178*** 80.9*** 2.11 2.07 0.20 3.48Light (L) 0.76 7.0* 4.64 19.4*** 6.81* 1.53 0.19C × N 0.002 0.15 0.92 6.03* 6.93* 1.14 0.31C × L 4.30 5.62* 5.77* 0.10 2.26 1.34 3.87N × L 8.41* 3.45 0.82 2.66 6.02* 2.67 0.35C × N × L 2.00 0.21 0.01 0.87 0.47 0.04 1.09Time 7.14** 113.0*** 24.2*** 5.43* 4.61* 0.87 7.43**Time × C 0.76 2.10 1.64 8.06*** 5.25* 1.58 1.25Time × N 0.16 22.7*** 11.4*** 0.12 0.41 0.36 1.82Time × L 3.88* 0.83 3.48* 0.23 0.27 0.36 1.45
Table 1. ANOVA for treatment effects on the response variables primaryproduction (PP), bacterial production (BP), bacteria biomass specific BP(BPB), respiration rates estimated from oxygen consumption (RR), planktonbiomass specific respiration rate (RRB), ratio of PP to RR and transparentexopolymer particle (TEP) concen tration. The F-ratios for each treatmentare shown. The results are for repeated measures ANOVA for maineffects, time and interaction terms. Two-way interactions with time were
not significant. *p < 0.05; **p < 0.01; ***p < 0.001

Mercado et al.: High CO2 effects on plankton metabolism
gen consumption rates (RR; Fig. 4a) did not vary signi -ficantly by Day 2 with respect to the initial value in theHC treatments. In these treatments, RR increased onDay 4 and de creased on Day 6. In the LC treatments,the time variability of RR was more reduced except inthe LC HN LL treatment (for which RR decreased byDay 6), and in the LC LN LL treatment (for which RRwas significantly lower than the initial value).
In the HC treatments, plankton biomass specificrespiration rates (RRB; Fig. 4b) did not change byDay 2 in comparison with Day 0 (except for HN LL),increased by Day 4 and decreased by Day 6. In con-trast, RRB was relatively constant in the LC treat-ments, excluding the LC HN HL condition.
The ratio of PP to RR increased in all treatments onDay 2 (Fig. 5). In the HC treatments, PP:RR reachedvalues higher than 1 that day (apart from the HC HNHL treatment) whereas it was lower than 1 in the LCtreatments. By Day 4, PP:RR decreased in the 4 treat-ments of HC but increased in the LC treatments. Bythe last incubation day (Day 6), PP:RR was higherthan 1 in all treatments.
The results of the ANOVA indicate that both RRand RRB decreased significantly over the wholeexperiment at LL in comparison with HL (Table 1).The responses of both variables were significant forthe interaction of C × N. Interactions with time, andtime × C were also significant. Furthermore, the re -sponse of RRB to the interaction of N × L was signifi-cant. PP:RR was not significantly affected by the factors or the interaction between them (Table 1).
Balance of particulate carbon and nitrogen in themicrocosms
In order to determine the effect of the treatmentson net production of POM during the whole incuba-tion period, the net balance of POC and PON (ΔPOCand ΔPON) was calculated in each treatment by sub-tracting the POC and PON concentrations on Day 0from that of Day 6. For these calculations, the con-centrations of organic matter estimated from the ele-mental analysis of particulates retained by 0.7 µm fil-
49
0
1
2
3
4
5
0
20
40
60
80
100
120
140
BP a
BPB b
High CO2 Low CO2
High CO2 Low CO2
HN LN HN LN HN LN HN LNHL LL HL LL
HN LN HN LN HN LN HN LNHL LL HL LL
µg C
l–1
h–1
µg C
mg–
1 B
B h
–1
Fig. 3. Temporal evolution in (a) bacterial production (BP)and (b) biomass specific bacterial production (BPB) under thedifferent experimental conditions (treatment abbreviationsas in Fig. 1). For each treatment, the 3 columns representDay 2, 4 and 6 data. In each panel, the horizontal line indi-cates the initial value (Day 0). Data are mean ± 1 SD of 3
microcosm replicates
0
1
2
3
4
0
20
40
60
80
100
HN LN HN LN HL LL
HN LN HN LN HL LL
HN LN HN LN HL LL
HN LN HN LN HL LL
RRa
RRB b
High CO2 Low CO2
High CO2 Low CO2
µmol
CO
2 l–
1 h–
1µm
ol C
O2
mg–
1 C
h–1
Fig. 4. Temporal evolution of (a) respiration rates estimatedas oxygen consumption (RR) and (b) plankton biomass spe-cific respiration (RRB) under the different experimental con-ditions (treatment abbreviations as in Fig. 1). For each treat-ment, the 3 columns represent Day 2, 4 and 6 data. In eachpanel, the horizontal line indicates the initial value (Day 0).
Data are mean ± 1 SD of 3 microcosm replicates

Aquat Biol 22: 43–57, 2014
ters were used (a more detailed analysis of variabilityof PON and PON is presented in Neale et al. 2014).There was high variability in ΔPOC and ΔPON amongthe 3 replications of each treatment. However, onaverage, ΔPOC and ΔPON were higher in the HNtreatments. ANOVA results confirmed that the differ-ences among the HN and LN treatments were statis-tically significant (Table 2). However, the effects of C,L and the interactions among C, N and L were notstatistically significant (Table 2). The ratio of ΔPOC toΔPON was significantly affected by N. Concordantly,the slopes of the regression line between ΔPOC andΔPON (Fig. 6) calculated for HN and LN were differ-ent at p < 0.001. This result indicates that a compara-tively lower increase of POC relative to PON wasproduced at HN.
Changes in TEP concentration over time did notfollow a common variation pattern in the 8 treat-ments. As occurred with ΔPOC andΔPON, TEP concentration was highlyvariable among the 3 replicates ofeach treatment (data not shown).The highest TEP concentration wasobtained in the LC HN HL treatmenton Day 2. On the other extreme, thelowest concentration was obtained inthe LC LN HL treatment on Day 4.Reduction in TEP concentration byDay 4 with re spect to Day 2 occurredin all treatments apart from HC LN LLand HC LN LL. The ANOVA results(Table 1) indicate that TEP concentra-tion was not significantly affected bythe treatments but there were sig -nificant differences between days.
Uptake rates of DIC (RDIC) and nitrate (RNO3−)
normalized by POC and PON, respectively, by Day 6are shown in Fig. 7. The results of the factorialANOVA indicate that the 3 tested factors (C, N and L)significantly affected RDIC. Thus, HC, LN and LLproduced a significant decrease in RDIC. In contrast,RNO3
− was only affected by nutrients (Table 2). Theratio of RDIC to RNO3
− varied significantly amongthe treatments (Fig. 8). The lowest values of thisindex were ob tained at HC and HN. Consistently, theresults of the factorial ANOVA demonstrate that theC level affected the ratio of RDIC to RNO3
−. Thisindex was reduced by half in the HC treatment incomparison with LC. Furthermore, the re sponse ofRDIC to RNO3
− to the interaction of C × L was alsosignificant.
DISCUSSION
Physiological performance of the initial planktoncommunity
The hydrological conditions in the northern Albo-ran Sea during summer are normally characterisedby strong stratification of the water column, whichhampers the re-supply of new nutrients from thedeep layer towards the euphotic zone (Ramírez et al.2005, Mercado et al. 2012). Consequently, nitrateconcentrations in the surface layer of the Alboran Seacoastal waters reported for the summer period arerelatively low (ca. 0.3 µM; Mercado et al. 2012) andthe dissolved inorganic nitrogen to phosphate molarratio (ca. 3.0 according to Mercado et al. 2012)departs significantly from the Redfield ratio (16:1).Temperature and nutrient vertical profiles in the
50
0
1
2
3
4
HN LN HN LN HL LL
HN LN HN LN HL LL
PP:RR
High CO2 Low CO2
µmol
CO
2 l–
1 h–
1
Fig. 5. Temporal evolution of the ratio of primary production(PP) to respiration rate (RR) under the different experimentalconditions (treatment abbreviations as in Fig. 1). For eachtreatment, the 3 columns represent Day 2, 4 and 6 data. Ineach panel, the horizontal line indicates the initial value
(Day 0). Data are mean ±1 SD of 3 microcosm replicates
Source of ΔPOC ΔPON ΔPOC:ΔPON RDIC RNO3− RDIC: RNO3
−
variation
C 4.02 4.2 0.27 11.09* 3.98 11.39***N 9.75** 68.1*** 33.86*** 92.16*** 44.8*** 1.17L 0.80 1.05 1.09 5.82* 2.36 4.39*C × N 0.58 0.78 0.15 0.68 0.55 0.25C × L 0.75 0.24 1.61 0.66 2.92 6.32*N × L 0.14 0.16 1.47 4.75* 0.01 0.01C × N × L 0.64 2.07 3.37 0.30 0.10 0.03
Table 2. ANOVA for treatment effects by Day 6 on the response variablesΔPOC (net production of particulate organic carbon), ΔPON (net production ofparticulate organic nitrogen), ratio of ΔPOC to ΔPON, POC specific 13C uptakerates (RDIC), PON specific nitrate uptake rates (RNO3
−) and molar ratio ofRDIC to RNO3
−. The F-ratios for each treatment are shown. The results are forfactorial ANOVA for main effects and interaction terms. *p < 0.05; **p < 0.01;
***p < 0.001

Mercado et al.: High CO2 effects on plankton metabolism
coastal station sampled for the GAP experiments(Neale et al. 2014) are consistent with those typical ofsummertime. The abundance and composition ofphytoplankton in the initial sample (see Reul et al.2014) also matches those described for summer sam-ples collected by Reul et al. (2005) and Mercado etal. (2007), who reported abundance of diatoms anddinoflagellates of approximately 100 and 30 cell ml−1,respectively. Consequently, it is reasonable to con-clude that the phytoplankton community at the be -ginning of the experiment was fully acclimated tonitrate limitation and high irradiance. This hypothe-sis is also supported by the physiological features ofthe initial phytoplankton, with low chl a content perbiomass (5.1 µg chl a mg−1 POC) which is even lowerthan that reported by Arín et al. (2002) for phyto-plankton sampled in oligotrophic areas of the Albo-ran Sea. Another indicator of phytoplankton acclima-tion to low nitrate initial in situ conditions is the lowrate of NO3
− uptake, which is comparable with ratesreported for Alboran phytoplankton isolated in nutri-ent limited areas (Mercado et al. 2014).
It could be expected that bacterioplankton in theinitial sample were also fully acclimated to the in situprevailing nutrient conditions. The bacterial abun-dance obtained in the initial sample (1.5 × 10⁶ cellml−1) is within the range described by Fernández etal. (1994) and Van Wambeke et al. (2004) for the Alb-oran Sea but is higher than the values published forother oligotrophic areas of the Western Mediterran-ean Sea (0.7 to 0.9 × 10⁶ cell ml−1; Pedrós-Alió et al.1999, Morán et al. 2001) and the Atlantic ocean (0.2to 0.4 × 10⁻⁶ cell ml−1; Mills et al. 2008).
51
0
50
100
150
200
250
0 10 20 30 40 50
HC HN HLHC HN LLLC HN HLLC HN LL
HC LN HLHC LN LLLC LN HLLC LN LL
ΔPON (µg l–1)
ΔPOC:ΔPON = 8.1(r2 = 0.81)
ΔPOC:ΔPON = 6.381(r2 = 0.90)
ΔPO
C (µ
g l–
1 )
Fig. 6. Relationship between the net balances of particulateorganic carbon and nitrogen (ΔPOC and ΔPON) measuredby Day 6 under the different experimental conditions (treat-ment abbreviations as in Fig. 1). The results obtained for the3 microcosm replicates are shown. The regression lines forthe treatments of high (closed symbol) and low (open sym-bols) nutrients are shown. The slopes of the regression lineswere significantly different at p < 0.001 according to the
results of an ANCOVA with separate slope model
0.00
0.10
0.20
0.30
0.40
0.50
0.00
0.50
1.00
1.50
HN LN HN LNHL LL
HN LN HN LNHL LL
HN LN HN LNHL LL
HN LN HN LNHL LL
nmo
l C µ
g–1
PO
C h
–1nm
ol N
µg
–1 P
ON
h–1
a
b
RDIC
RNO3–
High CO2 Low CO2
High CO2 Low CO2
Fig. 7. Uptake rates of 13C (RDIC) and nitrate (RNO3−) nor-
malised by particulate organic carbon and nitrogen, respec-tively. The rates were measured on Day 6 under the dif -ferent experimental conditions (treatment abbreviationsas in Fig. 1). Results are mean ±1 SD of 3 microcosm
replicates
0.00
5.00
10.00
15.00
20.00
25.00
30.00
HN LN HN LNHL LL
HN LN HN LNHL LL
RDIC:RNO3–
High CO2 Low CO2
mo
l C m
ol–
1 N
Fig. 8. Ratio of 13C to nitrate uptake rates (RDIC:RNO3−)
measured on Day 6 under the different experimental con -ditions (treatment abbreviations as in Fig. 1). Results are
mean ±1 SD of 3 microcosm replicates
Aquat Biol 22: 43–57, 2014
Some authors have demonstrated that naturalphytoplankton communities could actively take upthymidine when supplied at low concentrations (Mul -holland et al. 2011). Consequently, thymidine in -corporation rates could overestimate BP. In our ex -periments, the thymidine incorporation rates weresignificantly correlated with bacterial biomass (r2 =0.60; p < 0.01) but not with total plankton or phyto-plankton biomass. Consequently, it is reasonable toassume that the changes in thymidine incorporationrates in our experiments reflected changes in bac -terial activity. Accordingly, the high initial bacterialcommunity production in our experiments (2.5 µg Cl−1 h−1) is consistent with the high bacterial abundance.These relatively high values of both biomass and BPwould indicate that the in situ bacterial communitywas less affected than phytoplankton by nutrient lim-itation. Some experiments of nitrate and phosphateaddition performed with natural plankton samplesfrom the Eastern Mediterranean suggest that bacte-ria are more affected by limitation of phosphate thannitrate (Thingstad et al. 2005, Zohary et al. 2005).In our initial sample, phosphate concentration waslow but the nitrate:phosphate molar ratio was muchlower than the Redfield ratio, indicating that phos-phate could have a reduced role in limiting planktongrowth. The values of BP and RR obtained in ourstudy can be used for calculating the bacterial growthefficiency (BGE; i.e. the amount of new bacterial bio-mass produced per unit of assimilated organic C sub-strate). It has been demonstrated that BGE varies sys-tematically with the trophic status of the system (delGiorgio & Cole 1998). If it is assumed that bacterialcontribution to community respiration ranges from 50to 100% (as reported for communities in the Westernand Eastern Mediterranean Sea; Navarro et al. 2004,Lagaria et al. 2011), BGE in the initial sample wouldvary between 0.10 and 0.18, i.e. one order of magni-tude higher than BGE reported by del Giorgio & Cole(1998) for oligotrophic systems (i.e. 0.01) and lowerthan that of the most eutrophic systems (0.5).
Effects of enclosure and treatments on phytoplankton metabolism
Bottle effect and other experimental artefacts couldpotentially affect the results of the microcosm exper-iments. In our experimental setup, the samples werepre-screened by 200 µm mesh before incubation.Abundance of total diatoms in the initial sample (non-filtered) was 218.8 cells ml−1, compared to 205.5 cellsml−1 for the screened samples. Furthermore, abun-
dances of Rhizosolenia and other large diatoms werelower than 5 cells ml−1 in both pre-filtered and fil-tered samples. Therefore, pre-screening did not sub-stantially affect the abundance or composition of thephytoplankton community. However, filtration bringswith it removal of mesozooplankton, which could explain the increase in the abundance of >6 µm cells(ultraphytoplankton) produced from Day 0 to 2. Reulet al. (2014) attributed this change to relaxation ofthe top-down control exercised by mesozooplanktonon ultraphytoplankton. These unspecific effects werealso notable in the metabolic rates of the planktoncommunity, as PP increased by 3.5 times on averageby Day 2 in comparison with Day 0, irrespective ofthe treatment (including the treatment that simulatedin situ conditions, i.e. LC LN HL; Fig. 2a). The datapresented in this article demonstrate that the PP in -crease was not only due to increasing phytoplanktonbiomass but also to changes in PPB (Fig. 2b). Irradianceduring PP incubations averaged 539 and 232 µmolphotons m−2 s−1 in HL and LL treatments, respectively(Neale et al. 2014). These irradiance values wereprobably not limiting for photosynthesis. If this is thecase, PP is representative of the maximal photosyn-thetic capacity (Pmax) of the community that dependson the Calvin cycle activity. Consequently, our re -sults indicate that the activity of the Calvin cycleincreased in all treatments by Day 2, as expected dueto the increase in the abundance of large relative tosmall cells (Raven & Kübler 2002, Litchman et al. 2009).The differences in PPB from Days 0 to 2 (Fig. 2b) canbe explained by higher photosynthesis rates per car-bon unit (Geider et al. 1986) and lower metaboliccosts of the diatoms in comparison with flagellatesand other phytoplankton groups. Furthermore, thephytoplankton assemblage experienced high lightat the sampling station; therefore, relief from high-irradiance stress could have contributed to the in -crease in PP observed by Day 2 (Neale et al. 2014,Sobrino et al. 2014).
In addition to the changes produced by the enclo-sure effect, notable changes in phytoplankton meta -bolism due to the treatments can be discerned. Notethat repeated measures ANOVA were carried outby using the data obtained from Days 2 to 6 as re -peated measurements. This approach controlled forthe day-to-day variability associated with the above-described experimental artefacts. Furthermore, someof the physiological responses attributable to the treat -ments are similar to those described previously forexperiments done with phytoplankton cultures andnatural assemblages. For instance, phytoplanktongrowth under nutrient limitation normally reduces
52

Mercado et al.: High CO2 effects on plankton metabolism
the chl a per cell content (Stramski et al. 2002). Con-sistently, chl a per phytoplankton biomass was re -duced at LN in our experiments. Furthermore, nutri-ent limitation affected both RDIC and RNO3
− (at leastby Day 6; Fig. 7). The reduction of RNO3
− comparedto RDIC was stronger at LN than HN. A consequenceof this finding is that DIC over-consumption was produced at LN (i.e. higher DIC uptake than ex -pected from nitrate or phosphate removal). DIC over-consumption is frequent in phytoplankton growingunder limited nutrients (Sorensen & Siegel 2001, Geider & LaRoche 2002, Mei et al. 2005) and bringswith it formation of organic matter with a C:N ratioexceeding the Redfield ratio (Schartau et al. 2007), aswas obtained in our experiments (Neale et al. 2014).It is normally assumed that the DIC excess assimi-lated by the phytoplankton is channelled through thepool of photosynthetic DOC (e.g. Kähler & Koeve2001) or alternatively used to produce secondarymetabolites (Berman-Frank & Dubinsky 1999) andaccumulation of lipids in diatoms growing in nutrientstarvation (Hockin et al. 2012, Yang et al. 2013).
Changes in bacterial metabolism and planktoncommunity respiration
Zooplankton grazing is an important source of dis-solved organic matter in the natural environment (Nagata & Kirchman 1991). Absence of meso- andmacro zooplankton in the experiments (caused by thepre-screening of the samples) would imply that therewas less DOC available for bacterial metabolism inall treatments. However, BP increased at high nutri-ents and decreased at low nutrients (Fig. 3a). Conse-quently, the enclosure effect on bacterial metabolismappeared to be lower than on the phytoplanktoncommunity.
In the HN treatments, BP decreased steeply onDay 4 and recovered on Day 6 (Fig. 3a). A linear rela-tionship between bacterial biomass and BP was ob -tained (BP = 0.04BB + 0.26; r = 0.77, p < 0.01, n = 24),therefore the changes in BP reflected changes in bio-mass. Consequently it can be assessed that nutrientaddition produced higher bacterial growth rates andefficiency. Increases in heterotrophic production following the addition of nutrients have also beendescribed in experiments performed with Mediter-ranean plankton assemblages (Lagaria et al. 2011).
Apparently, these changes in bacterial metabolismdid not affect the respiration rates of the whole com-munity, as the differences in RR among high and lownutrient treatments were not significant (Fig. 4). RR
and plankton biomass were not correlated, indica-ting that respiration was not a simple function of bio-mass—likely because of community acclimation tothe experimental conditions (Wu et al. 2010, Teira etal. 2012) as well as changes in the composition of thecommunity over time and among treatments. Severalstudies have indicated that the contribution to com-munity respiration of bacteria relative to phytoplank-ton decreases with increasing nutrient availabilitybecause of increases in phytoplankton respiration(Biddanda et al. 2001, Chan et al. 2004). Further-more, Roberts & Howarth (2006) found that the bac-terial contribution to respiration is lower when lightavailability for photosynthesis increases. Accordingto the results of nutrient addition experiments per-formed by Roberts & Howarth (2006), the variabilitypatterns of community respiration following nutrientenrichment are related to the higher metabolic needsof phytoplankton growing actively, while bacterialrespiration remains more stable. In our experiments,the main factor contributing to variability of RR waslight (Table 1), supporting the hypothesis that thechanges in RR were related to changes in phyto-plankton respiration (direct effects of irradiance levelon bacterial respiration can be discarded).
Effects of high CO2 on plankton metabolism andcarbon balance
It has been proposed that high CO2 could modulatethe response of phytoplankton to changing light andnutrient conditions. The results of our experimentsindicate that the effect of high CO2 on the metabolicresponses of the phytoplankton to nutrient additionswas limited. Among the variables measured in thepresent study, only 13C uptake rate by Day 6 wasaffected by CO2 level irrespective of nutrient andlight levels (see Reul et al. 2014 and Sobrino et al.2014 for a more complete description of other highCO2 effects). Most articles reporting effects of highCO2 on primary production describe slight increasesor absence of effects (see Riebesell & Tortell 2011for a review). However in our experiments, theDIC uptake rates in phytoplankton acclimated tohigh CO2 reduced in comparison with present CO2.Decreases in RDIC under high CO2 are generallya consequence of the down-regulation of carbon concentrating mechanisms (Beardall & Raven 2004).Additionally, higher photo-inhibition at high CO2 hasbeen described for natural samples under full solarradiation and PAR exposures (Sobrino et al. 2009,Gao et al. 2012). Nitrate uptake was not modified
53

Aquat Biol 22: 43–57, 2014
at high CO2 (as obtained by Bellerby et al. 2008).Consequently, the uptake of DIC relative to nitratedecreased under acidification conditions. A furtherconsequence of this change is that the composition ofthe organic matter produced by phytoplankton wasmodified at high CO2. It could be expected that thesechanges in organic matter quality would producechanges in bacterial production and respiration.Concordantly, BP was significantly affected by theinteraction of C × L (Table 1), indicating that reduc-tion of BP at LL was mitigated at HC. However, RRwas affected significantly by the interaction of C × N(Table 1). Particularly, reduction of RR at LN was lesspronounced at HC than at LC. Total DOC concentra-tion in our experiments was higher at HC (see Nealeet al. 2014), which could explain this inter activeeffect that was apparently independent of the inter-action of C × L.
The effect of the physiological changes induced byCO2 on POC and PON balance in the experimentswas limited, as demonstrated in Fig. 9. At LC, theaddition of nutrients induced increases in POC and
PON (estimated from the RDIC and RNO3−) by 2 to 5
times compared with the increases produced at LN(Fig. 9a). BP and plankton community respirationintegrated over time were also higher at HN com-pared with LN. At HC, addition of nutrients also pro-moted higher rates of bacterial and phytoplanktonproduction integrated over time compared with LN(Fig. 9b). However, the differences between HN andLN were comparatively less than those obtained atLC, particularly for PON production by phytoplank-ton and at LL. Consequently, amounts of POC andPON accumulated in the treatments were similarunder the 2 CO2 conditions, indicating that the differ-ences in the metabolic rates of the plankton did notreflect differences in the amount of produced POM. Ifthe results of our experiments are extrapolated to thenatural environment, it can be concluded that highCO2 will have a limited effect on POM production inthe Alboran Sea, at least during the phytoplanktonblooms triggered by upwelling episodes. However,other as pects such as changes in biomass and phyto-planktonic DOC productions should also be taken
54
0
2
4
6
0
2
4
6
0
2
4
6
0
2
4
6
HN
/ L
NH
N /
LN
HN
/ L
NH
N /
LN
HN
LC
HL
HL
LL
LL
PON
RR
BP
POC
a
b
Primaryproduction
Bacterialproduction
Respiration
Primaryproductivity
Bacterialproductivity
Respiration
PON
RR
BP
POC
PON
RR
BP
POC
PON RRBPPOC
HN
HC
ΔPOC = 168 µg l–1
ΔPON = 32 µg l–1
ΔPOC = 161 µg l–1
ΔPON = 33 µg l–1
ΔPOC = 183 µg l–1
ΔPON = 36 µg l–1
ΔPOC = 178 µg l–1
ΔPON = 33 µg l–1
Fig. 9. Schematic diagram show-ing the increase in plankton meta-bolic rates produced by the nutri-ent addition compared with thechanges produced in the low nu-trient (LN) treatments. The barsrepresent cumulative increases ofparticulate organic car bon (POC)and nitrogen (PON) primary pro-duction, bacterial production (BP)and respiration rates (RR) in thehigh nutrient (HN) treatmentsrelative to the increases obtainedin the low nutrient treatments.Cumulative values of BP and RRwere calculated by integrating(linear interpolation method) overthe whole experiment time, usingthe values obtained on Days 0, 2,4 and 6. POC and PON primaryproduction was calculated fromthe uptake rates of dissolved inor-ganic carbon and nitrate obtainedon Day 6. Net balances of POCand PON (ΔPOC and ΔPON) under the different experimental
conditions are also shown

Mercado et al.: High CO2 effects on plankton metabolism
into account. If it is assumed that the biological pumpactivity in the northern Alboran Sea depends on theoccurrence of these upwelling episodes, our resultswould indicate that the role of this area as an atmos-pheric CO2 sink will not be substantially affected byocean acidification. However, extrapolation of theseresults to the natural environment has to be donewith caution as it is possible that changes in theplanktonic composition to high CO2 requires moreprolonged experiments.
Acknowledgements. The experiments were performed inthe framework of the workshop GAP9 that was partiallyfinanced by the University of Málaga (Program ‘Plan Pro-pio’). We are extensively grateful for the logistic and techni-cal support from the Centro Oceanográfico de Málaga (Insti-tuto Español de Oceanografía). The publication of theresults was financed by the Ministry of Economy andCompeti tiveness of Spain Government (Acción Comple-mentaria CTM2011-15659-E). O.P. was supported by projectAlgatech (CZ.1.05/2.1.00/03.0110).
LITERATURE CITED
Arín L, Morán XAG, Estrada M (2002) Phytoplankton sizedistribution and growth rates in the Alboran Sea (SWMediterranean): short term variability related to meso -scale hydrodynamics. J Plankton Res 24: 1019−1033
Beardall J, Raven JA (2004) The potential effects of globalclimate changes on microalgal photosynthesis, growthand ecology. Phycologia 43: 26−40
Bell RT (1993) Estimating production of heterotrophic bac -terioplankton via incorporation of tritiated thymidine. In: Kemp PF, Sherr BF, Sherr EB, Cole JJ (eds) Handbook ofmethods in aquatic microbial ecology. Lewis Publishers,Boca Raton, FL, p 495−503
Bellerby RGJ, Shulz KG, Riebesell U, Neill C and others(2008) Marine ecosystem community carbon and nutrientuptake stoichiometry under varying ocean acidificationduring the PeECE III experiment. Biogesciences 5: 1517−1527
Berman-Frank I, Dubinsky Z (1999) Balanced growth andaquatic plants: myth or reality? Bioscience 49: 29−37
Biddanda B, Ogdahl M, Cotner J (2001) Dominance of bac-terial metabolism in oligotrophic relative to eutrophicwaters. Limnol Oceanogr 46: 730−739
Chan F, Pace ML, Howarth FW, Marino RM (2004) Bloomformation in heterocystic nitrogen-fixing cyanobacteria: the dependence on colony size and zooplankton grazing.Limnol Oceanogr 49: 2171−2178
Claquin P, Probert I, Lefebvre S, Veron B (2008) Effects oftemperature on photosynthetic parameters and TEP pro-duction in eight species of marine microalgae. AquatMicrob Ecol 51: 1−11
del Giorgio PA, Cole JJ (1998) Bacterial growth efficiency innatural aquatic systems. Annu Rev Ecol Syst 29: 503−541
del Giorgio PA, Duarte CM (2002) Total respiration and theorganic carbon balance of the open ocean. Nature 420: 379−384
D’Ortenzio F, Ribera d’Alcalà M (2009) On the trophicregimes of the Mediterranean Sea: a satellite analysis.
Biogeosciences 6: 139−148Dugdale RC, Wilkerson FP (1986) The use of 15N to measure
nitrogen uptake in eutrophic oceans: experimental con-siderations. Limnol Oceanogr 31: 673−689
Egge JK, Thingstad TF, Larsen A, Engel A, Wohlers J,Bellerby RGJ, Riebesell U (2009) Primary productionduring nutrient-induced blooms at elevated CO2 con -centrations. Biogeosciences 6: 877−885
Engel A, Borchard C, Piontek J, Schulz KG, Riebesell U,Bellerby R (2013) CO2 increases 14C primary productionin an Arctic plankton community. Biogeosciences 10: 1291−1308
Fernández M, Bianchi M, Van Wambeke F (1994) Bacterialbiomass, heterotrophic production and utilization of dissolved organic matter photosynthetically produced inthe Almeria-Oran front. J Mar Syst 5: 313−325
Fowler SW, Knauer GA (1986) Role of large particles in atransport of elements and organic compounds throughthe ocean water column. Prog Oceanogr 16: 147−194
Fuhrman JA, Azam F (1982) Thymidine incorporation as ameasure of heterotrophic bacterioplankton production inmarine surface waters: evaluation and field results. MarBiol 66: 109−120
Gao K, Xu J, Gao G, Li Y and others (2012) Rising CO2 andincreased light exposure synergistically reduce marineprimary productivity. Nat Clim Change 2: 519−523
Geider RJ, LaRoche J (2002) Redfield revisited: variability ofC: N: P in marine microalgae and its biochemical basis.Eur J Phycol 37: 1−17
Geider RJ, Platt T, Raven JA (1986) Size dependence ofgrowth and photosynthesis in diatoms: a synthesis. MarEcol Prog Ser 30: 93−104
Goldman J (1993) Potential role of large oceanic diatoms innew primary production. Deep-Sea Res I 40: 159−168
Hein M, Sand-Jensen K (1997) CO2 increase oceanic pri-mary production. Nature 388: 526−527
Hockin NL, Mock T, Mulholland F, Kopriva S, Malin G(2012) The response of diatom central carbon metabo-lism to nitrogen starvation is different from that of greenalgae and higher plants. Plant Physiol 158: 299−312
Kähler P, Koeve W (2001) Marine dissolved organic matter: Can its C: N ratio explain carbon over consumption?Deep-Sea Res I 48: 49−62
Kana TM, Glibert PM (1987) Effect of irradiance of up to2000 µE m−2 s−1 on marine Synechococcus WH7803—1.Growth, pigmentation and cell composition. Deep-SeaRes 34: 479−495
Kiørboe T (2001) Formation and fate of marine snow: small-scale processes with large-scale implications. Sci Mar 65: 57−71
Knap A, Michaels A, Close H, Ducklow H, Dickson A (eds)(1996) Protocols for the Joint Global Ocean Flux Study(JGOFS) core measurements. JGOFS Report No. 19, IOCManuals and Guides, UNESCO, Bergen
Krom MD, Kress N, Brenner S (1991) Phosphorous limitationof primary productivity in the eastern MediterraneanSea. Limnol Oceanogr 36: 424−432
Krom MD, Herut B, Mantoura RFC (2004) Nutrient budgetfor the Eastern Mediterranean: implication for phospho-rous limitation. Limnol Oceanogr 49: 1582−1592
Lagaria A, Parra S, Lefevre D, Van Wambeke F and others(2011) The effects of nutrient addition on particulate anddissolved primary production and metabolic state in surface waters of three Mediterranean eddies. Biogeo-sciences 8: 2595−2607
55

Aquat Biol 22: 43–57, 2014
Lee S, Fuhrman JA (1987) Relationships between biovolumeand biomass of naturally derived marine bacterioplank-ton. Appl Environ Microbiol 53: 1298−1303
Litchman E, Klausmeier CA, Yoshiyama K (2009) Contrast-ing size evolution in marine and freshwater diatoms.Proc Natl Acad Sci USA 106: 2665−2670
Loferer-Krößbacher M, Klimar J, Psenner R (1998) Deter -mination of bacterial cell dry mass by transmission elec-tron microscopy and densitometric image analysis. Appl Environ Microbiol 64: 688−694
MacIsaac JJ, Dugdale RC (1972) Interactions of light andinorganic nitrogen in controlling nitrogen uptake in thesea. Deep-Sea Res 19: 209−232
Marañón E, Cermeño P, Pérez V (2005) Continuity in thephotosynthetic production of dissolved organic carbonfrom eutrophic to oligotrophic waters. Mar Ecol Prog Ser299: 7−17
Marchand D, Prairie YT, del Giorgio PA (2009) Linking forest fires to lake metabolism and carbon dioxide emissions in the boreal region of Northern Québec. GlobChange Biol 15: 2861−2873
Martínez R (1997) Enhancement of microplankton respira-tory activity in the Almería-Oran front (Western Medi -terranean Sea). J Plankton Res 19: 2051−2065
Mei ZP, Legendre L, Tremblay JE, Miller L and others (2005)Carbon: nitrogen (C/N) stoichiometry of a spring-summerphytoplankton bloom in the North Water polynya (NOW).Deep-Sea Res I 52: 2301−2314
Menden-Deuer S, Lessard EJ (2000) Carbon to volume rela-tionships for dinoflagellates, diatoms and other protistplankton. Limnol Oceanogr 45: 569−579
Mercado JM, Cortés D, García A, Ramírez T (2007) Seasonaland inter-annual changes in the planktonic communitiesof the northwest Alboran Sea (Mediterranean Sea). ProgOceanogr 74: 273−293
Mercado JM, Cortés D, Ramírez T, Gómez F (2012) Hydro-logical forcing masks the potential impact of nutrientrelease from diffuse sources in the NW coast of the Albo-ran Sea. Hydrobiologia 680: 91−107
Mercado JM, Sala I, Sallés S, Cortés D and others (2014)Effects of community composition and size structure onlight absorption and nutrient uptake of phytoplankton incontrasting areas of the Alboran Sea. Mar Ecol Prog Ser499: 47−64
Mills MM, Moore CM, Langlois R, Milne A and others (2008)Nitrogen and phosphorus co-limitation of bacterial pro-ductivity and growth in the oligotrophic subtropicalNorth Atlantic. Limnol Oceanogr 53: 824−834
Morán XAG, Taupier-Letage I, Vázquez-Domínguez E,Ruiz S, Arin L, Raimbault P, Estrada M (2001) Physical-biological coupling in the Algerian Basin (SW Mediter-ranean): influence of mesoscale instabilities on the bio-mass and production of phytoplankton andbacterioplankton. Deep-Sea Res I 48: 405−437
Morel A, Ahn YH, Partensky F, Vaulot D, Claustre H (1993)Prochlorococcus and Synechococcus: a comparativestudy of their optical properties in relation to their sizeand pigmentation. J Mar Res 51: 617−649
Motegi C, Tanaka T, Piontek J, Brussaard CPD, Gattuso JP,Weinbauer MG (2012) Effect of CO2 enrichment on bac-terial production and respiration and on bacterial carbonmetabolism in Arctic waters. Biogeosciences Discuss 9: 15213−15235
Mulholland MR, Rocha AM, Boncillo GE (2011) Incorpora-tion of leucine and thymidine by estuarine phytoplank-
ton: implications for bacterial productivity estimates.Estuaries Coasts 34: 310−325
Nagata T, Kirchman DL (1991) Release of dissolved free andcombined amino acids by bacteriovorous marine flagel-lates. Limnol Oceanogr 36: 433−443
Navarro N, Agustí S, Duarte CM (2004) Plankton meta -bolism and dissolved organic carbon use in the Bay ofPalma, NW Mediterranean Sea. Limnol Oceanogr 37: 47−54
Neale PJ, Sobrino C, Segovia M, Mercado JM and others(2014) Effect of CO2, nutrients and light on coastal plank-ton. I. Abiotic conditions and biological responses. AquatBiol 22: 25−41
Olenina I, Hajdu S, Edler L, Andersson A and others (2006)Biovolumes and size-classes of phytoplankton in theBaltic Sea. HELCOM Baltic Sea Environmental Pro -ceedings No. 106, Helsinki Commission, Baltic MarineEnvironment Protection Commission, Helsinki
Packard TT, Williams PJ (1981) Rates of respiratory oxygenconsumption and electron transport in surface seawaterfrom the northwest Atlantic. Oceanol Acta 4: 351−358
Passow U (2002) Transparent exopolymer particles (TEP) inaquatic environments. Prog Oceanogr 55: 287−333
Passow U, Alldredge AL (1995) A dye-binding assay forthe spectrophotometric measurement of transparent exo -poly mer particles (TEP). Limnol Oceanogr 40: 1326−1335
Passow U, Carlson CA (2012) The biological pump in a highCO2 world. Mar Ecol Prog Ser 470: 249−271
Pedrós-Alió C, Calderón-Paz JI, Guixa-Boixereu N, EstradaM, Gasol JM (1999) Bacterioplankton and phytoplanktonbiomass and production during summer stratification inthe Northwestern Mediterranean Sea. Deep-Sea Res 46: 985−1019
Piontek J, Borchard C, Sperling M, Schulz KG, Riebesell U,Engel A (2013) Response of bacterioplankton activity in anArctic fjord system to elevated pCO2: results from a meso-cosm perturbation study. Biogeosciences 10: 297−314
Ramírez T, Cortés D, Mercado JM, Vargas-Yañez M,Sebastián M, Liger E (2005) Seasonal dynamics of inor-ganic nutrients and phytoplankton biomass in the NWAlboran Sea. Estuar Coast Shelf Sci 65: 654−670
Ramírez T, Liger E, Mercado JM, Cortés D and others (2006)Respiratory ETS activity of plankton in the northwesternAlboran Sea: seasonal variability and relationship withhydrological and biological features. J Plankton Res 28: 629−641
Raven JA, Kübler JE (2002) New light on the scaling ofmetabolic rate with the size of algae. J Phycol 38: 11−16
Reul A, Rodríguez V, Jiménez-Gómez F, Blanco JM and oth-ers (2005) Variability in the spatio-temporal distributionand size-structure of phytoplankton across an upwellingarea in the NW-Alboran Sea, (W-Mediterranean). ContShelf Res 25: 589−608
Reul A, Muñoz M, Begoña B, Neale PJ and others (2014)Effect of CO2, nutrients and light on coastal plankton. IV.Trophic cascade, size structure and composition. AquatBiol 22: 59−76
Ribes M, Coma R, Gili JM (1999) Seasonal variation of par-ticulate organic carbon, dissolved organic carbon andthe contribution of microbial communities to the live par-ticulate organic carbon in a shallow near-bottom ecosys-tem in the Northwestern Mediterranean Sea. J PlanktonRes 21: 1077−1100
Riebesell U, Tortell PD (2011) Effects of ocean acidificationof pelagic organisms and ecosystems. In: Gatusso JP,
56

Mercado et al.: High CO2 effects on plankton metabolism
Lansson L (eds) Ocean acidification. Oxford UniversityPress, Oxford, p 99−121
Roberts BJ, Howarth RW (2006) Nutrient and light availabil-ity regulate the relative contribution of autotrophs andheterotrophs to respiration in freshwater pelagic eco -systems. Limnol Oceanogr 51: 288−298
Sabine CL, Feely RA, Gruber N, Key RM and others (2004)The oceanic sink for anthropogenic CO2. Science 305: 367−371
Schartau M, Engel A, Schroter J, Thoms S, Volker C, Wolf-Gladrow D (2007) Modelling carbon overconsumptionand the formation of extracellular particulate organiccarbon. Biogeosciences 4: 433−454
Siokou-Frangou I, Christaki U, Mazzocchi MG, Montresor M,Ribera d’Alcalá M, Vaqué D, Zingone A (2010) Planktonin the open Mediterranean Sea: a review. Biogeosciences7: 1543−1586
Sobrino C, Neale PJ, Phillips-Kress JD, Moeller RE, PorterJA (2009) Elevated CO2 increases sensitivity to ultravio-let radiation in lacustrine phytoplankton assemblages.Limnol Oceanogr 54: 2448−2459
Sobrino C, Segovia M, Neale PJ, Mercado JM and others(2014) Effect of CO2, nutrients and light on coastal plankton. IV. Physiological responses. Aquat Biol 22: 77−93
Sorensen J, Siegel D (2001) Variability of the effective quan-tum yield for carbon assimilation in the Sargasso Sea.Deep-Sea Res II 48: 2005−2035
Stramski D, Sciandra A, Claustre H (2002) Effects of temper-ature, nitrogen, and light limitation on the optical prop-erties of the marine diatom Thalassiosira pseudonana.Limnol Oceanogr 47: 392−403
Sun J, Liu D (2003) Geometric models for calculating cellbiovolume and surface area for phytoplankton. J Plank-ton Res 25: 1331−1346
Tanaka T, Alliouane S, Bellerby RGB, Czerny J and others(2013) Effect of increased pCO2 on the planktonic meta-bolic balance during a mesocosm experiment in an Arc-tic fjord. Biogeosciences 10: 315−323
Teira E, Fernández A, Álvarez-Salgado XA, García-MartínEE, Serret P, Sobrino C (2012) Response of two marinebacterial isolates to high CO2 concentration. Mar EcolProg Ser 453: 27−36
Thingstad TF, Rassoulzadegan F (1995) Nutrient limitations,microbial food webs, and ‘biological C-pumps’: sug-gested interactions in a P-limited Mediterranean. MarEcol Prog Ser 117: 299−306
Thingstad TF, Krom MD, Mantoura RFC, Flaten GAF andothers (2005) Nature of P limitation in the ultraolig-otrophic Eastern Mediterranean. Science 309: 1068−1071
Tortell PD, Rau GH, Morel FMM (2000) Inorganic carbonacquisition in coastal Pacific phytoplankton communi-ties. Limnol Oceanogr 45: 1485−1500
Tortell PD, DiTullio GR, Sigman DM, Morel FMM (2002)CO2 effects on taxonomic composition and nutrient utilization in an Equatorial Pacific phytoplankton assem-blage. Mar Ecol Prog Ser 236: 37−43
Tortell PD, Payne CD, Li Y, Trimborn S and others (2008)CO2 sensitivity of Southern Ocean phytoplankton. Geo-phys Res Lett 35: L04605, doi: 10.1029/2007GL032583
Vadrucci MR, Cabrini M, Basset A (2007) Biovolume deter-mination of phytoplankton guilds in transitional waterecosystems of Mediterranean Ecoregion. Transit WatersBull 2: 83−102
Van Wambeke F, Lefèvre D, Prieur L, Sempéré R, Bianchi M,Oubelkheir K, Bruyant F (2004) Distribution of microbialbiomass, production, respiration, dissolved organic car-bon and factors controlling bacterial production acrossa geostrophic front (Almeria-Oran, SW MediterraneanSea). Mar Ecol Prog Ser 269: 1−15
Verity P, Robertson CY, Tronzo CR, Andrews MG, NelsonJR, Sieracki ME (1992) Relationship between cell volumeand carbon and nitrogen content of marine photosyn-thetic nanoplankton. Limnol Oceanogr 37: 1434−1446
Wu Y, Gao K, Riebesell U (2010) CO2-induced seawateracidification affects physiological performance of the m -arine diatom Phaeodactylum tricornutum. Biogeosciences7: 2915−2923
Yang ZK, Niu YF, Ma YH, Xue J and others (2013) Molecularand cellular mechanisms of neutral lipid accumulation indiatom following nitrogen deprivation. Biotech Biofuels6: 67
Zohary T, Herut B, Krom MD, Mantoura RFC and others(2005) P-limited bacteria but N and P co-limited phyto-plankton in the Eastern Mediterranean — a microcosmexperiment. Deep-Sea Res II 52: 3011−3023
57
Submitted: December 16, 2013; Accepted: September 18, 2014 Proofs received from author(s): October 28, 2014