Embed Size (px)
Citation preview
An oligotrophic deep-subsurface communitydependent on syntrophy is dominated by sulfur-drivenautotrophic denitrifiersMaggie C. Y. Laua,1, Thomas L. Kieftb, Olukayode Kuloyoc,2, Borja Linage-Alvarezc,3, Esta van Heerdenc,Melody R. Lindsaya,4, Cara Magnaboscoa,5, Wei Wangd, Jessica B. Wigginsd, Ling Guod, David H. Perlmane,6, Saw Kyine,Henry H. Shwee, Rachel L. Harrisa, Youmi Ohf,7, Min Joo Yig, Roland Purtscherth, Greg F. Slateri, Shuhei Onoj,Siwen Weik, Long Lik,l, Barbara Sherwood Lollarl, and Tullis C. Onstotta
aDepartment of Geosciences, Princeton University, Princeton, NJ 08544; bDepartment of Biology, New Mexico Institute of Mining and Technology, Socorro, NM87801; cDepartment of Microbial, Biochemical, and Food Biotechnology, University of the Free State, Bloemfontein 9301, South Africa; dHigh ThroughputSequencing and Microarray Facility, Lewis–Sigler Institute for Integrative Genomics, Princeton University, NJ 08544; eProteomics and Mass Spectrometry Core,Department of Molecular Biology, Princeton University, NJ 08544; fAtmospheric and Oceanic Sciences, Princeton University, Princeton, NJ 08544; gDepartmentof Ecology and Evolutionary Biology, Princeton University, Princeton, NJ 08544; hClimate and Environmental Physics, Physics Institute, University of Bern, 3012Bern, Switzerland; iSchool of Geography and Earth Sciences, McMaster University, Hamilton, ON, Canada L8S 4K1; jDepartment of Earth, Atmospheric, andPlanetary Sciences, Massachusetts Institute of Technology, Cambridge, MA 02139; kDepartment of Earth and Atmospheric Sciences, University of Alberta,Edmonton, AB, Canada T6G 2E3; and lDepartment of Earth Sciences, University of Toronto, Toronto, ON, Canada M5S 3B1
Edited by David M. Karl, University of Hawaii, Honolulu, HI, and approved October 26, 2016 (received for review August 10, 2016)
Subsurface lithoautotrophic microbial ecosystems (SLiMEs) underoligotrophic conditions are typically supported by H2. Methanogensand sulfate reducers, and the respective energy processes, are thoughtto be the dominant players and have been the research foci. Recentinvestigations showed that, in some deep, fluid-filled fractures in theWitwatersrand Basin, South Africa, methanogens contribute <5% ofthe total DNA and appear to produce sufficient CH4 to support the restof the diverse community. This paradoxical situation reflects our lack ofknowledge about the in situ metabolic diversity and the overall eco-logical trophic structure of SLiMEs. Here, we show the active metabolicprocesses and interactions in one of these communities by combiningmetatranscriptomic assemblies, metaproteomic and stable isotopicdata, and thermodynamic modeling. Dominating the active commu-nity are four autotrophic β-proteobacterial genera that are capable ofoxidizing sulfur by denitrification, a process that was previously un-noticed in the deep subsurface. They co-occur with sulfate reducers,anaerobic methane oxidizers, and methanogens, which each comprise<5% of the total community. Syntrophic interactions between thesemicrobial groups remove thermodynamic bottlenecks and enable di-verse metabolic reactions to occur under the oligotrophic conditionsthat dominate in the subsurface. The dominance of sulfur oxidizers isexplained by the availability of electron donors and acceptors to thesemicroorganisms and the ability of sulfur-oxidizing denitrifiers to gainenergy through concomitant S and H2 oxidation. We demonstrate thatSLiMEs support taxonomically and metabolically diverse microorgan-isms, which, through developing syntrophic partnerships, overcomethermodynamic barriers imposed by the environmental conditions inthe deep subsurface.
active subsurface environment | metabolic interactions | sulfur-drivenautotrophic denitrifiers | syntrophy | inverted biomass pyramid
Microorganisms living in deep-subsurface ecosystems acquireenergy through chemosynthesis and carbon from organic or
inorganic sources. Whereas heterotrophs use dissolved organiccarbon (DOC) transported from the surface and/or producedin situ, detrital organic deposits buried along with the sediments,and hydrocarbons migrating into petroleum reservoirs, chemo-lithoautotrophs fix dissolved inorganic carbon (DIC). In oligotro-phic systems, subsurface lithoautotrophic microbial ecosystems(SLiMEs) (1) that are fueled by H2 support the occurrence ofautotrophic methanogens, acetogens, and sulfate reducers (2–5).These environments can host highly diverse communities, consist-ing mostly of prokaryotes, but also multicellular microeukaryotesand viral particles (6–13). Due to the limitation of available nu-trients and energy substrates in the oligotrophic subsurface, it is
reasonable to hypothesize that subsurface inhabitants with diversefunctional traits cooperate syntrophically to maximize energy yield
Significance
Microorganisms are known to live in the deep subsurface, kilo-meters below the photic zone, but the community-wide metabolicnetworks and trophic structures (the organization of their energyand nutritional hierarchy) remain poorly understood. We showthat an active subsurface lithoautotrophic microbial ecosystem(SLiME) under oligotrophic condition exists. Taxonomically andmetabolically diverse microorganisms are supported, with sulfur-driven autotrophic denitrifiers predominating in the community.Denitrification is a highly active process in the deep subsurface thatevaded recognition in the past. This study highlights the criticalrole of metabolic cooperation, via syntrophy between subsur-face microbial groups, for the survival of the whole communityunder the oligotrophic conditions that dominate in the subsurface.
Author contributions: M.C.Y.L. and T.C.O. designed research; M.C.Y.L., C.M., W.W., and T.C.O.planned the technical approach of metatranscriptomics; M.C.Y.L., D.H.P., and T.C.O. planned thetechnical approach of metaproteomics; M.C.Y.L., T.L.K., O.K., B.L.-A., E.v.H., M.R.L., C.M., W.W.,J.B.W., L.G., D.H.P., S.K., H.H.S., R.P., G.F.S., S.O., S.W., L.L., B.S.L., and T.C.O. performed research;E.v.H. was the point of contact with the mining company; M.C.Y.L., T.L.K., O.K., B.L.-A., E.v.H.,M.R.L., and C.M. collected samples; M.C.Y.L., M.R.L., R.L.H., Y.O., M.J.Y., R.P., G.F.S., S.O., S.W., L.L.,B.S.L., and T.C.O. analyzed data; G.F.S., S.O., L.L., B.S.L., and T.C.O. assistedwith the interpretationof isotopic data; T.L.K., C.M.,W.W., J.B.W., D.H.P., S.K., G.F.S., L.L., B.S.L., and T.C.O. contributed toand/or commented on the earlier drafts of the manuscript; and M.C.Y.L. wrote the paper.
The authors declare no conflict of interest.
This article is a PNAS Direct Submission.
Data deposition: The single-end Illumina reads of the RNA-seq data have been depositedat the National Center for Biotechnology Information BioProject (accession no.PRJNA308990). The Sanger sequences obtained by RT-PCR cloning have been depositedin the GenBank database (accession nos. KF901390–KF901421 and KF901484–KF901489).The mass spectrometry proteomics data have been deposited to the ProteomeXchangeConsortium via the PRIDE partner repository (dataset identifier PXD004634).1To whom correspondence should be addressed. Email: [email protected] address: Energy Bioengineering and Geomicrobiology Group, University of Calgary,Calgary, AB, Canada T2N 1N4.
3Present address: Consorcio de Promoción del Ovino, 49630 Villalpando, Castillo-León, Spain.4Present address: Department of Microbiology and Immunology, Montana State Univer-sity, Bozeman, MT 59717.
5Present address: Simons Center for Data Analysis, Simons Foundation, New York, NY 10010.6Present address: Department of Chemistry, Princeton University, NJ 08544.7Present address: Department of Earth, Atmospheric, and Planetary Sciences, PurdueUniversity, West Lafayette, IN 47907.
This article contains supporting information online at www.pnas.org/lookup/suppl/doi:10.1073/pnas.1612244113/-/DCSupplemental.
www.pnas.org/cgi/doi/10.1073/pnas.1612244113 PNAS | Published online November 21, 2016 | E7927–E7936
MICRO
BIOLO
GY
PNASPL
US
and growth, as has been demonstrated elsewhere (14–16). Howsuch interspecies metabolic interactions relate to the subsurfacetrophic structure remains largely unexplored.Syntrophy refers to metabolic partners being dependent on each
other to create better conditions that are mutually beneficial forthe metabolic activities observed (14), and critically, “the mutualdependence cannot be overcome by simply adding a cosubstrate orany type of nutrient” (16). Syntrophic microbial consortia are wellknown to anaerobically degrade organic carbon by cross-feeding onmetabolic products such as acetate, formate, and H2 such thatthese substances do not accumulate to a toxic level that couldsuppress the activity of the producers (16). Anaerobic methaneoxidizers (ANMEs) and sulfate reducers are the syntrophic part-ners responsible for anaerobic CH4 oxidation in shallow, anoxicCH4-rich sediments. The details of such metabolic interaction arenot fully understood but it is now known to involve production ofS0 by ANMEs as an intermediate (17) and/or nanowires for directelectron transfer (18, 19). Recently, a consortium of Thioploca andanaerobic ammonia oxidizers that uses NO3
− and NH4+ as the
electron-shuttling system was shown to contribute significantly tothe loss of organic nitrogen in continental margin sediments atmuch shallower depths (20). It is, however, yet to be determinedwhether this partnership is commensal or syntrophic. Regardless,the latter two examples from oceanic subsurface environmentsvalidate the idea that symbiosis among microorganisms (via obli-gate and facultative syntrophy, mutualism, and commensalism)could play a pivotal role in sustaining the microbiome and bio-geochemical cycling in the deeper biosphere on the Earth.Our recent investigations in the Witwatersrand Basin, South
Africa, indicated that the H2-driven microbial groups (methanogens,acetogens, and sulfate reducers) are less prevalent in the DNAcommunities (21) than previously perceived (2, 4, 22). Interestingly,in some cases, methanogens comprising <5% of the total DNAapparently produce sufficient CH4 to support the rest of the com-munity (23). These results indicate that our understanding of themetabolisms and energy fluxes in SLiMEs is far from complete (24).This study aimed to test the hypotheses that methanogenesis and/orother H2-driven processes are the predominant primary producers inSLiMEs and that methanogenic CH4 from the rare methanogenicpopulation sustains the entire community. Here, we describe theactive community and metabolic pathways in fracture fluid withrelatively low DOC (28.8 μM) (21, 23). We used metatranscriptomicsand metaproteomics to map the metabolic landscape of the activemicrobial community and to decipher the metabolic network amongmembers. Our results show that this oligotrophic ecosystem runsupon syntrophic cooperation between microbial groups and isdominated by sulfur-oxidizing, autotrophic, denitrifying bacteria.
Results and DiscussionGeochemistry Characterization. The fluid investigated was col-lected from a fault zone at 1.34-km depth in the WitwatersrandBasin, South Africa. It was warm (38 °C), alkaline (pH 8.6),brackish (total dissolved solids, 3.6 g·L−1) and hypoxic (pe = −1.4)(21, 23) (SI Appendix, Table S1). It had low H2 (8.9 nM), high CH4(1.3 mM) relative to DIC (330 μM), and high SO4
2− (623 μM)relative to HS− (14.9 μM). Noble gas-derived residence time for thefracture water (3–14 my based on 40Ar, 134Xe, and 136Xe), and ra-diocarbon ages of 40–80 ky for the DIC in the water indicatemixing of older fracture water trapped in the Witwatersrand hostrocks and paleometeoric waters sourcing the DIC (12, 25–27) (SIAppendix, Table S1).
Molecular Analyses. We extracted the community DNA, RNA, andprotein in parallel from biomass captured on a 0.1-μm-pore sizemembrane filter. The DNA community was dominated by Proteo-bacteria, with metabolic potential for methanogenesis, CH4 oxida-tion, SO4
2− reduction, NO3− reduction, and N2 fixation (8, 21, 23).
This study analyzed the RNA and protein samples using metatran-scriptomics and metaproteomics, respectively. High-quality single-end reads, a total of 21,577,391 bp, were generated from the totalRNA (SI Appendix, Table S2). Protein-encoding genes (PEGs)
predicted from assembled mRNA transcripts were then used toannotate the metaproteome, and 1,983 unique peptides representing824 protein IDs were identified. As mRNAs and proteins have dif-ferent response times to environmental changes (28), they provideindependent yet complementary snapshots of the active metaboliclandscape. Relative abundances of active microorganisms reportedhere are derived from ribosomal RNA (rRNA) transcripts (%rRNA)and ribosomal protein PEGs (%rp). Because the per-cell abundanceof these molecules varies, these values may not be directly equivalentto biomass, but they provide a reasonable approximation.
Taxonomic Diversity. Proteobacteria (85.3%rRNA and 73.6%rp) sig-nificantly outnumbered 38 other microbial phyla detected in thefracture fluid sample at the time of collection (SI Appendix, Fig.S1). Archaea comprised only 1.9%rRNA and <0.1%rp, and eu-karyotes were negligible (0.03%rRNA) (SI Appendix, Fig. S1). Thistaxonomic profile of the active microbial (RNA) community is verysimilar to that of the total DNA community derived from the samesample (8, 21, 23). The active members will be described in greaterdetail along with the results of the expressed gene and enzymes forthe N, S, and C metabolisms.
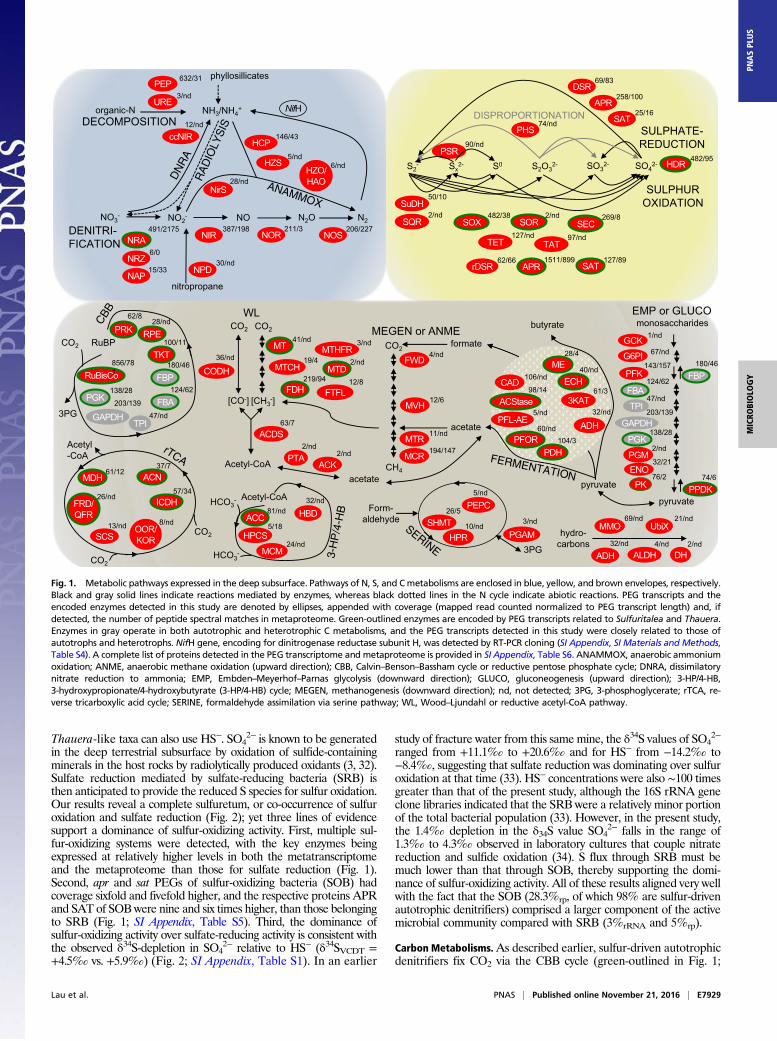
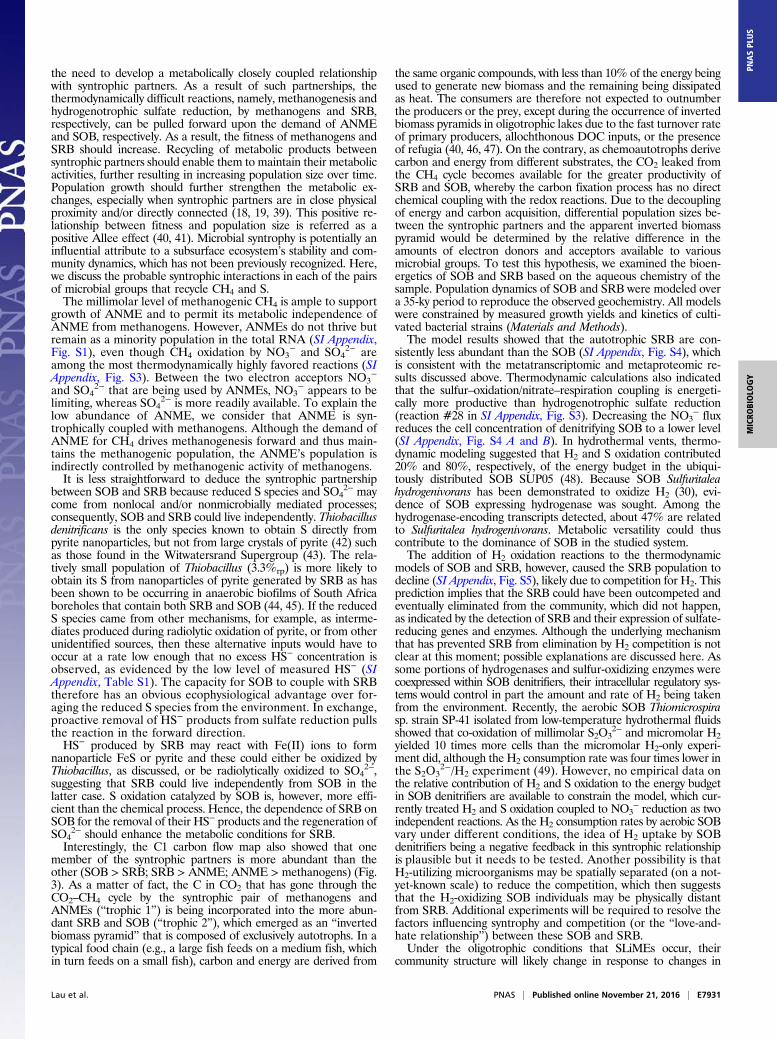
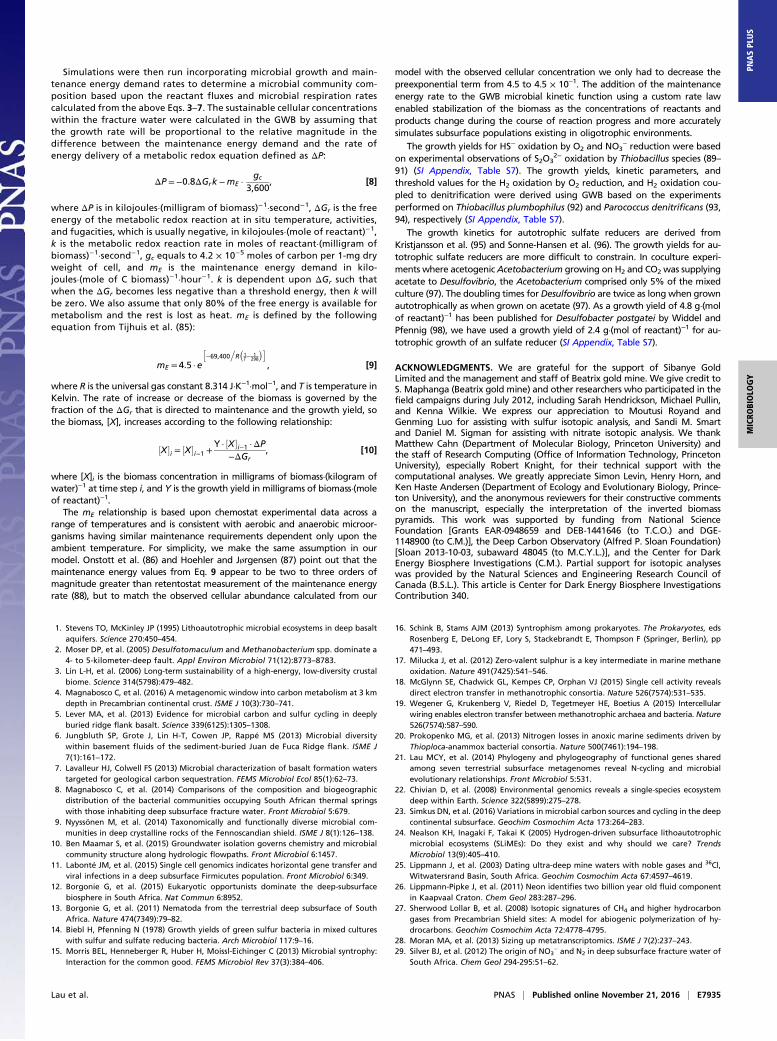
Nitrogen Metabolisms. The occurrence of canonical denitrificationis indicated by detection of a complete suite of PEGs and theencoded enzymes (Fig. 1), and the metabolic intermediate N2O(22 μM; SI Appendix, Table S1). Diverse denitrifiers related toSulfuritalea (0.3%rRNA and 20.1%rp) and Thauera (1.5%rRNA and3.5%rp) of Rhodocyclaceae (25.7%rRNA and 39.4%rp), Thiobacillus(3.3%rRNA and 2.3%rp) and Sulfuricella (0.2%rRNA and 1.8%rp) ofHydrogenophilaceae (4.7%rRNA and 5.0%rp), Rhodospirillaceae(4.3%rRNA and 2.9%rp), Ectothiorhodospiraceae (1.7%rRNA and1.5%rp), and Bacillaceae (0.3%rRNA) were detected.The discrepancy between the relative abundances of Sulfuritalea-
like taxa in rRNA transcripts and ribosomal protein PEGs wasfurther investigated. About 70% of the rRNA transcripts cannot beassigned to known β-proteobacterial Rhodocyclaceae genera,whereas 50% of the ribosomal protein PEGs are related toSulfuritalea (SI Appendix, Fig. S2). Reciprocal best-hit (RBH)BLAST search between the complete PEG transcriptome and21 published Rhodocyclaceae genomes provides independentsupport of Sulfuritalea’s dominance (SI Appendix, Fig. S2). The RBHBLAST search also indicates that Sulfuritalea- and Thauera-like taxaexpressed PEGs involved in canonical denitrification, sulfur (HS−, S0,S2O3
2−, SO32−) oxidation, and the Calvin–Benson–Bassham (CBB)
cycle (green-outlined in Fig. 1; SI Appendix, Table S3). Together withThiobacillus- and Sulfuricella-like taxa, sulfur-driven autotrophic de-nitrifiers (autotrophic microorganisms that couple NO3
− reductionwith sulfur oxidation) accounted for 27.8%rp of the active community.In addition to canonical denitrification, NO2
− removal via anaer-obic ammonium oxidation (ANAMMOX) and dissimilatory nitratereduction to ammonia (DNRA) are indicated by the detection of thekey enzymes Planctomycetes-related nitrite reductase (NirS) andhydroxylamine oxidoreductase (HAO) for ANAMMOX, and cyto-chrome c nitrite reductase (ccNIR) for DNRA, respectively. Broca-diaceae capable of ANAMMOX constituted only 0.07% of therRNA. By RT-PCR cloning, we retrieved nifH gene transcripts ofuncultured Proteobacteria in the same fracture fluid (SI Appendix,Table S4), indicating that microbial fixation of N2 occurred, butlikely at levels too low to be detected in the PEG transcriptome.The highly isotopically enriched NO3
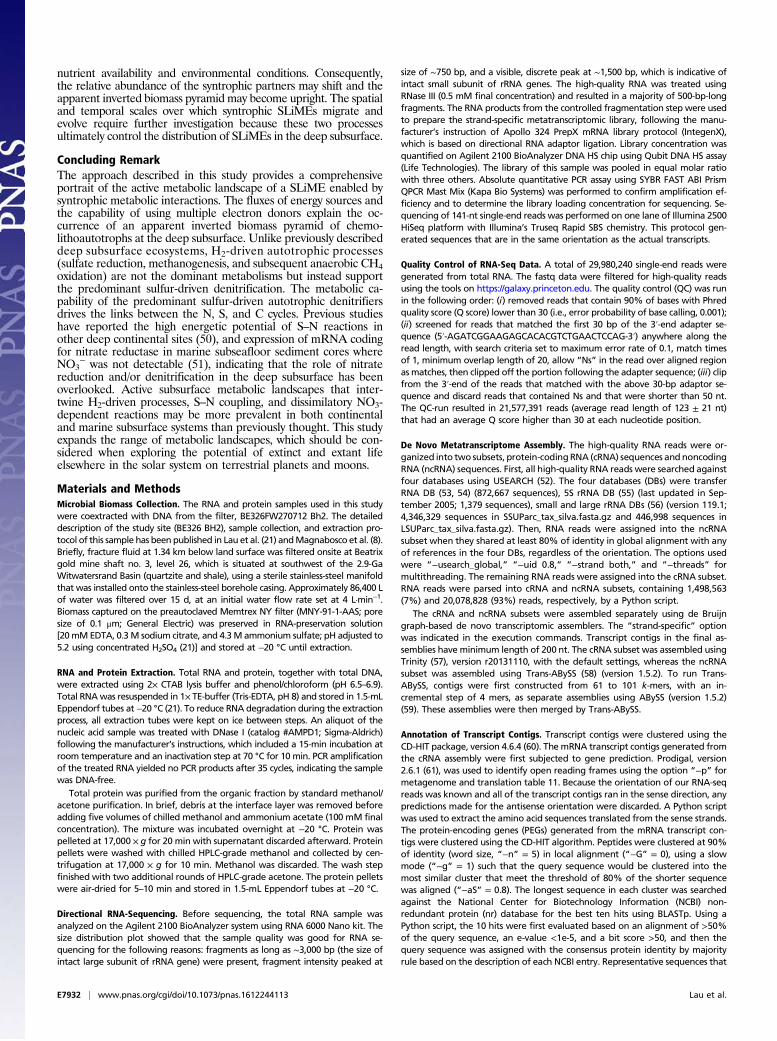
− (δ15NAIR = 36.3 ± 0.1‰;δ18OVSMOW = 49.2 ± 0.5‰), along with the relative δ15N depletionin N2 (δ15NAIR = −1 ‰) observed in this sample (SI Appendix,Table S1) are consistent with canonical denitrification as the prin-cipal N pathway (Fig. 2) (29). The NO3
− may originate from radio-lytic oxidation of NH3/NH4
+ in the rock formation pore water (29)and/or from paleometeoric recharge (as for the DIC). The denitri-fiers appear to have reduced NO3
− to trace levels (0.3 μM).
Sulfur Metabolisms. For sulfur-driven autotrophic denitrification totake place, Sulfuritalea- and Sulfuricella-like taxa need theelectron donors S0 and S2O3
2− (30, 31), whereas Thiobacillus- and
E7928 | www.pnas.org/cgi/doi/10.1073/pnas.1612244113 Lau et al.
Thauera-like taxa can also use HS−. SO42− is known to be generated
in the deep terrestrial subsurface by oxidation of sulfide-containingminerals in the host rocks by radiolytically produced oxidants (3, 32).Sulfate reduction mediated by sulfate-reducing bacteria (SRB) isthen anticipated to provide the reduced S species for sulfur oxidation.Our results reveal a complete sulfuretum, or co-occurrence of sulfuroxidation and sulfate reduction (Fig. 2); yet three lines of evidencesupport a dominance of sulfur-oxidizing activity. First, multiple sul-fur-oxidizing systems were detected, with the key enzymes beingexpressed at relatively higher levels in both the metatranscriptomeand the metaproteome than those for sulfate reduction (Fig. 1).Second, apr and sat PEGs of sulfur-oxidizing bacteria (SOB) hadcoverage sixfold and fivefold higher, and the respective proteins APRand SAT of SOBwere nine and six times higher, than those belongingto SRB (Fig. 1; SI Appendix, Table S5). Third, the dominance ofsulfur-oxidizing activity over sulfate-reducing activity is consistent withthe observed δ34S-depletion in SO4
2− relative to HS− (δ34SVCDT =+4.5‰ vs. +5.9‰) (Fig. 2; SI Appendix, Table S1). In an earlier
study of fracture water from this same mine, the δ34S values of SO42−
ranged from +11.1‰ to +20.6‰ and for HS− from −14.2‰ to−8.4‰, suggesting that sulfate reduction was dominating over sulfuroxidation at that time (33). HS− concentrations were also ∼100 timesgreater than that of the present study, although the 16S rRNA geneclone libraries indicated that the SRB were a relatively minor portionof the total bacterial population (33). However, in the present study,the 1.4‰ depletion in the δ34S value SO4
2− falls in the range of1.3‰ to 4.3‰ observed in laboratory cultures that couple nitratereduction and sulfide oxidation (34). S flux through SRB must bemuch lower than that through SOB, thereby supporting the domi-nance of sulfur-oxidizing activity. All of these results aligned very wellwith the fact that the SOB (28.3%rp, of which 98% are sulfur-drivenautotrophic denitrifiers) comprised a larger component of the activemicrobial community compared with SRB (3%rRNA and 5%rp).
Carbon Metabolisms.As described earlier, sulfur-driven autotrophicdenitrifiers fix CO2 via the CBB cycle (green-outlined in Fig. 1;
Acetyl-CoAHCO3-
ACC81/nd
HPCS5/18
MCM24/nd
HBD32/nd
HCO3-
FDH219/94
FTFL12/8
MTCH19/4
MTD2/nd
MTHFR3/ndMT
41/nd
WL
[CO-] [CH3-]
CO2CO2
ACDS63/7
CODH36/nd
Acetyl-CoA
CO2
acetate
CH4
FWD4/nd
MVH12/6
MTR11/nd
MCR194/147
MEGEN or ANMEformate
butyrate
PDH104/3PFOR
60/ndPFL-AE
5/nd
CAD106/nd
ACStase98/14
ADH32/nd
3KAT61/3
ECH40/ndME
28/4
acetateACK
2/ndPTA2/nd
MMO69/nd
hydro-carbons
ADH32/nd
ALDH4/nd
DH2/nd
UbiX21/nd
FRD/QFR
26/nd
OOR/KOR
8/nd
ICDH57/34
MDH61/12
ACN37/7
SCS13/nd
CO2
CO2
Acetyl-CoA
Form-aldehyde SHMT
26/5
HPR10/nd
PGAM3/nd
PEPC5/nd
3PG
EMP or GLUCO
PK76/2
monosaccharides
ENO32/21
PGM2/nd
GAPDH
PGK
TPI47/nd
G6PI 67/ndGCK 1/nd
PFK143/157
RuBPPRK
62/8
RuBisCo856/781
CO2
3PG
PGK138/28
GAPDH203/139 FBA
124/62FBP
180/46
TPI47/nd
TKT100/11
RPE28/nd
pyruvate PPDK74/6
FBA124/62
203/139
138/28
pyruvate
FBP180/46
NO3- NO2
- NO N2O N2
NRA491/2175
NRZ6/0
NAP15/33
NIR387/198
NOR211/3
NOS206/227
NirS28/nd
NH3/NH4+
HZO/HAO
6/ndHZS5/nd
HCP146/43ccNIR
12/nd
DENITRI-FICATION
organic-NURE
3/ndPEP
632/31
nitropropane
NPD30/nd
phyllosillicates
DECOMPOSITIONNifH
S2- S0 S2O3
2- SO32-Sx
2- SO42-
SULPHUROXIDATION
SULPHATE-REDUCTION
SAT25/16
APR258/100
DSR69/83
DISPROPORTIONATIONPHS
74/nd
SuDH50/10
SQR2/nd
PSR90/nd
SOX482/38
TET127/nd
SOR2/nd
SEC269/8
TAT97/nd
SAT127/89
APR1511/899
rDSR62/66
HDR482/95
Fig. 1. Metabolic pathways expressed in the deep subsurface. Pathways of N, S, and Cmetabolisms are enclosed in blue, yellow, and brown envelopes, respectively.Black and gray solid lines indicate reactions mediated by enzymes, whereas black dotted lines in the N cycle indicate abiotic reactions. PEG transcripts and theencoded enzymes detected in this study are denoted by ellipses, appended with coverage (mapped read counted normalized to PEG transcript length) and, ifdetected, the number of peptide spectral matches in metaproteome. Green-outlined enzymes are encoded by PEG transcripts related to Sulfuritalea and Thauera.Enzymes in gray operate in both autotrophic and heterotrophic C metabolisms, and the PEG transcripts detected in this study were closely related to those ofautotrophs and heterotrophs. NifH gene, encoding for dinitrogenase reductase subunit H, was detected by RT-PCR cloning (SI Appendix, SI Materials and Methods,Table S4). A complete list of proteins detected in the PEG transcriptome and metaproteome is provided in SI Appendix, Table S6. ANAMMOX, anaerobic ammoniumoxidation; ANME, anaerobic methane oxidation (upward direction); CBB, Calvin–Benson–Bassham cycle or reductive pentose phosphate cycle; DNRA, dissimilatorynitrate reduction to ammonia; EMP, Embden–Meyerhof–Parnas glycolysis (downward direction); GLUCO, gluconeogenesis (upward direction); 3-HP/4-HB,3-hydroxypropionate/4-hydroxybutyrate (3-HP/4-HB) cycle; MEGEN, methanogenesis (downward direction); nd, not detected; 3PG, 3-phosphoglycerate; rTCA, re-verse tricarboxylic acid cycle; SERINE, formaldehyde assimilation via serine pathway; WL, Wood–Ljundahl or reductive acetyl-CoA pathway.
Lau et al. PNAS | Published online November 21, 2016 | E7929
MICRO
BIOLO
GY
PNASPL
US
SI Appendix, Table S3). In addition to the CBB cycle, multipleCO2 fixation pathways detected in the metagenome (23)were expressed, namely, reverse tricarboxylic acid cycle (rTCA),3-hydroxypropionate/4-hydroxybutyrate (3-HP/4-HB) pathway,and Wood-Ljundahl (WL) pathway. The ribulose-1,5-bisphosphatecarboxylase/oxygenase (RuBisCo) of the CBB cycle is the mostabundant (Fig. 1) and closely related to the abundant α- andβ-Proteobacteria (SI Appendix, Fig. S1). A complete set of the PEGsand encoded enzymes along the methyl branch of the WL pathwaywas detected (Fig. 1). These are related to those of δ-proteo-bacterial sulfate reducers rather than homoacetogenic bacteria ormethanogens. Sulfate reducers may fix CO or CO2 (autotrophy), orrun the WL pathway in reverse direction to oxidize acetate (het-erotrophy), or do both (mixotrophy). Based on Δ14C and δ13Canalyses of DIC, CH4, DOC, and bacterial phospholipid fatty acids(PLFAs) from this same fracture fluid, Simkus et al. (23) concludedthat δ13CVPDB values of −54.8‰ to −64.0‰ for bacterial PLFAswere due to carbon uptake of DIC (−43‰) or of methanogenicCH4 (−54‰), rather than utilization of the DOC pool. Enzymesinvolved in heterotrophic pathways, such as Embden–Meyerhof–Parnas glycolysis and gluconeogenesis, and in fermentation occurredat much lower abundances compared with those of autotrophicenzymes (Fig. 1), which is consistent with the isotopic data (Fig. 2).The low abundance of 14C in the DIC indicates that some
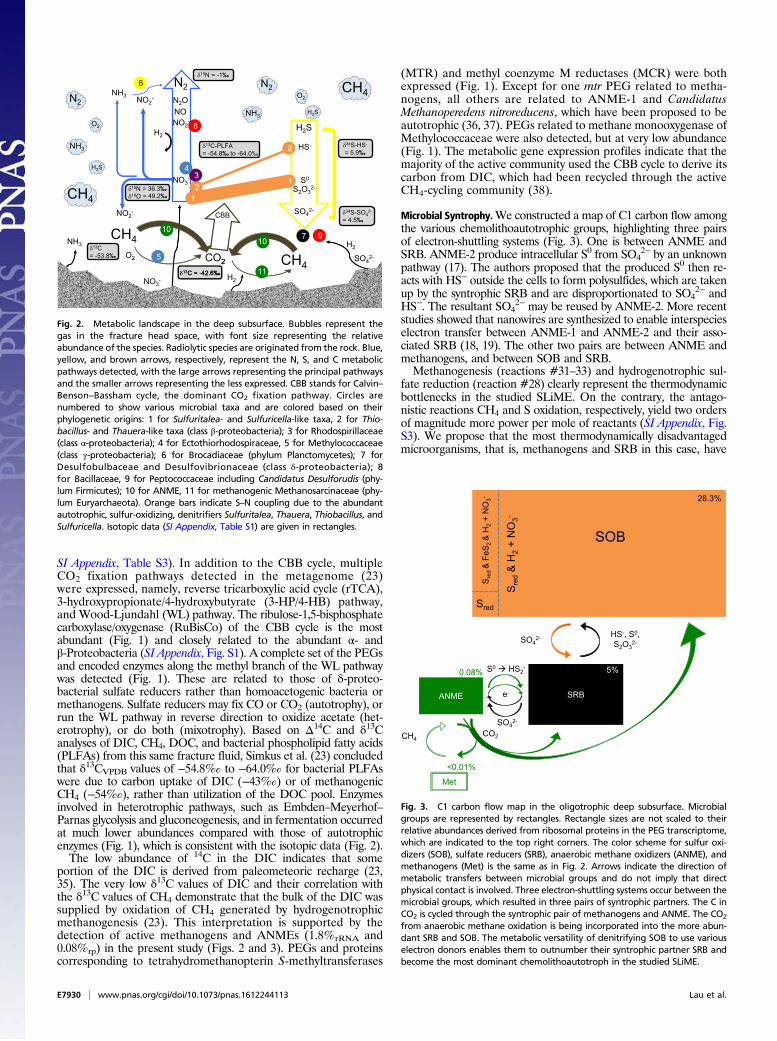
portion of the DIC is derived from paleometeoric recharge (23,35). The very low δ13C values of DIC and their correlation withthe δ13C values of CH4 demonstrate that the bulk of the DIC wassupplied by oxidation of CH4 generated by hydrogenotrophicmethanogenesis (23). This interpretation is supported by thedetection of active methanogens and ANMEs (1.8%rRNA and0.08%rp) in the present study (Figs. 2 and 3). PEGs and proteinscorresponding to tetrahydromethanopterin S-methyltransferases
(MTR) and methyl coenzyme M reductases (MCR) were bothexpressed (Fig. 1). Except for one mtr PEG related to metha-nogens, all others are related to ANME-1 and CandidatusMethanoperedens nitroreducens, which have been proposed to beautotrophic (36, 37). PEGs related to methane monooxygenase ofMethylococcaceae were also detected, but at very low abundance(Fig. 1). The metabolic gene expression profiles indicate that themajority of the active community used the CBB cycle to derive itscarbon from DIC, which had been recycled through the activeCH4-cycling community (38).
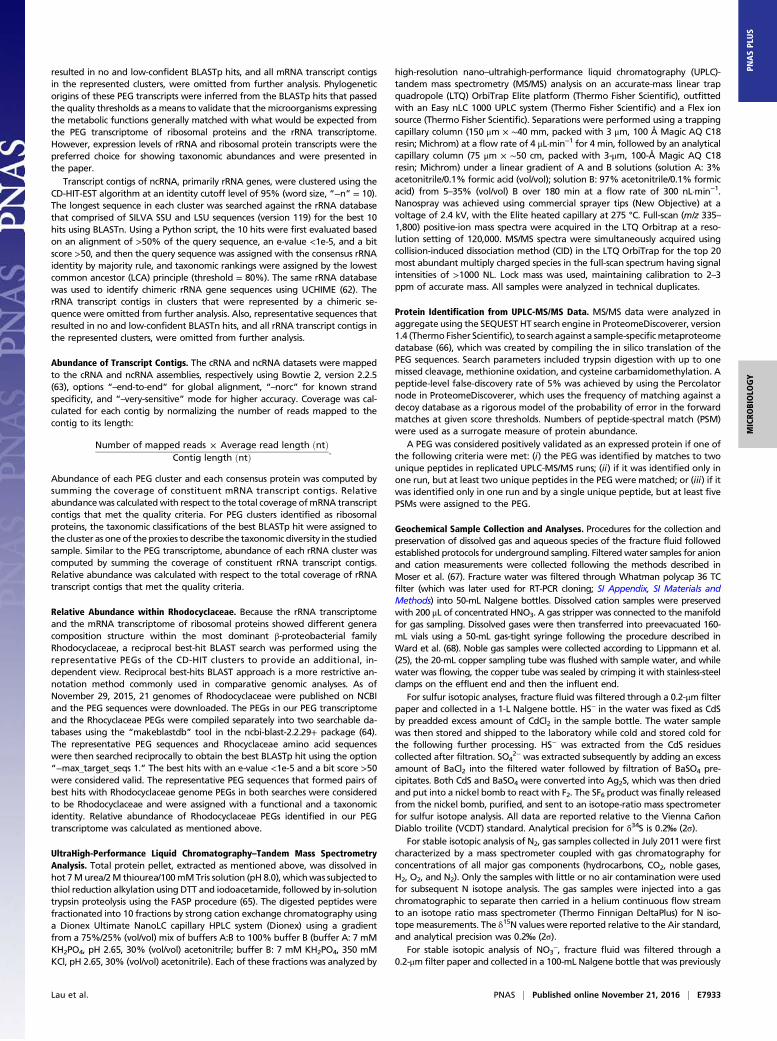
Microbial Syntrophy.We constructed a map of C1 carbon flow amongthe various chemolithoautotrophic groups, highlighting three pairsof electron-shuttling systems (Fig. 3). One is between ANME andSRB. ANME-2 produce intracellular S0 from SO4
2− by an unknownpathway (17). The authors proposed that the produced S0 then re-acts with HS− outside the cells to form polysulfides, which are takenup by the syntrophic SRB and are disproportionated to SO4
2− andHS−. The resultant SO4
2− may be reused by ANME-2. More recentstudies showed that nanowires are synthesized to enable interspecieselectron transfer between ANME-1 and ANME-2 and their asso-ciated SRB (18, 19). The other two pairs are between ANME andmethanogens, and between SOB and SRB.Methanogenesis (reactions #31–33) and hydrogenotrophic sul-
fate reduction (reaction #28) clearly represent the thermodynamicbottlenecks in the studied SLiME. On the contrary, the antago-nistic reactions CH4 and S oxidation, respectively, yield two ordersof magnitude more power per mole of reactants (SI Appendix, Fig.S3). We propose that the most thermodynamically disadvantagedmicroorganisms, that is, methanogens and SRB in this case, have
13C = -42.6‰
6
CH4
CO2
NH3
O2
NO3-
N2
15N = 36.3‰18O = 49.2‰
NO2-
SO42-
H2S
HS-
S2O32-
S0
NO2-
13C = -42.6‰
22 SO42-
NO3-
NH3
H2
H2
34S-SO42-
= 4.5‰
34S-HS-
= 5.9‰
13C = -53.8‰
NON2O
NO2-
CH4
H2
CBB
15N = -1‰
2 3
7 9
4
5
1
1
11
13C-PLFA = -54.8‰ to -64.0‰
8
10 10
H2S
N2
NH3
O2 CH4
H2S
N2
NH3
O2
CH4
Fig. 2. Metabolic landscape in the deep subsurface. Bubbles represent thegas in the fracture head space, with font size representing the relativeabundance of the species. Radiolytic species are originated from the rock. Blue,yellow, and brown arrows, respectively, represent the N, S, and C metabolicpathways detected, with the large arrows representing the principal pathwaysand the smaller arrows representing the less expressed. CBB stands for Calvin–Benson–Bassham cycle, the dominant CO2 fixation pathway. Circles arenumbered to show various microbial taxa and are colored based on theirphylogenetic origins: 1 for Sulfuritalea- and Sulfuricella-like taxa, 2 for Thio-bacillus- and Thauera-like taxa (class β-proteobacteria); 3 for Rhodospirillaceae(class α-proteobacteria); 4 for Ectothiorhodospiraceae, 5 for Methylococcaceae(class γ-proteobacteria); 6 for Brocadiaceae (phylum Planctomycetes); 7 forDesulfobulbaceae and Desulfovibrionaceae (class δ-proteobacteria); 8for Bacillaceae, 9 for Peptococcaceae including Candidatus Desulforudis (phy-lum Firmicutes); 10 for ANME, 11 for methanogenic Methanosarcinaceae (phy-lum Euryarchaeota). Orange bars indicate S–N coupling due to the abundantautotrophic, sulfur-oxidizing, denitrifiers Sulfuritalea, Thauera, Thiobacillus, andSulfuricella. Isotopic data (SI Appendix, Table S1) are given in rectangles.
28.3%
ANME
0.08%
SRB
5%
HS-, S0, S2O3
2- SO42-
CH4 CO2
Met
<0.01%
Sre
d & H
2 + N
O3-
Sred
Sre
d &
FeS
2 &
H2 +
NO
3-
SOB
e-
SO42-
S0 HS2-
Fig. 3. C1 carbon flow map in the oligotrophic deep subsurface. Microbialgroups are represented by rectangles. Rectangle sizes are not scaled to theirrelative abundances derived from ribosomal proteins in the PEG transcriptome,which are indicated to the top right corners. The color scheme for sulfur oxi-dizers (SOB), sulfate reducers (SRB), anaerobic methane oxidizers (ANME), andmethanogens (Met) is the same as in Fig. 2. Arrows indicate the direction ofmetabolic transfers between microbial groups and do not imply that directphysical contact is involved. Three electron-shuttling systems occur between themicrobial groups, which resulted in three pairs of syntrophic partners. The C inCO2 is cycled through the syntrophic pair of methanogens and ANME. The CO2
from anaerobic methane oxidation is being incorporated into the more abun-dant SRB and SOB. The metabolic versatility of denitrifying SOB to use variouselectron donors enables them to outnumber their syntrophic partner SRB andbecome the most dominant chemolithoautotroph in the studied SLiME.
E7930 | www.pnas.org/cgi/doi/10.1073/pnas.1612244113 Lau et al.
the need to develop a metabolically closely coupled relationshipwith syntrophic partners. As a result of such partnerships, thethermodynamically difficult reactions, namely, methanogenesis andhydrogenotrophic sulfate reduction, by methanogens and SRB,respectively, can be pulled forward upon the demand of ANMEand SOB, respectively. As a result, the fitness of methanogens andSRB should increase. Recycling of metabolic products betweensyntrophic partners should enable them to maintain their metabolicactivities, further resulting in increasing population size over time.Population growth should further strengthen the metabolic ex-changes, especially when syntrophic partners are in close physicalproximity and/or directly connected (18, 19, 39). This positive re-lationship between fitness and population size is referred as apositive Allee effect (40, 41). Microbial syntrophy is potentially aninfluential attribute to a subsurface ecosystem’s stability and com-munity dynamics, which has not been previously recognized. Here,we discuss the probable syntrophic interactions in each of the pairsof microbial groups that recycle CH4 and S.The millimolar level of methanogenic CH4 is ample to support
growth of ANME and to permit its metabolic independence ofANME from methanogens. However, ANMEs do not thrive butremain as a minority population in the total RNA (SI Appendix,Fig. S1), even though CH4 oxidation by NO3
− and SO42− are
among the most thermodynamically highly favored reactions (SIAppendix, Fig. S3). Between the two electron acceptors NO3
−
and SO42− that are being used by ANMEs, NO3
− appears to belimiting, whereas SO4
2− is more readily available. To explain thelow abundance of ANME, we consider that ANME is syn-trophically coupled with methanogens. Although the demand ofANME for CH4 drives methanogenesis forward and thus main-tains the methanogenic population, the ANME’s population isindirectly controlled by methanogenic activity of methanogens.It is less straightforward to deduce the syntrophic partnership
between SOB and SRB because reduced S species and SO42− may
come from nonlocal and/or nonmicrobially mediated processes;consequently, SOB and SRB could live independently. Thiobacillusdenitrificans is the only species known to obtain S directly frompyrite nanoparticles, but not from large crystals of pyrite (42) suchas those found in the Witwatersrand Supergroup (43). The rela-tively small population of Thiobacillus (3.3%rp) is more likely toobtain its S from nanoparticles of pyrite generated by SRB as hasbeen shown to be occurring in anaerobic biofilms of South Africaboreholes that contain both SRB and SOB (44, 45). If the reducedS species came from other mechanisms, for example, as interme-diates produced during radiolytic oxidation of pyrite, or from otherunidentified sources, then these alternative inputs would have tooccur at a rate low enough that no excess HS− concentration isobserved, as evidenced by the low level of measured HS− (SIAppendix, Table S1). The capacity for SOB to couple with SRBtherefore has an obvious ecophysiological advantage over for-aging the reduced S species from the environment. In exchange,proactive removal of HS− products from sulfate reduction pullsthe reaction in the forward direction.HS− produced by SRB may react with Fe(II) ions to form
nanoparticle FeS or pyrite and these could either be oxidized byThiobacillus, as discussed, or be radiolytically oxidized to SO4
2−,suggesting that SRB could live independently from SOB in thelatter case. S oxidation catalyzed by SOB is, however, more effi-cient than the chemical process. Hence, the dependence of SRB onSOB for the removal of their HS− products and the regeneration ofSO4
2− should enhance the metabolic conditions for SRB.Interestingly, the C1 carbon flow map also showed that one
member of the syntrophic partners is more abundant than theother (SOB > SRB; SRB > ANME; ANME >methanogens) (Fig.3). As a matter of fact, the C in CO2 that has gone through theCO2–CH4 cycle by the syntrophic pair of methanogens andANMEs (“trophic 1”) is being incorporated into the more abun-dant SRB and SOB (“trophic 2”), which emerged as an “invertedbiomass pyramid” that is composed of exclusively autotrophs. In atypical food chain (e.g., a large fish feeds on a medium fish, whichin turn feeds on a small fish), carbon and energy are derived from
the same organic compounds, with less than 10% of the energy beingused to generate new biomass and the remaining being dissipatedas heat. The consumers are therefore not expected to outnumberthe producers or the prey, except during the occurrence of invertedbiomass pyramids in oligotrophic lakes due to the fast turnover rateof primary producers, allochthonous DOC inputs, or the presenceof refugia (40, 46, 47). On the contrary, as chemoautotrophs derivecarbon and energy from different substrates, the CO2 leaked fromthe CH4 cycle becomes available for the greater productivity ofSRB and SOB, whereby the carbon fixation process has no directchemical coupling with the redox reactions. Due to the decouplingof energy and carbon acquisition, differential population sizes be-tween the syntrophic partners and the apparent inverted biomasspyramid would be determined by the relative difference in theamounts of electron donors and acceptors available to variousmicrobial groups. To test this hypothesis, we examined the bioen-ergetics of SOB and SRB based on the aqueous chemistry of thesample. Population dynamics of SOB and SRB were modeled overa 35-ky period to reproduce the observed geochemistry. All modelswere constrained by measured growth yields and kinetics of culti-vated bacterial strains (Materials and Methods).The model results showed that the autotrophic SRB are con-
sistently less abundant than the SOB (SI Appendix, Fig. S4), whichis consistent with the metatranscriptomic and metaproteomic re-sults discussed above. Thermodynamic calculations also indicatedthat the sulfur–oxidation/nitrate–respiration coupling is energeti-cally more productive than hydrogenotrophic sulfate reduction(reaction #28 in SI Appendix, Fig. S3). Decreasing the NO3
− fluxreduces the cell concentration of denitrifying SOB to a lower level(SI Appendix, Fig. S4 A and B). In hydrothermal vents, thermo-dynamic modeling suggested that H2 and S oxidation contributed20% and 80%, respectively, of the energy budget in the ubiqui-tously distributed SOB SUP05 (48). Because SOB Sulfuritaleahydrogenivorans has been demonstrated to oxidize H2 (30), evi-dence of SOB expressing hydrogenase was sought. Among thehydrogenase-encoding transcripts detected, about 47% are relatedto Sulfuritalea hydrogenivorans. Metabolic versatility could thuscontribute to the dominance of SOB in the studied system.The addition of H2 oxidation reactions to the thermodynamic
models of SOB and SRB, however, caused the SRB population todecline (SI Appendix, Fig. S5), likely due to competition for H2. Thisprediction implies that the SRB could have been outcompeted andeventually eliminated from the community, which did not happen,as indicated by the detection of SRB and their expression of sulfate-reducing genes and enzymes. Although the underlying mechanismthat has prevented SRB from elimination by H2 competition is notclear at this moment; possible explanations are discussed here. Assome portions of hydrogenases and sulfur-oxidizing enzymes werecoexpressed within SOB denitrifiers, their intracellular regulatory sys-tems would control in part the amount and rate of H2 being takenfrom the environment. Recently, the aerobic SOB Thiomicrospirasp. strain SP-41 isolated from low-temperature hydrothermal fluidsshowed that co-oxidation of millimolar S2O3
2− and micromolar H2yielded 10 times more cells than the micromolar H2-only experi-ment did, although the H2 consumption rate was four times lower inthe S2O3
2−/H2 experiment (49). However, no empirical data onthe relative contribution of H2 and S oxidation to the energy budgetin SOB denitrifiers are available to constrain the model, which cur-rently treated H2 and S oxidation coupled to NO3
− reduction as twoindependent reactions. As the H2 consumption rates by aerobic SOBvary under different conditions, the idea of H2 uptake by SOBdenitrifiers being a negative feedback in this syntrophic relationshipis plausible but it needs to be tested. Another possibility is thatH2-utilizing microorganisms may be spatially separated (on a not-yet-known scale) to reduce the competition, which then suggeststhat the H2-oxidizing SOB individuals may be physically distantfrom SRB. Additional experiments will be required to resolve thefactors influencing syntrophy and competition (or the “love-and-hate relationship”) between these SOB and SRB.Under the oligotrophic conditions that SLiMEs occur, their
community structure will likely change in response to changes in
Lau et al. PNAS | Published online November 21, 2016 | E7931
MICRO
BIOLO
GY
PNASPL
US
nutrient availability and environmental conditions. Consequently,the relative abundance of the syntrophic partners may shift and theapparent inverted biomass pyramid may become upright. The spatialand temporal scales over which syntrophic SLiMEs migrate andevolve require further investigation because these two processesultimately control the distribution of SLiMEs in the deep subsurface.
Concluding RemarkThe approach described in this study provides a comprehensiveportrait of the active metabolic landscape of a SLiME enabled bysyntrophic metabolic interactions. The fluxes of energy sources andthe capability of using multiple electron donors explain the oc-currence of an apparent inverted biomass pyramid of chemo-lithoautotrophs at the deep subsurface. Unlike previously describeddeep subsurface ecosystems, H2-driven autotrophic processes(sulfate reduction, methanogenesis, and subsequent anaerobic CH4oxidation) are not the dominant metabolisms but instead supportthe predominant sulfur-driven denitrification. The metabolic ca-pability of the predominant sulfur-driven autotrophic denitrifiersdrives the links between the N, S, and C cycles. Previous studieshave reported the high energetic potential of S–N reactions inother deep continental sites (50), and expression of mRNA codingfor nitrate reductase in marine subseafloor sediment cores whereNO3
− was not detectable (51), indicating that the role of nitratereduction and/or denitrification in the deep subsurface has beenoverlooked. Active subsurface metabolic landscapes that inter-twine H2-driven processes, S–N coupling, and dissimilatory NO3-dependent reactions may be more prevalent in both continentaland marine subsurface systems than previously thought. This studyexpands the range of metabolic landscapes, which should be con-sidered when exploring the potential of extinct and extant lifeelsewhere in the solar system on terrestrial planets and moons.
Materials and MethodsMicrobial Biomass Collection. The RNA and protein samples used in this studywere coextracted with DNA from the filter, BE326FW270712 Bh2. The detaileddescription of the study site (BE326 BH2), sample collection, and extraction pro-tocol of this sample has beenpublished in Lau et al. (21) andMagnabosco et al. (8).Briefly, fracture fluid at 1.34 km below land surface was filtered onsite at Beatrixgold mine shaft no. 3, level 26, which is situated at southwest of the 2.9-GaWitwatersrand Basin (quartzite and shale), using a sterile stainless-steel manifoldthat was installed onto the stainless-steel borehole casing. Approximately 86,400 Lof water was filtered over 15 d, at an initial water flow rate set at 4 L·min−1.Biomass captured on the preautoclaved Memtrex NY filter (MNY-91-1-AAS; poresize of 0.1 μm; General Electric) was preserved in RNA-preservation solution[20mMEDTA, 0.3M sodium citrate, and 4.3M ammonium sulfate; pH adjusted to5.2 using concentrated H2SO4 (21)] and stored at −20 °C until extraction.
RNA and Protein Extraction. Total RNA and protein, together with total DNA,were extracted using 2× CTAB lysis buffer and phenol/chloroform (pH 6.5–6.9).Total RNAwas resuspended in 1× TE-buffer (Tris-EDTA, pH 8) and stored in 1.5-mLEppendorf tubes at−20 °C (21). To reduce RNA degradation during the extractionprocess, all extraction tubes were kept on ice between steps. An aliquot of thenucleic acid sample was treated with DNase I (catalog #AMPD1; Sigma-Aldrich)following the manufacturer’s instructions, which included a 15-min incubation atroom temperature and an inactivation step at 70 °C for 10 min. PCR amplificationof the treated RNA yielded no PCR products after 35 cycles, indicating the samplewas DNA-free.
Total protein was purified from the organic fraction by standard methanol/acetone purification. In brief, debris at the interface layer was removed beforeadding five volumes of chilled methanol and ammonium acetate (100 mM finalconcentration). The mixture was incubated overnight at −20 °C. Protein waspelleted at 17,000 × g for 20 min with supernatant discarded afterward. Proteinpellets were washed with chilled HPLC-grade methanol and collected by cen-trifugation at 17,000 × g for 10 min. Methanol was discarded. The wash stepfinished with two additional rounds of HPLC-grade acetone. The protein pelletswere air-dried for 5–10 min and stored in 1.5-mL Eppendorf tubes at −20 °C.
Directional RNA-Sequencing. Before sequencing, the total RNA sample wasanalyzed on the Agilent 2100 BioAnalyzer system using RNA 6000 Nano kit. Thesize distribution plot showed that the sample quality was good for RNA se-quencing for the following reasons: fragments as long as ∼3,000 bp (the size ofintact large subunit of rRNA gene) were present, fragment intensity peaked at
size of ∼750 bp, and a visible, discrete peak at ∼1,500 bp, which is indicative ofintact small subunit of rRNA genes. The high-quality RNA was treated usingRNase III (0.5 mM final concentration) and resulted in a majority of 500-bp-longfragments. The RNA products from the controlled fragmentation step were usedto prepare the strand-specific metatranscriptomic library, following the manu-facturer’s instruction of Apollo 324 PrepX mRNA library protocol (IntegenX),which is based on directional RNA adaptor ligation. Library concentration wasquantified on Agilent 2100 BioAnalyzer DNA HS chip using Qubit DNA HS assay(Life Technologies). The library of this sample was pooled in equal molar ratiowith three others. Absolute quantitative PCR assay using SYBR FAST ABI PrismQPCR Mast Mix (Kapa Bio Systems) was performed to confirm amplification ef-ficiency and to determine the library loading concentration for sequencing. Se-quencing of 141-nt single-end reads was performed on one lane of Illumina 2500HiSeq platform with Illumina’s Truseq Rapid SBS chemistry. This protocol gen-erated sequences that are in the same orientation as the actual transcripts.
Quality Control of RNA-Seq Data. A total of 29,980,240 single-end reads weregenerated from total RNA. The fastq data were filtered for high-quality readsusing the tools on https://galaxy.princeton.edu. The quality control (QC) was runin the following order: (i) removed reads that contain 90% of bases with Phredquality score (Q score) lower than 30 (i.e., error probability of base calling, 0.001);(ii) screened for reads that matched the first 30 bp of the 3′-end adapter se-quence (5′-AGATCGGAAGAGCACACGTCTGAACTCCAG-3′) anywhere along theread length, with search criteria set to maximum error rate of 0.1, match timesof 1, minimum overlap length of 20, allow “Ns” in the read over aligned regionasmatches, then clipped off the portion following the adapter sequence; (iii) clipfrom the 3′-end of the reads that matched with the above 30-bp adaptor se-quence and discard reads that contained Ns and that were shorter than 50 nt.The QC-run resulted in 21,577,391 reads (average read length of 123 ± 21 nt)that had an average Q score higher than 30 at each nucleotide position.
De Novo Metatranscriptome Assembly. The high-quality RNA reads were or-ganized into two subsets, protein-codingRNA (cRNA) sequences andnoncodingRNA (ncRNA) sequences. First, all high-quality RNA reads were searched againstfour databases using USEARCH (52). The four databases (DBs) were transferRNA DB (53, 54) (872,667 sequences), 5S rRNA DB (55) (last updated in Sep-tember 2005; 1,379 sequences), small and large rRNA DBs (56) (version 119.1;4,346,329 sequences in SSUParc_tax_silva.fasta.gz and 446,998 sequences inLSUParc_tax_silva.fasta.gz). Then, RNA reads were assigned into the ncRNAsubset when they shared at least 80% of identity in global alignment with anyof references in the four DBs, regardless of the orientation. The options usedwere “−usearch_global,” “−uid 0.8,” “−strand both,” and “−threads” formultithreading. The remaining RNA reads were assigned into the cRNA subset.RNA reads were parsed into cRNA and ncRNA subsets, containing 1,498,563(7%) and 20,078,828 (93%) reads, respectively, by a Python script.
The cRNA and ncRNA subsets were assembled separately using de Bruijngraph-based de novo transcriptomic assemblers. The “strand-specific” optionwas indicated in the execution commands. Transcript contigs in the final as-semblies have minimum length of 200 nt. The cRNA subset was assembled usingTrinity (57), version r20131110, with the default settings, whereas the ncRNAsubset was assembled using Trans-ABySS (58) (version 1.5.2). To run Trans-ABySS, contigs were first constructed from 61 to 101 k-mers, with an in-cremental step of 4 mers, as separate assemblies using ABySS (version 1.5.2)(59). These assemblies were then merged by Trans-ABySS.
Annotation of Transcript Contigs. Transcript contigs were clustered using theCD-HIT package, version 4.6.4 (60). ThemRNA transcript contigs generated fromthe cRNA assembly were first subjected to gene prediction. Prodigal, version2.6.1 (61), was used to identify open reading frames using the option “−p” formetagenome and translation table 11. Because the orientation of our RNA-seqreads was known and all of the transcript contigs ran in the sense direction, anypredictions made for the antisense orientation were discarded. A Python scriptwas used to extract the amino acid sequences translated from the sense strands.The protein-encoding genes (PEGs) generated from the mRNA transcript con-tigs were clustered using the CD-HIT algorithm. Peptides were clustered at 90%of identity (word size, “−n” = 5) in local alignment (“−G” = 0), using a slowmode (“−g” = 1) such that the query sequence would be clustered into themost similar cluster that meet the threshold of 80% of the shorter sequencewas aligned (“−aS” = 0.8). The longest sequence in each cluster was searchedagainst the National Center for Biotechnology Information (NCBI) non-redundant protein (nr) database for the best ten hits using BLASTp. Using aPython script, the 10 hits were first evaluated based on an alignment of >50%of the query sequence, an e-value <1e-5, and a bit score >50, and then thequery sequence was assigned with the consensus protein identity by majorityrule based on the description of each NCBI entry. Representative sequences that
E7932 | www.pnas.org/cgi/doi/10.1073/pnas.1612244113 Lau et al.
resulted in no and low-confident BLASTp hits, and all mRNA transcript contigsin the represented clusters, were omitted from further analysis. Phylogeneticorigins of these PEG transcripts were inferred from the BLASTp hits that passedthe quality thresholds as a means to validate that themicroorganisms expressingthe metabolic functions generally matched with what would be expected fromthe PEG transcriptome of ribosomal proteins and the rRNA transcriptome.However, expression levels of rRNA and ribosomal protein transcripts were thepreferred choice for showing taxonomic abundances and were presented inthe paper.
Transcript contigs of ncRNA, primarily rRNA genes, were clustered using theCD-HIT-EST algorithm at an identity cutoff level of 95% (word size, “−n” = 10).The longest sequence in each cluster was searched against the rRNA databasethat comprised of SILVA SSU and LSU sequences (version 119) for the best 10hits using BLASTn. Using a Python script, the 10 hits were first evaluated basedon an alignment of >50% of the query sequence, an e-value <1e-5, and a bitscore >50, and then the query sequence was assigned with the consensus rRNAidentity by majority rule, and taxonomic rankings were assigned by the lowestcommon ancestor (LCA) principle (threshold = 80%). The same rRNA databasewas used to identify chimeric rRNA gene sequences using UCHIME (62). TherRNA transcript contigs in clusters that were represented by a chimeric se-quence were omitted from further analysis. Also, representative sequences thatresulted in no and low-confident BLASTn hits, and all rRNA transcript contigs inthe represented clusters, were omitted from further analysis.
Abundance of Transcript Contigs. The cRNA and ncRNA datasets were mappedto the cRNA and ncRNA assemblies, respectively using Bowtie 2, version 2.2.5(63), options “–end-to-end” for global alignment, “–norc” for known strandspecificity, and “–very-sensitive” mode for higher accuracy. Coverage was cal-culated for each contig by normalizing the number of reads mapped to thecontig to its length:
Number of mapped reads × Average read length ðntÞContig length ðntÞ .
Abundance of each PEG cluster and each consensus protein was computed bysumming the coverage of constituent mRNA transcript contigs. Relativeabundancewas calculatedwith respect to the total coverage ofmRNA transcriptcontigs that met the quality criteria. For PEG clusters identified as ribosomalproteins, the taxonomic classifications of the best BLASTp hit were assigned tothe cluster as oneof the proxies to describe the taxonomic diversity in the studiedsample. Similar to the PEG transcriptome, abundance of each rRNA cluster wascomputed by summing the coverage of constituent rRNA transcript contigs.Relative abundance was calculated with respect to the total coverage of rRNAtranscript contigs that met the quality criteria.
Relative Abundance within Rhodocyclaceae. Because the rRNA transcriptomeand the mRNA transcriptome of ribosomal proteins showed different generacomposition structure within the most dominant β-proteobacterial familyRhodocyclaceae, a reciprocal best-hit BLAST search was performed using therepresentative PEGs of the CD-HIT clusters to provide an additional, in-dependent view. Reciprocal best-hits BLAST approach is a more restrictive an-notation method commonly used in comparative genomic analyses. As ofNovember 29, 2015, 21 genomes of Rhodocyclaceae were published on NCBIand the PEG sequences were downloaded. The PEGs in our PEG transcriptomeand the Rhocyclaceae PEGs were compiled separately into two searchable da-tabases using the “makeblastdb” tool in the ncbi-blast-2.2.29+ package (64).The representative PEG sequences and Rhocyclaceae amino acid sequenceswere then searched reciprocally to obtain the best BLASTp hit using the option“−max_target_seqs 1.” The best hits with an e-value <1e-5 and a bit score >50were considered valid. The representative PEG sequences that formed pairs ofbest hits with Rhodocyclaceae genome PEGs in both searches were consideredto be Rhodocyclaceae and were assigned with a functional and a taxonomicidentity. Relative abundance of Rhodocyclaceae PEGs identified in our PEGtranscriptome was calculated as mentioned above.
UltraHigh-Performance Liquid Chromatography–Tandem Mass SpectrometryAnalysis. Total protein pellet, extracted as mentioned above, was dissolved inhot 7Murea/2M thiourea/100mMTris solution (pH 8.0), whichwas subjected tothiol reduction alkylation using DTT and iodoacetamide, followed by in-solutiontrypsin proteolysis using the FASP procedure (65). The digested peptides werefractionated into 10 fractions by strong cation exchange chromatography usinga Dionex Ultimate NanoLC capillary HPLC system (Dionex) using a gradientfrom a 75%/25% (vol/vol) mix of buffers A:B to 100% buffer B (buffer A: 7 mMKH2PO4, pH 2.65, 30% (vol/vol) acetonitrile; buffer B: 7 mM KH2PO4, 350 mMKCl, pH 2.65, 30% (vol/vol) acetonitrile). Each of these fractions was analyzed by
high-resolution nano–ultrahigh-performance liquid chromatography (UPLC)-tandem mass spectrometry (MS/MS) analysis on an accurate-mass linear trapquadropole (LTQ) OrbiTrap Elite platform (Thermo Fisher Scientific), outfittedwith an Easy nLC 1000 UPLC system (Thermo Fisher Scientific) and a Flex ionsource (Thermo Fisher Scientific). Separations were performed using a trappingcapillary column (150 μm × ∼40 mm, packed with 3 μm, 100 Å Magic AQ C18resin; Michrom) at a flow rate of 4 μL·min−1 for 4 min, followed by an analyticalcapillary column (75 μm × ∼50 cm, packed with 3-μm, 100-Å Magic AQ C18resin; Michrom) under a linear gradient of A and B solutions (solution A: 3%acetonitrile/0.1% formic acid (vol/vol); solution B: 97% acetonitrile/0.1% formicacid) from 5–35% (vol/vol) B over 180 min at a flow rate of 300 nL·min−1.Nanospray was achieved using commercial sprayer tips (New Objective) at avoltage of 2.4 kV, with the Elite heated capillary at 275 °C. Full-scan (m/z 335–1,800) positive-ion mass spectra were acquired in the LTQ Orbitrap at a reso-lution setting of 120,000. MS/MS spectra were simultaneously acquired usingcollision-induced dissociation method (CID) in the LTQ OrbiTrap for the top 20most abundant multiply charged species in the full-scan spectrum having signalintensities of >1000 NL. Lock mass was used, maintaining calibration to 2–3ppm of accurate mass. All samples were analyzed in technical duplicates.
Protein Identification from UPLC-MS/MS Data. MS/MS data were analyzed inaggregate using the SEQUEST HT search engine in ProteomeDiscoverer, version1.4 (ThermoFisher Scientific), to search against a sample-specificmetaproteomedatabase (66), which was created by compiling the in silico translation of thePEG sequences. Search parameters included trypsin digestion with up to onemissed cleavage, methionine oxidation, and cysteine carbamidomethylation. Apeptide-level false-discovery rate of 5% was achieved by using the Percolatornode in ProteomeDiscoverer, which uses the frequency of matching against adecoy database as a rigorous model of the probability of error in the forwardmatches at given score thresholds. Numbers of peptide-spectral match (PSM)were used as a surrogate measure of protein abundance.
A PEG was considered positively validated as an expressed protein if one ofthe following criteria were met: (i) the PEG was identified by matches to twounique peptides in replicated UPLC-MS/MS runs; (ii) if it was identified only inone run, but at least two unique peptides in the PEG were matched; or (iii) if itwas identified only in one run and by a single unique peptide, but at least fivePSMs were assigned to the PEG.
Geochemical Sample Collection and Analyses. Procedures for the collection andpreservation of dissolved gas and aqueous species of the fracture fluid followedestablished protocols for underground sampling. Filteredwater samples for anionand cation measurements were collected following the methods described inMoser et al. (67). Fracture water was filtered through Whatman polycap 36 TCfilter (which was later used for RT-PCR cloning; SI Appendix, SI Materials andMethods) into 50-mL Nalgene bottles. Dissolved cation samples were preservedwith 200 μL of concentrated HNO3. A gas stripper was connected to the manifoldfor gas sampling. Dissolved gases were then transferred into preevacuated 160-mL vials using a 50-mL gas-tight syringe following the procedure described inWard et al. (68). Noble gas samples were collected according to Lippmann et al.(25), the 20-mL copper sampling tube was flushed with sample water, and whilewater was flowing, the copper tube was sealed by crimping it with stainless-steelclamps on the effluent end and then the influent end.
For sulfur isotopic analyses, fracture fluid was filtered through a 0.2-μm filterpaper and collected in a 1-L Nalgene bottle. HS− in the water was fixed as CdSby preadded excess amount of CdCl2 in the sample bottle. The water samplewas then stored and shipped to the laboratory while cold and stored cold forthe following further processing. HS− was extracted from the CdS residuescollected after filtration. SO4
2− was extracted subsequently by adding an excessamount of BaCl2 into the filtered water followed by filtration of BaSO4 pre-cipitates. Both CdS and BaSO4 were converted into Ag2S, which was then driedand put into a nickel bomb to react with F2. The SF6 product was finally releasedfrom the nickel bomb, purified, and sent to an isotope-ratio mass spectrometerfor sulfur isotope analysis. All data are reported relative to the Vienna CañonDiablo troilite (VCDT) standard. Analytical precision for δ34S is 0.2‰ (2σ).
For stable isotopic analysis of N2, gas samples collected in July 2011 were firstcharacterized by a mass spectrometer coupled with gas chromatography forconcentrations of all major gas components (hydrocarbons, CO2, noble gases,H2, O2, and N2). Only the samples with little or no air contamination were usedfor subsequent N isotope analysis. The gas samples were injected into a gaschromatographic to separate then carried in a helium continuous flow streamto an isotope ratio mass spectrometer (Thermo Finnigan DeltaPlus) for N iso-tope measurements. The δ15N values were reported relative to the Air standard,and analytical precision was 0.2‰ (2σ).
For stable isotopic analysis of NO3−, fracture fluid was filtered through a
0.2-μm filter paper and collected in a 100-mL Nalgene bottle that was previously
Lau et al. PNAS | Published online November 21, 2016 | E7933
MICRO
BIOLO
GY
PNASPL
US
rinsed with 10% (vol/vol) HCl and MilliQ water. The water sample was kept in acooler of reusable ice packs immediately upon reaching the surface and duringtransport, and stored at −20 °C until processing. The δ15N and δ18O of NO3
−
were measured by the “denitrifier method” (69, 70), wherein a denitrifyingbacterial strain lacking nitrous-oxide reductase quantitatively converts sampleNO3
− and NO2− to N2O. The isotopic composition of N2O was measured by GC-
IRMS using a Thermo MAT253 mass spectrometer (Thermo Finnigan DeltaPlus)and a purpose-built on-line N2O extraction and purification system. The in-ternational reference materials, IAEA-N3 and USGS-34, were used for calibra-tion to the air N2 and Vienna standard mean ocean water (VSMOW) scales. Anin-house N2O standard was run in parallel to monitor mass spectrometry. An-alytical precision for the system used has been characterized as ≤0.1‰ for δ15Nand ≤0.2‰ for δ18O (2σ) for the NO3
− concentration analyzed here. BecauseNO2
− is included in the isotopic analysis (70), before isotopic analysis, NO2− was
removed by a sulfamic acid protocol described in Granger and Sigman (71).Measurements were made in three technical replicates. Due to an unidentifiedproblem of N2O conversion in the 2012 sample, isotopic values of NO2
−-re-moved sample collected in 2011 were reported.
The concentrations of the atmospheric noble gas isotopes (72) (36Ar, 84Kr,86Kr, and 129Xe) are a fraction of those for groundwater in equilibrium withthe atmosphere at the mean annual temperature for central South Africa. Thisindicates that the fracture water has lost some of its dissolved gas, presumablyto the head space of the fractures during dewatering of the fractures by themining operations. We used the diffusion model of Lippmann et al. (25) andthe concentrations of 36Ar, 84Kr, 86Kr, and 129Xe to correct the concentrationsof all of the noble gases as well as the concentrations of dissolved gases, H2,O2, N2, N2O, CH4, CO, NH3, and H2S. The diffusion coefficients compiled byCussler (73) was used, and for the diffusion coefficient of N2O the experi-mental data of Tamimi et al. (74) was used.
Calculation of Subsurface Residence Times. The subsurface residence times forthe bulk water were calculated from the diffusion-corrected concentrations of40Ar, 134Xe, and 136Xe [determined by Purtschert et al. (72)] using the fluxmodel equations and parameters of Lippmann et al. (25). The age estimatesrange from 3 to 14 my, consistent with previous analyses of subsurface frac-ture water reported by Lippmann et al. (25).
Calculation of Free Energy Fluxes. Steady-state free energy fluxes of 37 energy-yielding redox reactions for autotrophy, heterotrophy, methanotrophy, andmethanogenesis were estimated as described in Onstott (75) and Magnaboscoet al. (4). The Gibbs free energy of each reaction was calculated using themeasured cation, anion, and dissolved gas concentrations (SI Appendix, TableS1) and The Geochemist’s Workbench (GWB), version 8.0 (76) (Rockware). Thefree energy flux was calculated using the following equation from Onstott (75):
Free Energy Flux �kJ · cell−1 · s−1
�= 4πrDCΔG, [1]
where r is the average radius of a cell (in centimeters) and assumed to be7.5 × 10−5 cm, D is the diffusion constant (in square centimeters per sec-ond) of the limiting reactant corrected for the in situ temperature, C is theconcentration of the limiting reactant (in moles per cubic centimeter), andΔG is the in situ Gibbs free energy per mole of the limiting reactant (inkilojoules per mole).
This expression assumes that the measured concentrations represent asteady-state dynamic equilibrium of a planktonic microorganism.
For microbial redox reactions that involve sessile microorganisms that arebound to a mineral surface and are using a mineral phase [for example, FeS2,Fe(OH)3, and pyrolusite] as electron acceptor, the effective diffusion constant(Deff) of the electron donor was adjusted according to the following equation:
Deff =Dϕ · δτ2
, [2]
where ϕ is porosity of the hard mineral phase, δ is constrictivity, and τ istortuosity. For the purpose of this study, the porosity of the WitwatersrandBasin rock units was assumed to be 0.005 (29), δ = 1, and τ = 3 (77).
For the reactions containing gaseous species, the Gibbs free energy andthe free energy flux were calculated for both the measured concentrationsand for the diffusion-corrected gas concentrations. The difference in theGibbs free energy for the measured concentrations and the diffusion-corrected gas concentrations was the greatest for those reactions using H2
and NH3. H2 has the highest diffusion rate of all gas species and as a resultwill be the most readily depleted in a fracture where head space is present.Because the pH is elevated, NH3 is more abundant than NH4
+ and will alsopreferentially partition into any head space. For example, the Gibbs freeenergy for the reactions for autotrophic acetogenesis and methanogenesis
by CO2 reduction (#34 and #32 in SI Appendix, Fig. S3, respectively) wereboth slightly positive for the measured concentrations, but were slightlynegative for the diffusion-corrected gas concentrations. The only micro-bial reaction impacted by the loss of NH3 to the head space is theANAMMOX reaction (#10 in SI Appendix, Fig. S3).
Biogeochemical Model. GWB was used to model the mixing between an an-cient, saline endmember and young, low-salinity, rechargewater, the radiolyticgeneration of H2, O2, and H2O2 andmicrobial chemolithotrophic reactions. Thechemistry for the saline end member of the Witwatersrand Supergroup wasderived from the average of fluid inclusion extracts (29) and the young, low-salinity, recharge water was derived from the average ground water analysespublished by Abiye et al. (78). The rate of mixing of the pore water in theWitwatersrand quartzite with the meteoric recharge water until the compo-sition of the borehole BE326 Bh2 water chemistry was attained was assumedto be ∼1 My based upon the noble gas data. Given that the Cl− and NO3
−
concentrations in the saline end member are 1.5 M and 6 mM, respectively,and the Cl− concentration of the borehole BE326 Bh2 water is 65 mM, theNO3
− concentration of the borehole BE326 Bh2 water derived from simplemixing would be 300 μM. If this mixing occurred uniformly over the 1 My ofgroundwater migration, then the mixing rate for NO3
− would be ∼0.3 nM·y−1.The radiolytic production rates, based upon the average U, Th, and K
content of the Witwatersrand quartzite and measured porosities (29), are0.4 nM·y−1 for H2 and 0.2 nM·y−1 for O2. The production rate of H2O2 was0.05 nM·y−1, and it was assumed that this H2O2 reacted immediately withpyrite to generate sulfate. Based upon the stoichiometry of the reaction,FeS2 + 7.5 H2O2 → 5.5H2O + 0.5Fe2O3 + 4H+ + 2SO4
2−, this rate of H2O2
production is equivalent to a SO42− production rate of ∼0.02 nM·y−1. These
fluxes for O2, H2, SO42−, NO3
−, and NH4+ were used to sustain chemo-
lithotrophic microbial reactions.The microbial respiration rates for methanogenesis, SO4
−2 reduction, HS−
oxidation, and H2 oxidation were based upon published laboratory cultureexperiments that provided minimum free energy estimates or threshold con-centrations (ΔG), kinetic rate constants, such as Vmax, and the half-saturationMichaelis–Menten constants, Km, and growth yields when available. The fol-lowing expression was used for calculating the microbial respiration rate ofplanktonic microorganisms in the fracture water:
k=Vmax · ½X� · FD · FA · FT , [3]
where the reaction rate, k, is in moles·(kilogram of water)−1·second−1, Vmax is theintrinsic rate constant of the electron donating and accepting reactions inmoles·(milligram of biomass)−1·second−1, [X] is the concentration of cells in milli-grams of biomass·(kilogram of water)−1 (79, 80). FD is the parameter controllingthe electron-donating reaction and is defined by Eq. 4, and the electron-accepting reaction, which is controlled by the parameter, FA, is defined by Eq. 5:
FD =mD=ðmD +KDÞ, [4]
FA =mA=ðmA +KAÞ, [5]
where mD is the electron donor concentration, mA is the electron acceptorconcentration, and KD and KA are Michaelis-Menten constants in units ofmolar. The thermodynamic potential factor, FT, is defined as follows:
FT = 1− e−f=ðxRTÞ, [6]
where R is the universal gas constant 8.314 J·K−1·mol−1, T is the temperaturein Kelvin, x is the average stoichiometric number (81), or the ratio of the freeenergy change of the overall reaction to the sum of the free energy changesfor each elementary step, and f is the net thermodynamic driving force ofthe reaction defined by the following:
f =−ΔG−m ·ΔGp, [7]
where ΔG is the free energy change of the redox reaction,m is the number ofmoles of ATP generated per mole of reactant, and ΔGp is the free energy forthe phosphorylation reaction (82). The ΔGp for the phosphorylation reaction,ADP + P → ATP, can vary from about 40–70 kJ·(mol of ATP)−1 depending uponthe temperature, pH, and concentrations of ADP and ATP in the cell (83, 84)and ranges from 50 to 88 kJ·(mol of ATP)−1 if a thermodynamic efficiency of80% is assumed. However, the m·ΔGp was assumed to be 60 kJ·(mol of ATP)−1
except in the case of H2 oxidation reactions for which experimental data wereused to constrain the threshold energy. The parameters used in GWB simu-lation are listed in SI Appendix, Table S7.
E7934 | www.pnas.org/cgi/doi/10.1073/pnas.1612244113 Lau et al.
Simulations were then run incorporating microbial growth and main-tenance energy demand rates to determine a microbial community com-position based upon the reactant fluxes and microbial respiration ratescalculated from the above Eqs. 3–7. The sustainable cellular concentrationswithin the fracture water were calculated in the GWB by assuming thatthe growth rate will be proportional to the relative magnitude in thedifference between the maintenance energy demand and the rate ofenergy delivery of a metabolic redox equation defined as ΔP:
ΔP =−0.8ΔGrk−mE ·gc
3,600, [8]
where ΔP is in kilojoules·(milligram of biomass)−1·second−1, ΔGr is the freeenergy of the metabolic redox reaction at in situ temperature, activities,and fugacities, which is usually negative, in kilojoules·(mole of reactant)−1,k is the metabolic redox reaction rate in moles of reactant·(milligram ofbiomass)−1·second−1, gc equals to 4.2 × 10⁻⁵ moles of carbon per 1-mg dryweight of cell, and mE is the maintenance energy demand in kilo-joules·(mole of C biomass)−1·hour−1. k is dependent upon ΔGr such thatwhen the ΔGr becomes less negative than a threshold energy, then k willbe zero. We also assume that only 80% of the free energy is available formetabolism and the rest is lost as heat. mE is defined by the followingequation from Tijhuis et al. (85):
mE = 4.5 · e
�−69,400
�R�1T−
1298
��
, [9]
where R is the universal gas constant 8.314 J·K−1·mol−1, and T is temperature inKelvin. The rate of increase or decrease of the biomass is governed by thefraction of the ΔGr that is directed to maintenance and the growth yield, sothe biomass, [X], increases according to the following relationship:
½X�i = ½X�i−1 +Y · ½X�i−1 ·ΔP
−ΔGr, [10]
where [X]i is the biomass concentration in milligrams of biomass·(kilogram ofwater)−1 at time step i, and Y is the growth yield in milligrams of biomass·(moleof reactant)−1.
The mE relationship is based upon chemostat experimental data across arange of temperatures and is consistent with aerobic and anaerobic microor-ganisms having similar maintenance requirements dependent only upon theambient temperature. For simplicity, we make the same assumption in ourmodel. Onstott et al. (86) and Hoehler and Jørgensen (87) point out that themaintenance energy values from Eq. 9 appear to be two to three orders ofmagnitude greater than retentostat measurement of the maintenance energyrate (88), but to match the observed cellular abundance calculated from our
model with the observed cellular concentration we only had to decrease thepreexponential term from 4.5 to 4.5 × 10⁻¹. The addition of the maintenanceenergy rate to the GWB microbial kinetic function using a custom rate lawenabled stabilization of the biomass as the concentrations of reactants andproducts change during the course of reaction progress and more accuratelysimulates subsurface populations existing in oligotrophic environments.
The growth yields for HS− oxidation by O2 and NO3− reduction were based
on experimental observations of S2O32− oxidation by Thiobacillus species (89–
91) (SI Appendix, Table S7). The growth yields, kinetic parameters, andthreshold values for the H2 oxidation by O2 reduction, and H2 oxidation cou-pled to denitrification were derived using GWB based on the experimentsperformed on Thiobacillus plumbophilus (92) and Parococcus denitrificans (93,94), respectively (SI Appendix, Table S7).
The growth kinetics for autotrophic sulfate reducers are derived fromKristjansson et al. (95) and Sonne-Hansen et al. (96). The growth yields for au-totrophic sulfate reducers are more difficult to constrain. In coculture experi-ments where acetogenicAcetobacterium growing on H2 and CO2 was supplyingacetate to Desulfovibrio, the Acetobacterium comprised only 5% of the mixedculture (97). The doubling times for Desulfovibrio are twice as long when grownautotrophically as when grown on acetate (97). As a growth yield of 4.8 g·(molof reactant)−1 has been published for Desulfobacter postgatei by Widdel andPfennig (98), we have used a growth yield of 2.4 g·(mol of reactant)−1 for au-totrophic growth of an sulfate reducer (SI Appendix, Table S7).
ACKNOWLEDGMENTS. We are grateful for the support of Sibanye GoldLimited and the management and staff of Beatrix gold mine. We give credit toS. Maphanga (Beatrix gold mine) and other researchers who participated in thefield campaigns during July 2012, including Sarah Hendrickson, Michael Pullin,and Kenna Wilkie. We express our appreciation to Moutusi Royand andGenming Luo for assisting with sulfur isotopic analysis, and Sandi M. Smartand Daniel M. Sigman for assisting with nitrate isotopic analysis. We thankMatthew Cahn (Department of Molecular Biology, Princeton University) andthe staff of Research Computing (Office of Information Technology, PrincetonUniversity), especially Robert Knight, for their technical support with thecomputational analyses. We greatly appreciate Simon Levin, Henry Horn, andKen Haste Andersen (Department of Ecology and Evolutionary Biology, Prince-ton University), and the anonymous reviewers for their constructive commentson the manuscript, especially the interpretation of the inverted biomasspyramids. This work was supported by funding from National ScienceFoundation [Grants EAR-0948659 and DEB-1441646 (to T.C.O.) and DGE-1148900 (to C.M.)], the Deep Carbon Observatory (Alfred P. Sloan Foundation)[Sloan 2013-10-03, subaward 48045 (to M.C.Y.L.)], and the Center for DarkEnergy Biosphere Investigations (C.M.). Partial support for isotopic analyseswas provided by the Natural Sciences and Engineering Research Council ofCanada (B.S.L.). This article is Center for Dark Energy Biosphere InvestigationsContribution 340.
1. Stevens TO, McKinley JP (1995) Lithoautotrophic microbial ecosystems in deep basaltaquifers. Science 270:450–454.
2. Moser DP, et al. (2005) Desulfotomaculum and Methanobacterium spp. dominate a4- to 5-kilometer-deep fault. Appl Environ Microbiol 71(12):8773–8783.
3. Lin L-H, et al. (2006) Long-term sustainability of a high-energy, low-diversity crustalbiome. Science 314(5798):479–482.
4. Magnabosco C, et al. (2016) A metagenomic window into carbon metabolism at 3 kmdepth in Precambrian continental crust. ISME J 10(3):730–741.
5. Lever MA, et al. (2013) Evidence for microbial carbon and sulfur cycling in deeplyburied ridge flank basalt. Science 339(6125):1305–1308.
6. Jungbluth SP, Grote J, Lin H-T, Cowen JP, Rappé MS (2013) Microbial diversitywithin basement fluids of the sediment-buried Juan de Fuca Ridge flank. ISME J7(1):161–172.
7. Lavalleur HJ, Colwell FS (2013) Microbial characterization of basalt formation waterstargeted for geological carbon sequestration. FEMS Microbiol Ecol 85(1):62–73.
8. Magnabosco C, et al. (2014) Comparisons of the composition and biogeographicdistribution of the bacterial communities occupying South African thermal springswith those inhabiting deep subsurface fracture water. Front Microbiol 5:679.
9. Nyyssönen M, et al. (2014) Taxonomically and functionally diverse microbial com-munities in deep crystalline rocks of the Fennoscandian shield. ISME J 8(1):126–138.
10. Ben Maamar S, et al. (2015) Groundwater isolation governs chemistry and microbialcommunity structure along hydrologic flowpaths. Front Microbiol 6:1457.
11. Labonté JM, et al. (2015) Single cell genomics indicates horizontal gene transfer andviral infections in a deep subsurface Firmicutes population. Front Microbiol 6:349.
12. Borgonie G, et al. (2015) Eukaryotic opportunists dominate the deep-subsurfacebiosphere in South Africa. Nat Commun 6:8952.
13. Borgonie G, et al. (2011) Nematoda from the terrestrial deep subsurface of SouthAfrica. Nature 474(7349):79–82.
14. Biebl H, Pfenning N (1978) Growth yields of green sulfur bacteria in mixed cultureswith sulfur and sulfate reducing bacteria. Arch Microbiol 117:9–16.
15. Morris BEL, Henneberger R, Huber H, Moissl-Eichinger C (2013) Microbial syntrophy:Interaction for the common good. FEMS Microbiol Rev 37(3):384–406.
16. Schink B, Stams AJM (2013) Syntrophism among prokaryotes. The Prokaryotes, edsRosenberg E, DeLong EF, Lory S, Stackebrandt E, Thompson F (Springer, Berlin), pp471–493.
17. Milucka J, et al. (2012) Zero-valent sulphur is a key intermediate in marine methaneoxidation. Nature 491(7425):541–546.
18. McGlynn SE, Chadwick GL, Kempes CP, Orphan VJ (2015) Single cell activity revealsdirect electron transfer in methanotrophic consortia. Nature 526(7574):531–535.
19. Wegener G, Krukenberg V, Riedel D, Tegetmeyer HE, Boetius A (2015) Intercellularwiring enables electron transfer between methanotrophic archaea and bacteria. Nature526(7574):587–590.
20. Prokopenko MG, et al. (2013) Nitrogen losses in anoxic marine sediments driven byThioploca-anammox bacterial consortia. Nature 500(7461):194–198.
21. Lau MCY, et al. (2014) Phylogeny and phylogeography of functional genes sharedamong seven terrestrial subsurface metagenomes reveal N-cycling and microbialevolutionary relationships. Front Microbiol 5:531.
22. Chivian D, et al. (2008) Environmental genomics reveals a single-species ecosystemdeep within Earth. Science 322(5899):275–278.
23. Simkus DN, et al. (2016) Variations in microbial carbon sources and cycling in the deepcontinental subsurface. Geochim Cosmochim Acta 173:264–283.
24. Nealson KH, Inagaki F, Takai K (2005) Hydrogen-driven subsurface lithoautotrophicmicrobial ecosystems (SLiMEs): Do they exist and why should we care? TrendsMicrobiol 13(9):405–410.
25. Lippmann J, et al. (2003) Dating ultra-deep mine waters with noble gases and 36Cl,Witwatersrand Basin, South Africa. Geochim Cosmochim Acta 67:4597–4619.
26. Lippmann-Pipke J, et al. (2011) Neon identifies two billion year old fluid componentin Kaapvaal Craton. Chem Geol 283:287–296.
27. Sherwood Lollar B, et al. (2008) Isotopic signatures of CH4 and higher hydrocarbongases from Precambrian Shield sites: A model for abiogenic polymerization of hy-drocarbons. Geochim Cosmochim Acta 72:4778–4795.
28. Moran MA, et al. (2013) Sizing up metatranscriptomics. ISME J 7(2):237–243.29. Silver BJ, et al. (2012) The origin of NO3
− and N2 in deep subsurface fracture water ofSouth Africa. Chem Geol 294-295:51–62.
Lau et al. PNAS | Published online November 21, 2016 | E7935
MICRO
BIOLO
GY
PNASPL
US
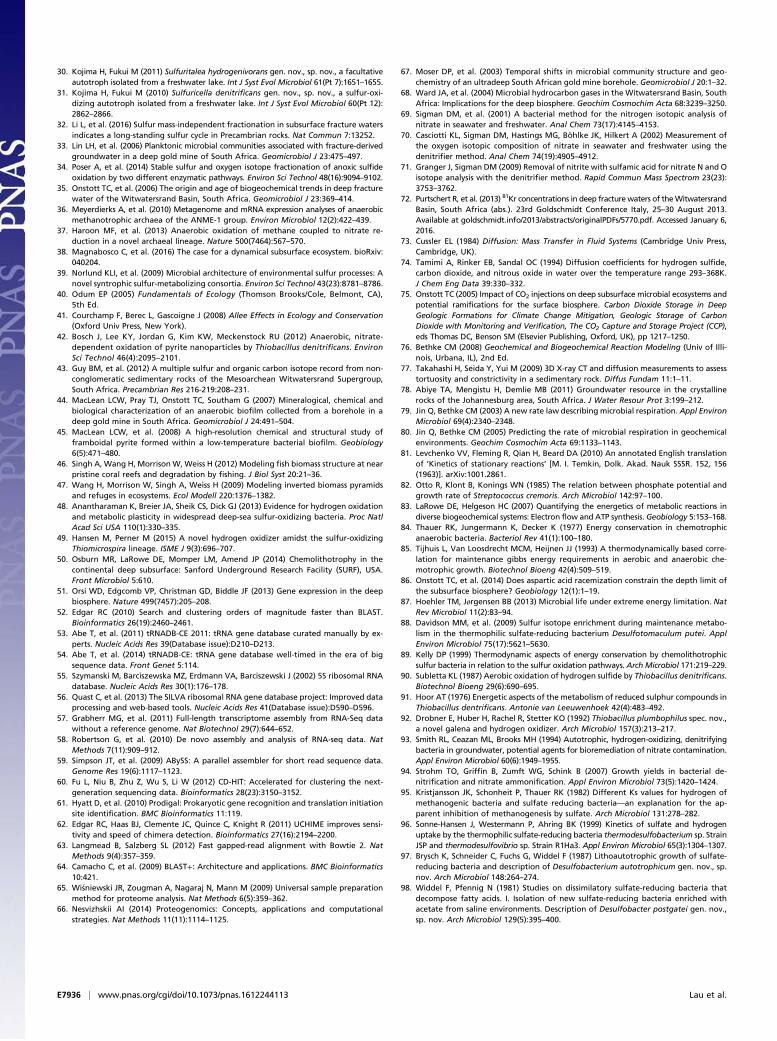
30. Kojima H, Fukui M (2011) Sulfuritalea hydrogenivorans gen. nov., sp. nov., a facultativeautotroph isolated from a freshwater lake. Int J Syst Evol Microbiol 61(Pt 7):1651–1655.
31. Kojima H, Fukui M (2010) Sulfuricella denitrificans gen. nov., sp. nov., a sulfur-oxi-dizing autotroph isolated from a freshwater lake. Int J Syst Evol Microbiol 60(Pt 12):2862–2866.
32. Li L, et al. (2016) Sulfur mass-independent fractionation in subsurface fracture watersindicates a long-standing sulfur cycle in Precambrian rocks. Nat Commun 7:13252.
33. Lin LH, et al. (2006) Planktonic microbial communities associated with fracture-derivedgroundwater in a deep gold mine of South Africa. Geomicrobiol J 23:475–497.
34. Poser A, et al. (2014) Stable sulfur and oxygen isotope fractionation of anoxic sulfideoxidation by two different enzymatic pathways. Environ Sci Technol 48(16):9094–9102.
35. Onstott TC, et al. (2006) The origin and age of biogeochemical trends in deep fracturewater of the Witwatersrand Basin, South Africa. Geomicrobiol J 23:369–414.
36. Meyerdierks A, et al. (2010) Metagenome and mRNA expression analyses of anaerobicmethanotrophic archaea of the ANME-1 group. Environ Microbiol 12(2):422–439.
37. Haroon MF, et al. (2013) Anaerobic oxidation of methane coupled to nitrate re-duction in a novel archaeal lineage. Nature 500(7464):567–570.
38. Magnabosco C, et al. (2016) The case for a dynamical subsurface ecosystem. bioRxiv:040204.
39. Norlund KLI, et al. (2009) Microbial architecture of environmental sulfur processes: Anovel syntrophic sulfur-metabolizing consortia. Environ Sci Technol 43(23):8781–8786.
40. Odum EP (2005) Fundamentals of Ecology (Thomson Brooks/Cole, Belmont, CA),5th Ed.
41. Courchamp F, Berec L, Gascoigne J (2008) Allee Effects in Ecology and Conservation(Oxford Univ Press, New York).
42. Bosch J, Lee KY, Jordan G, Kim KW, Meckenstock RU (2012) Anaerobic, nitrate-dependent oxidation of pyrite nanoparticles by Thiobacillus denitrificans. EnvironSci Technol 46(4):2095–2101.
43. Guy BM, et al. (2012) A multiple sulfur and organic carbon isotope record from non-conglomeratic sedimentary rocks of the Mesoarchean Witwatersrand Supergroup,South Africa. Precambrian Res 216-219:208–231.
44. MacLean LCW, Pray TJ, Onstott TC, Southam G (2007) Mineralogical, chemical andbiological characterization of an anaerobic biofilm collected from a borehole in adeep gold mine in South Africa. Geomicrobiol J 24:491–504.
45. MacLean LCW, et al. (2008) A high-resolution chemical and structural study offramboidal pyrite formed within a low-temperature bacterial biofilm. Geobiology6(5):471–480.
46. Singh A, Wang H, MorrisonW, Weiss H (2012) Modeling fish biomass structure at nearpristine coral reefs and degradation by fishing. J Biol Syst 20:21–36.
47. Wang H, Morrison W, Singh A, Weiss H (2009) Modeling inverted biomass pyramidsand refuges in ecosystems. Ecol Modell 220:1376–1382.
48. Anantharaman K, Breier JA, Sheik CS, Dick GJ (2013) Evidence for hydrogen oxidationand metabolic plasticity in widespread deep-sea sulfur-oxidizing bacteria. Proc NatlAcad Sci USA 110(1):330–335.
49. Hansen M, Perner M (2015) A novel hydrogen oxidizer amidst the sulfur-oxidizingThiomicrospira lineage. ISME J 9(3):696–707.
50. Osburn MR, LaRowe DE, Momper LM, Amend JP (2014) Chemolithotrophy in thecontinental deep subsurface: Sanford Underground Research Facility (SURF), USA.Front Microbiol 5:610.
51. Orsi WD, Edgcomb VP, Christman GD, Biddle JF (2013) Gene expression in the deepbiosphere. Nature 499(7457):205–208.
52. Edgar RC (2010) Search and clustering orders of magnitude faster than BLAST.Bioinformatics 26(19):2460–2461.
53. Abe T, et al. (2011) tRNADB-CE 2011: tRNA gene database curated manually by ex-perts. Nucleic Acids Res 39(Database issue):D210–D213.
54. Abe T, et al. (2014) tRNADB-CE: tRNA gene database well-timed in the era of bigsequence data. Front Genet 5:114.
55. Szymanski M, Barciszewska MZ, Erdmann VA, Barciszewski J (2002) 5S ribosomal RNAdatabase. Nucleic Acids Res 30(1):176–178.
56. Quast C, et al. (2013) The SILVA ribosomal RNA gene database project: Improved dataprocessing and web-based tools. Nucleic Acids Res 41(Database issue):D590–D596.
57. Grabherr MG, et al. (2011) Full-length transcriptome assembly from RNA-Seq datawithout a reference genome. Nat Biotechnol 29(7):644–652.
58. Robertson G, et al. (2010) De novo assembly and analysis of RNA-seq data. NatMethods 7(11):909–912.
59. Simpson JT, et al. (2009) ABySS: A parallel assembler for short read sequence data.Genome Res 19(6):1117–1123.
60. Fu L, Niu B, Zhu Z, Wu S, Li W (2012) CD-HIT: Accelerated for clustering the next-generation sequencing data. Bioinformatics 28(23):3150–3152.
61. Hyatt D, et al. (2010) Prodigal: Prokaryotic gene recognition and translation initiationsite identification. BMC Bioinformatics 11:119.
62. Edgar RC, Haas BJ, Clemente JC, Quince C, Knight R (2011) UCHIME improves sensi-tivity and speed of chimera detection. Bioinformatics 27(16):2194–2200.
63. Langmead B, Salzberg SL (2012) Fast gapped-read alignment with Bowtie 2. NatMethods 9(4):357–359.
64. Camacho C, et al. (2009) BLAST+: Architecture and applications. BMC Bioinformatics10:421.
65. Wi�sniewski JR, Zougman A, Nagaraj N, Mann M (2009) Universal sample preparationmethod for proteome analysis. Nat Methods 6(5):359–362.
66. Nesvizhskii AI (2014) Proteogenomics: Concepts, applications and computationalstrategies. Nat Methods 11(11):1114–1125.
67. Moser DP, et al. (2003) Temporal shifts in microbial community structure and geo-chemistry of an ultradeep South African gold mine borehole. Geomicrobiol J 20:1–32.
68. Ward JA, et al. (2004) Microbial hydrocarbon gases in the Witwatersrand Basin, SouthAfrica: Implications for the deep biosphere. Geochim Cosmochim Acta 68:3239–3250.
69. Sigman DM, et al. (2001) A bacterial method for the nitrogen isotopic analysis ofnitrate in seawater and freshwater. Anal Chem 73(17):4145–4153.
70. Casciotti KL, Sigman DM, Hastings MG, Böhlke JK, Hilkert A (2002) Measurement ofthe oxygen isotopic composition of nitrate in seawater and freshwater using thedenitrifier method. Anal Chem 74(19):4905–4912.
71. Granger J, Sigman DM (2009) Removal of nitrite with sulfamic acid for nitrate N and Oisotope analysis with the denitrifier method. Rapid Commun Mass Spectrom 23(23):3753–3762.
72. Purtschert R, et al. (2013) 81Kr concentrations in deep fracturewaters of theWitwatersrandBasin, South Africa (abs.). 23rd Goldschmidt Conference Italy, 25–30 August 2013.Available at goldschmidt.info/2013/abstracts/originalPDFs/5770.pdf. Accessed January 6,2016.
73. Cussler EL (1984) Diffusion: Mass Transfer in Fluid Systems (Cambridge Univ Press,Cambridge, UK).
74. Tamimi A, Rinker EB, Sandal OC (1994) Diffusion coefficients for hydrogen sulfide,carbon dioxide, and nitrous oxide in water over the temperature range 293–368K.J Chem Eng Data 39:330–332.
75. Onstott TC (2005) Impact of CO2 injections on deep subsurface microbial ecosystems andpotential ramifications for the surface biosphere. Carbon Dioxide Storage in DeepGeologic Formations for Climate Change Mitigation, Geologic Storage of CarbonDioxide with Monitoring and Verification, The CO2 Capture and Storage Project (CCP),eds Thomas DC, Benson SM (Elsevier Publishing, Oxford, UK), pp 1217–1250.
76. Bethke CM (2008) Geochemical and Biogeochemical Reaction Modeling (Univ of Illi-nois, Urbana, IL), 2nd Ed.
77. Takahashi H, Seida Y, Yui M (2009) 3D X-ray CT and diffusion measurements to assesstortuosity and constrictivity in a sedimentary rock. Diffus Fundam 11:1–11.
78. Abiye TA, Mengistu H, Demlie MB (2011) Groundwater resource in the crystallinerocks of the Johannesburg area, South Africa. J Water Resour Prot 3:199–212.
79. Jin Q, Bethke CM (2003) A new rate law describing microbial respiration. Appl EnvironMicrobiol 69(4):2340–2348.
80. Jin Q, Bethke CM (2005) Predicting the rate of microbial respiration in geochemicalenvironments. Geochim Cosmochim Acta 69:1133–1143.
81. Levchenko VV, Fleming R, Qian H, Beard DA (2010) An annotated English translationof ‘Kinetics of stationary reactions’ [M. I. Temkin, Dolk. Akad. Nauk SSSR. 152, 156(1963)]. arXiv:1001.2861.
82. Otto R, Klont B, Konings WN (1985) The relation between phosphate potential andgrowth rate of Streptococcus cremoris. Arch Microbiol 142:97–100.
83. LaRowe DE, Helgeson HC (2007) Quantifying the energetics of metabolic reactions indiverse biogeochemical systems: Electron flow and ATP synthesis. Geobiology 5:153–168.
84. Thauer RK, Jungermann K, Decker K (1977) Energy conservation in chemotrophicanaerobic bacteria. Bacteriol Rev 41(1):100–180.
85. Tijhuis L, Van Loosdrecht MCM, Heijnen JJ (1993) A thermodynamically based corre-lation for maintenance gibbs energy requirements in aerobic and anaerobic che-motrophic growth. Biotechnol Bioeng 42(4):509–519.
86. Onstott TC, et al. (2014) Does aspartic acid racemization constrain the depth limit ofthe subsurface biosphere? Geobiology 12(1):1–19.
87. Hoehler TM, Jørgensen BB (2013) Microbial life under extreme energy limitation. NatRev Microbiol 11(2):83–94.
88. Davidson MM, et al. (2009) Sulfur isotope enrichment during maintenance metabo-lism in the thermophilic sulfate-reducing bacterium Desulfotomaculum putei. ApplEnviron Microbiol 75(17):5621–5630.
89. Kelly DP (1999) Thermodynamic aspects of energy conservation by chemolithotrophicsulfur bacteria in relation to the sulfur oxidation pathways. Arch Microbiol 171:219–229.
90. Subletta KL (1987) Aerobic oxidation of hydrogen sulfide by Thiobacillus denitrificans.Biotechnol Bioeng 29(6):690–695.
91. Hoor AT (1976) Energetic aspects of the metabolism of reduced sulphur compounds inThiobacillus dentrificans. Antonie van Leeuwenhoek 42(4):483–492.
92. Drobner E, Huber H, Rachel R, Stetter KO (1992) Thiobacillus plumbophilus spec. nov.,a novel galena and hydrogen oxidizer. Arch Microbiol 157(3):213–217.
93. Smith RL, Ceazan ML, Brooks MH (1994) Autotrophic, hydrogen-oxidizing, denitrifyingbacteria in groundwater, potential agents for bioremediation of nitrate contamination.Appl Environ Microbiol 60(6):1949–1955.
94. Strohm TO, Griffin B, Zumft WG, Schink B (2007) Growth yields in bacterial de-nitrification and nitrate ammonification. Appl Environ Microbiol 73(5):1420–1424.
95. Kristjansson JK, Schonheit P, Thauer RK (1982) Different Ks values for hydrogen ofmethanogenic bacteria and sulfate reducing bacteria—an explanation for the ap-parent inhibition of methanogenesis by sulfate. Arch Microbiol 131:278–282.
96. Sonne-Hansen J, Westermann P, Ahring BK (1999) Kinetics of sulfate and hydrogenuptake by the thermophilic sulfate-reducing bacteria thermodesulfobacterium sp. StrainJSP and thermodesulfovibrio sp. Strain R1Ha3. Appl Environ Microbiol 65(3):1304–1307.
97. Brysch K, Schneider C, Fuchs G, Widdel F (1987) Lithoautotrophic growth of sulfate-reducing bacteria and description of Desulfobacterium autotrophicum gen. nov., sp.nov. Arch Microbiol 148:264–274.
98. Widdel F, Pfennig N (1981) Studies on dissimilatory sulfate-reducing bacteria thatdecompose fatty acids. I. Isolation of new sulfate-reducing bacteria enriched withacetate from saline environments. Description of Desulfobacter postgatei gen. nov.,sp. nov. Arch Microbiol 129(5):395–400.
E7936 | www.pnas.org/cgi/doi/10.1073/pnas.1612244113 Lau et al.