Embed Size (px)
Citation preview

MARINE ECOLOGY PROGRESS SERIESMar Ecol Prog Ser
Vol. 332: 63–75, 2007 Published March 5
INTRODUCTION
Understanding the global carbon cycle is a majorcontemporary challenge in Earth sciences. Oceanicgross primary production (GPP) and respiration (R)partly regulate global metabolism, but our knowledgeof these processes and the biologically mediated reac-tions controlling them remains incomplete. In 1987,Smith & Mackenzie compiled estimates of globalocean GPP and R and concluded that while on averagethe global ocean acts as a sink for carbon dioxide(CO2), ocean metabolism was a net source of CO2 (netheterotrophic, GPP < R) to the atmosphere. However,
they noted that net heterotrophy occurred predomi-nantly in nearshore environments, fueled largely byterrigenous input of organic carbon, and that openocean regions likely sustained marginal net autotro-phy (GPP > R) to balance the nearshore heterotrophy.Under steady-state conditions, wherein changes inbiomass are minimal, characteristic features of netautotrophic marine ecosystems include a net fluxof oxygen (O2) to the atmosphere, accumulation oforganic carbon in the euphotic zone and/or net exportof organic carbon (C) to subeuphotic zone depths.
More recently, several investigators concluded thatoligotrophic open ocean ecosystems maintain a state of
© Inter-Research 2007 · www.int-res.com*Email: [email protected]
Metabolic response of oligotrophic planktoncommunities to deep water nutrient enrichment
Patricia M. McAndrew1,*, Karin M. Björkman1, Matthew J. Church1, Paul J. Morris1, 3, Nicholas Jachowski1, 4, Peter J. le B. Williams2, David M. Karl1
1Department of Oceanography, University of Hawaii, 1000 Pope Road, Honolulu, Hawaii 96822, USA2School of Ocean Sciences, University of Wales, Bangor, Menai Bridge, Anglesey LL59 5EY, UK
3Present address: National Oceanography Centre, University of Southampton, European Way, Southampton SO14 3ZH, UK4Present address: Stanford University, Palo Alto, California 94305, USA
ABSTRACT: Studies on upper ocean plankton production and respiration in oligotrophic ecosystemsare taken to imply that these regions are net heterotrophic (i.e. gross primary production [GPP] < res-piration [R]). In this study we examined the hypothesis that the regularly observed state of netheterotrophy in the oligotrophic North Pacific Ocean may be interrupted by periodic bursts of netautotrophy when GPP becomes decoupled from R. To examine this hypothesis, we conducted a seriesof nutrient addition experiments in the oligotrophic North Pacific Subtropical Gyre (NPSG) in whichnutrient-replete deep seawater was mixed with nutrient-depleted mixed-layer water. We monitoredtime-dependent changes in rates of GPP and R as well as dynamics of chlorophyll and nutrientconcentrations. Our results consistently demonstrated that following the addition of nutrients: (1)phytoplankton biomass (chl a) and primary production increase; (2) the photoautotrophic planktonassemblage shifts from small (<2 µm diameter) to large (>10 µm diameter), chl c-containing and Si-utilizing cells; and (3) community metabolism shifts from near balance, or slightly net heterotrophic,to demonstrably net autotrophic metabolism. These results suggest that nutrient availability partlyregulates plankton community structure and dynamics, and could serve as a mechanism to tempo-rally and spatially decouple GPP and R in oligotrophic open ocean ecosystems.
KEY WORDS: Metabolic balance · Net community production · Respiration · Nutrient addition ·Oligotrophic · North Pacific Ocean · Stn ALOHA
Resale or republication not permitted without written consent of the publisher
OPENPEN ACCESSCCESS

Mar Ecol Prog Ser 332: 63–75, 2007
net heterotrophy (del Giorgio et al. 1997, Duarte &Agusti 1998, del Giorgio & Duarte 2002). Based oncompilations of measurements of net primary produc-tion (NPP) and bacterial respiration (R), del Giorgio etal. (1997) found that NPP and R varied systematicallyacross trophic gradients, with R tending to exceed NPPin unproductive ecosystems, defined as those systemswhere NPP ≤ 6 to 10 mmol C m–3 d–1. Ecosystems withNPP below this threshold would include most of theworld’s open ocean habitats (Behrenfeld et al. 2002).Duarte & Agusti (1998) also concluded that unpro-ductive aquatic ecosystems have a disproportionatelyhigher R relative to GPP compared with productiveecosystems, identifying the former as net sinks fororganic C and O2 and net sources of CO2.
The conclusion that open ocean ecosystems are netheterotrophic generally contradicts various lines ofgeochemical evidence that suggest oligotrophic oceanecosystems are net autotrophic (Emerson et al. 1995,2002, Abell et al. 2000, Najjar & Keeling 2000, Smith etal. 2002, Juranek & Quay 2005). The maintenance ofnet heterotrophy in oligotrophic areas requires sup-plies of allochthonous organic material to physicallyisolated ecosystems (Williams & Bowers 1999). Geo-graphic location likely determines the importance ofallochthonous versus locally produced organic matter(Serret et al. 2002). Advection could supply organicmaterial; however, dissolved organic carbon (DOC)gradients are generally in the opposite direction(Hansell et al. 1997, Abell et al. 2000, Church et al.2002). Dachs et al. (2005) determined that aeolianinputs of terrestrially and anthropogenically derivedmaterial could provide organic matter to the oceans;however, the remoteness of many oligotrophic areas—such as the center of the North Pacific SubtropicalGyre (NPSG)—from continental land masses makeaeolian input an unlikely source. Seasonal uncouplingof respiration from photosynthesis has also been pro-posed as an explanation for apparent net heterotrophy(Sherr & Sherr 1996, Serret et al. 1999, Aristegui &Harrison 2002), but a recent study in the NPSG byWilliams et al. (2004) failed to provide evidence forseasonality in net autotrophy.
Another explanation for the observed imbalance inmetabolism is that it arose from inaccuracies of inter-pretation in the methods for measuring photosynthesisand respiration. This was discussed by Williams et al.(2004), who rejected the explanation on the groundsthat the oxygen technique overcame the accuracyproblem: the primary measurement is net O2 produc-tion, which is the property required. Although thisargument is most probably sound for a sample in thebottle, it does not take into consideration the possibilitythat an incubated sample may not have been exposedto the appropriate physiological conditions. The water
column is turbulent, resulting in the phytoplanktonbeing exposed to a variable light field, which in situincubations are unable to mimic. Marra (1978) showedthat by subjecting plankton samples to a variable lightfield, up to 87% increases in photosynthesis couldresult. Such a phenomenon could resolve the massbalance problem, but would still leave the photo-synthetic rates through much of the water columnbelow the threshold (1.1 mmol O2 m–3 d–1) for net pro-duction proposed by Duarte & Agusti (1998) for theopen ocean. Thus, Stn ALOHA, the study site of theHawaii Ocean Time-series (HOT) located in the centralNPSG, would stand in contravention to the ‘thresholdmodel.’
One of the untested assumptions necessary forderiving estimates of net ecosystem metabolismbased on short-term (hours to days) in vitro incuba-tion experiments rests on whether the time andspace scaling of such short-term incubations areappropriate for ecosystem extrapolation. Comparedto biological incubation measurements, geochemicaltracers generally integrate over larger temporal andspatial scales, thereby eliminating high frequency(hourly to daily) variability in planktonic respirationand production. Proper time-space scale assessmentis critical for open ocean ecosystems, becausemicroorganism response times are short (hourly todaily) and particulate organic matter (POM) pool res-idence times are generally less than 1 mo. Aperiodicincreases in O2 saturation, with durations of a fewdays to 1 wk and variable frequencies of weeks tomonths, have been observed in open ocean surfacewaters at Stn ALOHA (Emerson et al. 2002). Thesephenomena suggest bursts of net community produc-tion (NCP) when GPP – R > 0. In a statistical sense,such events would not be properly represented in1 d incubation experiments.
This concept was the motivation for the presentstudy. We aimed to explore one mechanism by whichbursts of net autotrophic production could occur. Weconducted a series of field incubation experimentswherein variable proportions of nutrient-replete deepseawater (DSW) were added to oligotrophic mixed-layer seawater (MLSW) and sampled periodically dur-ing 5 to 7 d incubations. Nutrient enrichment by addi-tion of deep water initiated pulses of photosynthesis,enabling us to examine both the time scale of theresponse to nutrient perturbation and the time depen-dency of the balance of photosynthesis and respirationon short time scales. Based on results from these fieldexperiments, we concluded that nutrient input has thepotential to fundamentally alter the balance betweenGPP and R in the oligotrophic upper ocean, and maybe one mechanism by which periodic bursts of netautotrophic metabolism occur.
64

McAndrew et al.: Net metabolic balance of the open ocean
MATERIALS AND METHODS
Sites and sample collection. Five experiments wereconducted at various locations in the NPSG using acommon experimental design. Expts I, II and III wereconducted during the Marine Oceanic Nitrogen Fixa-tion and Global Climate component of the Biocomplex-ity program (Cruise MP9, July-August 2003). Expt I wasconducted at 25° 59’ N, 175° 59’ W, Expt II at 26° 40’ N,177° 46’ W, and Expt III at 18° 58’ N, 154° 50’ W (Fig. 1).Expts IV and V were carried out at Station ALOHA(22° 45’ N, 158° 00’ W), the open ocean site of the HOTprogram (Karl & Lukas 1996), during July 2004 (HOT-161) and November 2004 (HOT-165), respectively.
For each experiment, nutrient-replete DSW wasobtained from 700 m, chosen for its location well belowthe mixed layer and its inorganic macro-nutrient(nitrate [NO3
–], phosphate [PO43–], silicate SiO2) and
trace-nutrient (e.g. metals and vitamins) content.Nutrient depleted, MLSW was obtained from the
approximately 30% light-level (25 to 45 m). DSW wasadded to MLSW to yield final concentrations of 5 and10% DSW (by volume). As a point of reference, 5%DSW added approximately 1.5 mmol m–3 NO3
–,0.1 mmol m–3 PO4
3– and 3 mmol m–3 SiO2 to MLSW thathad, on average, <0.01 mmol m–3 NO3
–, 0.05 mmol m–3
PO43–, and 1.2 mmol m–3 SiO2. Samples of MLSW with-
out added DSW served as controls. All water wasmixed into and incubated in acid-cleaned polycar-bonate carboys with a total volume of approximately25 dm–3. Time zero (t0) samples were collected and theremaining carboys incubated in a shipboard incubatorat sea surface temperature. The incubator was coveredwith blue plexiglass filters (#2069, Rohm and Haas) tosimulate in situ light quality and quantity at the 30%light-level. Table 1 contains a summary of locations,times and parameters measured for each experiment.
Nutrients, pigments and flow cytometry. Nitrateplus nitrite (N+N), soluble reactive phosphorus (SRP),and silicic acid (SiO2) were measured using a Bran &
Lubbe (AA-3) continuous flow system(Armstrong et al. 1967). SRP (hereafterPO4
3–) was also measured using thehigh-sensitivity MAGIC method, whichprovided more accurate and preciseestimates of PO4
3– concentrations at≤200 µmol m–3 (Karl & Tien 1992). Forthe chlorophyll and pigment analyses, 3replicate 125 cm–3 samples were takenat each time point. Samples were fil-tered onto glass fiber filters (WhatmanGF/F), and pigments were extractedfrom the filter using 100% HPLC-grade
65
176°178°W 174° 172° 170° 168° 166° 164° 162° 160° 158° 156° 154°
20°
22°
24°
26°N III
III
IV, V
Fig. 1. Location of Expts I to V near the Hawaiian Islands, North Pacific
Expt Date Location Treatment Parameters measured
t0 24 h 36 h 48 h 60 h 72 h 84 h 96 h 120 h 144 h
I Jul 25° 59’ N, Control Chl, 14C, Chl Chl Chl Chl Chl, 14C, 2003 175° 59’ W 5% DSW O2, PO4
3– O2, PO43–
10% DSW
II Jul 26° 40’ N, Control Chl, 14C, Chl Chl, 14C, 2003 177° 46’ W 5% DSW O2, PO4
3–, O2, PO43–,
10% DSW N+N, SiO2 N+N, SiO2
III Aug 18° 58’ N, Control Chl, 14C, Chl Chl, Chl, Chl, 14C,2003 154° 50’ W 5% DSW O2, PO4
3–, FCM FCM O2, PO43–,
10% DSW FCM FCM
IV Jul Stn ALOHA Control Chl, 14C, Chl, Chl, 14C, Chl, 14C, Chl, 14C, Chl, 14C, Chl, 14C, Chl, 14C, 2004 22° 45’ N, 5% DSW PO4
3–, PO43–, Chl, PO4
3–, PO43–, PO4
3–, PO43–, PO4
3–, PO43–,
158° W N+N, SiO2 N+N, SiO2 N+N, SiO2 N+N, SiO2 N+N, SiO2 N+N, SiO2 N+N, SiO2 N+N, SiO2
V Nov Stn ALOHA Control Chl, 14C, Chl, 14C, Chl, 14C, Chl, 14C2004 22° 45’ N, 5% DSW PO4
3– PO43– PO4
3–
158° W
Table 1. Dates, locations, experimental treatments and properties measured during this study. Date and location reflect where and when wa-ter was obtained for each experiment. Treatments are control (unamended mixed-layer) and 5 and 10% vol/vol additions of deep seawater(DSW) to mixed-layer seawater (MLSW). Parameters measured include chlorophyll (chl), radiocarbon assimilation (14C), primary production
using O2 light/dark bottles, phosphate (PO43–), nitrate+nitrite (N+N), silicate (SiO2) and cell counts by flow cytometry (FCM)

Mar Ecol Prog Ser 332: 63–75, 2007
acetone. Chlorophyll (chl) a, b and c were measuredafter a 24 h extraction and again after 48 h of extractionon a Turner Designs TD-700 fluorometer (Strickland& Parsons 1972, Welschmeyer 1994). Upon return toshore, chl a was also analyzed on a Turner Designs10-AU fluorometer (Holm-Hansen et al. 1965). In theshore-based laboratory, flow cytometry measurementswere analyzed on a Beckman-Coulter Altra flowcytometer (Campbell & Vaulot 1993, Monger & Landry1993, Campbell et al. 1994). Chl a concentrations werebest-fit to an exponential curve to determine growthrates.
Primary production. Photosynthetic primary pro-duction was measured by 2 methods: (1) O2 light/darkbottles, and (2) radiocarbon (H14CO3
–) assimilation.The former provides estimates of GPP, R and NCP,whereas the latter provides a measure of carbonassimilation between GPP and NPP (Marra 2002). ForO2 measurements, 6 replicates were prepared foreach time point, and each replicate consisted of a t0, alight and a dark bottle. Sub-samples were taken inprecisely calibrated, ground-glass topped, borosilicatebottles with a nominal volume of 125 cm3. Light bot-tles were attached to a polycarbonate rack, and darkbottles were placed in opaque black bags. Both wereplaced in the incubator for 24 h before being fixed forWinkler titration (Carritt & Carpenter 1966). After fix-ing reagents were added, samples were stored under-water until analysis to prevent gas exchange. TheWinkler titration was performed using a computer-controlled photometric end-point detector (Williams &Jenkinson 1982). R was calculated by subtracting theO2 concentration in the dark bottle ([O2]dark) after 24 hincubation from the O2 concentration in the t0 bottle([O2]t0
). NCP was calculated by subtracting [O2]t0
from the O2 concentration in the O2 concentration inthe light bottle ([O2]light), and GPP was calculated byadding the magnitude of NCP and R. ANOVA (95%confidence level) and Tukey’s analysis with a 5%error rate were performed to determine statisticalsignificance of results.
For the C assimilation incubations, 40 cm3 of sample(Expts I to III) or 500 cm3 of sample (Expts IV to V) wereinoculated with 50 µCi H14CO3
– and incubated in vitroat the 30% light-level for 12 h. Following the incuba-tion, samples were filtered onto Whatman GF/F filtersand frozen. Before analysis, samples were acidifiedusing 2N HCl and vented for 24 h before the additionof 10 cm3 Aquasol-2 liquid scintillation cocktail. Sam-ples were measured within 1 d of the addition of scin-tillation cocktail and again after a 1 mo period of darkstorage (Letelier et al. 1996, Karl et al. 1998). The dis-integration per minute (dpm) data obtained after the1 mo storage period were used to calculate rates of car-bon assimilation. 14C assimilation rates were also size-
fractionated into 0.2 to 2.0, 2.0 to 10.0 and >10 µm sizefractions during Expt V.
RESULTS
Expt I
The unamended MLSW treatments showed littlevariance in chlorophyll (Fig. 2a,e; specific growth rateμ = 0.20 d–1) or rates of GPP, NCP and R relative to t0
throughout the course of the experiment (Fig. 3). Over-all, the unamended treatments began and ended asnet heterotrophic systems (no statistical differencebetween t0 and final GPP, p = 0.027); however, theGPP:R ratio increased slightly during the experiment.The 5% DSW treatment demonstrated net increases inchlorophyll concentrations (μ = 0.36 d–1) and a modestdrawdown in nutrients (Table 2). GPP and R increased10- and 4-fold, respectively, during the course of theexperiment, resulting in a switch from negative to pos-itive O2 flux for the system, and the GPP:R ratioincreased 3-fold to 1.4. The 10% DSW treatmentdemonstrated the most significant changes relative tothe unamended treatment in response to the additionof DSW. Chl a increased 34-fold (μ = 0.70 d–1) and chl cincreased 20-fold. Again, GPP and R increased 60-fold(significantly different from control, p = 0.027) and 5-fold (not significantly different from control, p = 0.424),respectively, and the GPP:R ratio increased almost20-fold to a value of 8.5, switching from negative topositive O2 flux (Table 3). The rate of drawdown ofPO4
3– increased with increasing % nutrient addition(Table 2).
Expt II
As in Expt I, the unamended treatment in Expt II ex-hibited only small changes in chl a relative to nutrientamended samples (μ = 0.03 d–1). NCP remainedslightly positive throughout the experiment at0.18 mmol O2 m–3 d–1, and the GPP:R ratio increasedfrom 1.1 to 1.2. The addition of 5% DSW caused in-creases in chl a (14-fold, μ = 0.64 d–1), GPP (10-fold, p =0.063) and R (6-fold, p < 0.0005). NCP remained posi-tive throughout the experiment, and the GPP:R ratioincreased from 1.1 at t0 to 1.6 at 96 h. The 10% DSWtreatment resulted in the largest response in chloro-phyll (chl a increased 63-fold, μ = 1.01 d–1, and chl cincreased 35-fold; Fig. 2b,f), nutrient drawdown, GPP(30-fold, p = 0.063) and R (13-fold, p < 0.0005). TheGPP:R ratio increased from 1.1 to 2.4, becomingincreasingly net autotrophic throughout the experi-ment (Tables 2 & 3).
66

McAndrew et al.: Net metabolic balance of the open ocean 67
Fig. 2. (a–d) Chl a and (e–h) chl c Expts I to IV. Unamended control and additions of 5 and 10% deep seawater (DSW) are shown
Mar Ecol Prog Ser 332: 63–75, 2007
Expt III
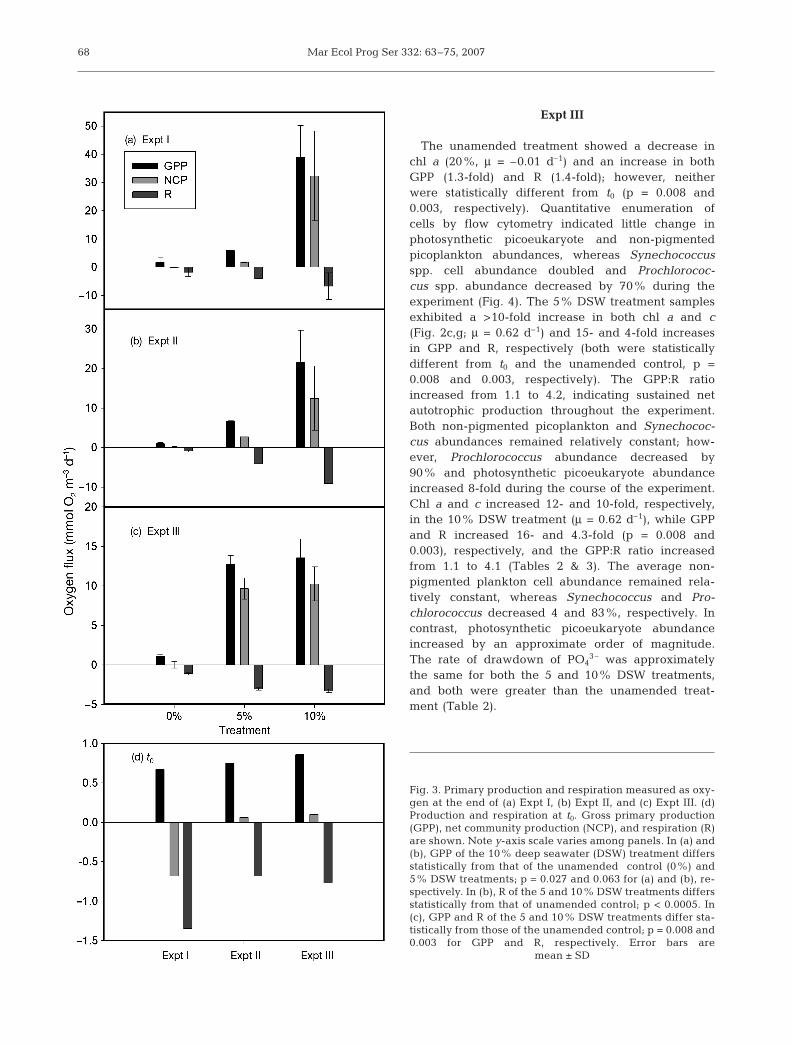
The unamended treatment showed a decrease inchl a (20%, μ = –0.01 d–1) and an increase in bothGPP (1.3-fold) and R (1.4-fold); however, neitherwere statistically different from t0 (p = 0.008 and0.003, respectively). Quantitative enumeration ofcells by flow cytometry indicated little change inphotosynthetic picoeukaryote and non-pigmentedpicoplankton abundances, whereas Synechococcusspp. cell abundance doubled and Prochlorococ-cus spp. abundance decreased by 70% during theexperiment (Fig. 4). The 5% DSW treatment samplesexhibited a >10-fold increase in both chl a and c(Fig. 2c,g; μ = 0.62 d–1) and 15- and 4-fold increasesin GPP and R, respectively (both were statisticallydifferent from t0 and the unamended control, p =0.008 and 0.003, respectively). The GPP:R ratioincreased from 1.1 to 4.2, indicating sustained netautotrophic production throughout the experiment.Both non-pigmented picoplankton and Synechococ-cus abundances remained relatively constant; how-ever, Prochlorococcus abundance decreased by90% and photosynthetic picoeukaryote abundanceincreased 8-fold during the course of the experiment.Chl a and c increased 12- and 10-fold, respectively,in the 10% DSW treatment (μ = 0.62 d–1), while GPPand R increased 16- and 4.3-fold (p = 0.008 and0.003), respectively, and the GPP:R ratio increasedfrom 1.1 to 4.1 (Tables 2 & 3). The average non-pigmented plankton cell abundance remained rela-tively constant, whereas Synechococcus and Pro-chlorococcus decreased 4 and 83%, respectively. Incontrast, photosynthetic picoeukaryote abundanceincreased by an approximate order of magnitude.The rate of drawdown of PO4
3– was approximatelythe same for both the 5 and 10% DSW treatments,and both were greater than the unamended treat-ment (Table 2).
68
Fig. 3. Primary production and respiration measured as oxy-gen at the end of (a) Expt I, (b) Expt II, and (c) Expt III. (d)Production and respiration at t0. Gross primary production(GPP), net community production (NCP), and respiration (R)are shown. Note y-axis scale varies among panels. In (a) and(b), GPP of the 10% deep seawater (DSW) treatment differsstatistically from that of the unamended control (0%) and5% DSW treatments; p = 0.027 and 0.063 for (a) and (b), re-spectively. In (b), R of the 5 and 10% DSW treatments differsstatistically from that of unamended control; p < 0.0005. In(c), GPP and R of the 5 and 10% DSW treatments differ sta-tistically from those of the unamended control; p = 0.008 and0.003 for GPP and R, respectively. Error bars are
mean ± SD

McAndrew et al.: Net metabolic balance of the open ocean 69
Expt Treatment Chl a Δ Chl a Chl b Δ Chl b Chl c Δ Chl c N+N Δ N+N PO43– ΔPO4
3– SiO2 ΔSiO2
t0 t0 t0 t0 t0 t0
I Control 50 ± 3 2.1 63 ± 16 –0.2 22 ± 4 0.8 75 ± 17 –85% DSW 94 ± 11 3.7 116 ± 34 0.6 38 ± 17 1.3 112 ± 8 –1110% DSW 41 ± 10 2.9 42 ± 7 0.1 16 ± 1 1.0 418 ± 222 –26
II Control 43 ± 2 0.1 56 ± 13 0.8 21 ± 3 0.3 28 ± 6 –1 24 ± 4 –2 ND –5% DSW 46 ± 1 8.2 35 ± 13 0.4 15 ± 4 1.7 1343 ± 7 –322 123 ± 5 –19 2639 ± 81 –54410% DSW 39 ± 0.2 37.9 43 ± 18 0.7 16 ± 3 7.8 3239 ± 33 –786 279 ± 13 –49 6931 ± 210 –1071
III Control 52 ± 6 –0.2 46 ± 18 –0.1 17 ± 4 0.0 115 ± 1 –15% DSW 46 ± 1 7.2 54 ± 6 0.0 19 ± 5 2.7 234 ± 5 –1610% DSW 43 ± 1 5.1 51 ± 13 –0.1 19 ± 4 1.9 342 ± 4 –15
IV Control 104 ± 5 2.4 125 ± 43 –2.9 22 ± 2 0.3 93 ± 53 –8 86 ± 9 –12 570 ± 387 –5% DSW 81 ± 12 9.9 306 ± 66 –0.1 28 0.9 2242 ± 71 –58 257 ± 9 –541 5409 ± 247 –332
V Control 18 ± 9 –20.2–2.0 µm 79 –0.3 28 <0.1 8 <0.12–10 µm 27 <0.1 25 <0.1 6 <0.1>10 µm 200 0.4 28 0.3 5 0.1
5% DSW 86 ± 9 40.2–2.0 µm 79 1.9 28 <0.1 9 0.42–10 µm 26 0.2 60 –0.4 10 <0.1>10 µm 202 22.2 35 1.0 7 0.2
Table 2. Response of chlorophyll and nutrient drawdown in experimental treatments. Concentrations of each pigment andnutrient at t0 listed next to the rate of change (Δ) over the course of the experiment for each treatment. Chlorophyll concentra-tions given as µg chl m–3, and rate of change as µg chl m–3 h–1; nutrient concentrations given as µmol m–3, and rate of change
as µmol m–3 d–1. ND: not detected
Expt Treatment 14C GPP NCP R GPP:Rt0 tF t0 tF t0 tF t0 tF t0 tF
I Control 8.31 ± 3.04 25.11± 20.88 0.67 1.72 ± 1.58 –0.68 –0.09 ± 0.16 1.35 1.81 ± 1.41 0.50 0.875% DSW 82.20 ± 44.65 5.92 ± 0.21 1.78 ± 0.12 4.14 ± 0.08 1.4310% DSW 397.11 ± 35.17 39.03 ± 11.18 32.33 ± 15.91 6.70 ± 4.72 8.53
II Control 3.63 ± 1.46 5.72 ± 0.67 0.75 1.03 ± 0.22 0.06 0.18 ± 0.06 0.68 0.85 ± 0.28 1.10 1.235% DSW 76.33 ± 35.24 6.73 ± 0.07 2.72 ± 0.03 4.10 ± 0.03 1.6410% DSW 169.40 ± 30.97 21.56 ± 8.16 12.49 ± 8.14 9.08 ± 0.01 2.37
III Control 3.85 ± 1.12 7.07 ± 0.66 0.86 1.12 ± 0.23 0.10 0.03 ± 0.42 0.76 1.09 ± 0.18 1.13 1.065% DSW 48.97 ± 4.41 12.70 ± 1.18 9.67 ± 1.34 3.03 ± 0.16 4.2110% DSW 58.84 ± 7.26 13.56 ± 2.38 10.27 ± 2.14 3.30 ± 0.23 4.10
IV Control 8.91 ± 0.03 24.52 ± 7.105% DSW 13.29 ± 7.63 136.16 ± 14.53
V Control0.2–2.0 µm 1.51 ± 0.77 0.74 ± 0.332–10 µm 0.02 ± 0.01 0.07 ± 0.03>10 µm 2.35 ± 0.33 4.63 ± 0.14
5% DSW0.2–2.0 µm 1.69 ± 0.12 2.89 ± 0.792–10 µm 0.03 ± 0.01 1.21 ± 0.77>10 µm 2.92 ± 0.06 31.71 ± 4.77
Table 3. Rates of production and respiration: initial (t0) and final (tF) rates of carbon assimilation (14C), gross primary production(GPP), net community production (NCP) and respiration (R) for each treatment for each experiment. The GPP:R ratio for t0 and tF
calculated using the corresponding values of GPP and R. 14C rates given as mg C m–3 d–1, and GPP, NCP and R as mmol O2 m–3 d–1

Mar Ecol Prog Ser 332: 63–75, 2007
Expt IV
Chl a and c concentrations in the unamended treat-ment increased 4- and 3-fold, respectively, after 60 h(μ = 0.15 d–1; Fig. 2d,h), and primary production asmeasured by 14C-assimilation increased nearly 3-fold(Tables 2 & 3). In the 5% DSW treatment chl a and cincreased 10- and 6-fold, respectively, throughout theexperiment (μ = 0.42 d–1), and primary productionincreased 10-fold from 2.2 mmol C m–3 d–1 at t0 to22.7 mmol C m–3 d–1 after 96 h incubation. Nutrientdrawdown rates were greater for the 5% DSW treat-ment than for the unamended treatment.
Expt V
The purpose of this experiment was to determinewhether nutrient amendment altered cell size or carbonproduction by selected plankton size classes. In theunamended treatment chl a remained the same ordecreased slightly in all size fractions, whereas chl cincreased (9%, 40% and 3-fold in the 0.2 to 2.0, 2.0 to10 and >10 µm size fractions, respectively; Fig. 5).14C-bicarbonate assimilation decreased in the 0.2 to2.0 µm size fraction and increased in the 2.0 to 10 and>10 µm size fractions (4- and 2-fold, respectively). Inthe 5% DSW treatment, chl a increased 3.3-, 1.6- and11.5-fold in the 0.2 to 2.0, 2.0 to 10 and >10 µm size frac-tions, respectively, and chl c increased 5.3- and 3.2-foldin the 0.2 to 2.0 and >10 µm size fractions, respectively.In the 2.0 to 10 µm size fraction, chl c showed high vari-ability and a net decrease by the end of the experiment.14C-bicarbonate assimilation by the 0.2 to 2.0 µm sizefraction increased ~70% over the course of the experi-ment, and dramatic increases of 49- and 11-fold wereobserved in the 2.0 to 10 and >10 µm size fractions,respectively (Fig. 6). The rate of drawdown of PO4
3–
was greater in the unamended treatment than in the5% DSW treatment (Table 2).
DISCUSSION
Several consistent and predictable features wereobserved following the addition of nutrient-repletedeep-ocean water to oligotrophic upper ocean water,including: (1) an increase in both chl a and primaryproduction, as determined by O2 fluxes and 14C assim-ilation; (2) an apparent shift in the photoautotrophicassemblage size structure towards large, chl c-contain-ing plankton, presumably diatoms; and (3) a shift inthe metabolic balance from a nutrient-limited systempoised at or near the GPP = R balance point to ademonstrably net autotrophic (GPP > R) system.
70
Fig. 4. Expt III: cell abundances of (a) non-pigmented pico-plankton, (b) Prochlorococcus spp., (c) Synechococcus spp.,and (d) photosynthetic picoeukaryotes. Unamended control
and additions of 5 and 10% DSW are shown

McAndrew et al.: Net metabolic balance of the open ocean
Rates of production and respiration
Increases in production occurred on time scalesshorter than 1 wk, indicating that it is possible torapidly increase GPP over short time scales in oligo-trophic ocean waters following the addition of nutri-ents. In contrast, the magnitude of the response inR was significantly lower than the response in GPPfor the same time period (3 to 4 d). Thus, nutrient addi-
tions to these oligotrophic waters consistently shiftedthe metabolic state of these experiments from netheterotrophy, or approximately balanced system meta-bolism, to net autotrophy. Control treatments main-tained relatively constant rates of production and res-piration during the course of the experiments,indicating that blooms observed after nutrient additionwere not an artifact of containment inside incubationbottles.
71
Fig. 5. Expt V, >10 µm size fraction: (a) chl a, (b) chl b, and(c) chl c. Unamended control and additions of 5 and 10%DSW are shown. Note y-axis scale varies among panels
Fig. 6. Expt V, primary production rates of size fractions: (a)0.2–2.0 µm, (b) 2.0–10 µm, and (c) >10 µm. Unamendedcontrol and additions of 5 and 10% DSW are shown. Note
y-axis scale varies among panels

Mar Ecol Prog Ser 332: 63–75, 2007
In 3 of the 5 experiments, we examined the meta-bolic response of upper ocean plankton assemblages tovariable amounts of nutrient-rich DSW. Interestingly,rates of GPP and R did not increase in proportion to theamount of nutrient added. Expt I yielded O2 fluxes of~6 and ~40 mmol O2 m–3 d–1 for 5 and 10% DSW treat-ments, respectively. If the response in GPP scaled lin-early with the amount of added nutrients, GPP in the10% nutrient addition would have been nearly 4-foldlower (12 mmol O2 m–3 d–1) than what was measured.This observation suggests there may be a minimumthreshold concentration of nutrients required to elicitthe observed metabolic changes. Alternatively, theplankton assemblages may have responded in a non-linear manner to nutrient input, or scaling of theresponse to nutrient concentration may require inte-gration over longer time scales.
The initial community composition of the planktonassemblage also likely affected the outcome of theseexperiments. The rate of chlorophyll accumulation ineach experiment varied after nutrient addition, sug-gesting that the types of plankton and degree oftrophodynamic coupling at the beginning of eachexperiment could have varied among these experi-ments, thereby influencing rates of chlorophyll accu-mulation, nutrient drawdown and response of GPP andR among experiments. For example, Expt I had greaterrates of GPP at the end of the experiment than Expt III.
A 5% addition of 700 m DSW adds approximately1.5 mmol m–3 N+N and 0.1 mmol m–3 PO4
3– to thenutrient-deprived MLSW at Stn ALOHA, and a 10%addition adds twice those concentrations. Fig. 7 showsthe time series of average N+N and PO4
3– concentra-tions calculated from integrated concentrations be-tween 0 and 50 m at Stn ALOHA. Although we ob-served phosphate concentrations at Stn ALOHA nearthose achieved in the 5% addition experiments, we didnot observe corresponding high N+N concentrations.The rapid coupling of growth and nutrient removaldemonstrated in the present study likely precludessubstantial accumulation of nutrients in the euphoticzone, making it difficult to capture a high nutrientevent with a monthly sampling regime.
GPP:R ratio
In our experiments, deviation from unity in theGPP:R ratio indicates temporal decoupling of GPP fromR. Comparison of ratios from the first and last days ofthe experiments revealed that decoupling occurredafter the addition of nutrients in all experiments. Repli-cate control treatments maintained a GPP:R ratio of ~1or slightly less than 1 throughout the experiment,whereas the 10% nutrient addition increased this ratio
4- to 20-fold. These results indicate that rates of GPPincreased faster than rates of R following nutrient addi-tion. The result is an increase in NCP and a shift incommunity metabolism from net heterotrophy to netautotrophy.
Similar to rates of production, the GPP:R ratios didnot increase predictably with increasing nutrient per-turbation. In Expt I, the ratio increased approximately4-fold between the 5 and 10% additions, whereas inExpt II, the GPP:R ratio varied by less than a factorof two over the course of the experiment. Expt IIIshowed similar increases in rates of production be-tween the 5 and 10% additions, suggesting that factorsother than the magnitude of nutrient addition influencecommunity response to nutrient inputs. The composi-tion of the initial plankton assemblage (including thecoupled relationships of predators and prey) likely de-termined the magnitude of biomass accumulation andcoincident nutrient drawdown in these experiments.
72
Nitr
ate+
nitr
ite (µ
mol
m–3
)
401990 1992 1994 1996 1998 2000 2002 2004
(a) Nitrate+nitrite
(b) Phosphate
Pho
spha
te (µ
mol
m–3
)
40
80
120
160
200
0
Year1990 1992 1994 1996 1998 2000 2002 2004
0
10
20
30
Fig. 7. Stn ALOHA: concentration climatology of (a) nitrate+nitrite (N+N), and (b) phosphate (PO4
3–). Average concentra-tions of N+N and PO4
3– between 0 and 50 m plotted overtime. Observed magnitude of nutrient input at Stn ALOHA issimilar to nutrient concentrations added in our experimental
manipulations

McAndrew et al.: Net metabolic balance of the open ocean
Plankton community structure and dynamics
Based on the 17 yr data set from Stn ALOHA, thechl a-containing plankton community is dominatedby Prochlorococcus spp., which also contains chl b,with negligible contributions from diatoms that alsocontain chl c (Letelier et al. 1993). After the additionof nutrients, chl a and c increased exponentially,whereas chl b generally decreased. Large increasesin chl a and c were observed in the larger planktonsize fractions. For example, cell counts from Expt IIIindicated a significant increase (approximately 1order of magnitude) in photosynthetic picoeukaryotes(~2 to 20 µm diameter). Similarly, size-fractionatedchlorophyll samples from Expt V confirmed that thegrowth of the larger size class of plankton (>10 µm)was selectively stimulated by the addition of nutri-ents.
The phenomenon whereby large phytoplanktonare selectively stimulated by nutrient injection eventshas been previously studied and modeled by Gold-man (1993), who showed that phytoplankton largerthan 50 µm in size contributed disproportionatelyto new production in the euphotic zone afternutrient addition. In the >10 µm size fraction ofExpt V, chl a increased by a factor of 10 while chl cincreased 5- to 10-fold. Size-fractionated primaryproduction measurements from the same experimentindicate a 10-fold increase in C assimilation by the>10 µm size fraction throughout the course of theexperiment.
Diatoms appear at least partially responsible for theobserved increase in chl c in the >10 µm size fraction.This conclusion is supported, in part, by net changes inN+N:SiO2 drawdown ratios. In a system where diatomsare dominant, the N+N:SiO2 uptake ratio shouldapproach unity (Brzezinski 1985). In Expt II, theN+N:SiO2 drawdown ratio approached unity as theamount of nutrient added increased (0.59 and 0.73, for5 and 10% additions, respectively). Silica drawdownwas greater than nitrate drawdown after the additionof nutrients, suggesting that diatom growth may havebeen limited by nitrogen rather than by silica (Harrisonet al. 1976, 1977).
The unamended controls from Expts I to IVshowed increases in chl a concentration (average μ =0.09 d–1) despite no nutrient addition. If our experi-mental design excluded predators and altered thetrophic dynamics in the water sample, this wouldpresumably influence the net growth rate of controlsand nutrient-amended treatments alike. This couldaccount for the observed increase in growth rate incontrols. In all experiments, the addition of nutrientssignificantly increased net growth above that of con-trols (p = 0.001).
Metabolic balance
It has been hypothesized (Karl et al. 2003, Williamset al. 2004) that metabolic balance in the open oceanis maintained by aperiodic, large magnitude net auto-trophic events and that frequent, if not continuous,sampling is necessary to obtain an accurate estimate ofthe seasonal and annual net metabolism of the openocean. Our perturbation experiments clearly docu-mented shifts from GPP ≈ R to GPP >> R, following theaddition of nutrient-rich waters. Moreover, our resultssuggest that nutrient additions can cause large alter-ations in the net metabolic balance of oligotrophic sur-face waters on relatively short (<1 wk) time scales.
In a system in which intermittent net autotrophicevents fuel a more constant state of net heterotrophy,the probability of observing the system in a net hetero-trophic metabolic state would be much greater thanobserving it in a net autotrophic state. We demon-strated that autotrophic events can be large in magni-tude but short in duration. Therefore, to understandthe metabolic balance of a system, it is important toknow the magnitude and duration of net autotrophicevents in order to calculate how long a period of netheterotrophic metabolism can be supported. The prob-ability of incorrectly characterizing the metabolic stateof a system as a result of using in vitro techniques wasdiscussed by Karl et al. (2003). These authors alsonoted that it is difficult to determine the magnitudeand duration of net autotrophic events even with amonthly sampling scheme, such as the HOT programfollows, as sampling is too infrequent.
Short-term (daily time scale) bursts of photosyntheticproduction reflect non steady-state processes initiatedby alterations in bottom-up or top-down plankton pro-cesses. Such alterations could include introduction of alimiting nutrient or nutrients (either from below themixed-layer or by atmospheric deposition); temporalvariations in the relationships between predators (in-cluding viruses) and their prey; or by physical forcingof key habitat parameters (e.g. variations in light). Ofthese, episodic delivery of inorganic nutrients to themixed-layer of low nutrient systems partly explainshigh frequency variations in photosynthetic production(Aristegui & Harrison 2002). Nutrient input to theeuphotic zone could result from any of a numberof possible mesoscale phenomena including internalwaves (Garrett 2003, Gregg et al. 2003), eddies (Fal-kowski et al. 1991, McGillicuddy et al. 1998, 1999,Gonzalez et al. 2001, Seki et al. 2001), subtropicalfronts (Gonzalez et al. 2001) or Rossby waves (Uz etal. 2001, Sakamoto et al. 2004).
Our experiments revealed that photosynthesis andrespiration can be temporally decoupled throughnutrient enrichment. In addition, our results provided
73

Mar Ecol Prog Ser 332: 63–75, 2007
indications of the time scales of potential responsesto periodic, bottom-up ecosystem forcing at StnALOHA. To fully understand how such processes alterecosystem metabolism, it is essential to quantify therate of decoupling between auto- and heterotrophicprocesses. Our results indicated that over short timescales (3 to 4 d), the response of R is slower than thatof GPP.
Further research will be necessary to fully examinethe question of metabolic balance in the open oceanand how temporal decoupling of metabolic processesmay bias our measurement of NCP. In particular,determination of how plankton community composi-tion (including the size spectrum of plankton assem-blages) responds to nutrient perturbations will beessential to establishing how important nutrient en-richment events are to open ocean ecosystem metabo-lism. The decoupling of photosynthesis and respirationby nutrient availability could provide one mechanismfor apparent imbalances in GPP and R in oligotrophicecosystems; however, it is unlikely that such bottom-upforcings are the sole basis for the observed imbalances.
Acknowledgements. We thank the HOT program staff and A.Shea for their assistance with analysis of samples, and thecaptain and crew of RVs ‘Revelle’ and ‘Kaimikai-O-Kanaloa’.We also thank the US National Science Foundation (OCE 03-26616 and OCE 99-81313) and the Gordon and Betty MooreFoundation for funding, and C. Duarte and 2 anonymousreviewers for comments on the manuscript.
LITERATURE CITED
Abell J, Emerson S, Renaud P (2000) Distributions of TOP,TON and TOC in the North Pacific Subtropical Gyre:implications for nutrient supply in the surface ocean andremineralization in the upper thermocline. J Mar Res 58:203–222
Aristegui J, Harrison WJ (2002) Decoupling of primary pro-duction and community respiration in the ocean: implica-tions for regional carbon studies. Aquat Microb Ecol 29:199–209
Armstrong FA, Sterns CR, Strickland JSH (1967) Themeasurement of upwelling and subsequent biologicalprocesses by means of the Technicon Autoanalyzer andassociated equipment. Deep-Sea Res 14:381–389
Behrenfeld MJ, Esaias WE, Turpie KR (2002) Assessment ofprimary productivity at the global scale. In: Reynolds CS(ed) Phytoplankton productivity: carbon assimilation inmarine and freshwater systems. Blackwell ScientificPublishers, London, p 156–186
Brzezinski MA (1985) The Si:C:N ratio of marine diatoms:interspecific variability and the effect of some environ-mental variables. J Phycol 21:347–357
Campbell L, Vaulot D (1993) Photosynthetic picoplanktoncommunity structure in the subtropical North PacificOcean near Hawaii (Station ALOHA). Deep-Sea Res I 40:2043–2060
Campbell L, Nolla HA, Vaulot D (1994) The importance ofProchlorococcus to community structure in the centralNorth Pacific Ocean. Limnol Oceanogr 39:954–961
Carritt DE, Carpenter JH (1966) Comparison and evalua-tion of currently employed modifications of the Winklermethod for determining dissolved oxygen in seawater;A NASCO report. J Mar Res 24:286–318
Church MJ, Ducklow HW, Karl DM (2002) Multiyear in-creases in dissolved organic matter inventories at StationALOHA in the North Pacific Subtropical Gyre. LimnolOceanogr 47:1–10
Dachs J, Calleja M, Duarte C, del Vento S, Turpin B, PolidoriA, Herndl G, Agusti S (2005) High atmosphere-oceanexchange of organic carbon in the NE subtropical Atlantic.Geophys Res Lett 32:L21807, doi:10.1029/2005GL023799
del Giorgio PA, Duarte CM (2002) Respiration in the openocean. Nature 420:379–384
del Giorgio PA, Cole JJ, Cimbleris A (1997) Respiration ratesin bacteria exceed phytoplankton production in unpro-ductive aquatic systems. Nature 385:148–151
Duarte CM, Agusti S (1998) The CO2 balance of unproductiveaquatic ecosystems. Science 281:234–236
Emerson S, Quay PD, Stump C, Wilbur D, Schudlich R (1995)Chemical tracers of productivity and respiration inthe subtropical Pacific Ocean. J Geophys Res 100:15873–15887
Emerson S, Stump C, Johnson B, Karl DM (2002) In situ deter-mination of oxygen and nitrogen dynamics in the upperocean. Deep-Sea Res I 49:941–952
Falkowski PG, Ziemann D, Kolber Z, Bienfang PK (1991)Role of eddy pumping in enhancing primary productionin the ocean. Nature 352:55–58
Garrett C (2003) Mixing with latitude. Nature 422:477–478Goldman JC (1993) Potential role of large oceanic diatoms in
new primary production. Deep-Sea Res I 40:159–168Gonzalez N, Anadon R, Mourino B, Fernandez E, Sinha B,
Escanez J, Armas DD (2001) The metabolic balance of theplanktonic community in the North Atlantic subtropicalgyre: the role of mesoscale instabilities. Limnol Oceanogr46:946–952
Gregg MC, Sanford TB, Winkel DP (2003) Reduced mixingfrom the breaking of internal waves in equatorial waters.Nature 422:513–515
Hansell DA, Bates NR, Carlson CA (1997) Predominanceof vertical loss of carbon from surface waters of theequatorial Pacific Ocean. Nature 386:59–61
Harrison PJ, Conway HL, Dugdale RC (1976) Marine diatomsgrown in chemostats under silicate or ammonium limita-tion. I. Cellular chemical composition and steady stategrowth kinetics of Skeletonema costatum. Mar Biol 35:177–86
Harrison PJ, Conway HL, Davis CO (1977) Marine diatomsgrown in chemostats under silicate or ammonium limita-tions. III. Cellular chemical composition and morphologyof Chaetoceros deblis, Skeletonema costatum, and Thalas-siosira gravida. Mar Biol 43:19–31
Holm-Hansen O, Lorenzen CJ, Holmes RW, Strickland JDH(1965) Fluorometric determination of chlorophyll. J Cons30:3–15
Juranek L, Quay P (2005) In vitro and in situ gross primaryand net community production in the North PacificSubtropical Gyre using labeled and natural abundanceisotopes of dissolved O2. Global Biogeochem Cycles 19:GB3009, doi:10.1029/2004GB002384
Karl DM, Lukas R (1996) The Hawaii Ocean Time-series(HOT) program: background, rationale and field imple-mentation. Deep-Sea Res II 43:129–156
Karl DM, Tien G (1992) MAGIC: a sensitive and precisemethod for measuring dissolved phosphorus in aquaticenvironments. Limnol Oceanogr 37:105–116
74

McAndrew et al.: Net metabolic balance of the open ocean
Karl DM, Hebel D, Bjorkman K, Letelier R (1998) The role ofdissolved organic matter release in the productivity of theoligotrophic North Pacific Ocean. Limnol Oceanogr 43:1270–1286
Karl DM, Laws EA, Morris P, Williams PJleB, Emerson S(2003) Metabolic balance of the open sea. Nature 426:32
Letelier RM, Bidigare RR, Hebel DV, Ondrusek M, Winn CD,Karl DM (1993) Temporal variability of phytoplanktoncommunity structure based on pigment analysis. LimnolOceanogr 38:1420–1437
Letelier RM, Dore JE, Winn CD, Karl DM (1996) Seasonaland interannual variations in photosynthetic carbon assi-milation at Station ALOHA. Deep-Sea Res II 43:467–490
Marra J (1978) Phytoplankton photosynthetic response tovertical movement in a mixed layer. Mar Biol 46:203–208
Marra J (2002) Approaches to the measurement of plank-ton production. In: Reynolds CS (ed) Phytoplanktonproductivity: carbon assimilation in marine and fresh-water ecosystems. Blackwell Scientific, Cambridge,p 78–108
McGillicuddy DJ, Robinson AR, Siegel DA, Jannasch HW and5 others (1998) Influence of mesoscale eddies on new pro-duction in the Sargasso Sea. Nature 394:263–266
McGillicuddy DJ, Johnson R, Siegel DA, Michaels AF, BatesNR, Knap AH (1999) Mesoscale variations of biogeo-chemical properties in the Sargasso Sea. J Geophys Res104:13381–13394
Monger BC, Landry MR (1993) Flow cytometric analysis ofmarine bacteria with Hoechst 33342. Appl Environ Micro-biol 59:905–911
Najjar RG, Keeling RF (2000) Mean annual cycle of the air-seaoxygen flux: a global view. Global Biogeochem Cycles 14:573–584
Sakamoto CM, Karl DM, Jannasch HW, Bidigare RR and 5others (2004) Influence of Rossby waves on nutrientdynamics and the plankton community structure in theNorth Pacific Subtropical Gyre. J Geophys Res 109:C05032, doi:10.1029/2003JC001976
Seki MP, Polovina JJ, Brainard RE, Bidigare RR, Leonard CL,Foley DG (2001) Biological enhancement at cycloniceddies tracked with GOES thermal imagery in Hawaiianwaters. Geophys Res Lett 28:1583–1586
Serret P, Fernandez E, Sostres J, Anadon R (1999) Seasonalcompensation of microbial production and respiration ina temperate sea. Mar Ecol Prog Ser 187:43–57
Serret P, Fernandez E, Robinson C (2002) Biogeographic dif-ferences in the net ecosystem metabolism of the openocean. Ecology 83:3225–3234
Sherr EB, Sherr BF (1996) Temporal offset in oceanic produc-tion and respiration processes implied by seasonal changesin atmospheric oxygen: the role of heterotrophic microbes.Aquat Microb Ecol 11:91–100
Smith KL, Baldwin RJ, Karl DM, Boetius A (2002) Benthic com-munity responses to pulses in pelagic food supply: NorthPacific Subtropical Gyre. Deep-Sea Res I 49:971–990
Smith SV, Mackenzie FT (1987) The ocean as a net hetero-trophic system: implications from the carbon biogeochem-ical cycle. Global Biogeochem Cycles 1:187–198
Strickland JDH, Parsons TR (1972) A practical handbook ofseawater analysis. Fisheries Research Board of Canada,Ottawa
Uz BM, Yoder JA, Osychny V (2001) Pumping of nutrients toocean surface waters by the action of propagating plane-tary waves. Nature 409:597–600
Welschmeyer NA (1994) Fluorometric analysis of chlorophylla in the presence of chlorophyll b and pheopigments.Limnol Oceanogr 39:1985–1992
Williams PJleB, Bowers DG (1999) Regional carbon imbal-ances in the oceans. Science 284:173–174
Williams PJleB, Jenkinson NW (1982) A transportable micro-processor-controlled precise Winkler titration suitable forfield station and shipboard use. Limnol Oceanogr 27:576–584
Williams PJleB, Morris PJ, Karl DM (2004) Net communityproduction and metabolic balance at the oligotrophicocean site, Station ALOHA. Deep-Sea Res I 51:1563–1578
75
Editorial responsibility: Barry and Evelyn Sherr (ContributingEditors), Corvallis, Oregon, USA
Submitted: December 12, 2005; Accepted: July 31, 2006Proofs received from author(s): February 21, 2007