Embed Size (px)
Citation preview

Mei,1991
FACULTEIT ELEK'l'ROTECHNIEKTECHNISCHE UNIVERSITEITEINDHOVENVAKGROEP MEDISCHE ELEKTROTECHNIEK
EEG Analysisfor Monitoring ofAnesthetic Depth
door Maarten van de Velde
Rapport van het afstudeerwerkuitgevoerd van september 1990 tot mei 1991in opdracht van prof. dr. ir. J.E.W. Benekenonder begeleiding van dr. ir. P.J.M. Cluitmans
DE FACULTEIT OER ELEKTROTECHNIEK VAN DE TCCHNISCHE
UNIVERSlTEIT EINDHOVEN AANVAAROT GEEN AANSPRAKEUJKHEJD VOORDE INHOUD VAN STAGE- EN AFSTUDEERVERSLAGEN

This report was submitted in partial fulfillment of the requirements for the degree of Master ofElectrical Engineering at the Eindhoven University of Technology, Eindhoven, The Netherlands
The work was carried out from September 1990 until May 1991 under responslbi/ityof ProfessorJ.E.W Beneken, Ph. D., at the Division of Medical Electrical Engineering, Eindhoven University
of Technology, under supervision of P.J.M. Cluitmans, Ph. D.
t£B Bibliotheek Technische Universiteit Eindhoven
dit werk uilerlijk terugbezorgen op laatst gestempelde datum
27 ofichlJ 011
?L ..lUll 1996
2(2 nc:..'~~f/1.IJJ'
.i~ '.. :~ V'J\ ~\ b(~
,(.< r,f 1J~1
2 0 l7C/vtJ1) t~ Z<.t<lL

Preface
During the research work at the TUE I received some wonderful response from
several people helping me resolve some problems. For that reason, this page is
reserved for giving credit to those resources.
First of all, I would like to thank Professor Beneken for enabling me to do this
graduation work within his research team, and for his being an inspiring tutor in
the multi-disciplinary field of biomedical engineering.
Then I also adress warm thanks to dr. Pierre Cluitmans, for his reliable
guidance, and for letting brain waves of mine come into being by giving
constructive criticism.
The staff of the division "EME" provided a pleasant and supportive
working-atmosphere, something' appreciate very much.
My family must be mentioned here: they were a comfort throughout my study
and therefore contributed in numerous wEt'fS. Special thanks goes to my father,
who gave some good advice and practical assistance, all of which aided to a
well-structured work.
Special words of thanks also go to Nicole wholeheartedly, for her total support,
interest and help in many wfltls.

· 'Samenvatting afstudeerverslllg Mllarten van de Velde (Mei 1991) "EEG analysis for monitoring of lJIIesthetic depth"
Samenvatting
Het hoofdonderwerp van dit verslag is "EEG analyse". Hiervoor is een nieuwsoftware pakket ontwikkeld dat het mogelijk maakt om EEG signaJen teonderzoeken. EEG spectrum analyse en parameters afgeleid van het EEGkunnen flexibel worden geevalueerd.
Dit afstudeerwerk werk is verricht binnen een onderzoeksproject wat tot doe!
heeft automatisch "anesthesie diepte" te bepalen tijdens operaties. Het project isvoornamelijk gericht op zogenaamde "auditieve evoked potential" studies, enwordt nu uitgebreid met EEG analyse. Anesthesie onderzoek in zijna1gemeenheid en opgeslagen EEG metingen verkregen uit eerder gedanestudies vormden de uitgangspunten bij dit onderzoek.
Het ontwikkelde EEG analyse pakket is getest en geevalueerd met behulp vande genoemde EEG metingen, en hieruit kan worden geconcludeerd dat hetprogramma goed voldoet voor het gestelde doel: EEG analyse. Correlaties vande onderzochte parameters met anesthesie diepte kunnen worden aangetoond,
maar algemene uitspraken hieromtrend kunnen niet worden gegeven.

Summel)')All:' wa to • t Ut ".
Summary
vtn uuttln , " n,h
The main sUbject in this report is "EEG analysis". Foe this purpose 8 newsoftware application was developed that enables investigation of parameters
derived from EEG signals and provides flexible spectrum evaluation of EEG
data.
The work was carried out within a research project that aims at automatic
assessment of "anesthetic depth" during surgical procedures. The project is
mainly concerned with so called "auditory evoked potential" studies, and is nowextended into the field of EEG analysis. Previous anesthesia research and the
EEG data measured during recent studies were taken as starting points for this
study.
The developed EEG analysis application was tested and evaluated through
analysis of the data mentioned, and we may conclude that the program serves
its purpose well. Investigated EEG parameters show coerelations with anesthetic
depth, although general applicable conclusions cannot be drawn.

vii__,"_\111 , _, _
Contents
Preface iii
Summary v
1 Introduction.. 11.1 Monitoring in anesthesia 11.2 The Servo-anesthesia project 3
1.2.1 Anesthetic depth research 3
1.2.2 A perspective on the project 4
2 EEG Monitoring In Anesthesia 72.1 The electroencephalogram 7
2.2 Analysis techniques 92.3 Interpreting the (processed) EEG 12
2.3.1 Anesthesia levels in the EEG 12
2.3.2 Clinical depth of anesthesia 142.3.3 Additional considerations 15
2.4 Evaluation & discussion 16
3 CCSA: a apec:tral analysis tool 193.1 Application requirements 19
3.1.1 General provisions I layout 19
3.1.2 Data processing requirements 21
3.1.3 Interactive parameter adjusting 223.2 Building the EEG analysis application 24
3.2.1 Software development 243.2.2 Program portability 24
3.3 Summary .. 25

viii, ,tit us M"''h '" ) $ t II HI' ,
EEG .~Iy•• for monitoring ofaMah.lie dtlptI!l'.....
4 Algorithm development 274.1 Starting points: pr8\llous clinical studies 27
4.1.1 Measuring equipment 274.1.2 Session protocol ••.• .••..... 284.1.3 Data specification ...•.....••.•• 29
4.2 Signal processing 304.2.1 lime domain processing: pre-filtering 314.2.2 lime domain processing: windolNing 334.2.3 Transformation to frequency domain 364.2.4 Specific parameter calculation 384.2.5 Display of spectra 39
4.3 Data analysis .. 404.3.1 Data on file 404.3.2 Real time adaptations 40
5 Testing the CCSA program 435.1 Computational aspects .•.. ..•... 43
5.1.1 Data testset •... 435.1.2 Testing procedure ..•....... 44
5.1.3 Processing accuracy ., 46
5.2 Testing the usage of the application 48
6 EEG analysis .. 496.1 Anesthetic depth assessment 49
6.1.1 Quantitative correlations ..•. 496.1.2 Custom parameters 52
6.2 Using the CCSA application 536.2.1 Overall performance 536.2.2 Completeness of analySis options 54
6.3 Summary .. 54
7 Conclusions ....•... 577.1 General evaluation 577.2 Annotations 58
7.2.1 Future use of the CCSA program .........• 587.2.2 Development of extensions 58
7.3 Final remarks 59

, ... ,. t
GI0888ry ,. 61
References 65
A. Description of the CCSA program &display layoutB. Flow chart of the CCSA menu structure _C. Calculation at the FIR filter transfer valueD. Frequency transformation: Fourier versus Hartley _
7375n79

1 Introduction
DIntroduction
1
The purpose of the study "EEG analysis in anesthesia" is the extension of amethod to measure the functioning of tile central nervous system (eNS) ofanesthetized persons undergoing a surgical procedure. For better understandingof the objective of the project a brief perspective on tile subject and theframework of tile research will be described below.
1.1 Monitoring In anesthesia
During surgical procedures anesthetics are being used allover the globe. This
widespread use of anesthetic agents ha5 grown simultaneousJy with the
recognition of the need for patient monitoring during the state of narcosis.
Already before 1850 the anesthetic properties of substances like ether andchloroform were discovered, and soon these drugs were Introduced asanesthetics. The monitoring and registration of vital signs of patients however,
began only in the second half of the 19th century, but ever since the registration
of patient parameters is seen as a necessity and ha5 been In constant
development [Booij. 1989]. Nowadays, anesthesiologists monitor quite 8 fewclinical parameters, amongst which especially the respiratory and circulatory
functions are important. They also try to establish and maintain 8 certain "level"of anesthesia: the patient should not notice anything of the operation but also
must not be too "deeply· anesthetized, for this may cause permanent
physiological damage or 8 delayed recovery.

2..... ""UIUIi:
General anesthesia is divided into several stages in relation to clinical signs,
from pre-operative stage, after a premedication Is administered to the patient, tothe maintenance stage of anesthesia The levels of anesthesia are more difficult
to recognize with the use of modern, balanced anesthesia techniques. These
techniques use a combination of drugs each of which depresses one of the fourcomponents of anesthesia: either sensory block (analgesia), motor block
(relaxation), reflex block or mental block (amnesia) [Booij, 1989]. The deductionof good conclusions about the influence of a specific anesthetic on the level of
anesthesia can be complicated by the occurrence of si~etfectscaused by thedrug, e.g. most analgesics also affect mental block.
The last three decades many investigators have reported the incidence ofunnoticed awareness during surgery. This undesirable phenomenon may occur
during any phase of an operation, although some special categories of surgery(where lower dosages of anesthetics are used) sl'lc7tv a higher incidence of
awareness or recall than other types of surgery (see for instance Blacher [1984],Bogetz et aI. [1984] and Booy [1989]). Anesthetists may overlook such a state ina patient because of the lack of a simple means to assess depth of anesthesia,
especially the state of awareness in a patient [Cluitmans, 1990). The mainapproach to improve monitoring of anesthetic depth is neurophysiologicalmonitoring. Research in this field is mainly concerned with e1ectroencephaJe>gram analysis and evoked potential studies:
o Electroencephalogram (EEG) analysis is the interpretation of brain waves
recorded from the scalp by means of studying the raw EEG or bycalculating EEG derivatives: e.g. frequency or power distribution,
amplitude, correlations between recorded signals, etc. An importantapplication of analysis of the electroencephalogram Is the use of such
techniques in operations where the flow of blood to the brain may beendangered; cerebral ischemia Qnsufficient b100dfIow) and/or hypoxia
(oxygen deficiency) may occur.
o In evoked potential (EP) studies a senscxy organ of a patient is stimulated
while recording the electroencephalogram. When muttiple stimuli aregiven and the electrical activity is recorded after each stimulus, consistent
potential changes can be recorded by averaging the responses, thus
eliminating background activity. These potential changes, recorded as
waveforms on the EEG, are very similar In all humans [Pryse-Phillips,1989].
During the last ten or fifteen years, monitoring-research has grown considerablybecause of the new technological possibilities towards computerization in the
operating room.

1 IntroductionIIUUI
1.2 The Servo-anesthesia project
3
The division of Medical Electrical Engineering at the Eindhoven University ofTechnology Initiated the project "Servo-anesthesia" to be able to contribute to
research in patient monitoring, especially in supporting the task of the
anesthesiologist. The goal of this project is to determine whether automation ofnarcosis in the operating room is feasible and useful, and if so, how this can beachieved.
1.2.1 Anesthetic depth research
One of the studies performed within the project is the research-program
Neurophysiological monitoring of .nesthetlc depth. Till now, main interest
has been in the study of the influence of anesthetics on auditory evoked
potentials (AEPs) and the Improvement of the method for measuring these
signals from the auditory nervous pathway by applying both the conventional
and a new, a non-linear analysis (NLA) EP technique, where random "trains' ofimpulses are used. A pilot study on eats and a clinical study with humansshowed promising results for the Mure, and a broadening of the !:tudy was
recommended, for this may improve the reliability and drug-independency of the
technique [Cluitmans, 1990].
A data-acquisition system and a database system were developed. part of this
study. The Event Recording and Data Acquisition system (ERDA) and the
Electrophysiologic Monitoring DAtaBase System (EMDABS) enabled the
research team to collect and store all relevant data during the operations where
the evoked potential techniques were being applied [De Jong, 1986; Kuipers,1991; Pfaffenhofer et aI., 1991]. Since the calculation (or ~lteringj of evoked
potentials from the EEG needs a large number of responses for averaging. one
comes to think of the information that Is not being used, i.e. the raNelectroencephalogram. Research throughout the years has Implicated the
possible relational aspects of the EEG when referring to levels of anesthesia.
When considering aNareness however, publications are less clear; obviously the
relation between "levels' and awareness during anesthesia is more difficult to
establish. Research on 8 broad scientific basis also Is handicapped by the
differences in the usage of drugs and therefore by the cfiffererd conclusions, in
spite of the sometimes promising results.

4...,,,,, n "'n~nu, I t .. Aduna an I' , II
EEG ."'Iy~. for monitoring of.,• .",.tic depth
.The stored data enables us tOPfQC~SJhe rflW EEGs that were measured during
the studies, and thus provides for a combined study Of auditory evoked
potentials and EEG analysis. This report will concentrate on the latter subject:
EEG analyala for monitoring of anesthetic depth, and especially on the
development of a means to analyse EEG signalS/parameters, In order to search
for correlates with anesthetic depth.
A description of the EEG analysis tools obtained after Investigation of research
In this field (chapter 2), and elaborated in general (chapter 3) and in
mathematical detail (chapter 4). Testing of the tool through actually analyzing
EEG signals is described in chapters 5 and 6. Conclusions from this research
are presented in the final chapter 7.
1.2.2 A perspective on the project
The "Monitoring of anesthetic depth" project, as part of the Servo-anesthesia
project, will tend to increase in proportions, because of the complex matters
Involved. If parallel processing of the e1earoencephalogram and evoked
potentials (esp. auditory EPs) can be accomplished, It will still be of importance
to try to extract features relating to anesthetic depth automatically. Pattern
recognition techniques may be used by applying artificial neural net models to
the AEP complexes.
Another important factor is the improvement of signal validation and automatic
detection and removal of artifacts. Already some algorithms are available
[Jansen, 1989), but in the future reliable data acquisition must also be enabledduring d'rfficult conditions like electrosurgery [e/unmans, 1990; Prank, 1986].
The ultimate goal of the research is to make a closed loop system, which
measures and interprets patient parameters and controls the administration ofanesthetic agents. Many of the quality control steps performed manually todaywill be done automatically [Levy et al., 1984].lhe Incorporation Of an adaptive
control system can be seen as a major development, but the use of automatic
control lies in the future [Rampil et a/., 1984]. This can only be done by taking
Into account all factors Influencing the EEG. Further research has to be carried
out for documenting quantitatively the relevant relationships of the variables
invotved [Prank, 1986). The database system EMDABS will make this possible.
When looking at the amount and sort of Information to be processed for
Interpretation by such a control system, 8 tendency grows to think of an expert
systems approach for the overall design of the anesthesia-monitoring system.

1 Introduction 5
The knowledge and expert system toolbox developed In previous work in the·Servo-anesthesia" project may be used for this application [Van der As. 1990;Blom. 1990].
The use of EEG for peri-operative patient monitoring systems is thought of ashavi~ become a practical proposition with advances in technology for analysisand display. Many applications of EEG which were pioneered in the early yearsof EEG monitoring are re-evaluated [Prank, 1986]. With technical problemssolved, It should be possible to develop an objective, reliable system forintraoperative monitoring of the mental state of anesthetized persons [Cluitmans,7990].

6 EEG .".Iy~. for monitoring ofMeathetic dflpth
M.e. Escher: Detail of "Hoi 6- Bol" ("Convex 6-Conmve"),1955
~ 1955 M.e. Escher / Cordon Art - &am - Holland

2 EEG monitoring in an"the,iII
~ EEG Monitoring in Anesthesia
7" l~
This chapter first describes some basic considerations about the EEG andwhat mechanisms Hreflects. and then summarizes some techniques that can beused to process the EEG. A review of general basic EEG research, as well asrecent anesthesia research is presented in the third paragraph. An evaluationcloses the chapter.
2.1 The electroencephalogram
The first recording of an electroencephalogram was made in 1929 by 8 German
named Hans Berger. Since then 8 lot of researchers have investigated the value
and usefulness of this visualized brain activity. In order to be able to measure
the EEG uniformly 8 standard has been defined by the international 1D-20system which specifies the placement of 22 electrodes on the scalp [Spehlman.1981]. The use of such numbers of electrodes however, is not convenient during
surgery and will not help for 8 fast introduction In the operating room of anyanesthesia monitor. For an application In the operation theatre like the
monitoring-system the Serv~anesthesiaproject aims at, only 8 few electrodes
should be necessary.
Spehlmann [1981] gives 8 simple but clear description of the EEG: .the source
of the electroencephalogram are electrical potentials generated by nerve cells in
the cerebral cortex In response to various kinds of Input, Including those from
pacemakers of rhythmical activity In the depth of the brain. These fluctuating
BI 11 U' III ..., ..,~••• to ....,!lII'-, 1
EEG .na/yai, for monitoring ofenelth.ric tJ.pth
potentials summate and penetrate to the scalp where they can be recorded asthe scalp EEG".
The electrical activity of the cortical neurons Is mainly depender1 on theirmetabolism [Pronk. 7986] and, due to coherence. for some groups of n8UfQr\5
also on the mental state of a person; consider for Instance a stale of selectiveattention in hearing: the physiological signs In the attended charvlel (the left orright ear) can be shown to be larger [Mccallum. 1~. Measuring this neuronalactivity thus provides a means for Interpreting the metabolism of the brain and tosome extent the level of arousal or attentiveness of a person. For examplethrough concussion or anesthesia, the resulting reduction of the activity of thenervous system may lead to confusion or unconsciousness. Even then, It could
still be possible for the senses to pass messages to the brain over the directneural pathways. The brain Is functioning through highly complex mechanismsof which only little activity is measured by scalp electrodes, and consequentJy
only a small amount of information can be extracted from the EEG.
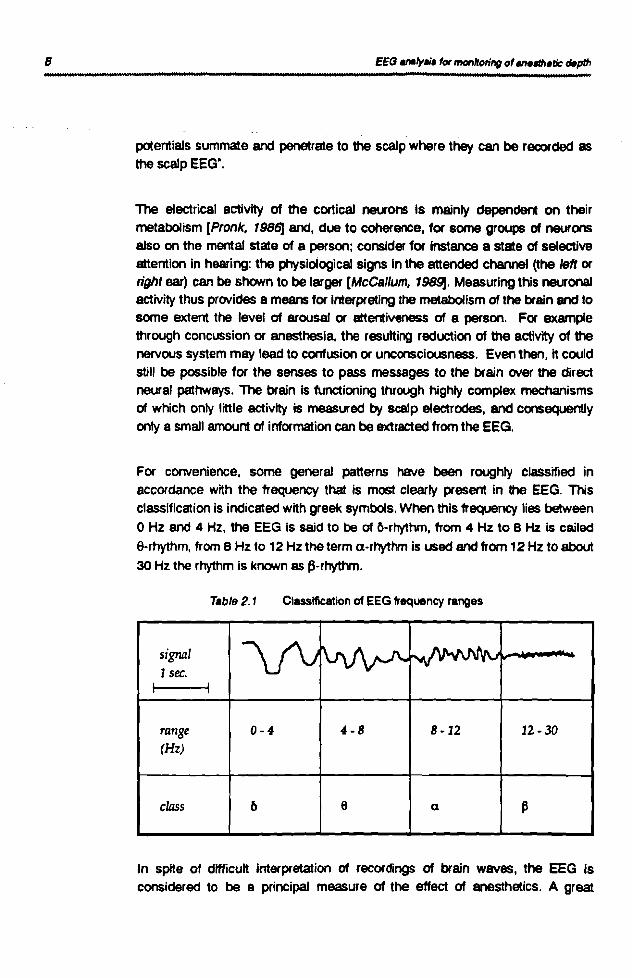
For convenience, some general patterns have been roughly classified inaccordance with the frequency that is most clearly present in the EEG. This
classification is indicated with greek symbols. When this frequency lies between
oHz and 4 Hz, the EEG Is said to be 01 C)-rhythm, from 4 Hz to 8 Hz Is cailed
a-rhythm, from 8 Hz to 12 Hz the term a-rhythm is used and from 12 Hz to about
30 Hz the rhythm is kl'lONfl as p-rhythm.
Classification of EEG frequency ranges
signal1 set:.
I
range(Hz)
class
0-4 4-8
9
8-12
a
12 -30
In spite of difficult Interpretation of recordings of brain waves, the EEG isconsidered to be a principal measure of the effect of anesthetics. A great

2 EEG monitoring in .".,th••ilJ 9"tttH. , t
advantage of this approach to monitoring of anesthetic depth is Its applicability
with both inhaled and injected agents [Eger, 1984].
2.2 Analysis techniques
The most important automated analysis technique 10r processing the EEG is
apectral analyala; i.e. the calculating of different frequency components of the
EEG. This is usually done by Fourier analysis. The resulting spectrum can be
displayed in several ways, of which the "compressed spectral array" (CSA)[Bickford et a/., 1972; Bickford et a/., 1973; Bickford, 1979] is most commonly
used. This is 8 pictorial of EEG-1requencies. in which the EEG power spectrum
of several electrode-channels is displayed semi-3-dimensiona/: spectra are put
"behind" each other in chronological order, and placed in an array on display
according to the electrode position (see figure 2.1). One disadvantage of the
CSA may be the somewhat indistinct presentation of the time-axis, which may
obscure the relation time versus power. This relation is restored in an alternative
•, , , , ,
••, , , I ,
iiiI
Figure2.1 Example at a 'Compressed Spectral Arr",,'(from Bickford [1979))

b061 at .""
10 EEG enafy". for monhoring of."• ."..Iic depth..
display (see figure 2.2): the density spectral array (DSA), where the relativepower values are indicated with smaller or larger dots [Levy et a/., 198OJ.
ca. Da.
o ..
~.... " '.' ~.
;",j'" .' -T :~.. _. . .: .. :. . ..
. -;';"~. ~
• ..:a... :. • i ..·a ....••KCIlUK"C" •• ...
Figure 2.2 CSA and DSA display(from Levy.t a/. (1980))
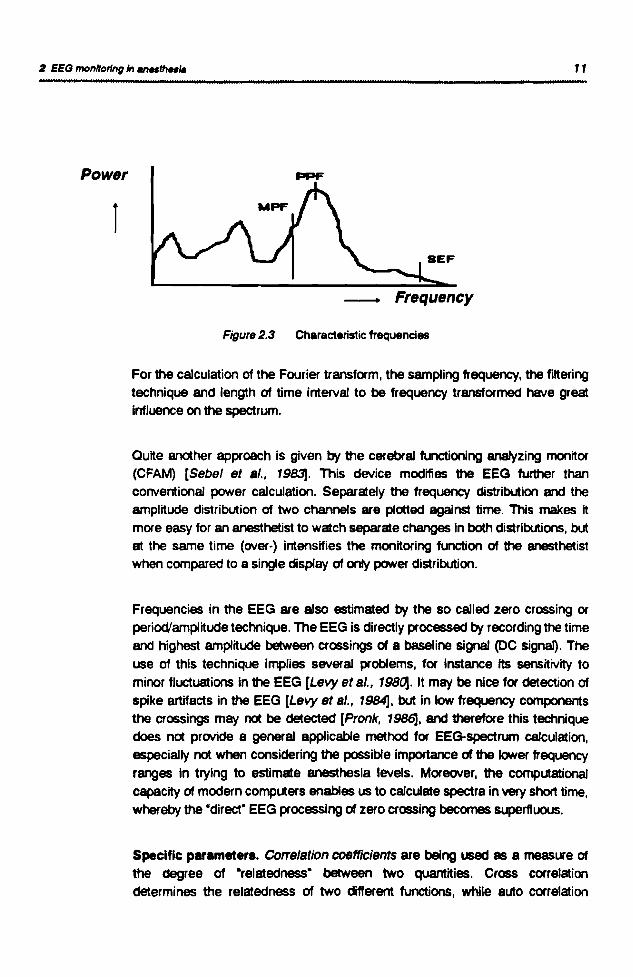
Several char.cterlstlc frequencies of the EEG spectrum have become knownunder specific names [/nterspec Inc.• 1985]:
• The peak power frequency (pPF).This is the frequency of the largest power component.
The spectral edge frequency (SEF).The largest frequency at which still a significant amount of power ispresent is called SEF (below this frequency 97% of the total power iscaptured).
• The median power frequency (MPF).This is the frequency at which 50% of the total power Is contained in lowerfrequencies and 50% of the total power is contained in higher frequencies.
2 EEG monitoring in _th...
Power PPF
11
1
_ Frequency
Figure 2.3 Characteristic frequencies
For the calculation of the Fourier transform, the sampling frequency, the filtering
technique and length of time interval to be frequency transformed have great
influence on the spectrum.
Quite another approach is given by the cerebral functioning analyzing monitor
(CFAM) [Sebel et a/.. 1983J. This device modifies the EEG further than
conventional power calculation. Separately the frequency distribution and theamplitude distribution of two channels are plotted against time. This makes it
more easy for an anesthetist to watch separate changes in both distributions, butat the same time (over·) intensifies the monitoring function of the anesthetist
when compared to a single display of onty power distribution.
Frequencies in the EEG are also estimated by the so called zero crossing or
period/amplitude technique. The EEG is directly processed by recording the time
and highest amplitude between crossings of a baseline signal (DC signal). The
use of this technique implies several problems, for instance its sensitivity to
minor fluctuations in the EEG [Levy et a/., 198~. It may be nice for detection of
spike artifacts in the EEG [Levy et aI., 7984J, but in low frequency components
the crossings may not be detected [Prank, 1986]. and therefore this technique
does not provide a general applicable method for EEG-spectrum calculation,
especially not when considering the possible importance of the lower frequency
ranges In trying to estimate anesthesia levels. Moreover. the computational
capacity of modern computers enables us to calculate spectra in very short time,whereby the ·direct" EEG processing of zero crossing becomes superfluous.
Specific parameters. Correlation coefficients are being used as a measure ofthe degree of ·relatedness" between two quantities. Cross correlation
determines the relatedness of two different functions, while auto correlation
12
functions are calculated of one func.tiQIJ~ 1tie same fu!lction shifted in time.The time-shift is of great influence; coefficients are mostly calculated for several
values of the time-shift. These signal processing techniques can be used ontime-related signals (e.g. different EEG signals), as well as on spectra, or on
other quantities [Basar, 198~. For detection d specific waveforms. automated
pattern recognition or template matching could be used. Also In suchapplications, artificial neural nets are being applied. The use of these techniques
stretches beyond the scope of this study.• Some value may be attached to stabilization factors. These can be defined
in several w~s, complex (see Bassr [1980}) or more simple: the ratio of thecertain range within which the distribution of 8 quantity has to stay In, and thetime that the quantity st~s within that range. Frequency stabilization or phasestabilization (in simultaneously recorded channels) m~ take place In severalfrequency bands after a stimulus [Basar, 198~. When compared to previously
calculated factors, the stabilization factors could Indicate changes In the state of8 patient. Applying such factors In the -Neurophysiologic monitoring" project
could prove to be useful, but the application of the NLA technique will influence
the results, because of the use of trains of high frequency auditory stimuli.
2.3 Interpreting the (processed) EEG
2.3.1 Anesthesia levels In the EEG
In normal, attentive state Of persons, the EEG generally shows 8 low amplitude
activity. In the stages of relaxation, drowsiness and sleep, amplitude grows and
frequency drops. If a person is anesthetized, generally the same effects occur:increasing amplitude and slowing rhythmical activity. However. this happens only
to 8 certain level of anesthesia Deeper anesthesia levels show again a
decrease In amplitude and an even further slowing EEG. A classification into 7levels has been made. In short, the levels correspond with the following patterns
[Collins, 1976']: 1. flat pattern, low amplitude, the a-activity present In normal
state has disappeared, 2. rhythmical high-amplitude sub-a activity, 3. complex
pattern, slower activity & amplitude begins to fall, 4. slight suppression,
decreasing amplitude & short periods (2 seconds) of flat patterns,s. moderate
suppression, flat EEG for periods of about 5 seconds (bu'st suppression),
8. severe suppression, the wave groups do not appear more than once every 10

Z EEG monitoring in .,..th..1a 13_._UIt_A_U '_lU
seconds. 7. complete suppression of measurable waves. This -general" scheme
Is mainly applicable to volatile anesthetics.
Irregular activity. Extreme anesthesia or slXgical stimulation [van dar Ende et
a/., 1990J may cause a -reactivation" of EEG activity; the sequence of levels asdescribed above may be reversed. This may happen after a fairly consistent
pattern in the EEG. Transitions between levels may show differentelectroencephalographic signals. and mixtures of Afast-, a or P. and -slower"
waves - as encourtered In sleep patterns - may occur during recovery fromanesthesia [Bovill et a/., 1982; Faulconer et a/., 1960]. levels 4 to 7 of thegeneral scheme show additionally irregular electrical burst activity of -high"
voltage O-waves, depending on the degree of suppression [Sebel at a/., 1981;
Collins, 1976'].
• It should, however, always be possible to recognize changes [/nterspec Inc.,
1985]. but one must be aware of the possibility of presence of physiological
changes like hypoxia and isctlemia [Grundy. 1985). These effects can also
make the EEG frequency spectrum shift towards lower frequencies, but may aswell be caused by deeper anesthesia
Characteristic frequencl... Changes In the EEG as mentioned above, can beobserved by looking at the frequency distribution in the power spectrum. Shifts in
characteristic frequencies (PPF. SEF. MPF) are used as parameters forindicating changes in the level of anesthesia in the patient. Generally, in deeper
levels of anesthesia the characteristic frequencies are lower. Observing the
peak power frequency may provide Information about general changes in the
pattern of the EEG. but the spectral edge frequency [Rampil et sI., 1984;
Withington at a/., 1986'] and the median power frequency [Schwilden et a/.,
1987a, 1987b, 1989; Simons et al., 198.9] are considered to provide more
reliable information about the level of anesthetic suppression. Also the onset ofspecific frequency ranges may be used as an indicator for changes In the mental
stale of patients (see belOYt').
Alpha·rhythm. Several researchers, amongst which Findeis et al. already in
1969. point to the possibility that, when a patient is in state of suppression, the
onset of a-rhythm or s~a-rhythm (5 Hz) could indicate the onset of awareness.
This was Investigated recently: the results of the research showed that
observing the "a-peak" gives information about awareness in an Important
number of cases [Van der Ende et al., 1990; Schwilden st sI., 1987b; Simons et
al., 198.9]. Indicated was also that a-rhythm may be evoked by using auditory

14
stimulation (!). Asymmetry in different EEG sign8is was considered to be relatedto a deterioration of brain functions.
High-frequency activity. In ION level anesthesia the presence ofhigh-frequencies was indicated by Bart et a/. [1971], Clark et aI. [1971] and Levy[1986']. A distinct ~-rhythm in small frequency bands centred at about 24 Hzoccurred at ION concentrations of anesthetics and suggested a relation between
such ~ activity and amnesia [Levy, 1986]. Another research by Smith et sl.t197~ showed the significance of changing frequency peaks in a frequencyband from 19.4 Hz to 27 Hz In rapidly changing anesthesia
Since the EEG represents only a small amount of the activity of the neurons, theuse of combinations of features extracted from processed data can be
recommended. An example of an automatic EEG pattern recognition systemusing several features was demonstrated by Berezowskyj et aI. [1976]. Thesystem made use of characteristic frequencies as described above and thespectral energy of some frequency bands, and was able to relate 55% to SOOAl ofthe EEG spectra to the correct levels of anesthesia.
2.3.2 Clinical depth ofanesthesia
Criteria for estlmllling leve's of anesthesIa objectively. In recent researchanesthesia mostly is divided into 4 or 5 levels by making plain observations ofthe state of patients. In a clinical study with patients under total intravenouspropofol·alfentanyl anesthesia, previously performed as part of theNeurophysiological monitoring project, the follONing scheme was used as areference [Cluitmans, 1990):
level 1:level 2:leve/3:
level 4:
levelS:
baseline recording: awake (premedicated):patient sedated, but responsive to calling of hislher name;visible motorlc responses, either spontaneous or to anoxious stimulus. but no response to calling of name;no visible motoric responses, but autonomous responsesstill present, either spontaneous or to noxious stimuli;no visible motOl'ic or autonomous responses present.
All research is performed In collaboration with anesthetists, who have to assessthe level of anesthesia by using their extensive clinical experience. Otherwise norelations between parameters under investigation and anesthetic depth or

2 EEG monltorlrtg In ."..th.1e 15
awareness could be established, for one cannot ask the patient about his or her
mental state! However. sometimes the anesthesiologists do not know exactly thelevel of anesthesia. lhis supports the search for easy to use parameters, but
also Indicates that the anesthetic levels assessed by any anesthetist should beused with care.
2.3.3 Addltlonsl considerations
Besides interpreting the EEG from the ·raw· or processed data, It is important to
look at referential EEG recordings from the same person. Interpretation should
never be done automatically If this ·baseline" recording, performed in stable
state of the patient, Is not examined. Researchers and anesthetists must keep in
mind that different patients can have specific patterns. Simons et aI. (1989)
Indicated that a small number of persons never show an a-rhythm. However,according to Collins [1976] this Is considerable: 20% I This also demonstrates
that whatever technique or parameter Is being used. the recording andregistration of the relevant data Is indispensable for post-operative evaluation. In
our project, this means the incorporation of a description of the EEG processing
methods and parameters in the datamodel of EMOABS.
The use of various drugs Influences the observed patterns in the EEG. Some
anesthetics - e.g. opioid analgesics [Sebel, 1985J - or combinations of agents
[Cluitmans, 1990] cause the burst suppression pattern to vanish. Furthermore
the influence of using different drugs can be noticed in the EEG by the absenceof one or several patterns (levels) as described In § 2.3.1, or by changes in the
occurrence of slow waves [Collins, 1976; Sebel, 1985].
There are several things of interest when the power spectrum of an EEG is to becalculated. Some technical and practical details influence the resulting spectrum:
.. in the operating room mains-interference may occur. and therefore a
filtering technique may be used to make Interferences of all electrical
apparatus as minimum _ possible - however. this certainly causes
distortion of the EEG;
.. the sampling frequency has to be at least twice the maximum frequency
of the EEG spectrum that we want to investigate (Nyquist's theorem);
.. the analog to digftal conversion (ADC)~ to be sufficient;
.. the calibration of the measured data must be 8CCl.I'ate - gains ofamplifiers sometimes drift;
16
•
•
•
EEG .,.,."ai. for monitoring ofane-"'.tic Mpth,
and the lenQth of the time fntervafto be processed will have to be chosenbetween 8 few and about 15 seconds. In order to provide a stationaryEEG spectrum [Pronk, 1986];
the previous technicality Is Indicated also by the following: If waveforms
like burst suppression or artifacts appear In the EEG. the power spectrummust be calculated with greater care. Detection of such waveforms isrequired and adaptation of the calculation process (e.g. longer timeIntervals) will be necessary.
however, In transient (no~stationary) analysis. the application Ofprocessing short intervals (epoch lengths of about 2 seconds) proves tobe powerful [Levy, 1987] and must be examined for use In measurements.
2.4 Evaluation & discussion
As stated before, the first aim of this study Is to extend the Neurophysiological
(evoked potential) monitoring project into the domain of simultaneous EP andEEG diagnosis of anesthetic depth. Therefore, a general applicable means forobserving EEG changes like the CSA should become available. Making an
entire array of spectra like the CSA (as shown in figure 2.1) is not necessary oreven possible, because the measurements that were performed earlier in theproject consisted of only twe>-channel recordings. It Is very likety that thismethodology shall be used again In future measurements, maybe only with
slight modifications.
The development of a spectrum evaluation tool will focus (as described in the
next chapters) on building a ·CSA· or ·compressed spectral display'" showing
one EEG measurement channel at a time, with the help of which stored EEG
data can be reviewed as chronological spectra.
Such 8 technique may be preferred over the DSA technique, which used tinier or
fatter dots to display relative values of power In order to make the relation timeversus spectrum more clear. but at the same time making It more difficult to
interpret the spectrum Itself. The composed lines in the CSA, representing
spectra, are more pleasant for the fif'/e, and ~ier to interpret accurately.
Actually, the time relation of a CSA technique to be used In 8 compressed

2 EEG monitoring in anHtII..ia 17
spectral display can be improved by making use of colors, by allowing different
angles of ViE!Yt'. and yet in another wfloJ: whall would call a "concave compressedspectral display". lhe normal display of spectra as used in the CSA is called
convex, i.e. spectra are "bulging" out of a ·horizontal" surface. This type ofdisplay can be complemented by showing spectra In a concave manner,
revealing hidden details of particular spectra, and vice versa. This will be
clarified in the next chapter.
Furthermore, the spectrum calculation algorithm should enable the use ofdifferent epoch lengths, say from about 2 seconds to 20 seconds. Asupplemental algorithm should be available to detect defections like burstsuppression, for instance with parameters like ·signal" stabilization factors.
Detection of artifacts will not be implemented in a spectrum display program, first
because of the short duration of artifacts (short most of the time; and slow trends
in measurements will not influence spectra very much) and resulting peaks in
power will be easy to recognize, and secondly because this can be considered a
separate part of an overall system (see for Instance Jansen [1990), and Vjrri[1988]).
Testing a new research tool can be done with the data acquired previously in
clinical sessions performed for AEP analysis. The amount of raw data (J cat
studies, 34 human studies stored on optical discs) and the quality (e.g. the
sampling frequency was high enough: 5 kHz) will be sufficient for 8 thorough
evaluation of a spectrum display program.
When this work is done, further EEG research is possible. lhe most promising
results in assessing anesthesia levels or awareness were accomplished by the
investigation of specific frequency ranges, like the "evoked" a-rhythm or high
f3-rhythm (20 to 30 Hz peaks - see § 2.3.1). Also the examination of the
characteristic frequencies (MPF, PPF, SEF) may be Important. I suggest to
investigate simultaneously the changes in several frequency bands, for instance
by looking at averages of, and relative changes In the characteristic frequencies
when analyzed together. Previous research usually concentrated on only one or
maybe two parameters, which is of course very good to Investigate the relation
between anesthetic depth and the specific parameter, but we want to take
anesthesia levels and especially awareness as a starting-point and then try to
detect these levels by using every means.

18.. l' .. a.. t
EEG .na/yll. for monitoring of Me.rhetic deptht II II .,.....
M.e. Escher: Study for "Hoi 6' 801" ("Convex 6' Ccmazve"), 1955
o 1955 M.e. Escher / Cordon Art - Baarn - Holland

J CCSA: • .".ctr.'.MIy". tool11111 .. I
eCCSA: a spectral analysis tool
19
Before describing the actual development of the CCSA ("Convex/concaveCompressed Spectral Array? EEG analysis tool - in chapter 4 - somerequirements and constraints of such an application are presented in thischapter.
3.1 Application requ Irements
The main goal of an EEG spectrum evaluation program within the Anesthetic
depth project is to enable research on the quality and usefulness of (new)parameters to be derived from an EEG in relation to depth of anesthesia. Since
future research-projects may vary in point of Interest and scope and may
Incorporate several different researchers, a general analysis tool should be easy
to work with and very flexible _ to what can be evaluated, and therefore must
enable an investigator to adjust a certain number of settings. Users of the
application should have some insight in the calculation processes, since
frequency transformation involves quite a few mathematical matters. However,_ this new analysis tool is to be applied in medicine, mere medically trained
persons with general knowledge of what can be seen in EEG spectra should
also be able to experiment with the application.
3.1.1 Genera'provisions / layout
With respect to the considerations mentioned above, the design of a general
applicable means to evaluate EEG spectra w_ shaped into the form of a user

20II t II nu
Interactive computer appliCation. The application .should facilitate easyadjustment of parameters. For this a menu structure was chosen.
Menus. Menus were made. which - if opened - are displayed as Otterlay onthe display background (this makes the menu structure obvious to the user).• Parameters to be adjusted In menus are for example the sample frequencyat which EEG data was sampled, the value of the maximum frequency to bereviewed In the EEG spectrum. the epoch length to be processed and other
parameters that Influence the calculation and display of an EEG powerspectrum. A summation of possibilities in options and parameter adjusting will begiven in § 3.1.3.• In order to make the application well surveyable, options that more or lessbelong together are grouped together in one menu. Some options will only havea yesloo setting, and for these several shortcut possibilities should be enabled,since a user might want to switch the parameter setting more eaily than: firstopening a menu, choosing the setting, and then closing the menu, In order toplot a CSA with the new setting. For this, a selection is made of the parametersto be put ·under" the function keys on the keyboard of the computer. The menustrueturelflowchart and a description of the use of the function keys Is given inappendix B.
Designing the .creen leyout. The display of a 1-channel CSA Is the mainpurpose of the program, and this display should show considerable detail in thespectra of the EEG. Therefore a large portion of the available display area (amonitor screen) is reserved for the CSA. As most of the parameter settings (see§ 3.1.3) reveal themselves in the CSA - fOf example the number of spectrumJines - only a few settings need to be visible permanently on the screen (suchas the name of the file that Is being processed). A display area In which thesesettings are displayed Is placed at the right of the screen. At the bottom of thescreen the function keys and their use are diSplayed. but also In this areamessages or errors can be displayed, Informing a user what to do next or whaterror occurred. Adrawing of the screen layout Is given in appendiX A.
Displey of spectr•. The actual CSA is built by shifting previously plotted spectra·backwards" 0.8. upwards and to one side - semi·3-dimensionaJ} and plotting anewly calculated spectrum in front of the shifted spectra. From this a CSA ismade where the time decreases further backwards; the most recent spectrum isdisplayed in the front.• In the CSA technique, spectra are displayed close behind each other (this iscalled compression [Bickford, 1972, 19731) where the "Otterlsp" of spectra is

~ CCSA: • .".etT.1 .""/ylia tool"'Uti I tllll
21
suppressect. see figure 3.1 a. Because of the use of this technique, possible
Interesting details may be concealed. This type of display can be complemented
by making a concave CSA, where the spectra are again displayed behind each
other, but now with the amplitude plotted downwards (see figure 3.1 b).
b . ....
Figure 3.1 Constructing a CSA: a. convex, b. concave
3.1.2 Oats processing requirements
A spectral analysis tool which in first instance, as in our project, is meant to
evaluate an EEG on file, must meet the following data processing requirements:
• The program must be able to read the EEG data correctly from file. Forthis the data format must be specified. For instance,a file may contain
data of more channels, which will be encoded within the data samples.Specifications will be given in § 4.1.3.
• Because of the large amount of data obtained during measurementsessions, fast evaluation of the spectra afterwards must be enabled. Auser should be abIed to -step· ttvough a file, one CSA (a specified
number of spectrum plots of epoch length) at a time.
• As a user might know in advance precisely where in the data file (at what
position, after what time) a phenomenon occurred that he/she wants to
evaluate, the file position must be adjustable.
• During measurements the gain of amplifiers may have been adjusted,
which influences the calibration of the measured data A record of this is

22I' ...." EEG ,,,.lyal, for monitoring ofan• ."..tic t»pth
kept, and this enables the use of these calibration and offset values in a
data-read routine.
The available EEG data within the Anesthetic depth project was sampled at a
frequency of 5 kHz because of high-frequency components in evof<ed potentials.
The EEG spectrum, however. needs evaluation only to a frequency of about 100
Hz maximum. The processing of the EEG data to spectrum plots therefore
Involves some filtering techniques. besides the obvious time to frequency
domain transformation. In Implementing data calculation and display routines.
the future possibility of real time processing is also Investigated. When taking
real time adaptations into account, the eventual program might prove to be even
more widely applicable. These issues will be dealt with in § 4.2 and § 4.3.
During EEG spectra evaluations. a user may change a number of settings. From
this, a mere practical Issue emerges: when quitting the EEG analysis
application, the program's parameter settings should not be lost, since the user
does not want to adjust the settings allover again at the next program startup.Therefore a possibility is provided to save the settings.
3.1.3 Interactive parameter adjusting
In the CCSA program (convex/concave compressed spectral array) a large
number of (adjustable) parameter will be available. These are presented below.
The following parameters are categorized as options (these are parameters thatinfluence the calculation process directly):
• the sample frequency, the EEG frequency (maximum freq. to be plotted),
epoch length. begin of CCSA time interval, plotting the nextlprevious
CCSA, plotting/recording to a file of the characteristic frequencies MPFI
PPF. SEF and a custom definable frequency; also the factor by which the"spectral edge frequency" is determined Is adjustable. since some
research may need a slight adjustment of this factor (some Investigators
use s factor of 97%. while others use a factor or 95% of the total power
contents). Spectra can be displayed In squared voltages and as
normalized spectra (where every spectrum Is normalized on Its peak
value).

J CCSA:. apfICtr.,.,..Iyti. tool. 23
Parameters categorized as _tlngs are:
• indication of one of the Implemented time windc1Ns and indication of FIR
filtering (these are actually calculation parameters also, see § 4.2.1 and§ 4.2.2), indication of which channel Is to be processed, the angle of theCCSA and the number of spectra In the CCSA. use of color, and plotting aconvex or concave CCSA (see figure 3.2).
All of this can be customized and saved in a "settings file".
a
Figure 3.2 Convex (a) and concave (b) CSA display

24III III 1 I til
EEG .,./yal, for monitoring ofan.lfh.lic depthIt' '""'MM.'"'''' I 1nu", , .. Mn
3.2 Building the EEG analysis application
3.2.1 Software development
When building 8 software tool that Is likely to be used by several researchers,user-friendliness must be of top priority. A well designed user-Interface providingInformative messages on possible mistakes/actions should be made. WIth anapplication like the CCSA, that will be used by persons with technical skills andinsight in the data-processing, user·friendliness also has Implications on thesource code of the application. A clear program structure, descriptive names ofidertifiers, and use of lots of comments are a necessity, since a future usermight want to customize the program. For this, documentalion Is writtendescribing the usage of the program and describing the Internal structure and
routines.
The last couple of years, all software Implementations with use in the Anestheticdepth project were made in the programming language ·C·. A majorconsideration for using this programming language, was the efficient code thatmodern 'C' compilers produce. For possible simultaneous use of the CCSAapplication and previously (or future) developed programs, the CCSA is alsoimplemented in ·C·.
3.2.2 Program portability
In trying to build a well structured program, effort Is made to establish 'programportability". The proposed ANSI standard for the 'C' programming language[Kernighan &Ritchie, 1988) is applied ~ well as possible in writing the program,and for operating the monitor display a ssperate (extern) graphics library wasused [Media Cybernetics, 1988a, 1988b]. This makes the Implementation of theprogram highly portable from one software development environment to another.
Machine Independency is otXained by the flexibility of the graphics library, which
provides numerous device drivers for different monitors, [Media Cybernetics,1988b] and by making no special assumptions on the arithmetics (e.g. one's ortwo's complement type) used on 8 specific platform. Furthermore, 8T"J machineerror that occurs during the running of the program, such ~ memory Violalion,should be signalled and dealt with.

, CCSA·. ap«fTal .,.lylli. tool. 25
An obvious condition for writing a portable program is the omitting of 8I"f codethat has assumptions on particular display size. Flexibility of the program can
thus be obtained, and also by using no "hard-code" filenames or constants thatmay need alteration in the future or In a different envIrorvnent. Such Identifiers
are to be grouped together, where a user can easily change them 6.e. use
header files -in "C").
More guidelines on programming portable programs in ·C" can be found in
Kernighan & Ritchie [1988) and In the manual of the Microso". Corporation[199q.
3.3 Summary
The development of the "Convex/concave Compressed Spectral Array" (CCSA)
EEG analysis application program concentrated on maximum program
performance. as to correct data processing and easy use. The development alsoconcentrated on applying advanced programming techniques. in order to obtain
8 clear program structure and optimal program portability.
Effort was made on designing 8 good user-Interface, with emphasis on features
like screen-layout. easy-tc>use menus. and informative messages.
Information about the CCSA program can be found in appendices A and B of this
report; an extensive documentation can be found at the Eindhoven University of
Technology. Department of Electrical Engineering. division of Medical ElectricalEngineering.

26 EEG .,./yli, for monitoring ofene""'lic c»pthI " H
M.e Escher: "HoI & Bol" ("Qmvex & Concave"), lithograph, 1955
C 1955 M.e. Escher / Cordon Art - Baam - Holland

4 Algorithm development•• , , \\~W'A) "BUttl tUItU
t ''''"
27
mAlgorithm development
For analysis of EEG data in the frequency domain signal processing isnecessary. After first giving specifications tor previous studies and measureddats in paragraph 4.1, paragraph 4.2 continues wffh describing filteringtechniques, frequency transformation and other aspects of the data processing.Specifics about the performing ofdata analysis are presented in paragraph 4.3.
4.1 Starting points: previous clinical studies
As part of the "Neurophysiological monitoring of anesthetic depth" project a pilot
study with 7 cats under lsoflurane or N20-lsoflurane anesthesia and a clinical
study with 34 patients undergoing orthopedic surgery under total intravenous
alfentanyl·propofol anesthesia were performed in Gainesville, Florida and in
Nijmegen, The Netherlands respectively (see Cluitmans [1990]).
As the dataprocessing of the CCSA program is to be performed on data that
were measured during these studies. these data must be specified for a
consistent implementation. Relevant informations about the m.nioned studies,
especially starting points for the EEG analysis. are described in this paragraph.
4.1.1 Measuring equipment
A summary of some of the equipment used during the sessions is given below.

28 EEG ."./y~. for monitoring of."• .th.lic depth, ttl I 11
Nicolet Pathfinder I· & n electrophysioiogicaJ monitoring systems (Nicolet
Biomedical, Madison, Wisconsin, U.S.A.) were used for conventional evokedpotential monitoring, where the stimulus controller module was adapted for usein extern triggering.
A Nicolet '007 auditory stimulator was used together with Nicolet Ti~10 inserttype earphones to present clicks to the patient (for evoked potentialmeasurements).
The following band filters were used:
a 2·poIe Butterworth high-pass filter with a cut-off frequency set at 1.5 Hz(cats) and 5 Hz (clinical study).
a 2-poIe Butterworth low-pass filter with a cut-off frequency set at 1.5 kHz.
The evoked potential recording system was Implemented on an IBM ATcompatible personal computer for storing of 2 channel EEG recordings at a
sampling frequency of 5 kHz for each channel.
For a detailed description of all the equipment used in the measurements seeCluitmans [1~.
4.1.2 Session protocol
During seperate sessions of the "eats' study and the clinical study data werestored on file. Of all "patients' a baseline recording was made during the
pre-anesthetized phase in a session. These baseline recordings wereinterpreted by the research team for verification of the reliability of themeasurements.
For every "'eve'" of anesthesia files were made by recording the EEG for about'00 seconds as measured In two channels coming from the scalp of the patient.Electrodes were placed at the following positions: 1rontal" on the forehead,
"central" on top of the scalp and 'emporal" at the auditory centers near the ears(positions FPz, CZ, A,. A2. eccording to the 1(~20 system [Spehlman, 1981D.Event recording (administered drugs. actions of medical staff) was kept with the
help of the ERDA system [Cluitmans, 1990; De Jong, 1986].

of Algorithm development...u,nll '44
29
The level of anesthesia (see table 4.1) was assessed by an anesthesiologist. He
also tried to maintain this level throughout a measurement.
Table 4.1 Anesthesia schemes
Anesthesia levels Cliniad study OUsstwJy
1 baseline recording, premedicated
2 sedated/responsive 0.3 MAC·) N1.0
3 motonc responses 0.3MACNzO+0.3 MAC Isoflurane
4 autoncmwus responses 0.3MACN1O+0.6 MAC lsoflurane
5 no responses 0.3 MAC lsojlurane
6 - 0.6 MAC lsojlurane
.) set glossary
In the ·cats· study, the levels 1, 2, 3, 4, and the levels 1, 5, 6, are to beconsidered as separate sets.
4. 1.3 Data specification
EEG data were sampled at a rate of 5000 samples per second in two channels.
The low pass filter with a cut·off frequency at 1.5 kHz bandlimited the EEG
signal, making the sampling frequency of 5 kHz consistent with the Nyquist
theorem. Sample values were encoded in 2 bytes Integers, comprising of 12 bitsamplitude information and 4 bits additional information. The additional 4 bitswere used for indication of which channel the sample came from, and for
indication if a auditory stimulus was given at the time at which that particularsample was obtained (see figure 4.1).
~ ---J
t t ~'--------"Iv,....-- ....JI
, ..... u.u VALW!
Figure 4.1 Sample encoding

30un""""...,, "" ttl)\ Hl
EEG IIMlyai, ftK monitoring of."elthetic depthIA , .....
The stimulus infcrbit is used for triggering of the averaging process wherebyevoked potentials are calculated. This bit does not need evalualion In the CCSAapplication, because no averaging of EEG intervals has to be applied.
Samples were obtained from one channel sftar another (two channels), butbecause of the high sampling rale, sometimes asampla was missed. Therefore.the channel Indication bit was encoded In the samples, for verification in readingthe data from file.
This encoding scheme implies that If we want to meet with the pre-condition ofnot using specific arithmetics (§ 3.2.2), the samples must be converted back to anon-specific type. This can easily be done in the programming language ·C·. aslong as the 12 bits actual sample amplitude Inform81ion was encoded in aconsistent type.
In a session several measurements were made of different levels of anesthesia.One EEG data measurement of about 100 seconds produces a data file of about2 Megabytes. The data files of the described studies were therefore stored onoptical disc after each session. because of the limited space of the storagemedium during a session.
Measurements of different levels of anesthesia sometimes required differentsettings for the calibration and offset values (i.e. multipJiC81ion factor and
deviation on zero Input: used for calibration of the stored sample values toproper units In micro-Volts). For this, B record was kept of these parameters foreach measurement (each file).
4.2 Signal processing
The EEG data read from B file needs some processing before spectrum plotsare displayed as B CSA. Pre-processing filtering techniques are necessarybefore 8I'fo/ frequency transformation can be done. Specific parameters(characteristic frequencies) to be displayed in the CSA are calculated In the EEGspectra. and only after this the actual plotting on screen is performed.

4 Algorithm devtJIopmfHIl 31
4.2.1 Time domain processing: pre.fllterlng
Low·pasa filtering. Since we are Interested in evaluating EEG spectra only inthe range 0 • 100Hz. while the data on file was sampled with a pre.filtering
cut·off frequency and sampling frequency fl4mplt as high as 1.5 kHz and 5 kHzrespectively, alow·pau filtering algorithm Is necessary.• What we would actually like, Is to obtain a signal that Is sampled at twice (or
slightly more) the maximum significant EEG frequency f-x,HI (which isadjustable in the CCSA program, see § 3.1.3). So we could skip fMmpll!2fmu.etgsamples In the Input data-stream for each sample of the ·modified" signal withreduced sampling frequency. But, the original signal contained frequency
components above the ·new· sampling frequency of 2fmn'HI ' originating fromthe stimulus evoked responses. How small these (high) frequency components
may be - a lot of averages are necessary to "lift" them above the "EEG noise"
- they can influence the spectrum below an artificially reduced samplingfrequency. This phenomenon is krlOYln as aliasing, which occurs when a signal
is sampled at a too low frequency. Therefore the frequency components abovethe spectrum of interest should be removed before the sampling frequency islowered. This is done with a finite impuls response (FIR) filter.
FIR filtering. A low-pass fiter can be looked upon as a filter that ·smoothes" asignal: fast changes in a signal are suppressed, while slow variations remain.
This can be achieved with a ·moving average" FIR filtering technique, where the
resulting signal r(n) is calculated from the input Signal sen) by:
L1
renT) = 2L + 1 L seen - k)T)k--L
(4.1)
T is the sampling interval
resulting in values of r(nJ representing the average value of sen) around "j.
In yet another notation:
L
renT) = }: h(kT) . seen - k)T) = h(nT) (8) senT)k--L
(4.2)
impulse response h(nT) =2L1. 1 I -L s: n s: L
~ denotes convolution

32
The filter Is not causal, but this problem can be solved by IntrOducing a delaytime of L samples. However, when reading stored data, we are not hampered bythis problem and the delay can be Implemented artificially: just read -l. to L
samples around the desired sample nj.
The following frequency domain formula can be given, In accordance with
formula 4.2 (convolution In time domain • multiplication In frequency domain,
and vice versa):
R (ejD) = H (e iD ) . 5 (eiD ) (4.3)normalized frequency Q correspondswith the QCtUiU frequency f:C =0, f =0; .. g =n, f =~
2
Resulting in a low pass filtered signal r(n) with spectrum R (ejQ ), since H (ejQ )
can be calculated as [Verkroost, 1985]:
L II
H ( jC) _ ~ _1_ -jan __1 _ JQL ~ -jQne -L,2L+1 e -2L+1 e L,e
n--L 12-0
ejCL e-jD(2L + 1) _ 1
= 2L + l' e-ja - 1
.g2L + 1 .g2L + 11 e-J 2 - eJ 2
=2L+ 1 . .c .ge-l2 - e'2
. (2L+ 1 n)srn--."2 (4.4)
This spectrum is given in figure 4.2 for L =32. The low pass characteristic of thefilter Is clearly seen.
If we take the -3 dB point In this spectrum m the FIR filter cut-off frequency, we
can approximate Cculo(If! and fCUlo(lf! from formula 4.4 and figure 4.2 (see also
appendix C):
~~JCIlI-cff· 2vL
-t/= 2.257 (4.5)

4 Algorithm dellelopmMt 33
Odl
-4C
I UU•• Utlllit..
-Ill
-120
•i • n
Figure 4.2 Logarithmic spectrum curve of the "moving average" filter
In the CCSA application fMlmpl~ and fmu,ttg are specified by the user, and with
formula C.4 (appendix C) the FIR filter parameter L can be calculated.
By applying the moving average filter we are actually able to skip a number of
samples fMlmpul2f"UIX.tJr'g, as to obtain a reduced "pseudo· sampling frequency,
where the resulting spectrum is not damaged by aliasing effects below the
frequency fad-off = frrlllx.ug.
4.2.2 Time domilin processing: windowing
Spectral leakage. Calculating the frequency transformation of an EEG signal is
only feasible if short intervals are processed. Such an epoch is in fact a signal
that is limited in time, which takes Its effect upon the spectrum. This estimated
spectrum shows "spectral leakage". which can be reduced by applying
windowing functions.
If go(n) is a (discrete) signal that is windowed with the function w(n) =1 • 0 s n s
N -1 ; (w(n) =0, elsewhere):
g(nT) =w(nT)· go(nT) (4.6)T is the sample intmxLl
is a time limited signal from 0 to (N - l)T seconds. The estimated spectrum is
OON [Verkroost. 1985]:

34 EEG aflllyai. for monitoring ofanelth.tic ~plh
where
I' .
G (e iC ) = W (e iC ) ® Go(e iC )
Sin(~) . N-lW(efC ) = 0 ·e-J~
5in('2)
..... un
(4.7)
@ denotes convolution
•
h n
Figure 4.3 Convolution process and resulting spectrum
The "speetralleakage" is clearly visible in figure 4.3: fast changes in the originalspectrum spread, and the estimated spectrum shows signal where the original
did not. Therefore, the main peak in W (e iC ) should be made smaller, and theside lobes should be suppressed (see figure 4.3).
Window functions. The main peak in 8 spectrum of 8 "windowing" filter will
become smaller with larger N (formula 4.7), but the side lobes are only
suppressed more with the use of window functions that go to zero towards both
begin and end of the epoch. Five windows were Implemented In the CCSAprogram, In order to be able to experiment with the different features of thewindows.
In the following order these often used windows show more side lobesuppression and 8 main lobe thalls less small (broader):
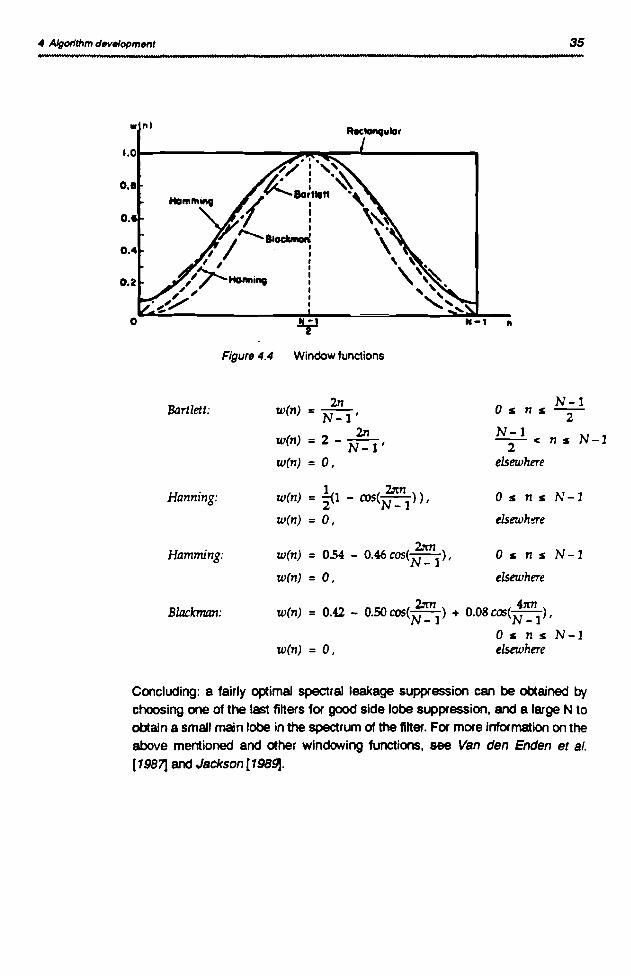
Rectangular: wen) = 1,wen) = 0,
o ~ n ~ N-lelsewhere
4 Algorithm d~"'opmfHlto4iIM' "u ~»>~, tH 1 un t t t
• "I
I.Ot---------...,"IIl""~---------..0.1
o.
Figure 4.4 Window functions
35
"
Bartlett:
Hanning:
Hamming:
2nwen) = N -1 '
wen) =2 - ::. 1 '
wen) =0,
1 21mwen) =2(1 - cos(N _ 1) ),
wen) = 0,
21mwen) = 0.54 - 0.46 cos(N _ 1)'
wen) =0,
N-lOs n s -2-
N-l-2- < n s N-l
elsewhere
o 110 n s N-l
elsewh-tre
Os n 110 N-l
elsewhere
Blackman:21m 4xn
wen) = 0.42 - 0.50 cos(N _ 1) + 0.08 COS(N _ 1)'
Os ns N-lwen) = 0, elsewhere
Concluding: a fairly optimal spectral leakage suppression can be obtained bychoosing one of the last filters for good side lobe suppression, and a large N toobtain a small main lobe in the spectrum of the filter. For more information on the
above mentioned and other windowing functions, see Van den Enden et al.
[1981] and Jackson [1989).

36
4.2.3 Transformation to frequency domain
Fourier tranaform. The most well·known way of performing time-t~frequency
transformation Is -Fast Fourier Transformation" (FFT - see appendix 0). This Is8 handsome and faster wrlf of calculating a discrete Fourier transform, which isdefined by:
N-l ~
F(k) = I j(n) e-i1i bJ
"-0
N-l N-l
=I f(n)ros(~kn) - j I f(n)Sin(~)11-0 11-0
f(n) :F(k) :j:
(4.8)
discrete time signaldiscrete Fourier transformimaginary axis unit
For real signals f (n) (not complex) however, the following properties of F(k) caneasily be deduced, because of the odd cosine-function and the evensine-function in 4.8:
Ref F(k)} =Ref F(N - k)}
Im{ F(k)} =-Im{ F(N - k)} (4.9)
Hartley transform. A transformation that uses the properties 4.9 Is called theHartley transform [Bracewell. 1986) after R. V.L Hartley [1942}. Thistransformation in a manner of speaking -'olds- the real and imaginary parts ofthe Fourier spectrum in one, resulting in one arrrlf containing N Hartleytransform samples, instead of - In Fourier transformation -:- two arrays (onereal and one imaginary) of together 2N samples. The definition of the Hartleytransform is given in formula 4.10.
N-l
H(k) = ~ f (n) {ros(~) + Sin(;:;kn)}11-0
I(n) :H(k) :
(4.10)
discrete time signaldiscrete Hartley transform
From formulas 4.8 to 4.10 the following can be deduced:
H(k) =RefF(k)} - 1m{ F(k)}
H(N - k) = Ref F(N - k)} - Im{ FeN -k)} = RefF(k)} + Im{ F(k)}

4 Algorithm dwelopmfHIl.... , ... I un tH
37
F(k) = Re{ F(k)} + j Im{ F(k) }
_ H (N - k) + H (k) . H (N - k) - H (k) (4.11)- 2 + J 2
(4.12)
From the Hartley transform also a "ast- algorithm can be made that isapproximately twice as fast as FFT (see appendix 0). and with the help offormulas 4.11 a power spectrum IF(k) 12 can be calculated:
1F(k) 12 = (Re F(k) } 2 + {1m F(k) } 2
= ~ ([H(N - k) + H(k)J 2 + (H(N - k) - H(k)) 2 }
=~{[H(k))2 + (H(N-k)) 2 )
Implleatlone on parameter aettlngs. A fast frequency transformation can only
be performed on discrete time arrays that have length N =2% • X > 0 (a power of2 - see appendix OJ. Then if an investigator chooses 8 particular epoch to be
processed to a power spectrum below 8 particular maximum EEG frequencyfmtl%,trg (corresponding with half the ·pseudo" sample frequency - see § 4.2.1),these parameters need adjusting:
Qrraylength N =2 fWlll%,trg • epoch 0 2% , %>0 (4.13)
The epoch to be processed gets the priority of not being changed, because we
do not want to change the length of the time interval to be processed. while we
can do the following: increase frruu,ttg to the nearest (larger) frequency f'rruu,ug,
so that it meets with 4.13.
In the spectrum display. only the frequency components below the originally
indicated fmllX,ttg are plotted, allowing a researcher to really customize the
spectrum display (CCSA). However, to make It clear what frequencycomponents above the visible fmll%,ttg the calculation process calculates as well
(and does not display), the recalculatedf'mtI%,ng is given in one of the menus.
Epoch adjusting. The frequency OlvisJon f..""lt!2 f'rrtllz,ng indicates the number
of samples to skip in the input array (see § 4.2.1). This division however, neednot be an integer value. This indicates that "pseudo" samples are to be obtainedbetween samples: the "sample- value is obtained through Irterpolation.
• The CCSA program allows 8 user to choose an integer frequency divisJon, in

(4.14)
38
order to use only actual sample values at an actual sample time. For this. the .frequency division is rounded, after which f'rrw,ng Is adjusted again, tof" rnIIX,ng
.. fU"'1'IJ2freLi.division. Now the arraylength of 2% must be attained by adjustingthe epoch length (see formulas 4.13 and 4.14):
Nepoch = 2f" 'rnIIX,Mg
Advantages Of the scheme above are:
• maximum flexibility
• only that arraylength of data is frequency transformed that is just needed(saving time compared to calculation with a fixed frequency Of e.g. 100Hz
and then displaying only to fmu.«g)
epoch and jrnll%.ttg can be customized
epoch priority (epoch Is only - slightly - adjusted if an integer frequencydivision is chosen)
4.2.4 Specific parameter calculation
In a po.vef spectrum, several characteristic frequencies can be calculated (see§ 2.2). For the calculation Of these EEG parameters first the total power contentsis calculated and the peak power frequency is determined. After this the medianpower frequency (MPF) can be calculated by comparing hatf the value Of thetotal power contents to a summation Of the power values of the frequencycomponents until equation 4.15 is met:
MPf
}: Pi :: 0.5 Plotal
i.JJ
In a similar way, the spectral edge frequency (SEF) can be determined:
(4.15)
srr~ Pi :: Q Ptotali.JJ
(4.16)
Q: spectral edge ftutor
To fasten the calculation process, the MPF and SEF are determined In the samesummation '!Pi. Therefore the spectral edge factor Q can only be adjusted (see

4 AJ(}orlthm development 39
§ 3.1.3) in the range 0.5 < a < 1.0. because the calculation assumes that the MPFIs smaller than the SEF.
In the source code of this characteristic frequency algorithm of the CCSAprogram is indicated how a user can define a -custom characteristic frequency".For the sake of simple implementation. in the first version of the program initiallya choice has been made to calculate this frequency exactly Inbetween the MPFand the SEF, taking into account promising results of Investigations of bothfrequencies (see § 2.3.1). However, other calculations of custom EEGparameters can be implemented as well.
4.2.5 Display of spectra
The calculated spectra (§ 4.2.1 - .3) and the calculated characteristicfrequencies from the previous 5ul>paragraph are to be displayed as a convex orconcave CSA, with the use of -hidden line suppression- as indicated in § 3.1 .1.
The hidden line suppression is implemented in the following way: first, thepreviously plotted spectra are shifted backward In the CCSA; second, thecurrent spectrum is plotted in the front; third, the current spectrum is made intoan enclosed display area by plotting some extra lines below the spectrum;fourth, the enclosed area is filled with the screen background color after whichthe extra lines are deleted.
An alternative method would have been: storing the values of a previouslycalculated and plotted spectrum for comparison with a newly calculatedspectrum and then calculating the lines to be suppressedlhidden and deletingthem on screen, and then plotting the new spectrum. However, this methodtakes extensive processing, especially because of the varying values of theangle of display and the number of spectra in the CCSA, and because of thepossibility of convex and concave display (see § 3.1). Besides, the fillingfunction of the graphics library used [Media Cybernetics, 1988a) is very fast.
Characteristic frequencies are displayed In the CCSA with different indicatorsigns. The signs have a color different from the color of the spectra and indicatethe exact characteristic frequency positions in the spectra on screen.

40...... 1., 1 I
4.3 Data analysis
EEG .1II1y';, for monltorirt(J ofMelthelie Mpth111'. ,
4.3.1 Data on file
When we are going to analyze data stored on file. we should consider Inadvance what we want to observe.
In the -Anesthetic depth protect- we are Interested in assessment of levels of
anesthesia by observing changes In spectra of the EEG. We should then reflecthow a convenient and effective analyzing can be accomplished; when EEG datawere stored per level (see § 4.1.2 and § 4.1.3), observing changes in relation tolevels will be dtfficult, and also. E in our case one file of 2 MegabytesInformation represents only 100 seconds EEG data, the CCSA will be filled withonly a few spectra (for example 10 spectra of epochs of 10 seconds).
It will therefore be more convenient to append a few measurement filescontaining data of different levels of anesthesia In one patient and then usingthis new, much larger file E input data stream for the CCSA program.
But now a completely new problem arises. By appending files of dtfferentmeasurements - maybe with different calibration and offset (see § 4.1.3) - thedata in the resulting file may need a more sophisticated calibration scheme.
In the CCSA application program a possibility was made that allows users toindicate where in an input data file the calibration changes (see appendix A). Wemust by ourselves keep track of the time in the measurements at which the levelof anesthesia changed (which can be deduced from the fileposition at which the
new calibration is Valid).
4.3.2 Real time adaptations
If a future version of the CCSA application has to be able to process EEG dataIn real time (e.g. to display spectra during 8 measurement) a few adaptationsand extensions are necessary.
As the CCSA program only processes data from file. the most obvious thing todo. is to implement a separate program that obtains the data during the

.. Algorithm dwelopmMt 41
measurement sessions and writes these data into a file that can be read by the
CCSA program.
S'gnal and walt. The frequency transformation of an epoch can only beperformed after an epoch of data was obtained. Therefore an Interrupt should be
signalled after the writing to file of an epoch of data (by the measurement
program) to the waiting CCSA program. After this the frequency transformationand display process can be performed. The measurement program should be
Informed what epoch length Is desired In the CCSA program. The epoch lengthshould be chosen small ( < 10 seconds) because of two things: we do not want
to wait very long before a spectrum is displayed, and with increasing epoch
length the dataprocessing may become too excessive.
• These requirements, as far as the CCSA program is concerned, are already
Implemented, and need only slight a1teralion In the source code to come into
execution.
Processor ahar'ng. A process-handling routine must be Implemented also,
dividing the processor-time between each of the described programs. The
measurement process will have the hlghtest priority for obtaining measurement
samples and writing them to file. The remainder of the processor time can beused by the CCSA program. Since the latter process uses a lot of caJculalion
time a very fast platform has to be used.
If during a real-time measurement an adjustment in the parameter settings of the
CCSA application is made, a routine within the CCSA program must take care ofdisplaying the missed spectra (missed during the parameter changing) and then
coming back in real-time mode again. If displaying the missed spectra is not
feasible in terms of processing time, the dala corresponding with these spectra
should be skipped in the CCSA program, coming directly back in real·time mode
again and therefore really missing some spectra.

42
M.e. Escher:"Baven & Onder"("'Above & Below"'),lithograph, 1947
Cl1947 M.e. Escher /Cordon Art - &am-Holland

I Telling !tie CCSA program\ttL '" "
ttl ttl I
43
~ Testing the CCSA program
As indicated in the previous chapter, analysis of EEG data requires somereflection in advance. Therefore we will consider this data evaluation process inthe next pages.
5.1 Computational aspects
--resting" as described in this paragraph will not only concentrate so much on
EEG analysis in respect to anesthetic depth. but will deal with investigating EEG
proceeslng as well.
5. 1. 1 Data testset
From the vast amount of stored EEG data several measurements of the ·cats·
pilot study (see § 4.1) were selected to be evaluated in the developed CCSA
program. These files were made during sessions with well-controlled conditions
where the anesthetic dosages were precisefy defined (see table 4.1). AncXher
remon fO( choosing measurements from the pilot study Is the fact that in this
study only EEG frequencies below 1.5 Hz were filtered out, while the data
available from the clinical evoked potential study were high-pass filtered at 5 Hz.
Therefore the selected files from the pilot study enables us to review more of the
EEG spectra, and the Implemented characteristic frequencies calculation will
probably be more reliable.

44\bI~ ,nUllI II
An interesting phenomenon for EEG an81ysis 8150- oCcurred· in the ·selectedmeasurements: burst suppression patterns arose during Isoflurane anesthesia(see figure 5.1) [Clumnans, 1990]. Such signals, shoNing 8 flat signal alternatedwith quick fluctuations, will influence results of EEG processing algorlttvns to 8
great extent, and therefore are worth evaluating.
302520,e-7e L....-----,.---"""'T'"----r----.-------,.----,
o
Figure 5.1 Burst suppression during 0.6 MAC lsofturane anesthesia
TIle data from 7 files, each containing about 90 seconds of data of differentlevels in one cat "EN2", were copied into one combined file for input to theCCSA application. This enabled a convenient data analysis as described in§4.3.1.
Resuming, a brief description of the testfile of the eat "EN2", indicated withperiods A to G, Is given below:
period A
period BperiodCperiod 0periodE
periodFperiod G
baseline recording, a major artifact occurred in channel 0,causing a DC EEG signal0.3 MAC N20 administration0.3 MAC N20 + 0.3 MAC ISOfIurane0.3 MAC N20 + 0.6 MAC ISOfIurane0.6 MAC Isoflurane; this measurement showed burstsuppression0.6 MAC Isoflurane without burst suppression patterns0.3 MAC ISOfIurane
5.1.2 Testing procedure
After some introductory testing for verification of alimentary program fln:tionlng(proper data reading, filter characteristics, etc.), which will not be described in

I r••ring the CCSA program"'IlilJU"'U ttl tnt ,~"..... • tI At 'U coo • 'I t
45
this report, we are to contemplate precisely what effects of adjusting which EEG
processing parameters we want to evaluate, besides the obvious Interpretation
of changes in the spectra in relation to administered drugs ("lever ofanesthesia) .
Practical restrictions. As the separate levels In the testfile were only meaured
for 90 seconds, we will not be able to obtain a lot of spectrum parameters If we
choose large epoch lengths. Therefore the epoch lengths used in the testing
were kept small (see belaN).
• EEG spectra as calculated In this study are the transformation of EEG timesignals that were obtained during high-frequency auditory stimulation. The
effects on the EEG data are small, but to ensure proper spectrum calculation,
the FIR filtering setting was used.
• The maximum EEG spectrum frequency has to be chosen high enough toensure the calculation of the entire spectrum, since the FIR filter cuts off all
frequency components higher than the chosen fmll%,ttg. After some pr~evaluation
of spectra of the data, this fmllX,ttg was set at 50 Hz.
We will investigate the differences between the time windows that were
implemented in the program (see § 4.2.2). This will be evaluated briefly in
chapter 6. For the evaluation of using different epoch lengths the Blackman
window was used, because this window Is believed to give good reduction ofspectral leakage (see Van der Enden et al. (1987)).
Measurements. The testdata were subjected to the foIlaNing processing
settings:
• maximum EEG frequency 50 Hz
• windowing with the Blackman window
(and brief evaluation of other implemented windows - see § 6.1.2)• FIR filtering on
• epoch length 2 seconds,S seconds and 10 seconds
• All implemented characteristic frequencies will be calculated and recordedin a file for quantitative evaluation of correlations with anesthetic depth and
Influence of the different epoch lengths.
Settings of other parameters In the CCSA program will be discussed briefly in
§ 5.2.

46I "I ...' Ht" ,
EEG ""'Iy~. for monitoring of.".dl.tic .pthUti tl
5.1.3 Processing accuracy
In order to obtain an indication of the processing accuracy of the CCSA program,a simple accuracy estimation Is performed below. The EEG data as measuredduring the previousty performed studies were written to files In 12 bits precision.As the data process is implemented in high-precision calculation (esp. comparedwith 12 bits data). the noise in the input signal as a result of this quantisation In12 bits is taken as a starting point.
For a uniformly distributed error function of the quantisation process thequantisation noise power P, can be calculate<l as [Verkroost, 1985]:
A,2p, := 10 log 12 (dB) (5.1)
A: 2~
where b: number ofbits in sample
In our input signal the number of bits b is 12. so 5.1 results in:
2-24P, := 10 /0" - := -83 dB
o 12 (5.2)
The frequency transformation process is implemented in calculation with B byteprecision (64 bits). so we may state that the processing of the EEG data will onlyadd to the quantisation noise power in aJgor~hms thai calculate new values outof two or more samples from the input array.
The frequency transformation algorithm is the only calculation in the CCSAprogram that uses several stages where the intermediate results consist ofterms of su\).results (i.e. the input array). In the derivation of the Hartleytransformation. esp. formulas 0.4 (appendix O), we see that there are threesub-terms. If we assume that each term Is afflicted with a white noise term ni(t)
and that these processes are ergodic and not correlated, we can calculate thenoise power after each stage as:
{"I(t) + n2(t) + n3(t) i = nl(:) + 1ll'(t) + ni(t) := 3 nht) (5.3)
(the cross-terms nj(t)'nj(t) are zero)
The calculation 5.3 models the worst case noise power In the result (theseparate terms add up). We can nr:Ni calculate the noise contribution of eachstage in the Hartley transformation:

6Pr,n=3Pr,n-]
47
(5.4)61'r, n : increase ofP in stJlge nn : stJlge number in the
Hartley transform (n a 2)(Pr,] =Pr : see 5.1)
lhere are several stages that contribute to the total noise power:
Pro s =Pr,] +61',,2 + 6Pr,3 + .... + 6P,,5-1
1i'1. 1i'1. /12 5_11i'1. /1'1.5
-1
n= 12 + 3 12 + 9 12 + .... + 3 12 = 12 }: 3 (5.5)
n-o
After the last stage 5, the Hartley spectrum samples are raised to a square and
summated for making a power spectrum (formula 4.12) I whereby the noiseagain is doubled:
'1. 5-1
Pr, prodS) =2 ~2 I 3n
n-o(5.6)
5 : IoglN, N is the length of input array
In the first implementation of the CCSA application, maximally l' stages can
occur (S =11):
Pt , "rodl1) = -31 dB (5.7)
From 5.2 and 5.7 we see that the data processing adds 52 dB to the input
qU8ntisation noise power in this worst ~e modelling. If we approximate the
normalized (0 s Pu s 1) average input power by Pw = V16 (stochasticcharacterisation of an EEG signal, normal distribution [Verlcroost, 1985]) we cancalculate the resulting information contents 1 :
PwIin"ul = 10 log P, = 10 log VI6 + 83 = 71 dB
ItD141 = Iinput - 52 =19 dB
(5.8)
(5.9)
This is the information contents of the calculated power spectrum In the worst
case model, where all noise terms add up. and where the frequencytransformation is performed in the maximum number of l' stages (whereby thenoise is forwarded 11 times in the calculation process - see form. 5.5).

48.'''''UU1'''''.''1''" .un L I ,nunllUu 11'" • a.", ltll , In tt I n n
S-creen resolution. As we have calculated the (worst case) accuracy of thespectrum calculation, we will assess the accuracy of the spectrum display. Thiswill concern the number of pixels that are available In vertical direction for thedisplay of the power value on a monitor screen.
• Only a part of the total available pixels In the V-direction are used for thedisplay of power values (see figure A.1, appendIx A). In the CCSA program 1,,$ ofthe height of the screen is reserved for the power-axis. This Implicates that for
example in VGA display mode 96 pixels are available for the range of the power
values. Logarithmically, this ·power resolution· Is:
Rdisplily = 10 log 96 • 20 dB (5.10)
Comparing 5.10 with 5.9, we see that the resolution on screen is almost thesame as the worst case modelling of the calculation process.
5.2 Testing the usage of the application
When the development of a rt&N tool Is done, one Is Interested In how users will
work with the application. In short, we want to know whether theuser-friendliness in the design is good and practical.
In the CCSA application, several features are of interest when considering the
usage of this EEG analysis tool:
• options that were implemented for Improvement of the ability to see
details in the EEG spectra such as the conveX/concave display, color
display and changing the angle of view of the CSA, should be evaluated
on their usefulness.
• the menus that were designed to enable users to adjust parameters suchas epoch length and EEG spectrum frequency range and also settings
like channel or time window should be~y to use.
• the designed function keys should enable short-cuts for changing
parameters and as such, should be useful.
These features are considered again In the next chapter.

, EEG anaJYI~
~ EEG analysis
49
EEG data were used for evaluation of the developed CCSA spectrum analysistool. The first part of this chapter however, also ot-.'· ~7th relations wffhanesthetic levels of the investigated data.
6.1 Anesthetic depth assessment
This paragraph will evaluate characteristic frequencies in the EEG data as
measured form the cat "EN2", where we will go Into some (technical) details inthe first sub-paragraph and consider customized parameters in the second. As
the evaluation was concerned with data from only one subject, the observationsdescribed in this paragraph should be considered as a case study. No generalconclusions can be given.
6. 1. 1 Quantitative co"ellltions
11'Ie measurement of quantitative EEG parameters from the data testset (see§ 5.1.1) consisted of letting the CCSA program calculate the characteristic
frequencies in the EEG spectra, and recording of these parameters Into a file.The results were plotted in several graphs, of which two are printed below.Please refer to § 5.1.1 for information about the anesthesia levels in the seven
periods.

50 EEG .".Iy';. for monitoring of .".d1.tic t»pth""' 'n ..... J II t\l
----- m -- ",.~,." ~~
c op_Oel
E F
Figure 6. 1 Characteristic frequencies, calculated In channel 1,with epoch 2 seconds (Blackman window)
... ----- '.m - n p_1c
eo
-..
-.:0- :110i5.
l aD
10
0
Figure 6.2 Characteristic frequencies, calculated In channel 1,with epoch 5 seconds (Blackman window)
In figures 6.1 and 6.2, the periods A to G in the horizontal axis represent thedifferent levels of anesthesia (separately measured files were put In onecombined file) I where the duration of each period with constant level is 90seconds.
In these figures we see that only the spectral edge frequency SEF and thecustom frequency show clear variations. The custom frequency will bediscussed in the next paragraph 6.1.2, so we will now concentrate on the SEFonly. However, we can state for sure that, when considering ell measurements Inthis one subject, generally the baseline recording (period A) showed highercharacteristic frequencies (especially the spectral edge and medianfrequencies).

• EEG 8nWys;' 51sen 0; tit , ......, )6"""
Burst suppression. Figure 6.1 clearly shows the influence of burst suppression
in level 6 (period E). From the extreme variations in the SEF we may conclude
that such measurements do not provide reliable results. For verification, see also
the other figures in this chapter (with other epoch lengths).
Sequences. There are two sequences of anesthesia levels to be considered in
the figures 6.1 and 6.2. The first sequence is given from periods A to 0, where
after the baseline recording first N20 was administered, and thereafter N20 wasused together with 0.3 MAC Isoflurane and with 0.6 MAC lsoflurane asanesthetic. We see that the use of these combinations of drugs excites the EEG.
+ The second sequence of data is given by period A: baseline, period G: lowIsoflurane, period F: high lsoflurane. From the channel 1 recording of this
sequence the following tables were made:
Table 6.1 Statistics of spectral edge freq., period A (level 1)
epoch (soc.) mean (Hz) standard dev. (Hz)
2 41.36 3.36
5 38.21) 2.13
10 37.53 1.24
Table 6.2 Statistics of spectral edge freq., period G (level 5)
epoch (soc.) mean (Hz) standard dev. (Hz)
2 21.73 6.74
5 21.10 4.14
10 21.15 3.03
Table 6.3 Statistics of spectral edge freq.• period F (level 6)
epoch (sec.) mean (Hz) standard dev. (Hz)
2 20.89 5.13
5 19.52 4.65
10 19.81 4.15
We see from these tables that the mean value of the SEF is lower for deeper
anesthesia, although the differences between levels 5 and 6 are small.

52 EEO 'rWy-" for monitoring of 81I• .th.tic depth
Arlottlef obServation of the tables 6.1- .. 6.3-lndieates-the higher standard
deviation values for shorter epoch lengths. A conclusion Is therefore thai when
processing EEG data, the epoch length shOuld not be chosen too short.Resulting EEG parameters should be considered together with the standard
deviation. Further, quantitative analysis of implications of processing relatively
short epochs is to be performed.
6.1.2 Custom parameters
The custom characteristic frequency thai was Implemented in the CCSA
program, is defined as the mean value of the spectral edge frequency SEF and
the median power frequency MPF. But as can be seen In the figures In this
chaptef, the MPF does not change very much in different levels of anesthesia;
therefore, the customized parameter shows the same variations as the SEF. In
Mure versions of the program, this custom EEG parameter may be used for
other calculalions, since this can be changed easily in the source code.
Windows. In figures 6.3 and 6.4 measurements with different time windows (see
§ 4.2.2) are presented. The usefulness of being able to choose different time
windows can be seen in the figures: the InlIuence of the burst suppression
patterns, present in period E. Is more clearly seen in figure 6.3, calculation with
the Blackman window. ll1e "dip" in the characteristic frequencies, caused by an
artifact in the baseline recording - period A, Is more dramatic In USing theBartlett time window, and therefore perhaps easier to detect.• However, generally speaking the implemented time windows give the same
results. The only two, major, differences are: one, the Rectangle and Bartlett
Figure 6.3 Characteristic frequencies, calculated In channel 0,with epoch 10 seconds. using the Blackman window

53
----- ....0"' - "'.CI." ..._..-.._
c o~.n."
E F
Figure 6.4 Characteristic frequencies, calculated In channel O.with epoch 10 seconds, using the Bartlett window
windows do not reduce power contents of the original EEG signal as much asother windows. and two, the Hanning. Hamming and Blackman windows usemore processing time (see § 4.2.2). So for large arrays (large epochs, !mJl.z.ttg) theuse of the latter windows can be dissuaded, the more so as processing largearrays of EEG data already reduces the spectral leakage phenomenon (see
chapter 4).
6.2 Using the CCSA application
6.2.1 Overall performance
In general. I think I may state that the performance of the developed EEGspectrum analysis tool is good. A few researchers aJre8Ct)' experimented with the
program and indicated some minor alterations. About the usage, the followingremarks can be made:
• Of the Improvements that were made on the CSA technique, the use of
different colors for the successive spectra and an angle of view different
from 90 dE9ees (compare for tnst...ce 1igure 22 - chapter 2. to theCCSA In figure 3.2) are pleasant to use. and really make #Ie display of

54""tit tI I til. UII tt " .... !It. I
EEG ,rta'Y"' (Of mottftoring of."• .th.tic depthn.
spectra more clear. The concave CSA option Is not frequently used, but
this may be different with different data.
• The menus provide easy-tCH:hange parameter settings, although users In
the beginning can not easily remember what to change In which menu
(see appendix A). Changing a few settings/options In different menus at
the same time Is sometimes wanted, txt this Is not possible In the current
design.
• Shortcut keys for changing e.g. the channel In a file to be processed arenot frequently used. The most useful function keys are those that enable
the -stepping- through a file (nextlprevious CCSA, F4 and F5. see
appendices A and B).
6.2.2 Completeness ofanalysIs options
The CCSA application program proved to be fairly complete, as to the display ofdata and possibilities in changing parameters, but only one major extension may
be very useful: the display of the time data that Is processsed. Wrth this
extension, investigators of EEG spectra are able to detect major artifacts in the~EG. and are then -on-line- able to assess the reliability of the resulting spectra.
The parameter settings that are displayed on screen as well as in the menus
(see figure A.1 , appendix A) are sufficient. Other settings are visible in the CCSA
display or are easily remembered.
6.3 Summary
This chapter presented results of a case study of EEG data as measured In one
eat. Because of this small tastset, general conclusions cannot be given.
HOY/ever, in the measured characteristic frequencies PPF, MPF and SEF we
observed only significant changes in relation to anesthetic depth In the SEF
parameter. Furthermore, the processing of not too short epoch lengths ( > 2
seconds) can be recommended.
The data were particularly used for evaluation of the developed CCSA tool, and
from the use of this application by several people we can conclude that the tool

• EEG MalYI;' 55
provides a useful extension for the Anesthetic depth project. From now on thework in this project Is not only concerned with the auditory evoked potential
stUdies in SUbjects under anesthesia, but the assessment and design of "direct"
EEG parameters will also be part of the research.

7 CondwioM....."n' "'l"n
; Conclusions
7.1 General evaluation
57
Reflecting on the development and testing _ described in the previous
chapters, this study comes to 8 conclusion by giving the oyerali resutts andachievements below.
The main purpose of this study was to extend the Anesthetic depth project of the
division of Medical Electrical Engineering at the Eindhoven University ofTechnology into the field of EEG monitoring of anesthetic depth. As a result ofthis study, the analysis of EEG spectra and parameters in these spectra can beperformed with the developed CCSA application In a flexible manner, where
new, customized EEG parameters can be easily implemented by researchers
with some programming experience.
A brief case study was performed on EEG data in one subject _ measured
during previous studies. Technical details of this study indicate that different
properties of data used for evaluation in the frequency domain influence the
usefulness of EEG spectrum analysis. Conclusions should be drawn with
caution.
In this case study, we have also tried to assess anesthesia levels, through
analysis of characteristic frequencies calculated in the EEG spectra The only
major conclusion to be stated here, Is the observation that the ·spectral edge
frequency- seems to be a promising EEG parameter for assessment ofanesthetic depth.

58..." .... 'Itt Ut t
Further research Is necessary to analyze the EEG data available within theAnesthetic depth project. New designed EEG parameters can be Investigated
with the developed EEG analysis tool.
7.2 Annotations
7.2.1 Future use of the CCSA program
Within the Anesthetic depth project the developed CCSA program shall be used
f01 evatua1ion of EEG measurements. and as a tool for trying to define andinvestigate (new) parameters that have definite correlations with anesthetic
depth. This will be part of evoked potential studies (already two EP studies were
performed - see Cluitmans [1990]). where the Incorporation of the EEG
parameters should help in the assessment of the level of anesthesia andespecially awareness.
I want to state very clearly here that the CCSA program Is a researctrtool; we do
not mean to impose a new. additional anesthesia monitoring screen on theanesthetist, for he or she already has an extensive task of Interpreting all kinds
of patient-signals during an operation. If 8lTf EEG (spectrum) parameter as
mentioned above has been found, further research Is necessary to investigate
the possible future use In an automatic anesthesia monitoring end control
system.
7.2.2 Development ofextensions
In future usage of the developed CCSA program users (researchers) may come
to think of some useful additions they would like to see implemented. Easy
implementation depends In the first place on the complexity of the problem andof course also on the experience of the programmer.
Some possible extensions that I have though! of are:
• display of the processed time signal simultaneously with the power
spectrum plots, enabling investigators to Osee what's going on· In theoriginal signal, for example for detection of "burst suppreslon· patterns.
For this, use could be made again of the display-area of the

59$ Ai. n n ,un ...
-messageslfunction-keys" bar at the bottom of the designed screen (seeappendix A).
- display on screen of exact values of characteristic frequencies. Thesevalues can only be reviewed exactly rON In a recorded file. Plotting themon screen for instance as floating point numbers may prove to be usefulwhen the accuracy of the visual screen evaluation Is too limited (see also§ 5.1.3).
• printing to file of the values of the spectrum arrays of a selected portion ofthe CCSA spectra, thus enabling to review spectra with the exact valuesof the frequency components. Again, accuracy on screen limits this duringthe display of spectra. A convenient format must be defined for this writingto file of a lot of (floating point) numbers.
• extending the program for more (new) EEG spectrum parameters.Implementation of this will probably be simple, as already some exampleparameters were implemented (characteristic frequencies).
" real·time processing for on-line spectrum evaluation during measurementsessions. The on-line calculation of spectra could be used for previewingderivations of the measured data, and therefore might be used as anIndication for the information contents and maybe for the "usefulness" ofthe measurement. ReaI·time adaptations are already (briefly) described in§ 4.3.2.
The above mentioned possibilities could provide an even more lIexible CCSA
application, but implementation is only meaningful tf there really is a need forthese extensions.
7.3 Final remarks
In this report, EEG data evaluation is brief. Although some general observationsof anesthetic depth correlates were made, the data evaluation particularlyfocussed on the use of the newly developed EEG spectrum analysis tool.
Implications of changes in the spectrum calculation process on the usefulness
and quality of the resulting EEG derivatives or possible anesthetic depthparameters were investigated.

60 EEG .,..Iy~. for monitoring ofMelthetic depth
Therefore. the Anesthetic depth project of· the division Of Medical Electrical
Engineering Bl the TUE will evaluate extenslvety all available data previouslymeasured or measured in the future. The auditory evoked potential studies can
then be extended by taking Into account the nsw found EEG parameters and a
more reliable (automatic) anesthetic depth assessment should come within
reach.

*_u,,,. ttL H
Glossary
ADC
AEP
aliasing
alpha (a)
amnesia
analgesia
anesthesia
anesthesiologist
anesthetist
ANSI
beta (~)
61
analog to digital conversion
aucitory evoked potential
distortion in a signal as a result of sampling the original
signal with a too low sample frequency
(in EEG: ) main frequency distribution in the range 8 Hz •
12 Hz (approx.)
loss of memory On this report especially: ) Induced by
anesthesia [Merriam-Webster Inc., 1986]
Insensibility to pain without loss of consiousness
[Merriam-Webster Inc., 1986]
loss of sensation and usually of consiousness without
loss of vital functions, artificially produced by the
administration of one or more agents that block the
passage of pain Impulses along nerve pathways to the
brain [Merriam-Webster Inc., 1986]
a physician specializing in anesthesiology < : branch ofmedical science dealing with anesthesia and anesthetics>
[Merriam-Webster Inc., 1986]
one who administers anesthetics [Merriam-Webster Inc.,1986]
American National Standards Institute
(in EEG: ) main frequency distri~ion In the range 12 Hz
30 Hz (approx.)

62
brain waves
CCSA
CFAM
cortex
CNS
CSA
DC
delta (6)
DFT
DHT
DSA
EEG
EMDABS
EP
epoch
ERDA
ergodic
FFT
FHT
FIR
EEG ,M/yli, fO' monitoring of .,.."".lic depth
rhythmic fluctuations of vottage between Parts of the brainresulting In the flow of electric current [Merriam-WebsterInc., 1986]
convex/concave compressed spectral array
cerebral functioning analyzing monitor
the outer layer of grey matter of the cerebrum andcerebellum that contains most of the higher nervouscenters [Merriam-Webster Inc., 1986]
central nervous system
compressed spectral array
direct current
(in EEG: ) main frequency distribution in the range 0 Hz 4 Hz (approx.)
discrete Fourier transform
discrete Hartley transform
density spectral aUfI(
electroencephalogram: the tracing of brain waves madeby an electroencephalograph <: an apparatus fordetecting and recording brain waves > [MerriamWebster Inc., 1986]
eleclrophysiologic monitoring database system
evoked potential
time interval to be frequency transformed
event recording and data acquisition
of or relating to a process In which every sequence orsizeable sample Is the same statistically and thereforeequally representative of the whole [Merriam-WebsterInc., 1986]
fast Fourier transformation
fast Hartley transformation
finite Impuls response

GIo.aary 63II ,.,. III I
hypoxia deficiency of oxygen reaching the tissues of the body
whether due to environmental deficiency or Impaired
respiratory and circulatory organs [Merriam-Webster Inc.,7986]
ischemia localized tissue anemia < : a condition In which the
blood Is deficient In red blood cells, hemoglobin. or both
or deficient in total volume due to obstruction of the Inflow
of arterial blood > [Merriam-Webster Inc., 7986]
MAC minimal alveolar concentration < : the concentration ofan inhalation anesthetic drug at 1 atmosphere equilibrium
required to abolish movement in response to a noxiousstimulus in 50 percent of a test population>
MPF median power frequency
NLA non-Iinear analysis
Nyquist's theorem (also called sampling theore~ a signal may be uniquely
represented by discrete samples spaced no more than
half the bandwidth apart
PPF peak power frequency
S£F spectral edge frequency
SNR signal to noise ratio
theta (8) (in EEG: ) main frequency distribution in the range 4 Hz •
8 Hz (approx.)
VGA Video Graphics Array

65
References
As, J.J. van der (1990),Intelligent alarms in anesthesia: 8 real time expen system application. Ph. D.
Thesis, Eindhoven, The Netherlands: Eindhoven University of Technology
Bart, A.J., Homi, J. & Unde, H. W (1971),Changes in pc7Ner spectra of e1ectroencephaJograms during anesthesia withf1uoroxene, methoxyflurane and ethrane. Anesth. and Ana/g., 1971, SO, 1, pp.
53-63
Bassr, E. (1980),
EEG-Brain dynamics: relation between EEG and brain evoked potentials.
Amsterdam, The Netherlands: Elsevier SCience Publishers (Biomedical Division)
Berezowskyj, J.L, McEwen, J.A, Anderson, G.B. & Jenkins, Le. (1976),
A study of anaesthesia depth by power spectral analysis Of the
electroencephalogram (EEG). Can. Anaesth. Soc. J., 1976,23,1, pp. 1·8
Bickford, R.G., Billinger, T.W, Flemming, N.I. & Stewart, L (1972),
The compressed spectral array (CSA) • 8 pictorial EEG. Proc. San Diego
Biomed. Symp., 1972, 11. pp. 365-370
Bickford, R.G., Brimm, J., Berger, L & Aung, M. (1973),
Application Of compressed spectral array In clinical EEG. In: Automation OfClinical ElectroencephaJography. Ed. by P. Kellaway & I. Petersen, New York,
New York, U.S.A.: Raven Press, pp. 55 - 64

66
Bickford, R.G. (1979),
Newer methods of recording and analyzing EEGs. In: Current Practice of ClinicalElectroencephalography. Ed. by O.W. Klass & 0.0. Daly, New York, New York,U.S.A.: Raven Press, pp. 451-480
B/acher, R.S., (1984),Awareness during surgery. Anesthesiology, 1984, 61, pp. 1-2
BJom, J.A. (1990),
The SIMPLEXYS experiment: real time expert systems in patient monitoring. Ph.O. Thesis, Eindhoven, The Netherlands: Eindhoven University of Technology
Booij, LH.D.J. (1989),
Bewust van bewustzijn (Aware of awareness - in Dutch). Nijmegen, TheNetherlands: Nijmegen Catholic University
Bogetz, M.S. & Katz, J.A. (1984),Recall of surgery 10r major trauma. Anesthesiology, 1984, 61 , 6-9
Bovill, J.G., Sebe/, P'S., Wauquier. A. & Rag, P. (1982),
Electroencephalographic effects of sufentanil anaesthesia in man. Brit. J.Anaesth., 1982,54, pp. 45-52
Bracewell, R.N. (1986),
The Hartley transform. New York, New York, U.S.A.: Oxford University Press
Clark, D.L, Hosick, E.C. & Rosner, B.S. (1971),
Neurophysiological effects of different anesthetics in unconscious man. J. Appl.Physiol., 1971, 31, pp. 884-891
C/unmans, P.J.M. (1990),
Neurophysiological monitoring of anesthetic depth. Ph. O. Thesis, Eindhoven,The Netherlands: Eindhoven University of Technology
Collins, v.J. (1976),
Principles of anesthesiology. 2nd edition, Philadelphia, Pennsylvania, U.S.A.:Lea & Febiger Publishers
Eger, E.I. (1984),
Monitoring the depth of anesthesia. in: Monitoring in Anesthesia, 2nd edition, Ed.by L.J. Seidman & N. T. Smith, Boston, Massachusetts, U.S.A.: Butt9fWorthPublishers, pp. 1-17

R.ferences 67
Ende, N. van der, Boezeman, E.H.J.F., Hengeveld, S.J. & Simons, AJ.R.(1990),Is sound-related desynchronization of the alpha-rhythm in the
electroencephalogram a useful criterion fO( the detection of -.vareness? In:
Memory and Awareness in Anaesthesia, Ed. by B. Bonke, W. Fitch & K. Millar,
Amsterdam, The Netherlands: Swets & Zeltlinger Publishers, pp. 362-364
Enden, A VY.M. van den & Verhoeckx, HAM. (1987),DigitaJe slgnaaJbewerking (Digital signa/processing - in Dutch). Amerongen, TheNetherlands: Delta Press B.V.
Faulconer, A. & Bickford, R.G. (1960),Electroencephalography In Anaesthesiology. Springfield, Illinois, U.S.A.: Charles
C. Thomas
Findeiss, J.e., Kien, G.A, Huse, KO.VY. & Unde, H.VY. (1969),Power spectral density of the electroencephalogram during halothane and
cyclopropane anesthesia In man. Anesth. and Analg., 1969, 48, 6, pp.1018-1023
Grundy, B.L. (1985),Selecting an EEG machine fOf' your Pfactice, If, when, and what machine, EEGmonitoring in the operating room and critical care unit. In: EEG MONITORING In
Anesthesia & Critical Care· State of the Art: 1985, March 8,9 & 10, 1985, BettyGrundy, M.D., Course DirectO(, Houston, Texas, U.S.A.
Hartley, R. V.L (1942),
A more symmetrical Fourier analysis applied to transmission problems. Proc.
IRE, 1942, 30, pp. 144-150
Interspec Inc. (1985),Monograph: EEG and Evoked Potential Monitoring during and after surgery.
Conshohocken, Pennsylvania, U.S.A.: Irterspec Inc., 1100 E. Hector St.,
Conshohocken, PA 19428, U.S.A.
Jackson, LB. (1989),
Digital filters and signal processing. 2nd edition, Boston, Massachusetts, U.S.A.:
K1l1Ner Academic Publishers

68II"
EEG .,."Iy". for monitoring of."• .",.fjc depth
Jansen, J.~ (1990),
Artefact detectie en verwijdering In auditieve evoked potentials (Artefactdetection and removal In auditory evoked potentials· In Dutch). M. Sc. Thesis,Division of Medical Electrical Engineering, Department of Electrical Engineering,Eindhoven University of Technology, EindhoYen, The Netherlands: EindhovenUniversity of Technology
.long. P.G.M. de (1986),Ontwikkeling van een event recording module voor een event recording en dataacquisitie systeem (Development of an eve':ll recording module for an eventrecording and data acquisition system· In Dutch). M. SC. Thesis, Division ofMedical Electrical Engineering, Departmert of Electrical Engineering, EindhovenUniversity of Technology, Eindhoven, The Netherlands: Eindhoven University ofTechnology
Kernighan. S.~ & Ritchie, D.M. (1988),The C programming language. 2nd edition, Englewood Cliffs, New Jersey,U.S.A.: Prentice Hall
Kuipers, H. (1991),
Ontwerp en formele definitie van hat 'StudylSubjectlSession' gedeelte van hatdata model voor het klinische informatie systeem EMDABS (Design and formaldefinition of the 'StudylSubjeetlSession' part of the data model for the clinicalinformation system EMDABS • In Dutch). Internal report 91EME01, Eindhoven,The Netherlands: Eindhoven University of Technology
Le"Y- ~J., Shapiro, H.M., Marushak, G., Meathe, E. (1980),Aliomated EEG processing for Intraoperative monitoring. Anesthesiology, 1980,53, pp. 223-236
Ls"Y- ~J., Grundy, S.L & Smith, N. T. (1984),Monitoring the electroencephalogram and evoked poter4lals during anesthesia.in: Monitoring in Anesthesia, 2nd edition, Ed. by L.J. Seidman & N. T. Smith,Boston, Massachusetts, U.S.A.: Butterworth Publishers, pp. 22.7-267
Ls"Y- ~J. (1986),Power spectrum correlates of changes In consciousness during anestheticInduction with enfIurane. Anesthesiology, 1986, 64, pp. 688-693
Le"Y- ~J. (1987),Effect of epoch length on power spectrum analysis of the EEG. Anesthesiology,1987,66, pp. 489-495

R.fer.nce. 69
McCallum, WC. (1989).
Attention. In: EncyclopcBdia Britannica. Fifteenth edition, 1989, volume 14, pp.~386, Chicago, Illinois, U.S.A.: Encyclopaedia Britannica Inc.
Media Cybernetics (1988a).
HALO '88'" Graphics Kernel System • Library reference. Silver Spring,
Maryland. U.S.A.: Media Cybernetics
Media Cybernetics (1988b).HALO ·88.... Graphics Kernel System • Language and device reference. Silver
Spring. Maryland. U.S.A.: Media Cybernetics
Merriam-Webster Inc. (1986),
Webster's Third New International Dictionary of the English Language •
unabridged. Chicago, Illinois, U.S.A.: EncyclopcBdia Britannica Inc.
Microsoft" Corporation (1990),
Writing portable programs. In: Microsoft~ C, Advanced Programming
Techniques, pp. 317-342, Redmond, WA. U.S.A.: Micr~ Corporation
PfaffenhOfer, F.M., P.J.M. Cluitmans, H.M. Kuipers (1991),
EMDABS: design and formal specification of 8 datamodel for a clinical research
database system. EUT report no. 91-E·250, Eindhoven, The Netherlands:
Eindhoven University of Technology
Prank. R.AF. (1986).
Peri-operative monitoring. in: Handbook of ElectroencephaJography and Clinical
Neurophysiology. Revised series, volume 2: Clinical applications of computer
analysis of EEG and other neurophysiological signals, Ed. by F.H. Lopes deSilva, W. Storm van Leeuwen & A. Remond, Amsterdam, The Netherlands:
Elsellier Science Publishers (Biomedical Division)
Pryse-Phillips, WE.M. (1989),
Nervous system diseases and disorders. In: Nerves and Nervous Systems, in:Encyclopaedia Britannica, Fifteenth edition, 1989, volume 24, pp. 8$858,Chicago, Illinois. U.S.A.: Encyclopaedia Britannica Inc.
Rampil./.J.• Sasse. F.J.• Smith, N. T.. Hoff, S.H.• Flemming, D.C. (1980),
Spectral edge frequency· a new correlate of anesthetic depth. Anesthesiology,1980,53 (suppl.), 3. p. S12 (abstract)

70'11
EEG .,.Iy~. for monitoring ofan.~.ticdepthtit n It "ao ~
Rampil, '.J. & Smith, N. To (1984),
Computers in anesthesiology. In: Monitoring In Anesthesia, 2nd edition, Ed. by
L.J. Seidman & N. T. Smith, Boston, Massachusetts, U.S.A: ButterworthPublishers, pp. 441·496
Schwilden, H., SchUttler, J. & Stoeckel, H. (1987a),
Closed·loop feedback control Of methohexital anesthesia by quantitative EEGanalysis in humans. Anesthesiology, 1987, 67, pp. 341-347
Schwilden, H & Stoeckel, H. (1987b),
Quantitative EEG analysis during anaesthesia with lso1lurane In nitrous oxide at1.3 and 1.5 MAC. Brit. J. Anaesth., 1987, 59, pp. 738-745
Schwilden, H, Stoeckel, H & SchUttler, J. (1989),
Closed·loop feedback control Of propOfol anaesthesia by quantitative EEGanalysis in humans. Brit. J. Anaesth., 1989, 62, pp. 29(}296
Sebel, P.S., Bovill, J.G., Wauquier, A. & Rog, P. (1981),
Effects Of high-dose fentanyl anesthesia on the electroencephalogram.Anesthesiology, 1981, 55, pp. 203-211
Sebel, P.S" Maynard, D.E., Mauor, E, Frank. M. (1983),
The cerebral function analyzing monitor (CFAM). Brit. J. Anaesth., 1983, 55, pp.
1265-1270
Sebel. P.S. (1985),Effects Of anesthetics on the EEG. In: EEG MONITORING In Anesthesia &Critical Care· State Of the Art: 1985, March 8,9 &10,1985, Betty Grundy, M.D.,
Course Director, Houston, Texas, U.S.A.
Simons, A.J.R., 8oezeman, E.H.J.F. &Pronk. R.AF. (1989),
Automatic EEG monitoring Of anaesthesia. Baillierre's Clin. Anaesth., 1989, 3,3,pp.623-646
Smith, N. To, Rampil, I.J., Sasse, F.J., Hoff, S.H &Flemming. D.C. (1979),
EEG during rapidly changing halothane or enfIurane. Anesthesiology, 1979,51
(suppl.), 3, p. S4 (abstract)
Spehlman, R. (1981),
EEG Primer. Amsterdam, The Netherlands: Elsevier Science Publishers
(Biomedical Division)

71
Varri, A. (1988),
Digital processing of the EEG in epilepsy. Ucentiate Thesis, Tampere, Finland:Tampere University of Technology
Verkroost, G. (1985),
Syllabus no. 5625 van hat college Signalen m(Syllabus no. 5625 or the lectureson Signals m. in Dutch). Eindhoven, The Netherlands: Eindhoven University of
Technology
Withington, P.S., Morton, J., Arnold, R., Sabel, P.S. & Moberg, R. (1986),Assesment of power spectral edge for monitoring depth of anaesthesia usinglow rnethohexitone infusion. Internal. J. Clin. Monitor. Comput., 1986, 3, pp.117-122

~ndixA
, "De-eription of ttt. CCSA ",..m • cUp.y.yout 73
A. Description of the CCSA program & display layout
Description
The CCSA program processes EEG data for anatysis of the power spectra of anEEG recording (one channelSl a time). The chronological spectra are displayed
as a CCSA: ·Convex/concave (color) Compressed Spectral Array·.
For starting the program, the following arguments are valid:
cess <timedala file> <calibration file> <settings file>
These files are checked on accessability at startup time.
If the 1hird argument Is left out, a default settings file Is used. If the first and
second names are m given, the program starts up normally (loading the default
settings file) I and then first asks for the filename of the timedata file to be
analyzed, and after this asks for the filename of the calibration file.
A calibration file contains the calibration and offset values for each of the
channels (encoded in the samples - see § 4.1.3) and the filepositions On bytes)in the timedata file between which the calibration values are vali~. Also a
·comment·-string can be specified, which is displayed during the plotting of the
corresponding data
A settings file contains information on how spectra are to be calculated and
displayed.
Four menus are available: ·options·, ·characteristic frequencies·, ·settings· and
"unction keys·. The last menu only gives a brief description of the use of the
functiorVShortcut keys (see appendix B).
o The options menu enables to change:
fSllrrrpu, fmll.%,Ng, epoch length, adjusting of epoch (yes/no), normalized/squaredvoltage CCSA spettra, resca1ing ofCCSA (yes/no), time interval begin ofCCSA,opening of the charaderistic frequencies menu.
o The characteristic frequencies menu enables to choose/adjust:
plotting of MPF, PPF, SEF, custom frequency (yes/no), spectral edge factor,rerording of the char. frequencies (yes/nO).

74_.,... 11' It l\UM't11111 1
Ap~ndixA
o .. The .ettlriga menu 8nables to choose/Change:·
convex/concave display, colur/nocolur, number of lines in the CCSA. angle ofview, Time window (Rectangle / Bartlett / Hanning / Hamming / Bltukman),FIR filtering (yes/no), channel (0/1/...), Saving of settings file, lmding oftim.edata file (& azlibralion file), Restoring of default settings, lDading ofa newsettings file.
Messages are displayed when a user tries to adjust a parameter to a wrong
value (e.g. !umrpu must always be larger than twice!mu,Ng)'
Display layout
A simplified representation (black & white) of the CCSA display layout on amonitor screen is printed in figure A.1
IC41nv•• ca_1 .3 IlAC ICZO +.3 IIC Isarluint Tl....t&1 EMa.ML
L-a.ttln.. : .£NO••T'
F(...)._MPLE .... ••Chann.l •F(...)EEC •••• ••....~ l.ft.t~ .... •••
I"J~_ ••llIt ••n •••• II.
~t{}:.... .........c a&Ae:-N
~ Fl. ,..1 •••• w••• I\N rh_. (!AU)
~~ - - 1-'••". _nil I __n 1/
tl.. ( ••D):I••ul..n ..nil I __n II
••••• •••• H• I"-.,8 ......._1 __n I'
I In ceeallracelD.llra Onlll,.. "'Mtlln ...",lln at II,., ••"'.II,......n.lI" ExitI
Figure A 1 Display layout of the CCSA program

AppendixB Row clw1 of til. CCSA mMU .tnlc1In 75
B. Flow chart of the CCSA menu structure
Fi: function key actionexplanation: P. 1.0.
START
Main Menu choice
No
F1 • FI
Vea
OpenMenu F' F7 , F'
print In file
FI
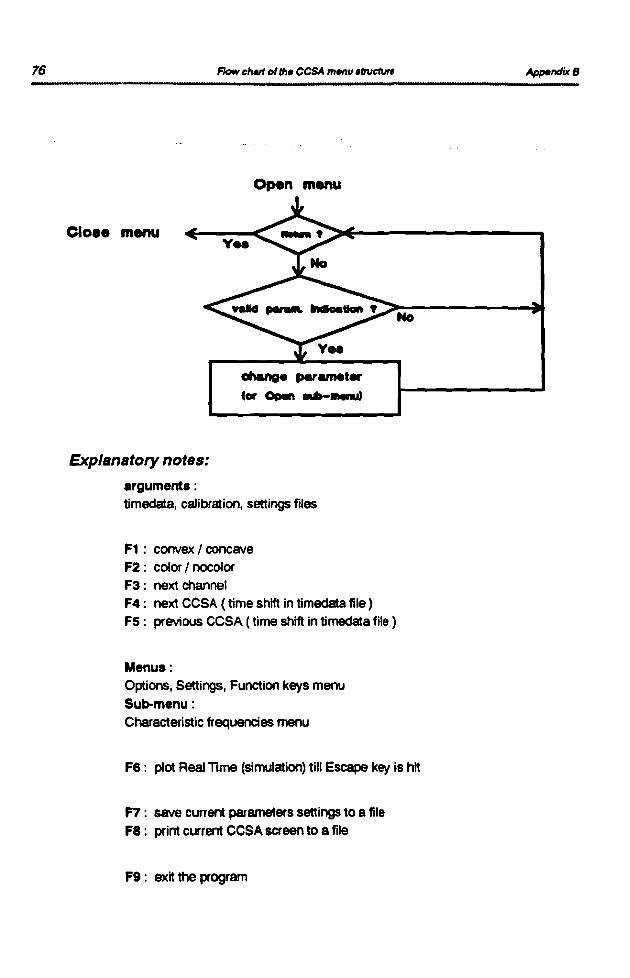
76 Flow chait ofIII. CCSA mMU ,t1uc1url
Open menu
AppendixB
Clo•• menu
No
Explanatory notes:
.rguments:timedala, calibration, settings files
F1 : convex I concaveF2: color I nocolorF3: next channelF4: next CCSA ( time shift in timedata file)FS: previous CCSA ( time shift in timedala file)
Menus:Options, Settings, Function keys menuSub-menu:Characteristic frequencies menu
Fe: plot Real TIme (simulation) till Escape key is hit
F7: save current parameters settings to a fileFe: print current CCSA screen to a file
F9: exit the program

AppendixC CalculatkKI of th. FIR fill., traMf", value 7711 M
c. Calculation of the FIR filter transfer value
The FIR filter transfer function (formula 4.4 - chapter 4) does not have a
definite mathematical solution. Its value depends on two variables, L and C, and
therefore we can only approximate C as a function of L.
In low-pass filtering transfer functions, we are Interested in the cu·off frequency
CcuI~fJ ' which Is the -3 dB point In logarithmic power spectrum plots: at thispoint the power of the Input signal Is halved, which Implies that the amplitude
has dimished with the factor vO.5. From figure 4.2 we can deduce that Ccul~fJ
will be approximately proportional to 1f/L I and therefore we will derive the value
of H (e j C 'C1II~ for:
rv :It." cut~fJ =vL
v> 0 (Col)
With this formula we obtain an estimation C'cut~fJ for the precise cut-off
frequency CaJt~. Below, we will show how well CaJt~ Is estimated, and what
value of v should be chosen.
Wrth C.l the FIR filter transfer function becomes (compare to form. 4.4):
. (2L+l:1t)sm ---H (e jC 'ntI~ = _1_ 2 vL
2L+l,(:It)sm 2vL
We can now calculate the limit:
. 2L+ 1 :It, , 1 srn(-2-vL)
lim L-.. H (e IC ntI~ =lim L-" 2L 1---=---:":~+ .:It )
sm(2vL
. 1 sin( 2; v~) l' sin(;) Sin(;) one( 1=lrm L-.. 2L -.......;;;;,.....;..;;'- = rm L-.. =--=sr - )
. ( :It ) 2L("!!"") (~) vSin 2vL 2vL v
(C.2)
(C.3)

78.. T 1_MU"'0 ,
c.Jculation of tile FIR tur., ".".,., v.llIt/ Appendix C
This resulting ·sine·-function should have the value vO;S for Qcu/-oJf. In a·sine·-table we find:
'C' 1H (e l ...,~ = sinc( -) = vO.5 = 0.7071v
.. v =2.257
But, while we have only calculated an estimation for the cut-off frequency
Ccu/-off, the actual FIR filter transfer value (formula C.2) is verified below for the
calculated value v = 2.257.
Table C.1 FIR filler transfer value for different L
L H(ejC'tIIt~
1 0.452
2 0.578
5 0.655
10 0.681
20 0.694
50 0.702
100 0.704
1n table C.1 we see that the FIR transfer value at our estimated Ccut-off is smaller
than the desired value of vO.S for small L, but while we will have fairly large Lthis is acceptable; for example if fmnpu = 5000 Hz., fmu..«g = 50 Hz:
t-mplt(C.4)
Concluding we can say that the FIR filter transfer value at the chosen cut-off
frequency !mtlX,ttg - C'eut~" (see § 4.2.1) Is not exaetty the -3 dB point Ccu/-off,but one should keep in mind the fact that 8ttf aliasing-effects will Influence thespectrum only close to the Ccut-off, because the transfer value rapidly diminishes
to -40 dB anywW{ for Increasing Q (see figure 4.2), which Implies that only 1/100
(1 percent) of 8 signal passes through the filter.

Appendix D F,~uency ntWformation: Fourier ...,.~Hartley 79
(0.1)
-~---,---------------------------
D. Frequency transformation: Fourier versus Hartley
Fast Fourier transformation
A handsome WF1!f of calculating 8 power spectrum Is called Fast FourierTransformation (FFT). In this technique the original Discrete Fourier Transform(OFT - see form. 4.8. chapter 4) is splitted up into a part with the wen indexesIn an arrF1!f and a part with the odd indexes:
N-l
F (k)N· If(n){ ros( ~kn) - j sin(~ kn)}noo{)
~- J2
• If(2n){ oos(~ 2kn) - j sin(~ 2kn)}noo{)
~- J2
+ If (2n + 1){ cas( ~ (2n + 1) k) - j sin(~ (2n + 1) k) }noo{)
• A (k)N~ + cos( ~ k) B (k)~ - j sin( ~ k) B (k)N~
A (k)NIl and B (k)NIl are the (N/2)-point DITof the even and odd indexes kofF (k)N
The resulting A (k)N~ and B (k)~ are again Fourier transforms that can becalculated the same wF1!f as in 0.1. When doing so, a recursive algorithm orbutterfly arises (0.2) where we can start calculating ~ 2-points OFTs, then W.4-points OFT's, etc., to eventually 1 N-points OFT. This algorithm is O(N/2log:z1'J),while the original discrete Fourier transformation (formula 4.8) is o(l'i), In case
of N =256 already a factor 64 better!
o F (k)N. F (k)N~ + cas(~ k) F (~ + k)N~ - j sin(~ k) F (~ + k)N~
$ F (~ + k)N. F (k)NIl - cas(~ k) F (~ + k)N~ + j sine~ k) F (~ + k)NIl
(D.2)
F (k)Nn indic:ales A (k)N~
and F (~ + k)~ indialtes B(k)~ in form. D.l

so Ap".ndixD,...
lhe sUbscripts N and NI2 Indicate that the arr8f to be transformed-is overwrittenby the newly calculated values.
The Input to this algorithm Is an arrtlf that must be In bitreversed order; this Iscaused by the splitting up In even and odd indexes of the original transform.Because of this, the array to be processed must have a length that Is 8 pcNier of2.
Fast Hartley transformation
It is of course also possible to make the Hartley transformation (see form. 4.10)into a Fast Hartley Transformation (FHl) the same wtlf as was done above with
Fourier anaJysis. lhe Hartley transform is again splitted up Into sutrtransformsof the even and odd indexes:
N -1
H (k)N - ~f{n){ ros{~ kn) + sine~ kn)}"000
!£ -12
- }: f(2n){ cas(~ 2kn) + sine~ 2kn)}11-0
~-12
+ ~f{2n + l){ rose ~ (2n + 1) k) + sine~ (2n + 1) k)}"000
• A (k)Nn + rose~ k) B(k)Nn + sine ~ k) B(~ - k)Nn (D.3)
(seebelaw)
A {k)Nn and B (k)Nn are the {N/2)-point Dmof the even and odd indexes kofH (k)N
Ciab14tio" of the {N/2J-,oi"t DHTfor tilt oU Ie
als( ~ (211 + J)k) + .i"C~ (2" + l)k) • all( ~ (2kn + k) + 'illC~ (2kn + k»
fPIItort:• cos( X + Y) + ,i,,( X + Y)2ltXa CN'2kn)2lt
Y.(N'k)
• cos(X )'CI1s( Y) - ,i,,( X )'s;,,( y) + cos( X }-$ill( Y) + lill(X )'cos( Y)
• cos( YH cos(X ) + ,i,,(X)} + ,;,,( YH col( X) -,i"(X)}
a cos( YH eos(X ) + ,i,,( X)} + ,i,,( YH co$( -X ) + ,in( -X )}
• cos( ~ k) B (k)~ + ,ill( ~ k) B (-k)~ a als( ~ k) B (k~ + AII(~ k) B (~- k~

Ap".ndixD F'~lJfIncy"'",fonn.lion: Fourier ~,.~ Hart/ttyt u ..
81I H'"''''
These resulting formulas can be repeated for the transforms of A (k)N-1 and
B (k)N.1. resulting again In a recursive algorithm. This algorithm Is however
somewhat different from the algorithm given by 0.2. This Is because each stage
of the Hartley transform depends on three different terms of a previous stage
(see 0.3). Instead of two In the case of Fast Fourier Transformation (0.1).
Because of this, each next stage of the Hartley spectrlnl can not simply
overwrite the previous stage values the same wEfoJ as Is done in FFT algorithms.
Therefore, a new set of calculations was designed for the Hartley spectrum
stages (N~ 2-poInts OHT's to 1 N-points OHT). In order to be able to perform the
overwriting of the Hartley array In each stage. This will save memory space that
would have been necessary for storing the intermediate results of the
calculations.
o2ft N 2ft
H (k)N • H (k)N-1'" {~( N k) H (2: + k)N/J + sine N k) H (N - k)N/J)
&N 2ft N 2ft
H (2: + k)N· H (k)N/J - (ros( N k) H (2: + k)N-1 + sine N k) H (N - k)N/Jl
eN 2ft N 2ft
H (N - k)N • H (2: - k)N/J ... {~( N k) H (2: + k)N-1 - sine N k) H (N - k)N/Jl
eH (~ - k)N. H (~ - k)N/J - (cas( ~ k) H (~ + k)N-1 - sine ~ k) H (N - k)N/Jl
(D.4)
H (k)N-1 indicates A (k)N-1
and H (~ ... k)N.1 indicates B (k)N/J
and H (N - k)N-1 indicates B(~ - k)N-1 in form. D.3
This algorithm Is not valid for two index values: k = 0 and k =N/4. When k =0equations f) and 0 are the sarne. so one is redundant. A more serious problem
Is that equation t) is not valid for k =0, because these s~transformationsgofrom zero only to (N • 1). When k =N/4 the four equations are valid, but in this
case the equations 0 and 0 are the same. and. and t) are the same.

82 Ap".ndiJcD
The following is a smart Wffy of solving these problems:
When performing the transformation, test the arrffy-index for being zero or N/4,and if so, perform the next a1gorlttvn:
o NH (k)N • H (k)NI2 + H ("2 + k)N12
N Nf) H ("2 + k)N· H (k)N12 - H ("2 + k)NI2 (0.5)
This also saves the calculation of the multiplications in 0.4. The input 81rffy to
the algorithm must again be In bitreversed order.
The recursive algorithm defined by 0.4 0 • 0 and 0.5 0 - e may seem a bitmore intricate than the FFT algorithm 0.2, but one must keep the following in
mind:
• The FFT recursive algorithm works with 2 calculations, and may thus
seem simpler and faster. The FHT recursive algorithm on the cxher handmust indeed calculate 4 equations each pass, but this means also that thearrffy will be processed in half the number of passes of the FFT , resulting
in a processing time that will approximately be the same, as far as thisgoes. In this context a pass means: performing the recursive algorithm
once.
• When looking more closely at 0.2 and 0.4 we can see that for each newly
calculated transformation sample one multiplication is necessary. That is,
two by two the new samples use the same terms (consisting of a cosine
and a sine function multiplied by a sample) as well In FFT as FHT.
However, the multiplications needed by the FFT are complex
multiplications, meaning two actual multiplications, while the FHT
multiplications are only reat.
Therefore, one can state that the Fast Hartle,' Transformation will needapproximately only half of the time of Fast Fourier Transformation.