Embed Size (px)
Citation preview
Restoring Vision to Consumers and Competition
to the Marketplace Analyzing the Effects of Required
Prescription Release
Edward J. Timmons and Conor Norris
MERCATUS WORKING PAPER
All studies in the Mercatus Working Paper series have followed a rigorous process of academic evaluation, including (except where otherwise noted) at least one double-blind peer review. Working Papers present an author’s provisional findings, which, upon further consideration and revision, are likely to be republished in an academic journal. The opinions expressed in Mercatus Working Papers are the authors’ and do not represent
official positions of the Mercatus Center or George Mason University.
575-72744_coversheet.indd 1 17/01/18 11:27 AM
Edward J. Timmons and Conor Norris. “Restoring Vision to Consumers and Competition to the Marketplace: Analyzing the Effects of Required Prescription Release.” Mercatus Working Paper, Mercatus Center at George Mason University, Arlington, VA, 2018.
Abstract
Occupational licensing laws can allow professionals to extract rents in the marketplace. In the case of vision services, optometrists have the authority to write prescriptions for contact lenses. Optometrists may choose to conceal this information and force patients to purchase lenses from the professional writing the prescription—resulting in vendor lock-in. In this paper, we investigate the possible effect of the 2004 Fairness to Contact Lens Consumers Act (FCLCA) on the market for vision services by examining state differences in prescription release mandates before 2004. We find that requiring professionals to release prescription information to patients resulted in a 10 to 11 percent reduction in the wages of optometrists. Our results provide some evidence that the FCLCA may have increased consumer welfare by reducing the prices of contact lenses or increasing access to contact lenses.
JEL codes: 44
Keywords: occupational licensing, lock-in
Author Affiliation and Contact Information
Edward J. Timmons Conor Norris Associate Professor of Economics Graduate Research Fellow Department of Business Administration George Mason University Saint Francis University [email protected] [email protected]
© 2018 by Edward J. Timmons, Conor Norris, and the Mercatus Center at George Mason University
This paper can be accessed at https://www.mercatus.org/publications/restoring-vision -consumers-competition-marketplace-required-prescription-release.
3
Restoring Vision to Consumers and Competition to the Marketplace:
Analyzing the Effects of Required Prescription Release
Edward J. Timmons and Conor Norris
According to data on certifications and licenses published by the Bureau of Labor Statistics,
more than 22 percent of employed Americans held an occupational license in 2016.1 The
Obama administration (White House 2015) documented the costs and benefits of occupational
licensing and recommended that states weigh the costs and benefits of new regulations. In the
Trump administration, both the Department of Labor and the Federal Trade Commission have
voiced interest in promoting occupational licensing reform.2 In the market for vision services,
consumers may obtain eyeglasses or contact lenses from opticians, optometrists, or
ophthalmologists. Consumers also generally have the option of purchasing eyeglasses and
contact lenses from eye care professionals, brick-and-mortar retail stores, or online outlets. In
2004, the landmark Fairness to Contact Lens Consumers Act (FCLCA) was passed, which
required vision service providers to release contact lens prescription information to patients.
With this information, patients would have the ability to shop and compare prices for contact
lenses. In 2016, bills were introduced that ultimately may have reduced prescription sharing by
granting providers the ability to stall the process (de Rugy 2016). Both the House bill (H.R.
6157) and the Senate bill (S. 2777, Contact Lens Consumer Health Protection Act of 2016)
died in committee. The bills were presented as a means of promoting consumer safety and
preventing fraud. One of the cosponsors of the Senate bill, Senator John Boozman of Arkansas,
was an optometrist before assuming his Senate position.
1 https://www.bls.gov/cps/certifications-and-licenses.htm. 2 https://www.dol.gov/newsroom/releases/opa/opa20170721; https://www.ftc.gov/policy/advocacy/economic
-liberty.
4
Using data from the US Census for 1990 and 2000 and American Community Survey
(ACS) for 2001–2013, we estimate the effect that requiring providers to release prescription
information to patients has on the earnings of optometrists.3 We utilize a two-way fixed effects
estimation strategy that takes advantage of state-to-state differences in policy on prescription
release before the federal legislation. We also report triple-difference estimations including
similar healthcare professionals in the sample to control for national trends in demand for
healthcare services. We perform a simple placebo test using opticians as a control group. Our
results suggest that requiring optometrists to release contact lens prescription information to
patients is associated with an approximately 10 to 11 percent reduction in optometrists’ earnings.
This result is consistent with reports in the existing occupational licensing literature that
licensing laws provide professionals with an opportunity to extract economic rents. Our results
should provide some guidance to policymakers on the potential negative implications of scaling
back the FCLCA.
Vision Market Background
According to the Review of Optometric Business (2013), the vision market (excluding surgery)
results in almost $30 billion in annual revenue. There are three regulated professions that
generally provide services in this market. Optometrists provide primary vision care, including
sight testing, diagnosis, and treatment of vision changes. Although not medical doctors in the
traditional sense, optometrists receive a Doctor of Optometry degree. Licensing statutes allow
optometrists to perform vision tests and eye exams and to prescribe corrective lenses and
eyeglasses. Opticians are technicians trained to design and fit corrective lenses and
3 Ideally we would have liked to investigate ophthalmologists as well, but they are lumped with physicians in the
Census and ACS and cannot be identified.
5
eyeglasses. Twenty-one states require opticians to obtain a license (Timmons and Mills,
forthcoming). Texas had a certification (title protection) law in place that was removed
effective September 2015.4
According to the Centers for Disease Control, over 30 million Americans wear contact
lenses (Clayton-Jeter 2010). In order for patients to purchase contact lenses, they must first
obtain a prescription from an ophthalmologist or optometrist. In theory, patients are then free to
purchase contact lenses from a vendor of their choice. However, before 2004, optometrists in
many cases refused to release patients’ prescriptions, forcing them to purchase lenses from the
prescriber (effectively creating vendor lock-in).
Before 2004, a patchwork of state laws allowed consumers in the United States to
purchase contact lenses from sellers other than their prescription provider. Table 1 displays the
year in which each state required vision professionals to release patients’ prescriptions. As
displayed in the table, in 2004, all 50 states and the District of Columbia required prescription
release. In 2004, the FCLCA unified purchasing rights for all citizens in the United States, with
the intent of allowing consumers to purchase lenses from sellers other than the prescription
provider. This act extended to contact lens patients the protection established 25 years earlier for
eyeglass wearers.5 The law defines contact lens providers as ophthalmologists, optometrists, and
licensed opticians who are permitted under state law to fit contact lenses.
4 In our sample, there were no changes to licensing requirements for opticians or optometrists. State fixed effects
capture changes in these regulatory variables. 5 For more information on the eyeglasses rule, see the Federal Trade Commission website: https://www.ftc.gov
/news-events/press-releases/2004/10/contact-lens-rule-16-cfr-part-315-and-eyeglass-rule-16-cfr-part.
6
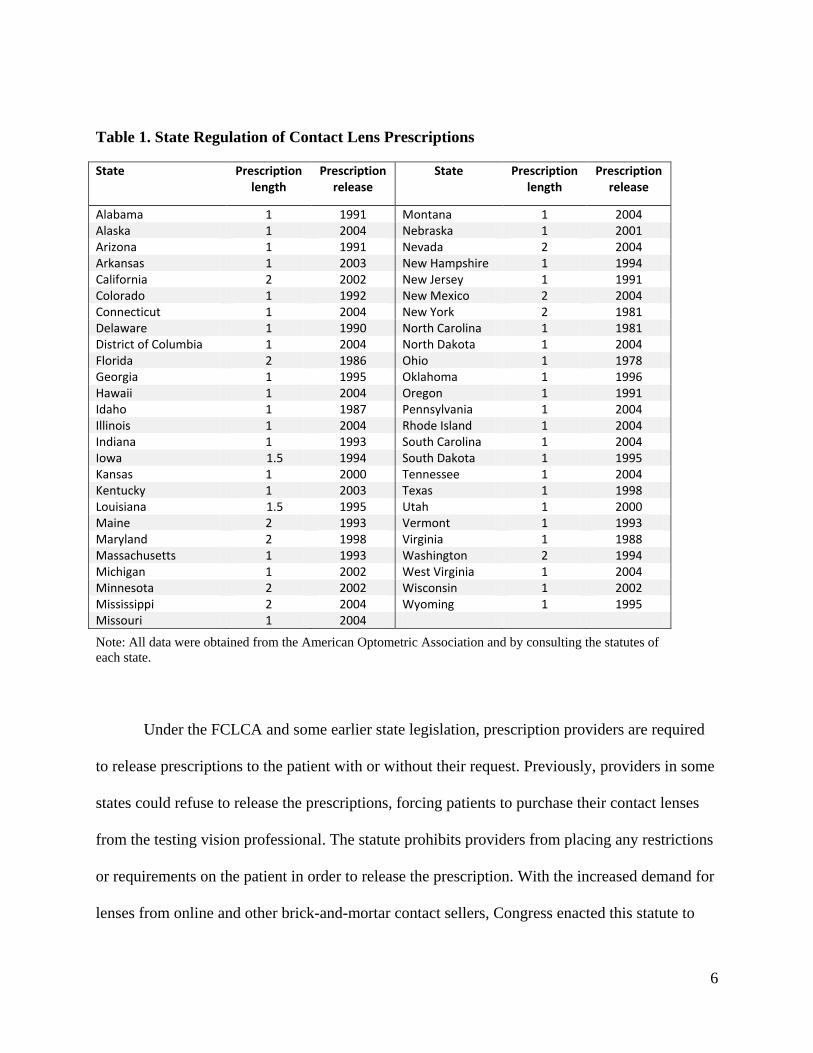
Table 1. State Regulation of Contact Lens Prescriptions
State Prescription length
Prescription release
State Prescription length
Prescription release
Alabama 1 1991 Montana 1 2004 Alaska 1 2004 Nebraska 1 2001 Arizona 1 1991 Nevada 2 2004 Arkansas 1 2003 New Hampshire 1 1994 California 2 2002 New Jersey 1 1991 Colorado 1 1992 New Mexico 2 2004 Connecticut 1 2004 New York 2 1981 Delaware 1 1990 North Carolina 1 1981 District of Columbia 1 2004 North Dakota 1 2004 Florida 2 1986 Ohio 1 1978 Georgia 1 1995 Oklahoma 1 1996 Hawaii 1 2004 Oregon 1 1991 Idaho 1 1987 Pennsylvania 1 2004 Illinois 1 2004 Rhode Island 1 2004 Indiana 1 1993 South Carolina 1 2004 Iowa 1.5 1994 South Dakota 1 1995 Kansas 1 2000 Tennessee 1 2004 Kentucky 1 2003 Texas 1 1998 Louisiana 1.5 1995 Utah 1 2000 Maine 2 1993 Vermont 1 1993 Maryland 2 1998 Virginia 1 1988 Massachusetts 1 1993 Washington 2 1994 Michigan 1 2002 West Virginia 1 2004 Minnesota 2 2002 Wisconsin 1 2002 Mississippi 2 2004 Wyoming 1 1995 Missouri 1 2004
Note: All data were obtained from the American Optometric Association and by consulting the statutes of
each state.
Under the FCLCA and some earlier state legislation, prescription providers are required
to release prescriptions to the patient with or without their request. Previously, providers in some
states could refuse to release the prescriptions, forcing patients to purchase their contact lenses
from the testing vision professional. The statute prohibits providers from placing any restrictions
or requirements on the patient in order to release the prescription. With the increased demand for
lenses from online and other brick-and-mortar contact sellers, Congress enacted this statute to
7
allow consumers to purchase directly from these vendors. It allows consumers to purchase from
any vendor as long as the vendor has had the prescription verified.
Verification of the prescription can be achieved through direct communication with the
prescriber. This verification must occur within eight hours. The direct communication can be
done in a number of ways. Fax, email, and phone calls are acceptable forms of verification, and
these communications must be kept on record by the seller for at least three years. Furthermore,
this law requires patients to obtain prescriptions in order to purchase contact lenses.
Prescriptions also must not expire within one year, but the states retain the option to
require that prescriptions last more than one year. Several states have mandated that contact lens
prescriptions last for 18 months or two years. Table 1 also displays the duration of prescriptions.
Although there is variation across states within our sample, there is no variation within states
with respect to prescription duration over time. As a result, we are unable to empirically identify
the effect of prescription duration on the vision market.
The Economics of Licensing and “Lock-in”
In the past decade, there have been a number of studies estimating the effects of occupational
licensing (Kleiner 2006). Studies have found evidence that licensing decreases the quantity of
Vietnamese immigrant manicurists (Federman, Harrington, and Krynski 2006), increases costs
while simultaneously decreasing the quantity of cosmetologists (Adams, Jackson, and Ekelund
2002), increases barbers’ wages by between 11 and 22 percent (Timmons and Thornton 2010),
increases massage therapists’ wages by as much as 16.2 percent (Thornton and Timmons
2013), and increases the wages of radiologic technologists by as much as 6.9 percent
(Timmons and Thornton 2008).
8
A segment of the literature focuses specifically on the market for vision services. In
the late 1970s, a number of economic studies examined the effect of a different restraint on
trade in the market for vision services—bans on advertising. Feldman and Begun (1978)
found evidence that advertising bans increase eyeglass prices by as much as 16 percent. A
Federal Trade Commission report (Bond et al. 1980) found evidence of even larger price
effects—as much as a 30 percent increase. A recent paper by Timmons and Mills
(forthcoming) estimates the effects of licensing requirements on opticians’ wages. Their
findings suggest that licensing increased opticians’ earnings by as much as 16.9 percent
compared to those in states that did not require licensing. Additionally, more stringent
licensing requirements were associated with increased wages. Timmons and Mills found a 3
percent increase in wages per each exam required and a 2 percent increase for 100 additional
days of educational training (Timmons and Mills, forthcoming).
Some products or services require that specific complementary goods or services be
utilized. In some cases, the firm that produces the primary good or service also controls access to
the specific complementary good or, at the very least, the consumer faces significant costs to
obtain the required complementary good or service. This provides the firm with a form of
monopolistic leverage or “lock-in” (Bowman 1957; Shapiro 1995). Firms with leverage from
bundling their products or services for sale with other products or services can use it to increase
profits. By bundling the goods or services together, the firm can defend both products against
competitors without having to reduce prices on each of them separately. The market for eye
exams and contact lenses seems to fit this description.
An example of bundling goods is the market for funeral services. Regulations restrict
entry into the market for providing funeral services in the United States. In some cases, states
9
also restrict the sale of caskets only to licensed professionals. In most states, the purchase of a
casket is tied to the embalming and funeral services offered. Restrictions on casket sales may
give the funeral home that performs the embalming services leverage or lock-in power. This
allows funeral homes to extract rents from the sale of caskets. Research by Chevalier and Morton
has shown that where such restrictions are in place, funeral homes are able to obtain lock-in
pricing profits from caskets of around $260 per casket. That equals nearly 6 percent of the total
cost of deathcare goods and services for an average funeral (Chevalier and Morton 2008).
Funeral homes in states without restrictions on the sales of caskets, however, offset the reduction
in casket prices by raising prices on funeral services.
Funeral services are an infrequent expense, however, rather than a recurring service
like contact lenses and eye exams for consumers. In addition, much of the theoretical
literature focuses on a consumer durable (e.g., a printer or camera). Eye care providers must
consider the possible effects on their reputation and their ability to earn future profits from
customers when choosing the prices they will charge for eye exams and contact lenses. In
addition, many consumers may have vision insurance that partially offsets the cost of contact
lenses or eye exams. Contact lenses, an aftermarket good, are tied to the purchase of eye
exams. Before the FCLCA, some optometrists refused to release prescriptions to patients,
giving patients little opportunity to shop for contact lenses. Because of the high switching cost
of obtaining an eye exam from another professional, patients were forced to purchase contact
lenses from their initial vision care provider. By locking patients into purchasing contact
lenses, it is possible that the providers were able to extract higher prices, and this may have
resulted in higher salaries for optometrists.
10
We were able to find only one paper that empirically attempts to measure the effect of the
FCLCA on the market for vision services. A working paper by Cooper (2012) estimated the
effect of the FCLCA on contact lens prices. The author was unable to find any evidence of an
effect, but the study focused solely on Northern Virginia and estimated the effect of the FCLCA
as a year dummy (2004)—the research design does not acknowledge the difference in
prescription release legislation before the passage of the FCLCA. The Federal Trade
Commission (2004) issued a report noting the possible negative consequences of requiring all
contact lens sellers to obtain licenses—effectively the result of “lock-in” in the market. In
addition, an earlier paper by Cooper (2007) notes the possible negative effects on consumers
from limiting their access to prescription information. In the present paper, we extend the
existing literature by examining the market for optometrists in 1990 and 2000–2013. We
examine differences across states in the timing of requiring the release of contact lens
prescription information to patients by utilizing a two-way fixed effects framework. Before
turning to the results of our empirical estimations, we first further discuss our empirical
framework and data in the next section.
Data and Estimation Strategy
We rely on data obtained from the Integrated Public Use Microdata Series (IPUMS) database
for the 1990 and 2000 US Censuses and the 2001–2013 American Community Surveys
(Ruggles et al. 2017). Table 2 presents the summary statistics for our samples. We separate the
samples by occupation—opticians, lab technicians, optometrists, and dentists. Our primary
focus is on optometrists. We use opticians as a placebo test since they are unable to write
prescriptions but are working in the same industry, and we use lab technicians and dentists as
further control groups. We use the occupation codes from the ACS to identify the individuals
11
for the sample. For opticians, we include respondents working in the “optical goods workers”
category. We examine industry classifications and retain opticians who work in an
optometrist’s or a physician’s office (presumably for an ophthalmologist), a clinic, a retail
setting, or in the general health services category. If the listed industry is unrelated to eye care,
it is not included in our sample. The laboratory technicians sample includes respondents who
listed “clinical laboratory technician” as an occupation. We include those working in
physicians’ offices, health services, hospitals, research and development, drug production, and
medical supplies. Once again, observations that list unrelated industries are not included in the
sample. We utilize a very similar procedure (keeping observations only from related industries)
when building a sample of optometrists and dentists. The ACS and Census surveys include
information on individuals’ age, race, gender, educational status, and working characteristics.
Using the consumer price index (CPI), we place wages for each year in 2012 dollars. Our
sample includes a total of 110,618 observations across the four occupations when restricted to
respondents with nonzero earnings, weeks worked, and hours worked.6
6 The sample is slightly larger when restricted to respondents with nonzero weeks and hours worked for the purposes
of the regressions estimating hours worked.
12
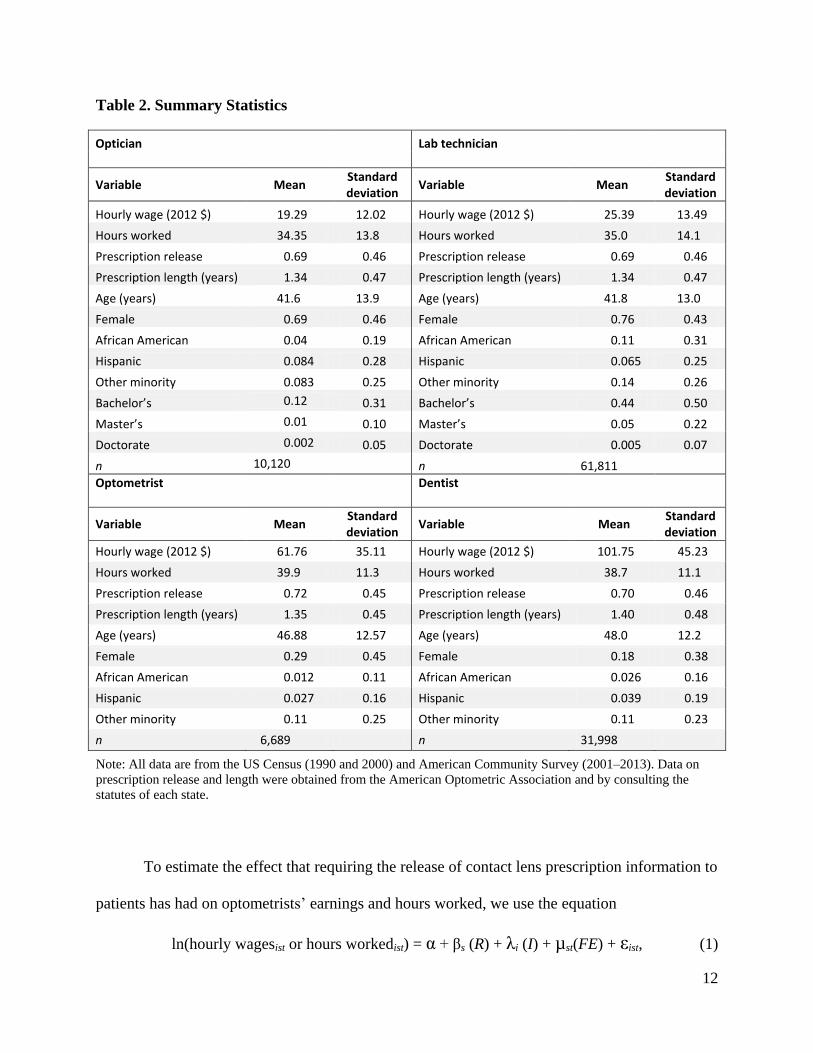
Table 2. Summary Statistics
Optician
Lab technician
Variable Mean Standard deviation
Variable Mean Standard deviation
Hourly wage (2012 $) 19.29 12.02 Hourly wage (2012 $) 25.39 13.49
Hours worked 34.35 13.8 Hours worked 35.0 14.1
Prescription release 0.69 0.46 Prescription release 0.69 0.46
Prescription length (years) 1.34 0.47 Prescription length (years) 1.34 0.47
Age (years) 41.6 13.9 Age (years) 41.8 13.0
Female 0.69 0.46 Female 0.76 0.43
African American 0.04 0.19 African American 0.11 0.31
Hispanic 0.084 0.28 Hispanic 0.065 0.25
Other minority 0.083 0.25 Other minority 0.14 0.26
Bachelor’s 0.12 0.31 Bachelor’s 0.44 0.50
Master’s 0.01 0.10 Master’s 0.05 0.22
Doctorate 0.002 0.05 Doctorate 0.005 0.07
n 10,120 n 61,811
Optometrist
Dentist
Variable Mean Standard deviation
Variable Mean Standard deviation
Hourly wage (2012 $) 61.76 35.11 Hourly wage (2012 $) 101.75 45.23
Hours worked 39.9 11.3 Hours worked 38.7 11.1
Prescription release 0.72 0.45 Prescription release 0.70 0.46
Prescription length (years) 1.35 0.45 Prescription length (years) 1.40 0.48
Age (years) 46.88 12.57 Age (years) 48.0 12.2
Female 0.29 0.45 Female 0.18 0.38
African American 0.012 0.11 African American 0.026 0.16
Hispanic 0.027 0.16 Hispanic 0.039 0.19
Other minority 0.11 0.25 Other minority 0.11 0.23
n 6,689 n 31,998
Note: All data are from the US Census (1990 and 2000) and American Community Survey (2001–2013). Data on
prescription release and length were obtained from the American Optometric Association and by consulting the
statutes of each state.
To estimate the effect that requiring the release of contact lens prescription information to
patients has had on optometrists’ earnings and hours worked, we use the equation
ln(hourly wagesist or hours workedist) = α + βs (R) + λi (I) + µst(FE) + εist, (1)
13
where hourly wages and hours worked are reported by the surveyed individual i living in state
s at time t. It is important to note that our estimates use hourly wages as the dependent variable
and also perform regressions using hours worked as the dependent variable. R is a dummy
variable representing whether state s requires prescriptions to be released by the vision
professional at time t. The prescription release dummy variable is coded “0” if prescription
release is not required in state s at time t and “1” if prescription release is required in state s
at time t.
The dummy variables for individual i’s characteristics (I) control for some of the factors
impacting earnings that have been found most commonly in empirical human capital studies
dating back to Mincer (1958). We use age as a proxy for experience because experience is not
readily available from these surveys. Research has demonstrated that age has a positive effect on
earnings. However, as individuals age, its effect diminishes, so we include a squared term of age
to account for this. Age squared should have a negative coefficient. In general, studies have
found that minorities tend to earn less than their white counterparts. Additionally, females often
earn less than males, and higher levels of education tend to increase wages relative to workers
with less education.
To control for unobserved state heterogeneity, we include both state and time fixed
effects (FE) in all our regressions. Given the length of our period of study, it is unlikely that the
standard “parallel paths” assumption of our estimation is met. To account for this, we also report
estimations including both linear and quadratic state-specific time trends.
Our primary variable of interest is a dummy variable for prescription release
requirements in state s at time t. We anticipated that states requiring prescriptions to be
released would be associated with lower hourly wages because of the increased competition
14
resulting from consumers purchasing from online retailers or other eye care professionals.
This will be true for optometrists but not for opticians, who do not have the authority to write
prescriptions. We perform regressions using opticians as a simple “placebo” test—we would
not expect prescription release requirements to impact the earnings of opticians a priori. For
hours worked, we hypothesized that requiring professionals to release prescriptions could
either increase or decrease hours worked—optometrists might try to compensate for their
lower hourly wage by working longer hours or perhaps choose to consume more leisure as a
result of the hourly wage being lower. Hours worked might also just gauge the volume of
customers (demand) for each professional.
In addition to standard two-way fixed effects estimations, we also perform triple-
difference estimations. We pool dentists with our optometrist sample and lab technicians with
our optician sample—again using the opticians as a placebo test. We then add dummy variables
for our occupations of interest (optometrist and optician) and interact these dummies with the
dummy variable for prescription release. The coefficients on these interaction terms (optometrist
× presrelease and optician × presrelease) represent the triple-difference estimates. Occupations
were paired in this fashion in an attempt to match healthcare professionals with similar education
and licensing requirements and wage levels. Triple-difference specifications were performed to
control for trends unrelated to prescription release that may have also influenced vision
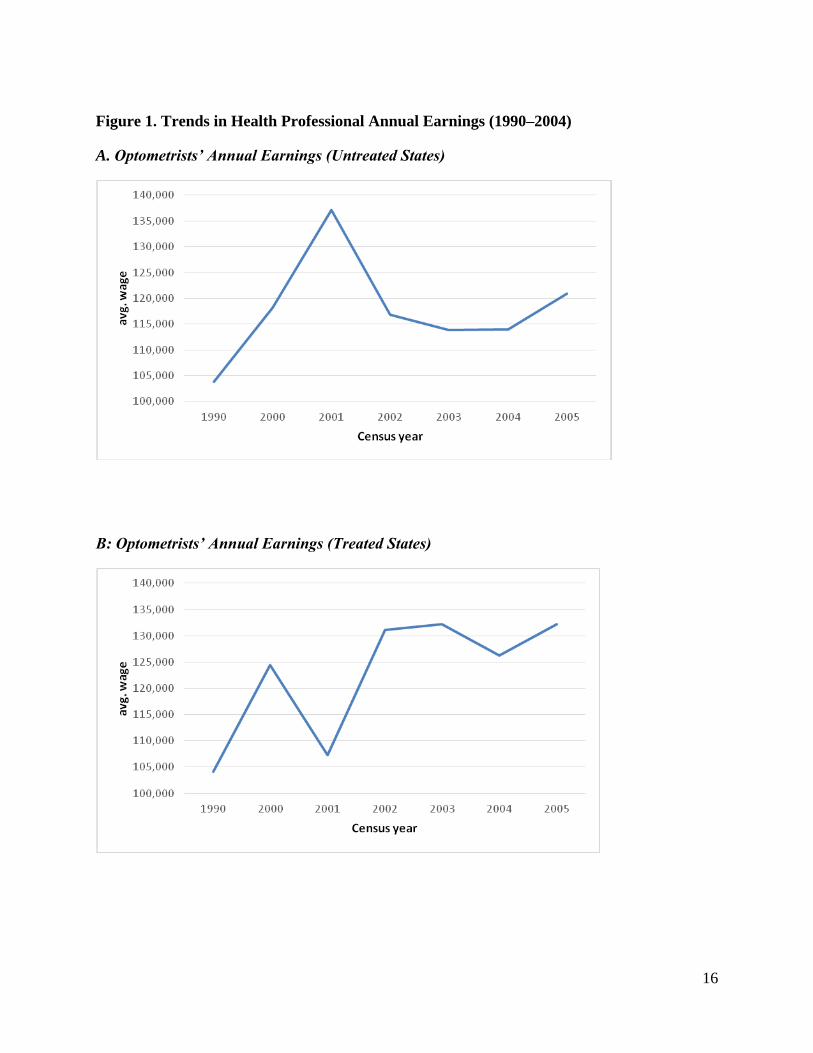
professional labor market outcomes. In figures 1A–1D, we present simple trends in annual
earnings for optometrists and dentists for the period of our study preceding the FCLCA. All
earnings are in 2012 dollars. We define “treated” states as states that required prescription
release during the time period (1990–2004) and “untreated” states as states that did not require
prescription release before the FCLCA. Focusing first on figures 1A and 1B, it can be seen that
15
optometrists’ earnings followed noticeably different trends in treated and untreated states.
Optometrist earnings increased substantially more from 1990 to 2001 in untreated states (more
than 30 percent) than in treated states (approximately 3 percent). But by 2004, the year the
FCLCA was passed, earnings of optometrists in untreated states fell below the earnings of
optometrists in treated states; however, it is not clear if the FCLCA is responsible for this
difference. A similar comparison of dentists’ earnings in figures 1C and 1D suggests that
dentists’ earnings in both groups of states followed similar trends—there is little evidence that
dentists’ earnings in “treated” and “untreated” states grew at different rates.
16
Figure 1. Trends in Health Professional Annual Earnings (1990–2004)
A. Optometrists’ Annual Earnings (Untreated States)
B: Optometrists’ Annual Earnings (Treated States)

17
C. Dentists’ Annual Earnings (Untreated States)
D. Dentists’ Annual Earnings (Treated States)
Note: All data are from the US Census (1990 and 2000) and American Community
Survey (2001–2004).
18
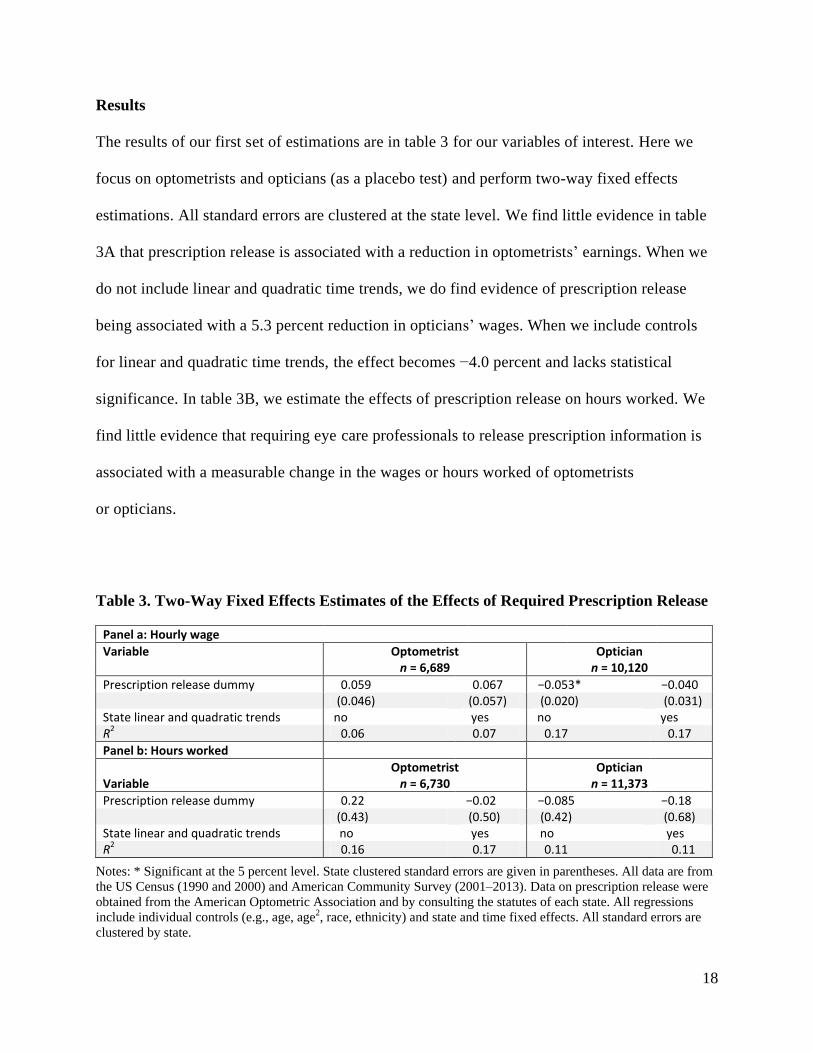
Results
The results of our first set of estimations are in table 3 for our variables of interest. Here we
focus on optometrists and opticians (as a placebo test) and perform two-way fixed effects
estimations. All standard errors are clustered at the state level. We find little evidence in table
3A that prescription release is associated with a reduction in optometrists’ earnings. When we
do not include linear and quadratic time trends, we do find evidence of prescription release
being associated with a 5.3 percent reduction in opticians’ wages. When we include controls
for linear and quadratic time trends, the effect becomes −4.0 percent and lacks statistical
significance. In table 3B, we estimate the effects of prescription release on hours worked. We
find little evidence that requiring eye care professionals to release prescription information is
associated with a measurable change in the wages or hours worked of optometrists
or opticians.
Table 3. Two-Way Fixed Effects Estimates of the Effects of Required Prescription Release
Panel a: Hourly wage Variable Optometrist Optician
n = 6,689 n = 10,120
Prescription release dummy 0.059 0.067 −0.053* −0.040
(0.046) (0.057) (0.020) (0.031)
State linear and quadratic trends no yes no yes R2 0.06 0.07 0.17 0.17
Panel b: Hours worked
Variable Optometrist
n = 6,730 Optician
n = 11,373
Prescription release dummy 0.22 −0.02 −0.085 −0.18
(0.43) (0.50) (0.42) (0.68)
State linear and quadratic trends no yes no yes R2 0.16 0.17 0.11 0.11
Notes: * Significant at the 5 percent level. State clustered standard errors are given in parentheses. All data are from
the US Census (1990 and 2000) and American Community Survey (2001–2013). Data on prescription release were
obtained from the American Optometric Association and by consulting the statutes of each state. All regressions
include individual controls (e.g., age, age2, race, ethnicity) and state and time fixed effects. All standard errors are
clustered by state.
19
In table 4, we reestimate the model, this time pooling optometrists and dentists. For our
placebo test, we pool opticians and lab technicians. We created an occupation dummy variable
and an interaction variable to perform a triple-difference estimation. In the top part of table 4, we
estimate the association of the prescription release dummy variable with hourly wages. After
controlling for unobserved time-varying heterogeneity in the healthcare market via our triple-
difference estimation strategy and including linear and quadratic time trends, we do find
evidence that optometrists earned less (as much as 11 percent less) in states that required contact
lens prescription release. Our results in the simple two-way fixed effects specification (table 3)
appear to have been downwardly biased by unobserved heterogeneity. For example, there has
been a gradual decrease in demand for traditional brick-and-mortar eyeglass and contact lens
dispensers as a result of new entrants into the online marketplace (e.g., 1-800-CONTACTS). For
our placebo test using opticians, we find no evidence that requiring the professionals to release
contact lens prescriptions reduces wages—the coefficient is both economically and statistically
insignificant. The reduction in optometrists’ wages after prescription release requirements are
initiated suggests that optometrists are negatively affected by the laws.
20
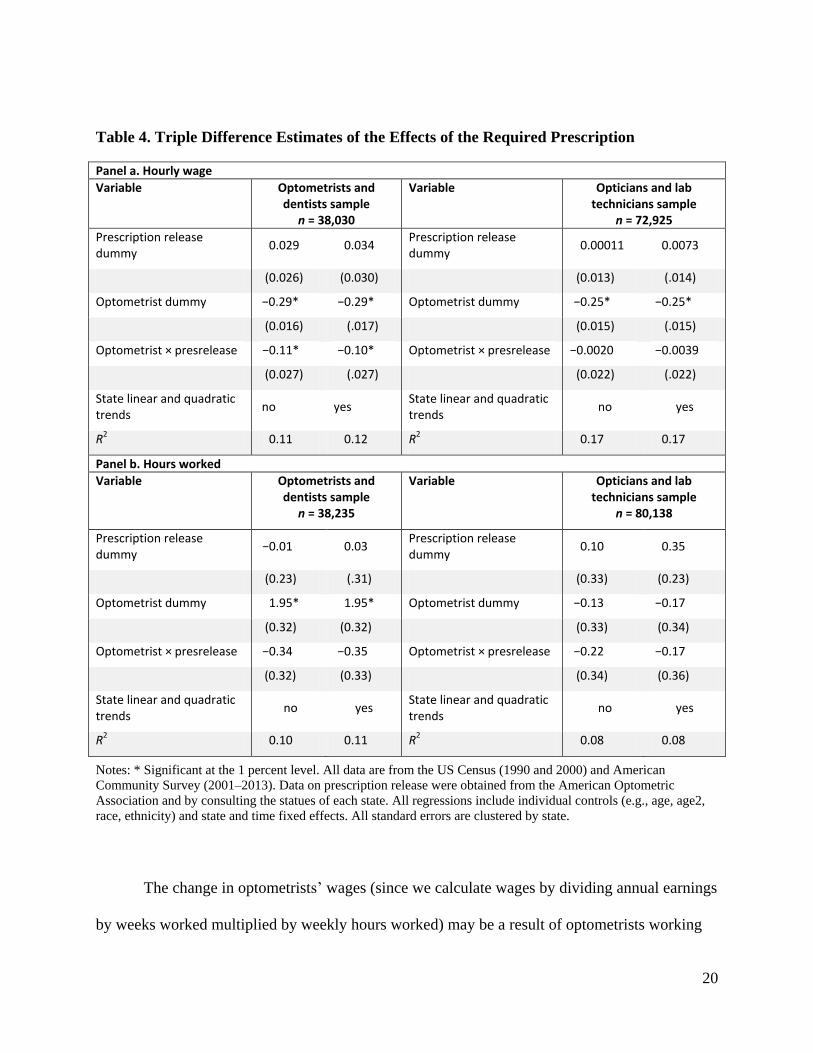
Table 4. Triple Difference Estimates of the Effects of the Required Prescription
Panel a. Hourly wage
Variable Optometrists and dentists sample
n = 38,030
Variable Opticians and lab technicians sample
n = 72,925
Prescription release dummy
0.029 0.034 Prescription release dummy
0.00011 0.0073
(0.026) (0.030) (0.013) (.014)
Optometrist dummy −0.29* −0.29* Optometrist dummy −0.25* −0.25*
(0.016) (.017) (0.015) (.015)
Optometrist × presrelease −0.11* −0.10* Optometrist × presrelease −0.0020 −0.0039
(0.027) (.027) (0.022) (.022)
State linear and quadratic trends
no yes State linear and quadratic trends
no yes
R2 0.11 0.12 R2 0.17 0.17
Panel b. Hours worked
Variable Optometrists and dentists sample
n = 38,235
Variable Opticians and lab technicians sample
n = 80,138
Prescription release dummy
−0.01 0.03 Prescription release dummy
0.10 0.35
(0.23) (.31) (0.33) (0.23)
Optometrist dummy 1.95* 1.95* Optometrist dummy −0.13 −0.17
(0.32) (0.32) (0.33) (0.34)
Optometrist × presrelease −0.34 −0.35 Optometrist × presrelease −0.22 −0.17
(0.32) (0.33) (0.34) (0.36)
State linear and quadratic trends
no yes State linear and quadratic trends
no yes
R2 0.10 0.11 R2 0.08 0.08
Notes: * Significant at the 1 percent level. All data are from the US Census (1990 and 2000) and American
Community Survey (2001–2013). Data on prescription release were obtained from the American Optometric
Association and by consulting the statues of each state. All regressions include individual controls (e.g., age, age2,
race, ethnicity) and state and time fixed effects. All standard errors are clustered by state.
The change in optometrists’ wages (since we calculate wages by dividing annual earnings
by weeks worked multiplied by weekly hours worked) may be a result of optometrists working
21
longer hours or earning less—perhaps from charging lower prices for contact lenses. Turning to
the bottom part of table 4, we find little evidence that requiring professionals to release
prescription information is associated with any measurable changes in hours worked for
optometrists or opticians. This is consistent with the possibility that prescription release is
placing pressure on optometrists to reduce contact lens prices.
Conclusion
In this paper, we have estimated the effect of the Fairness to Contact Lens Consumers Act
(FCLCA) on the professional market for vision services. We use pre-2004 state-by-state
differences in prescription release requirements to better understand the potential effects of the
law. Our results suggest that the requirement for professionals to release contact lens
prescription information to patients is associated with as much as an 11 percent reduction in
optometrists’ wages. We find little evidence that the change in regulation is associated with a
change in hours worked for optometrists. We performed a simple placebo test using the closely
related occupation of opticians and found no similar evidence of an effect. Before the passage
of the FCLCA, professionals effectively were able to enjoy rents from “lock-in” or leverage—
there was no requirement for the professional to release prescription information, and patients
were effectively forced to purchase lenses from the professional conducting the eye exam. The
FCLCA removed this restriction, and our results suggest that consumers reacted by seeking
lower-priced alternatives. In the absence of removing or scaling back existing occupational
licensing laws (delicensing remains very rare, as detailed by Thornton and Timmons 2015),
legislation similar to the FCLCA may prove beneficial in improving competition and reducing
prices for consumers. In the context of the market for medical services, medical professionals
can recommend tests and minor procedures, and the tests could be performed outside the
22
medical provider’s office, potentially at a lower cost to the patient. It would seem that the
needs of contact lens and eyeglass consumers will continue to be better met by maintaining the
intent of the 2004 law, which encourages competition in the marketplace.
23
References
Adams, Frank, John Jackson, and Robert Ekelund. 2002. “Occupational Licensing in a
‘Competitive’ Labor Market: The Case of Cosmetology.” Journal of Labor Research 23
(2): 261–78.
Bond, Ronald, John Kwoka, John Phelan, and Ira Whitten. 1980. “Effects of Restrictions of
Advertising and Commercial Practice in the Professions: The Case of Optometry.”
Washington, DC: Federal Trade Commission (September).
Bowman, Ward S., Jr. 1957. “Tying Arrangements and the Leverage Problem.” Yale Law
Journal 67:19–36.
Chevalier, Judith A., and Fiona M. Scott Morton. 2008. “State Casket Sales Restrictions: A
Pointless Undertaking?” Journal of Law and Economics 51 (1): 1–23.
Clayton-Jeter, Helene D. 2010. “Looking Good: Safe Use and Care of Contact Lenses.” FDA
News for Health Professionals, May, 1–3.
Cooper, James C. 2007. “Public versus Private Restraints on the Online Distribution of
Contact Lenses: A Distinction with a Difference.” Journal of Law, Economics, and
Policy 3:331–64.
———. 2012. “Does Prohibiting ‘Lock-In’ Improve Aftermarket Outcomes? Evidence from the
Fairness to Contact Lens Consumers Act.” September 11. https://papers.ssrn.com/sol3
/papers.cfm?abstract_id=2145540.
Federal Trade Commission. 2004. “Possible Anticompetitive Barriers to E-Commerce:
Contact Lenses.” https://www.ftc.gov/sites/default/files/documents/advocacy
_documents/possible-anticompetitive-barriers-e-commerce-contact-lenses-report
-staff-ftc/040329clreportfinal.pdf.
Federman, Maya, David Harrington, and Kathy Krynski. 2006. “The Impact of State Licensing
Regulations on Low Skilled Immigrants: The Case of Vietnamese Manicurists.”
American Economic Review, Papers and Proceedings 96 (2): 237–41.
Feldman, Roger, and James Begun. 1978. “The Effects of Advertising: Lessons from
Optometry.” Journal of Human Resources 13:247–62.
Kleiner, Morris. 2006. Licensing Occupations: Ensuring Quality or Restricting Competition.
Kalamazoo, MI: Upjohn Institute.
Mincer, J. 1958. “Investment in Human Capital and Personal Income Distribution.” Journal of
Political Economy 66 (4): 281–302.
24
Review of Optometric Business. 2013. “Challenges and Opportunities in the Future of
Independent Optometry.” http://reviewob.com/data/sites/1/paa_visionsource__0413.pdf.
Ruggles, Steven, Katie Genadek, Ronald Goeken, Josiah Grover, and Matthew Sobek. 2017.
Integrated Public Use Microdata Series: Version 7.0 [dataset]. Minneapolis: University
of Minnesota.
de Rugy, Veronique. 2016. “A Clear-Eyed View of the Contact Lens Debate.” Creators
Syndicate, April 14.
Shapiro, Carl. 1995. “Aftermarkets and Consumer Welfare: Making Sense of Kodak.” Antitrust
Law Journal 63:483–511.
Thornton, Robert, and Edward J. Timmons. 2013. “Licensing One of the World’s Oldest
Professions: Massage.” Journal of Law and Economics 56 (2): 371–88.
———. 2015. “The Delicensing of Occupations in the US.” Monthly Labor Review, May, 1–20.
Timmons, Edward, and Anna Mills. Forthcoming. “Bringing the Effects of Occupational
Licensing into Focus: Optician Licensing in the United States.” Eastern
Economic Journal.
Timmons, Edward, and Robert Thornton. 2008. “The Effects of Licensing on the Wages of
Radiologic Technologists.” Journal of Labor Research 29 (4): 333–46.
———. 2010. “The Licensing of Barbers in the USA.” British Journal of Industrial Relations 48
(4): 740–57.
White House: Department of the Treasury, Council of Economic Advisers, and Department of
Labor. 2015. “Occupational Licensing: A Framework for Policymakers,” July.