Embed Size (px)
Citation preview

116 4Q/2010, Economic Perspectives
Educational attainment and household location: The case of Chicago’s lakefront
William A. Testa and William Sander
William A. Testa is a vice president and the director of regional programs in the Economic Research Department at the Federal Reserve Bank of Chicago. William Sander is a professor of economics at DePaul University and a consultant in the Economic Research Department at the Federal Reserve Bank of Chicago. The authors thank Vanessa Haleco-Meyer and Dan Elddine for their assistance.
Introduction and summary
In the latter half of the twentieth century, central cities in the United States, like Chicago and Detroit, tended to fall into decline—in contrast with the rapid growth they experienced until the 1950s. In search of better housing and often in response to improved highway access to jobs in central cities, many households relo-cated to the suburbs. In addition, over time, employers tended to follow households to the suburbs. For example, by the mid-twentieth century the changing technology of factory production and goods transportation had prompted manufacturing firms to move toward the suburbs and the urban fringe.
As suburbanization progressed, city governments were often left cash-strapped and resource-poor, strain-ing to fund public services and public schools for the relatively low-income populations that remained. A surge of federal government aid (and some state gov-ernment aid) to cities during the late 1960s through the early 1980s provided some relief for cities’ fiscal stress.
More recently, resettlement and gentrification of some parts of central cities have been a boon to central cities’ tax bases. The rising property values associated with gentrifying neighborhoods can translate into much- needed tax revenues for city services and public schools. Moreover, the broad landscape under the jurisdiction of city governments ensures that rising revenues asso-ciated with gentrifying neighborhoods subsidize pub-lic services and public schools citywide. In addition, the relatively recent repopulation of cities may in turn attract employers with their attendant tax base, local spending, and job opportunities.
In light of such potential benefits, city government administrators and policymakers would like to know more about what types of households are attracted to urban living, as well as what specifically attracts them. In this article, we focus on the relationship between
the educational attainment of households and their choice of living in a central city. Some have claimed that urban gentrification has been spearheaded by more-educated, more-affluent households, though this by no means is the exclusive factor. If this is indeed the case, then policymakers may be able to fashion some urban amenities—for example, through the preserva-tion of architectural landmarks, the creation and main-tenance of public parks and beaches, and the financial support of cultural venues—to attract even more of these households to the city.
Chicago’s experience represents a compelling case study. Among Northeast and Midwest cities, Chicago has been comparatively successful in attracting highly educated households in recent years. Chicago’s long-running Daley administration is sometimes touted as having been influential in altering the city’s landscape and public services; such improved amenities may have played a key role in attracting growing numbers of highly educated, high-income households to reside in the city.
Not all parts of Chicago have experienced the same level of gentrification. We have identified the neighborhoods along Lake Michigan as the locus of gentrification in Chicago, though such activity has often spread westward over time. Also, little is known about the educational attainment of minority households that have recently chosen to live in city neighborhoods versus the suburbs. On average, the statistics for the

117Federal Reserve Bank of Chicago
FIguRE 1
Geographical divisions of the Chicago metropolitan statistical area (MSA)
Borders
State borders
Chicago MSA border
Cook County border
City of Chicago border
AreasChicago lakefront north
Chicago lakefront south
Other Chicago
Chicago suburbs (only within Illinois)
0 10 20 30
miles
Chicago metropolitan area suggest a trend of rapid sub-urbanization among upper- and middle-income black and Hispanic families—households that would be expected to have higher than average educational attainment.
But what does a finer analysis of Chicago’s expe-rience tell us about these trends? Here, we compare in-dividual household location choices in the Chicago suburbs (Illinois only) with those in the city’s lake-front north and lakefront south, as well as the rest of the city, which we call “other Chicago” (see figure 1). We use multinomial logit statistical techniques to iden-tify probabilistic relations in the decision to reside in a particular area among discrete choices. In this instance, our multinomial logit analysis describes the discrete choices by households among mutually exclusive resi-dential locations, estimating the marginal or conditional probabilities of households’ decisions that reflect the characteristics of the households. In our analysis, we
choose particular household characteristics—such as in-come, age, major race and ethnic affiliation, household composition, and educational attainment—as explana-tory variables that are thought to influence residential location. We pay particular attention to the relationship between being a college graduate (that is, having a bachelor’s degree or higher) and household location. We also consider work force participation and job location in our empirical strategy, since the job and residential location decisions are interdependent.
In the next section, we briefly discuss previous studies relating to household location trends in urban environments. Then, we present an overview of the Chicago metropolitan area’s demographic and economic landscape. After this, we explain our basic empirical strategy and data, and we present the results of our anal-ysis. We conclude with a discussion of the implications of our results for further research and public policy.

118 4Q/2010, Economic Perspectives
Literature review
Classic studies on household location have focused on the trade-offs between housing consumption and commuting costs: They have found that more-affluent households paid for more and newer housing in sub-urban areas, incurring higher commuting costs to the central city (Alonso, 1964; Mills, 1967; and Muth, 1969). More recently, Brueckner and Rosenthal (2009) show that as suburbs become highly developed and as inner city housing depreciates, new housing development in the central city becomes more attractive.
Other research on the household location decision has focused on the effects of central city problems, such as poor schooling options, on the incentive to live in suburban areas (for example, Wheaton, 1977). Cullen and Levitt (1999) show that more-educated households have a higher demand for living in low-crime areas like many suburban communities. Such concerns about urban living have led more-affluent and more-educated house-holds to move to the suburbs, leaving central cities increasingly poor—a trend that is a concern for many city administrators and policymakers (Wilson, 1987).
In recent research, scholars have stressed other fac-tors that may affect where households locate. Rosenthal (2008) explains how economic change affects the eco-nomic status of neighborhoods over time. He shows that neighborhood decline and renewal are related to the quality of housing and other aspects of neighbor-hoods, such as the presence of architecturally signifi-cant homes, age of housing stock, and attributes of neighbors, such as race and educational attainment. Numerous studies have examined how neighborhood characteristics affect household location. Bajari and Kahn (2005) show that white suburbanization is part-ly driven by a greater demand to live in communities with high human capital, that is, places characterized by residents with high educational attainment and other accumulated skills and experience. Bayer, McMillan, and Rueben (2004) and Bayer, Ferreira, and McMillan (2007) show that households self-segregate through-out metropolitan areas on the basis of common race and educational attainment.
In a study on the Chicago metropolitan area, Sander and Testa (2009) separate out the effects of educational attainment from other background factors, including income and the location of work, on house-hold location. They show that college-educated non-Hispanic whites (that is, those who have a bachelor’s degree or higher) were more likely to live in the city of Chicago relative to its suburban areas, while their black and Hispanic counterparts were more likely to live in the suburbs of Chicago. Sander (2005) also shows this to be the case in many of the largest metropolitan
areas in the United States, including New York City and Los Angeles.
Across the nation, college enrollment and the educational attainment of workers have climbed steadily. Throughout the 1990s, the proportion of college graduates in the general population rose sig-nificantly as older, less educated cohorts moved into retirement ages and as younger, more-educated co-horts replaced them. In 2009, 30 percent of U.S. workers had bachelor’s degrees versus about 8 percent in 1960, with corresponding growth in those with at least some college and those with graduate degrees. In the city of Chicago, the percentage of adults aged 25 and older with at least a bachelor’s degree increased from 26 percent in 1990 to 31 percent in 2008 (Snyder and Dillow, 2010).
In the past two decades, some cities have become increasingly attractive to highly educated households (Glaeser, Kolko, and Saiz, 2001). This trend, some observe, has arisen both because households with high educational attainment are demanding the amenities that city life offers (Glaeser and Shapiro, 2003) and because knowledge industries that employ highly educated workers have located in cities as well. How-ever, Berry, Bodini, and Weissbourd (2005) find that amenities only had a small effect on where college graduates lived, while jobs and wages had large effects. Further, it has been shown that high concentrations of human capital in cities can have positive effects on the skills of individual workers and their earning abil-ity, thereby increasing the incentive to live and work in cities (Glaeser and Maré, 2001; and Rosenthal and Strange, 2008).
Besides the allure of good amenities and career opportunities, changes in the family can have an effect on the incentive to live in cities. Marriage and school-age (dependent) children exert a negative effect on the incentive to live in cities because of crime and relatively low-quality public schooling. That said, one of the most significant demographic trends favor-able to city locations has been the rising number of adults who have never been married. For example, the U.S. Census reports that the percentage of never-married women aged 25–34 in the United States has increased from about one in ten in 1950 to one in three in 2000.
Following Becker and Murphy (2000), we note the incentive to live in a city like Chicago (or a particu-lar neighborhood within a city) is a function of many factors, including educational attainment, income level, marital status, and family structure (particularly, whether school-age children are present or not), as well as the amenities of the city (neighborhood).

119Federal Reserve Bank of Chicago
In choosing a Chicago neighborhood, households consider Lake Michigan to be a prominent amenity. Further, the likelihood of living in the city of Chicago (or a particular neighborhood within it) depends upon the characteristics of others who already live there. For example, young college graduates prefer to live in areas with high concentrations of other young col-lege graduates (Cortright, 2005; and Florida, 2008).
Chicago overview
Over the past two decades, the population of the Chicago metropolitan area has shown significant gains in educational attainment. The most significant gains have been recorded in the central city. During the 1990s alone, the share of adults with a bachelor’s degree or more rose by 7 percentage points in the city, compared with 5 percentage points in suburban Chicago (Sander and Testa, 2009).
In figure 2, we assign each community area (neigh-borhood) in the city of Chicago into a quintile based on the percentage of adults (aged 25 and older) who have attained a bachelor’s degree or more for the years 1960, 1980, and 2000 (panels A, B, and C). The maps of the city’s 77 community areas illustrate the remark-able educational gains from 1960 to 2000. In 1960, only two community areas (Hyde Park and Beverly) reported shares of adults with at least a bachelor’s degree of 20 percent or more. By 1980, there were 13 such community areas; and by 2000, there were 28, 15 of which claimed shares of 36 percent or more.
A sharp contrast between certain segments of the city becomes apparent in these maps. Many community areas located in the interior West and Southwest Sides (and far South Side) experienced little or no gains in educational attainment between 1960 and 2000. In contrast, community areas close to other areas with higher levels of educational attainment in 1960 gained more highly educated populations over those 40 years. Educational attainment among those residing on the far North Side grew during these 40 years, and the more educated began to populate community areas west of this area, moving toward Chicago’s new jobs magnet, O’Hare International Airport. Meanwhile, Chicago’s lakefront community areas had evolved by 2000 into a somewhat uniform area comprising those with high educational attainment. The community areas from the city’s northernmost, Rogers Park, to the South Loop, just below the central business district (called the Loop), all ranked in the top two quintiles of educational at-tainment in 2000. Farther south, the intellectual strong-hold around the University of Chicago—Hyde Park— had retained its high level of educational attainment over the decades, and the households that make up
the Kenwood neighborhood just north of it had reached the same level of educational attainment, on average, by 2000.
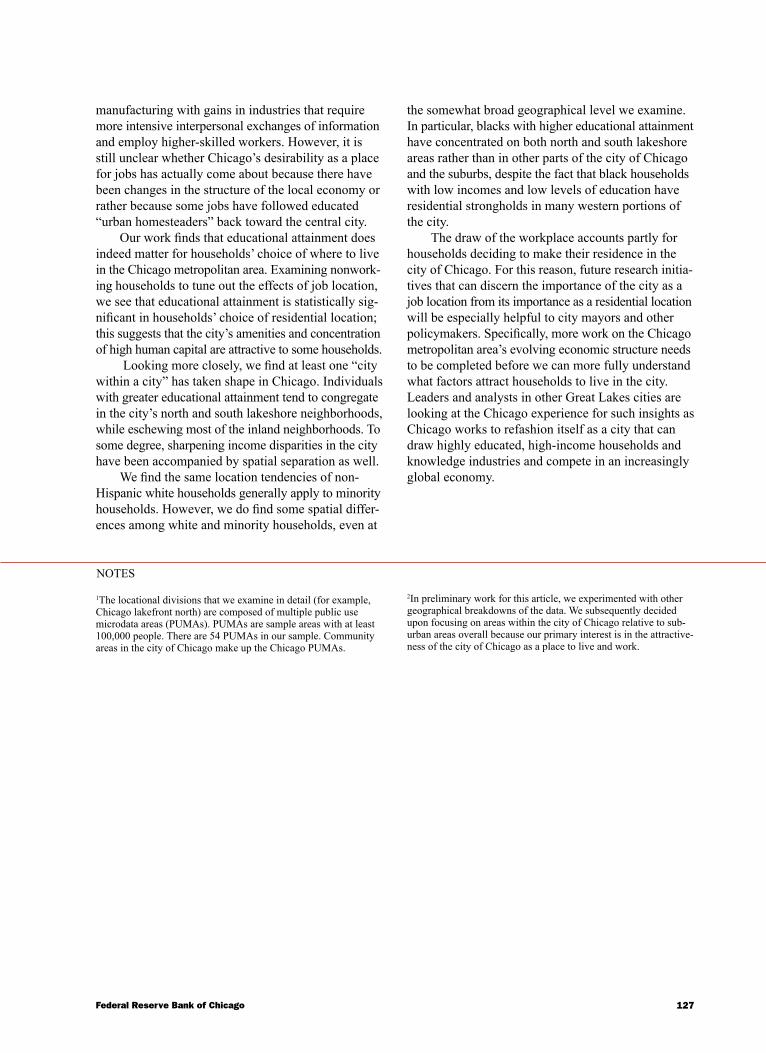
Within the city of Chicago, there is a sharp con-trast between the North Side neighborhoods, largely populated by young, non-Hispanic whites, and the South Side neighborhoods, home to several sizable black community areas, such as Hyde Park (former home of the late Mayor Harold Washington) and Kenwood (home to the Obama family). As illustrated in figure 3, the level of educational attainment was quite disparate among neighborhoods with a sizable black population in 2000. Of the 37 of such community areas, eight of them were characterized by 26 percent or more of the adult population having received a four-year college degree or higher; however, seven of these 37 areas had less than 6 percent of college graduates among their adult population.
Overall, the data from the U.S. Census Bureau indicate that educational attainment levels are slightly higher in the Chicago metropolitan area than in the nation as a whole. Within the metropolitan area, aver-age educational levels have been higher in the suburbs than in the city of Chicago, although there is some evidence this is changing, especially for young, non-Hispanic whites. In table 1, we show data from the U.S. Census Bureau on the percentage of the adult popula-tion with a four-year college degree, by age, in the city of Chicago and its suburbs from 1990 through 2006. One of the important changes over this period was that adults aged 25–34 in Chicago in 2006 were more likely to be college graduates relative to their suburban counterparts. Further, non-Hispanic whites living on Chicago’s lakefront were substantially more likely to have a four-year college degree relative to whites elsewhere in Chicago and the suburbs across this period (see table 2, p. 122). This was particularly the case on the North Side of Chicago. Blacks living on Chicago’s lakefront were also more likely to be college graduates relative to blacks living elsewhere in the metropolitan region. This was also the case for Hispanics living on Chicago’s North Side lakefront relative to Hispanics living elsewhere in the Chicago metropolitan area.
Analyzing 2000 U.S. Census data, we find that about two out of three residents on Chicago’s North Side lakefront were non-Hispanic white in 2000, while about three out of four South Side lakefront residents were black. For the rest of Chicago, almost 40 percent of its residents were white, while over half were either black or Hispanic. For suburban areas, about three out of four were white, while 8 percent were Hispanic and 8 percent were black. According to data from the

120 4Q/2010, Economic Perspectives
FIg
uR
E 2
Col
lege
gra
duat
es, b
y qu
intil
e, in
Chi
cago
com
mun
ity a
reas
, 196
0–20
00
A. 1
960
B. 1
980
C. 2
00
0
0
1.5
3
4
.5
Bel
ow 8
.1 p
erce
nt
8.1
perc
ent t
o 11
.5 p
erce
nt
11.5
per
cent
to 2
0.0
perc
ent
20.0
per
cent
to 3
6.0
perc
ent
36.0
per
cent
and
abo
ve
miles
Not
es: O
nly
adul
ts a
ged
25 a
nd o
lder
are
incl
uded
in t
he a
naly
sis.
Com
mun
ity a
reas
in w
hite
indi
cate
dat
a no
t av
aila
ble.
Sou
rces
: K
itaga
wa
and
Taeu
ber
(1963); C
hica
go F
act
Boo
k C
onso
rtiu
m (
1984, 1
995);
and
U.S
. C
ensu
s B
urea
u, 2
00
0 C
ensu
s of
Pop
ulat
ion
and
Hou
sing
, Sum
mar
y Fi
le 3
.

121Federal Reserve Bank of Chicago
FIguRE 3
College graduates, by quintile, in Chicago community areas
with sizable black population, 2000
0 1.5 3 4.5
Below 6.0 percent
6.0 percent to 10.0 percent
10.0 percent to 14.0 percent
14.0 percent to 26.0 percent
26.0 percent and above
miles
Notes: The quintiles here were calculated after the subset of community areas with the black population greater than 25 percent was identified. Only adults aged 25 and older are included in the analysis.Source: U.S. Census Bureau, 2000 Census of Population and Housing, Summary File 3.
TaBLE 1
College graduates, by age and household location,in the Chicago metro area, 1990–2006
Age City Suburbs
(-------percent-------)199025–34 27 3135–44 24 3645–54 18 2955–64 12 2165andolder 8 12
2000 25–34 36 3635–44 25 3645–54 24 3855–64 20 3065andolder 16 22
2006 25–34 39 3535–44 34 3945–54 25 3755–64 27 3565andolder 16 22
Notes:TheChicagosuburbsareonlythoseinIllinois.Sources:Authors’calculationsbasedondatafromtheU.S.CensusBureau,1990 and 2000 Census of Population and Housing, Public Use Microdata Sample,5percentsample;andU.S.CensusBureau,2006 American Community Survey, Public Use Microdata Sample.
U.S. Census Bureau, the African-American popula-tion in the suburban areas of Chicago, especially in Cook County, increased over the period 1990–2006. The black population of suburban Cook County in-creased from a little over 228,000 in 1990 to about 397,000 in 2006 (a gain of about 74 percent), while the overall population of Cook County grew by about 3 percent during this period. A large part of the gain in the African-American population in suburban Cook County during this period was a product of the city of Chicago having lost about 142,000 of its African-American population from 1990 through 2006.
When we break down the 2000 U.S. Census data by age and location, we notice one of the key differ-ences is that the population living on the North Side lakefront was relatively young compared with the population living elsewhere in the city and suburbs. In 2000, the percentage of the population aged 25–34 was almost twice as high on the North Side lakefront as it was in the suburbs.
Further, U.S. Census data indicate that a relatively low percentage of respondents were married (and married with school-age children) on the city of Chicago’s lakefront in 2000. A higher percentage of respondents were married (and married with children) in the rest of the city of Chicago. The highest percent-age of married (and married with children) was to be found in Chicago’s suburbs.
Chicago’s important and changing role as an em-ployment center must be taken into account to fully understand the city’s residential patterns, especially when considering the importance of educational attain-ment in the household location decision. Skill-intensive jobs surely exert an independent pull on the choice of residential location of highly educated workers.
Two of the key changes over the past few de-cades were the decline in the manufacturing sector

122 4Q/2010, Economic Perspectives
TaBLE 2
College graduates, by household location and race and ethnicity, in the Chicago metro area, 1990–2006
Householdlocation All White Black Hispanic
(------------percent------------)1990Chicagolakefrontnorth 45 57 15 22Chicagolakefrontsouth 21 46 14 12OtherChicago 13 28 8 6Suburbs 32 35 17 14
2000 Chicagolakefrontnorth 56 70 21 22Chicagolakefrontsouth 21 46 17 7OtherChicago 17 28 10 7Suburbs 32 35 20 9
2006 Chicagolakefrontnorth 62 75 26 33Chicagolakefrontsouth 26 51 25 6OtherChicago 21 37 12 8Suburbs 34 38 22 11
Notes:Onlyadultsaged25andolderareincludedintheanalysis.Fordetailsonthegeographicaldivisions,seefigure1.Sources:Authors’calculationsbasedondatafromtheU.S.CensusBureau,1990 and 2000 Census of Population and Housing,Public Use Microdata Sample,5percentsample;andU.S.CensusBureau,2006 American Community Survey, Public Use Microdata Sample.
TaBLE 3
Estimates of occupational concentrationin the city of Chicago, 2000
Dependentvariable
Lessthanhighschool –1.08**Somecollege 1.90**Bachelor’sdegree 4.92**Master’sdegree 6.70**Professionaldegree 20.01**PhD 10.09**Age –0.04**Age2 0.0003**Black 0.57**Hispanic –1.21**Asian –1.83**Male –0.37**R² 0.15Numberofobservations 172,647
**Significantatthe1percentlevel.Notes:Weuseordinaryleastsquaresfortheestimates.Onlyadultsaged25andolderareincludedintheanalysis.Source:Authors’calculationsbasedondatafromtheU.S.CensusBureau,2000 Census of Population and Housing,Public Use Microdata Sample,5percentsample.
and growth in the services sectors. Over the period 1981–2008, manufacturing payroll jobs in the city of Chicago declined at an average annual pace of 2.8 percent—they fell 75 percent overall. In contrast, the remainder of the six-county Chicago region experienced only a 21 percent decline in manufacturing jobs from 1981 through 2008. The share of total jobs in manufac-turing in the city of Chicago amounted to only 7.2 percent in 2008, one half of the concentration in Chicago’s sub-urbs (Illinois Department of Employment Security, 2008).
Instead, the central city jobs orientation of many large metropolitan areas—including the Chicago re-gion—shifted toward those sectors having high human capital content, especially the finance sector and the business and professional services sectors (Sassen, 2004). Though the city of Chicago’s central business district experienced a loss of virtually all of its 70,000 manu-facturing jobs over the period 1981–2008, there was a compensating gain of 81,000 jobs in nonmanufacturing sectors. Much of the job growth took place in financial, legal, and professional services. Payroll jobs in services sectors in the city of Chicago’s central area amounted to over 500,000 as of 2008 (Illinois Department of Employment Security, 2008).
In table 3, we provide more general evidence for where high-skilled jobs tended to be located in the
city of Chicago in 2000. We use the 2000 Census of Population and Housing’s 5 percent Public Use Microdata Sample (PUMS) to estimate an index of occupa-tional concentration in Chicago. The occu-pational concentration variable is computed using three-digit occupational codes. Sev-eral hundred occupations are represented in the Chicago metropolitan area. The in-dex is measured as the percentage of jobs in an occupation in the Chicago metropolitan area that is located in the city of Chicago. We estimate this index as a function of the following variables: educational attainment of the worker (relative to a high school graduate), age and age squared, black, Hispanic, Asian, and male. The results of this estimate indicate that higher levels of educational attainment are associated with working in jobs that are more concentrated in Chicago. For example, having a bachelor’s degree increases the occupational concen-tration ratio measure by about 5 percentage points relative to those who are only high school graduates. Respondents with pro-fessional degrees, like lawyers and doctors, are the most likely to work in jobs that are
concentrated in the city of Chicago, as indicated by an effect of 20 percentage points on our occupational concentration variable relative to those who are only

123Federal Reserve Bank of Chicago
TaBLE 4
Educational attainment among workers, by work location,in the Chicago metro area, 1990 and 2000
City, Suburbs, City, Suburbs,Dependentvariable 1990 1990 2000 2000
(-------------percent-------------)Lessthanhighschool 15.8 12.0 12.1 11.1Highschool 22.7 26.9 18.5 23.1Somecollege 27.6 30.7 27.4 30.7Bachelor’sdegree 20.4 19.8 24.5 22.4Master’sdegree 8.2 7.5 10.8 9.2Professionaldegree 4.1 2.1 5.1 2.3PhD 1.2 1.0 1.6 1.2
Notes:Onlyworkersaged25andolderareincludedintheanalysis.TheChicagosuburbsareonlythoseinIllinois.Sources:Authors’calculationsbasedondatafromtheU.S.CensusBureau,1990 and 2000 Census of Population and Housing,Public Use Microdata Sample,5percentsample.
high school graduates. Respondents with the lowest level of education (less than high school) are the least likely to work in jobs that are concentrated in the city of Chicago. Such results are consistent with those of Sander and Testa (2009), who show that low-income and low-skilled Chicago residents now tend to find employment in the suburbs rather than in the city. The other significant results are that age squared and black have positive effects on the occupational concentration variable, while age, Hispanic, Asian, and male have negative effects.
Further, when we break down the U.S. Census data by educational attainment and place of work (city of Chicago versus its suburbs in Illinois) for 1990 and 2000, we see higher levels of educational attainment are associated with jobs in the city. In 2000, 42 percent of workers aged 25 and older in the city of Chicago had at least a bachelor’s degree, while 35.1 percent of workers in the suburbs had at least a bachelor’s degree (see table 4, fourth through seventh rows of the third and fourth columns). In 1990, 33.9 percent of workers in the city of Chicago had at least a bachelor’s degree and 30.4 percent of workers in the suburbs had at least a bachelor’s degree (see table 4, fourth through seventh rows of the first and second columns). These findings indicate that between 1990 and 2000 the percentage of workers with at least a bachelor’s degree increased by 8.1 percentage points in the city of Chicago and 4.7 percentage points in the suburbs.
The heightened specialization of the city as an employment nexus for high-skilled work is sometimes believed to contribute to widening income disparities in the city (Doussard, Peck, and Theodore, 2009). For
the city of Chicago, this observation is supported by our deriving the Gini coeffi-cients, which are measures of the inequal-ity of a distribution (a value of 0 expressing total equality and a value of 1 expressing maximal inequality). Using U.S. Census data, we calculated these coefficients, which were measured for households across the Chicago metropolitan area over the period 1990–2000. The Gini coefficient for the city of Chicago rises from 0.41 in 1990 to 0.47 in 2000, indi-cating an increase in inequality. For Chicago’s suburbs, the same coefficient rises similarly over this period, from 0.36 to 0.42.
Although rising inequality is usually perceived as being not desirable, Glaeser, Resseger, and Tobio (2008) show that this is not necessarily the case for cities. Indeed,
inequality arises in cities because of their ability to suc-cessfully attract high-skilled workers; but inequality can have some positive effects, such as providing better role models for low-income communities and generating jobs that meet the needs of the new high-income neighbors. At the same time, however, higher inequality in met-ropolitan areas can have a negative effect on growth and increase crime (Glaeser, Resseger, and Tobio, 2008).
The Chicago metropolitan area has experienced a marked type of widening inequality in its central city (Doussard, Peck, and Theodore, 2009). Occupations in the middle of the wage spectrum, especially manu-facturing-related ones, have shifted to the suburbs.
Some studies have focused on the racial/ethnic dimension of Chicago’s shifting economy (for example, Wilson, 1987). Low-skilled jobs have become increas-ingly occupied by low-skilled immigrants, especially Hispanic workers. Meanwhile, job opportunities for middle-income African-American workers have been diminished because of both suburbanization of em-ployers and competition from immigrant workers. Other studies have noted that middle- and upper-income African-American households have moved to the sub-urbs in the Chicago region, leaving behind low-income neighborhoods (Institute on Race and Poverty, 2006). This perception that upwardly mobile blacks (and Hispanics) are suburbanizing may be subject to further refinement. As our analysis shows in the next sections, the patterns of choosing to reside along Chicago’s lake-front of black and Hispanic households (made up of singles and those married with no children) with high levels of educational attainment hold some similarities to that of non-Hispanic whites of similar backgrounds.

124 4Q/2010, Economic Perspectives
Data and models
In this section, we use data from the 5 percent PUMS from the 2000 Census of Population and Housing for the Chicago metropolitan area (only the Illinois portions) to explore residential location choices of households.1 We also make estimates with the 5 percent PUMS from the 1990 Census of Population and Housing and the PUMS from the (smaller) 2006 American Community Survey. Although we focus on estimates for 2000 U.S. Census data, differences in our results for other periods (which we do not report) will be briefly discussed as well.
We estimate the likelihood of households locating within divisions of the Chicago metropolitan area. Four broad geographical areas are estimated in our models (the four areas discussed in figure 1, p. 117). To reit-erate, the four areas are the Chicago lakefront north, comprising the city of Chicago’s lakefront locations from the downtown (central business district) north-ward; Chicago lakefront south, comprising the city of Chicago’s lakefront locations south of the downtown; other Chicago, covering the rest of the city of Chicago; and the Chicago suburbs (only within Illinois), which is the omitted area.2 The city lakefront locations account for a little over 10 percent of the sample. The rest of the city of Chicago accounts for slightly over 20 per-cent of the sample, and the suburban areas make up a little less than 70 percent of the sample.
Our focus is on estimating the likelihood of living in lakefront community areas in the city of Chicago because the data that we have used thus far indicate relatively high levels of educational attainment (and growth in attainment) in such areas. For example, in our Chicago lakefront north area, which includes the central business district, 62 percent of adults aged 25 and older are college graduates in 2006. This could be a result of many factors, including the high concentra-tion of college graduates in the area, relatively conve-nient access to workplaces, and the strong amenity values near Lake Michigan (for example, the myriad of rec-reational options, good views, and temperate climate).
We undertake multinomial logit estimates of household location by race and ethnicity for all U.S. Census respondents who are 25 and older, as well as separate estimates for all workers who are 25 and older. The variables that we use to estimate household location are as follows: educational attainment (relative to high school graduate), household income, age and age squared, three dummy variables indicating children in the household (that is, children aged less than six years old, children aged six through 17, and children aged less than six and children aged six through 17), marital status (relative to having never married), gender, and race and ethnicity.
Since the location of work is an important deter-minant of household location, we also estimated the household location of workers adjusting for a predicted value of working in the city of Chicago. This predicted value of working in the city is used because the loca-tion of work is endogenous—that is, it provides a dis-tinguishable estimate of the influence on where one lives. Following previous studies (for example, Bajari and Kahn, 2005), we estimate the location of work as a func-tion of the other variables in our model and the industry of the worker for identification purposes. The rationales for using industry of work for identification are that industries differ in their suburbanization propensities and that workers have invested in industry-specific human capital. Research by Neal (1995) also provides a justification for this approach. The industries that we use to identify working in Chicago are agriculture, manufacturing, construction, retail trade, wholesale trade, finance, information, professional services, and education. The omitted industry is arts, entertainment, and recreation. Apart from finance and professional services, which have significant positive effects on the propensity to work in the city of Chicago, the other industries have significant negative effects.
Finally, we separately estimate household location for nonworkers aged 55 and older. We discuss our esti-mates for nonworkers to show how non-work-related fac-tors, such as the allure of amenities and the preference to live in certain social enclaves, might affect household location for retirees. We select U.S. Census respondents who were not working and who were not unemployed. If they were married, respondents with spouses working were excluded from the analysis. The other variables in the model are the same as we discussed earlier.
Results
Our multinomial logit estimates of household location in the Chicago metropolitan area are presented in table 5. The coefficients in our estimates indicate marginal effects at mean values for the other variables. For example, having a professional degree increases the probability of living on the city’s north lakefront by 0.09 relative to respondents with only a high school diploma or equivalent (table 5, fifth row). Overall, the results indicate having a bachelor’s degree or higher increases the likelihood of living on the North Side lakefront. This is less the case for the South Side lakefront, as indicated by very small coefficients for the variables indicating having a bachelor’s degree or higher. Respondents with higher levels of education are less likely to live in the rest of the city of Chicago (other Chicago) relative to suburban areas. Income has a significant positive effect on the probability of

125Federal Reserve Bank of Chicago
TaBLE 5
Multinomial logit estimates of household locationin the Chicago metro area
Chicago Chicago lakefront lakefront OtherDependentvariable north south Chicago
Lessthanhighschool 0.02** 0.001* 0.05**Somecollege 0.01** –0.001 –0.03**Bachelor’sdegree 0.05** 0.002** –0.06**Master’sdegree 0.06** 0.01** –0.05**Professionaldegree 0.09** 0.01** –0.03**PhD 0.08** 0.03** –0.10**Income 0.39×10⁻⁷** –0.66×10⁻⁷** –0.53×10⁻⁶**Age –0.002** –0.0004** 0.002**Age² 0.00001** 0.000006** –0.00002**Childrenaged<6 –0.03** –0.004** –0.001Childrenaged6–17 –0.05** –0.005** –0.01**Childrenaged<6and6–17 –0.06** –0.005** –0.01**Married –0.05** –0.01** –0.09**Divorced –0.02** –0.01** –0.07**Widowed –0.03** –0.01** –0.06**Male –0.004** –0.002** 0.001Black 0.03** 0.06** 0.24**Hispanic 0.01** 0.03** 0.23**Asian 0.02** 0.01** 0.11**Numberofobservations 218,270 218,270 218,270
*Significantatthe5percentlevel.**Significantatthe1percentlevel.Notes:Coefficientsindicatemarginaleffects.Onlyadultsaged25andolderareincludedintheanalysis.Fordetailsonthegeographicaldivisions,seefigure1.Source:Authors’calculationsbasedondatafromtheU.S.CensusBureau,2000 Census of Population and Housing,Public Use Microdata Sample,5percentsample.
living in North Side lakefront locations, while it has a negative effect on the probability of living in South Side lakefront locations and other Chicago locations.
Age has a U-shaped effect on the probability of living on the lakefront: This indicates that the youngest and oldest respondents are more likely to live on the lakefront than the middle-aged individuals. Age has an inverted U-shaped effect on living in Chicago neigh-borhoods not along Lake Michigan, indicating that the youngest and oldest respondents are less likely to live in these areas relative to suburban areas. The key re-sult for marriage is that currently married respondents and divorced and widowed respondents are less likely to live in the city of Chicago. This is usually the case for respondents with children as well; they are especially less likely to live in the city of Chicago’s lakefront lo-cations. The other significant findings are a very modest negative effect of being male on the likelihood of living in the city’s lakefront locations and a positive effect of being black, Hispanic, and Asian on the likelihood of living in the city.
The pattern in the results for non-Hispanic whites (not shown) is similar to the overall results. However, estimates for blacks (also not shown) differ slightly. The effects of higher education are even more positive for blacks’ likelihood of living in the south lakefront locations and more neg-ative for blacks’ likelihood to live in loca-tions away from the lake in the city of Chicago. Further, with respect to blacks, the effect of higher income is negative for the likelihood of living in the city’s lakefront locations and positive for the likelihood of living in the rest of the city. Although having children has a negative effect on the likelihood of residing on the North Side lakefront for blacks, all of the variables indicating households with children are positive and significant for South Side lakefront locations and locations elsewhere in the city of Chicago. The pattern in the results among Hispanics (not shown) is similar to the pattern in the results for non-Hispanic whites, with some excep-tions. The key difference is that higher income has a negative effect on the likeli-hood that Hispanics live in any area in the city of Chicago (including its northern lake-front area).
As noted previously, educational at-tainment partly affects household location through the location of work. For this rea-
son, we undertake an estimate for workers that adjusts for a predicted value of whether the U.S. Census respon-dent worked in the city of Chicago (table 6). The first stage of this estimate is an estimate of working in Chicago, adjusting for the other variables in the estimate. The key result from this exercise is that the effects of earning a bachelor’s degree or higher on the likelihood of living in the city’s North Side lakefront locations are slightly lower than in the case when work location was not taken into account. For example, when the location of work is taken into account, the effect of having a professional degree declines from 0.09 (in table 5) to 0.05 (in table 6), and the effect of having a bachelor’s degree declines from 0.05 to 0.04. This sug-gests, once again, that part of the higher education effect works through its effect on the location of employ-ment. We also estimate household location for workers, by race and ethnicity, adjusting for predicted work (not shown), and find a similar effect in our results.
Lastly, we make estimates for nonworkers aged 55 and older (not shown). As we mentioned, we

126 4Q/2010, Economic Perspectives
undertook these estimates to show how high levels of education have an effect on the choice of household location through non-work-related variables, such as proximity to amenities. The results indicate that high levels of education are associated with the likelihood of living on the city of Chicago’s lakefront, especially on the North Side of the city. That is, more-educated older respondents, who are mostly retirees, are more likely to live on Chicago’s lakefront. In an estimate that is not shown, we also adjusted for whether the U.S. Census respondent lived in the same house five years ago. We completed this additional estimate to test whether the effect of higher education on the choice of household location for older workers was being confounded by the effect of household location five years ago. We did not find this to be the case.
We also ran these regressions on 1990 and 2006 data from the U.S. Census Bureau (results not shown). There were two important changes in the results over time that are important to note. First, locations in the interior areas of the city of Chicago became more
attractive over time to highly educated respondents, while locations on Chicago’s lakefront retained their attractiveness to highly educated respondents. Second, the income effect was negative for the likeli-hood to live in North Side lakefront loca-tions in 1990 but positive for the likelihood to live in lakefront locations on the North Side in 2000 and 2006. This is possibly a result of North Side lakefront locations simply becoming more attractive as places to live over time, especially as other high-income households moved there.
Discussion
The importance of the dichotomy between central city and suburbs in char-acterizing urban composition and shaping urban policy has been waning for some time, as average job and population den-sities have fallen continually across the metropolitan areas. Central cities have lost significant shares of population and jobs. This is especially true of Northeast and Midwest cities that have fixed municipal boundaries and physical infrastructures configured for a bygone era of high- density living and working. Certain city neighborhoods have been particularly negatively affected by the departures of highly educated, high-income residents and employers providing high-paying jobs.
That said, in recent decades, the changing eco-nomic landscape has pushed some central city areas to become more densely populated, and this transfor-mation has offered opportunities for redevelopment. Rising average levels of educational attainment and other human capital investment in modern economies, coupled with complementary advancements in com-munication and information technology, have sharpened the productivity of so-called knowledge workplaces in high-density settings, such as central cities. In addi-tion, greater educational attainment of the population in developed countries has rekindled the appeal of many central cities, which now offer not only desirable work-places but also attractive residential locations for highly educated, high-income workers. The rise in the share of never-married adults in the U.S. has also been favor-able to cities, which tend to draw singles.
The city of Chicago is a key example of these broad forces in action. Its economy remains somewhat healthy relative to its counterpart cities in the Midwest, and it appears to have replaced lost employment in
TaBLE 6
Multinomial logit estimates adjustedfor predicted work in the city of Chicago
Chicago Chicago lakefront lakefront OtherDependentvariable north south Chicago
Lessthanhighschool 0.02** 0.001 0.04**Somecollege 0.01** –0.001 –0.03**Bachelor’sdegree 0.04** –0.0004 –0.05**Master’sdegree 0.04** 0.01** –0.05**Professionaldegree 0.05** 0.01** –0.07**PhD 0.05** 0.02** –0.11**Income 0.46×10⁻⁷** –0.44×10⁻⁷** –0.47×10⁻⁶**Age –0.003** –0.001** 0.001Age² 0.00002** 0.00001** –0.00001Childrenaged<6 –0.03** –0.003** –0.004Childrenaged6–17 –0.04** –0.002** –0.01**Childrenaged<6and6–17 –0.05** –0.002** –0.01*Married –0.03** –0.01** –0.07**Divorced –0.01** –0.002** –0.05**Widowed –0.01** –0.003* –0.02**Male –0.01** –0.002** –0.01*Black –0.02** 0.04** 0.14**Hispanic –0.01** 0.01** 0.18**Asian –0.002 0.01** 0.08**Workincity(predicted) 0.15** 0.02** 0.18**Numberofobservations 130,331 130,331 130,331
*Significantatthe5percentlevel.**Significantatthe1percentlevel.Notes:Coefficientsindicatemarginaleffects.Onlyadultsaged25andolderareincludedintheanalysis.Fordetailsonthegeographicaldivisions,seefigure1.Source:Authors’calculationsbasedondatafromtheU.S.CensusBureau,2000 Census of Population and Housing,Public Use Microdata Sample,5percentsample.
127Federal Reserve Bank of Chicago
NOTES
1The locational divisions that we examine in detail (for example, Chicago lakefront north) are composed of multiple public use microdata areas (PUMAs). PUMAs are sample areas with at least 100,000 people. There are 54 PUMAs in our sample. Community areas in the city of Chicago make up the Chicago PUMAs.
2In preliminary work for this article, we experimented with other geographical breakdowns of the data. We subsequently decided upon focusing on areas within the city of Chicago relative to sub-urban areas overall because our primary interest is in the attractive-ness of the city of Chicago as a place to live and work.
manufacturing with gains in industries that require more intensive interpersonal exchanges of information and employ higher-skilled workers. However, it is still unclear whether Chicago’s desirability as a place for jobs has actually come about because there have been changes in the structure of the local economy or rather because some jobs have followed educated “urban homesteaders” back toward the central city.
Our work finds that educational attainment does indeed matter for households’ choice of where to live in the Chicago metropolitan area. Examining nonwork-ing households to tune out the effects of job location, we see that educational attainment is statistically sig-nificant in households’ choice of residential location; this suggests that the city’s amenities and concentration of high human capital are attractive to some households.
Looking more closely, we find at least one “city within a city” has taken shape in Chicago. Individuals with greater educational attainment tend to congregate in the city’s north and south lakeshore neighborhoods, while eschewing most of the inland neighborhoods. To some degree, sharpening income disparities in the city have been accompanied by spatial separation as well.
We find the same location tendencies of non- Hispanic white households generally apply to minority households. However, we do find some spatial differ-ences among white and minority households, even at
the somewhat broad geographical level we examine. In particular, blacks with higher educational attainment have concentrated on both north and south lakeshore areas rather than in other parts of the city of Chicago and the suburbs, despite the fact that black households with low incomes and low levels of education have residential strongholds in many western portions of the city.
The draw of the workplace accounts partly for households deciding to make their residence in the city of Chicago. For this reason, future research initia-tives that can discern the importance of the city as a job location from its importance as a residential location will be especially helpful to city mayors and other policymakers. Specifically, more work on the Chicago metropolitan area’s evolving economic structure needs to be completed before we can more fully understand what factors attract households to live in the city. Leaders and analysts in other Great Lakes cities are looking at the Chicago experience for such insights as Chicago works to refashion itself as a city that can draw highly educated, high-income households and knowledge industries and compete in an increasingly global economy.

128 4Q/2010, Economic Perspectives
Alonso, W., 1964, Location and Land Use: Toward a General Theory of Land Rent, Cambridge, MA: Harvard University Press.
Bajari, P., and M. E. Kahn, 2005, “Estimating housing demand with an application to explaining racial seg-regation in cities,” Journal of Business and Economic Statistics, Vol. 23, No. 1, January, pp. 20–33.
Bayer, P., F. Ferreira, and R. McMillan, 2007, “A unified framework for measuring preferences for schools and neighborhoods,” Journal of Political Economy, Vol. 115, No. 4, August, pp. 588–638.
Bayer, P., R. McMillan, and K. S. Rueben, 2004, “What drives racial segregation? New evidence using Census microdata,” Journal of Urban Economics, Vol. 56, No. 3, November, pp. 514–535.
Becker, G. S., and K. M. Murphy, 2000, Social Economics: Market Behavior in a Social Environ-ment, Cambridge, MA: Belknap Press of Harvard University Press.
Berry, C., R. Bodini, and R. Weissbourd, 2005, “Grads and fads: The dynamics of human capital location,” RW Ventures LLC, report, August 1, available at www.rw-ventures.com/publications/downloads/Grads%20and%20Fads%20Paper%20Final.pdf .
Brueckner, J. K., and S. S. Rosenthal, 2009, “Gentrification and neighborhood housing cycles: Will America’s future downtowns be rich?,” Review of Economics and Statistics, Vol. 91, No. 4, November, pp. 725–743.
Chicago Fact Book Consortium, 1995, Local Community Fact Book: Chicago Metropolitan Area, 1990, Chicago: University of Illinois at Chicago.
__________, 1984, Local Community Fact Book: Chicago Metropolitan Area: Based on the 1970 and 1980 Censuses, Chicago: Chicago Review Press.
Cortright, J., 2005, “The young and restless in a knowledge economy,” CEOs for Cities, report, December, available at www.ceosforcities.org/ pagefiles/CEOs_YNR_FINAL.pdf.
Cullen, J. B., and S. D. Levitt, 1999, “Crime, urban flight, and the consequences for cities,” Review of Economics and Statistics, Vol. 81, No. 2, May, pp. 159–169.
Doussard, M., J. Peck, and N. Theodore, 2009, “After deindustrialization: Uneven growth and economic inequality in postindustrial Chicago,” Economic Geography, Vol. 85, No. 2, April, pp. 183–207.
Florida, R., 2008, Who’s Your City? How the Creative Economy Is Making Where to Live the Most Important Decision of Your Life, New York: Basic Books.
Glaeser, E. L., J. Kolko, and A. Saiz, 2001, “Con-sumer city,” Journal of Economic Geography, Vol. 1, No. 1, pp. 27–50.
Glaeser, E. L., and D. C. Maré, 2001, “Cities and skills,” Journal of Labor Economics, Vol. 19, No. 2, April, pp. 316–342.
Glaeser, E. L., M. G. Resseger, and K. Tobio, 2008, “Urban inequality,” National Bureau of Economic Research, working paper, No. 14419, October.
Glaeser, E. L., and J. Shapiro, 2003, “Urban growth in the 1990s: Is city living back?,” Journal of Regional Science, Vol. 43, No. 1, February, pp. 139–165.
Illinois Department of Employment Security, 2008, Where Workers Work 2009, Chicago: Illinois Depart-ment of Employment Security, Economic Information and Analysis Division.
Institute on Race and Poverty, 2006, Minority Suburbanization, Stable Integration, and Economic Opportunity in Fifteen Metropolitan Regions, report to the Detroit Branch of the National Association for the Advancement of Colored People, Minneapolis, MN, February.
Kitagawa, E. M., and K. E. Taeuber (eds.), 1963, Local Community Fact Book: Chicago Metropolitan Area, 1960, Chicago: University of Chicago Press.
Mills, E. S., 1967, “An aggregative model of resource allocation in a metropolitan area,” American Economic Review, Vol. 57, No. 2, May, pp. 197–210.
Muth, R., 1969, Cities and Housing, Chicago: University of Chicago Press.
Neal, D., 1995, “Industry-specific human capital: Evidence from displaced workers,” Journal of Labor Economics, Vol. 13, No. 4, October, pp. 653–677.
REFERENCES

129Federal Reserve Bank of Chicago
Rosenthal, S. S., 2008, “Old homes, externalities, and poor neighborhoods: A model of urban decline and renewal,” Journal of Urban Economics, Vol. 63, No. 3, May, pp. 816–840.
Rosenthal, S. S., and W. C. Strange, 2008, “The attenuation of human capital spillovers,” Journal of Urban Economics, Vol. 64, No. 2, September, pp. 373–389.
Sander, W., 2005, “On the demand for city living,” Journal of Economic Geography, Vol. 5, No. 3, June, pp. 351–364.
Sander, W., and W. A. Testa, 2009, “Education and household location in Chicago,” Growth and Change, Vol. 40, No. 1, pp. 116–139.
Sassen, S., 2004, “A global city,” in Global Chicago, C. Madigan (ed.), Urbana, IL: University of Illinois Press, pp. 15–34.
Snyder, T. D., and S. A. Dillow, 2010, Digest of Education Statistics 2009, U.S. Department of Education, Institute of Education Sciences, National Center for Education Statistics, No. NCES 2010-013, April, avail-able at http://nces.ed.gov/pubs2010/2010013.pdf.
Wheaton, W. C., 1977, “Income and urban residence: An analysis of consumer demand for location,” American Economic Review, Vol. 67, No. 4, September, pp. 620–631.
Wilson, W. J., 1987, The Truly Disadvantaged: The Inner City, the Underclass, and Public Policy, Chicago: University of Chicago Press.