Embed Size (px)
Citation preview

NBER WORKING PAPER SERIES
A NEW DATA SET OF EDUCATIONAL ATTAINMENT IN THE WORLD, 1950–2010
Robert J. BarroJong-Wha Lee
Working Paper 15902http://www.nber.org/papers/w15902
NATIONAL BUREAU OF ECONOMIC RESEARCH1050 Massachusetts Avenue
Cambridge, MA 02138April 2010
We are grateful to Ruth Francisco, Hanol Lee, and Seulki Shin for valuable research assistance andUNESCO Institute for Statistics for providing data. Mr. Lee thanks the Korea Research Foundationfor financial support. The views expressed in the paper are the authors' and do not necessarily reflectthe views or policies of the Asian Development Bank. The data set presented here is available online(http:/www.barrolee.com/). The views expressed herein are those of the authors and do not necessarilyreflect the views of the National Bureau of Economic Research.
NBER working papers are circulated for discussion and comment purposes. They have not been peer-reviewed or been subject to the review by the NBER Board of Directors that accompanies officialNBER publications.
© 2010 by Robert J. Barro and Jong-Wha Lee. All rights reserved. Short sections of text, not to exceedtwo paragraphs, may be quoted without explicit permission provided that full credit, including © notice,is given to the source.

A New Data Set of Educational Attainment in the World, 1950–2010Robert J. Barro and Jong-Wha LeeNBER Working Paper No. 15902April 2010JEL No. F43,I21,O11,O4
ABSTRACT
Our panel data set on educational attainment has been updated for 146 countries from 1950 to 2010.The data are disaggregated by sex and by 5-year age intervals. We have improved the accuracy ofestimation by using information from consistent census data, disaggregated by age group, along withnew estimates of mortality rates and completion rates by age and education level. We use these newdata to investigate how output relates to the stock of human capital, measured by overall years of schoolingas well as by the composition of educational attainment of workers at various levels of education. Wefind schooling has a significantly positive effect on output. After controlling for the simultaneous determinationof human capital and output, by using the 10-year lag of parents‘ education as an instrument variable(IV) for the current level of education, the estimated rate-of-return to an additional year of schoolingranges from 5% to 12%, close to typical Mincerian return estimates found in the labor literature.
Robert J. BarroDepartment of EconomicsLittauer Center 218Harvard UniversityCambridge, MA 02138and [email protected]
Jong-Wha LeeEconomics Research DepartmentAsian Development Bank6 ADB Avenue, Mandaluyong City1550 Metro Manila, Philippinesand Economics Department, Korea [email protected], [email protected]

1
1. Introduction
Many observers have emphasized the crucial importance of human capital, particularly as
attained through education, to economic progress (Lucas, 1988 and Mankiw, Romer and Weil,
1992). An abundance of well-educated people goes along with a high level of labor productivity.
It also implies larger numbers of more skilled workers and greater ability to absorb advanced
technology from developed countries. The level and distribution of educational attainment also
have impact on social outcomes, such as child mortality, fertility, education of children, and
income distribution (see for example Barro and Lee, 1994; de Gregorio and Lee, 2002; Breierova
and Duflo, 2004; Cutler et al., 2006).
There have been a number of attempts to measure educational attainment across countries to
quantify the relationship between it and economic and social outcome variables. Earlier
empirical studies used school enrollment ratios or literacy rates (Romer, 1990, Barro, 1991, and
Mankiw, Romer and Weil, 1992). But although widely available, these data do not adequately
measure the aggregate stock of human capital available contemporaneously as an input to
production.
Our earlier studies (1993, 1996, and 2001) filled this data gap by constructing measures of
educational attainment for a broad group of countries. The figures were constructed at 5-year
intervals from 1960 to 2000. The data showed the distribution of educational attainment of the
adult population over age 15 and over age 25 by sex at seven levels of schooling. We also
constructed measures of average years of schooling at all levels—primary, secondary, and
tertiary—for each country and for regions in the world.
In this paper, we update and expand the data set on educational attainment. We extend our
previous estimates from 1950 to 2010, and provide more, improved data disaggregated by sex
and age. The data are broken down into 5-year age intervals, and the coverage has now expanded
to 146 countries by adding 41, including 11 former Soviet republics. The accuracy of estimation
has also improved by incorporating recently available census/survey observations.

2
The new data set improves on the earlier by using more information and better methodology. We
construct new estimates by using information from survey/census data, disaggregated by age
group. Previously, we adopted a perpetual inventory method, using the census/survey
observations on the educational attainment of the adult population group over age 15 or over age
25 as benchmark stocks and new school entrants as flows that added to the stocks with an
appropriate time lag. The flow estimates were estimated using information on school-enrollment
ratios and population structure over time. But this method is subject to bias due to inaccuracy in
estimated enrollment ratios and in benchmark censuses. In the current estimation, we reduce
measurement error by using observations in 5-year age intervals for the previous or subsequent
5-year periods. We also construct new estimates of (a) survival/mortality rates by age and by
education; and (b) completion ratios by educational attainment and by age group. These
measures help improve the accuracy of the backward- and forward-estimation procedure.
The data set improvements address most of the concerns raised by critics, including Cohen and
Soto (2006) and De La Fuente and Doménech (2006). They noted that the previous data set of
Barro and Lee (1993, 2001) shows implausible time-series profiles of educational attainment for
some countries. The new procedures have resolved these problems.
Our estimates of educational attainment provide a reasonable proxy for the stock of human
capital for a broad group of countries. We use these new data to estimate the relationship
between education and output based on a simple production-function approach. We investigate
how output is related to human capital stock, measured by overall years of schooling as well as
by the composition of attainment of workers at various levels of education. We find schooling
has a significant effect on output. The estimated rate-of-return to an addition year of schooling is
higher at secondary and tertiary levels than at primary level.
In the next section, we summarize the data and the methodology for constructing the estimates of
educational attainment and discuss the modifications that have been made in the present update.
In section 3, we highlight the main features of the new data set and compare the estimates with
our previous ones (Barro and Lee, 2001) and alternative measures by Cohen and Soto (2007).
Section 4 presents empirical findings on the relationship between education and income based on

3
the new data set. Section 5 presents our conclusions.
2. Data and Estimation Methodology
A. The Census data
The benchmark figures on school attainment (599 census/survey observations) are collected from
census/survey information, as compiled by UNESCO, Eurostat, and other sources.1 The
census/survey figures report the distribution of educational attainment in the population over age
15 by sex and by 5-year age group, for most cases, in six categories: no formal education (lu),
incomplete primary (lpi), complete primary (lpc), lower secondary (lsi), upper secondary (lsc),
and tertiary (lh).2
Table 1 presents the distribution of countries by the number of available census/survey
observations since 1950.3 For total population aged 15 and over, 200 countries have at least 1
observation, and 103 countries have 3 or more observations. Table 2 shows the distribution of
countries by census/survey year since 1950 (where the underlying figures are applied to the
nearest 5-year value). For total population over age 15, for example, 64 observations are
available for 1960, 85 for 1970, 90 for 1980, 91 for 1990, and 68 for 2000. These data points are
used as benchmark figures on educational attainment.
B. Estimation of missing observations at the four broad levels
We calculate from 1950 to 2010 at the five year intervals the educational attainment of the
1 There are additional data from OECD sources for 30 OECD countries since 1990. We have decided not to use these additional observations. As discussed in Barro and Lee (2001), most OECD data come from labor-force surveys based on samples of households or individuals, in contrast to the national censuses in the UNESCO database. There are significant differences between the OECD and our data for some countries. The discrepancies originate, in many cases, from the different classification schemes used by the OECD and UNESCO. 2 When a census provides only numbers for a combination of several categories, such as no formal education, incomplete primary, and complete primary, we use decomposition methods to separate into categories. See Appendix Notes 2 and 3. See also Notes available online at: http://www.barrolee.com for more details. 3 These census/survey observations include the countries/territories for which we could not construct the complete estimates of educational attainment because of other missing information. Appendix Table shows the census/survey information for the 146 countries for which we have constructed complete estimates.

4
population by 5-year age groups. First, we calculate the distribution of educational attainment at
four broad categories—no formal education (lu), primary (lp), secondary (ls) and tertiary
education (lh). Primary includes both incomplete primary (lpi) and complete primary (lpc), and
secondary (ls) includes lower secondary (lsi) and upper secondary (lsc). Tertiary education (lh)
also includes both junior-level (lhi) and higher-level tertiary (lhc).
We fill in most of missing observations by forward and backward extrapolation of the
census/survey observations on attainment. The estimation procedure extrapolates the
census/survey observations on attainment by age group to fill in missing observations with an
appropriate time lag.
Let’s denote atjh ,
as the proportion of persons in age group a, for whom j is the highest level of
schooling attained- j=0 for no school, 1 for primary, 2 for secondary, and 3 for higher at time t.
There are 13 5-year age groups ranging from a =1 (15–19 years old) to a =13 (75 years and over).
The forward extrapolation method assumes that the distribution of educational attainment of age
group a at time t is the same as that of the age group that was five years younger at time t-5:
1
5,, a
tja
tj hh (1)
where age group a denotes, a =3: 25–29 age group, …a =10: 60–64 age group. This setting
applies to persons who have completed their schooling by time t-5. As explained below, we
adjust this formula by considering different mortality rates by education level for the old
population aged 65 and over. For younger groups under age 25, we adopt a different method,
considering that part of population is still in school during the transition period from t to t+5.
The backward extrapolation is expressed as:
15,,
a
tja
tj hh (1a)
where age group a denotes, a =2: 20–24 age group, …a =9: 55–59 age group.
5
Thus, a person’s educational attainment remains unchanged between age 25 and 59. An
assumption here is that, in the same 5-year age group, the survival rate is the same regardless of a
person’s educational attainment. When we look at information from available censuses stratified
by educational attainment and population structure by age group in the previous or subsequent 5-
year periods, we find this assumption holds well for the population aged 64 and under, but not
for older age groups. In a typical country, the mortality rate is higher for older people who are
less-educated. The assumption of uniform mortality can then cause a downward bias in the
estimation of the total educational stock.
If we consider the differences in survival rate by education levels, the forward extrapolation
method is expressed by
hj ,ta hj ,t 5
a1 ja
(2)
where ja is the age-specific survival rate over the five years for the population in age group a,
for whom j is the highest level of schooling.
For the population aged 60 and above (a =11, 12, and 13), we allow for the different mortality
rates for the old population aged 60 and above by education levels.
By utilizing information from available censuses by age group in the previous and/or next 5-year
periods, we have estimated the survival rates for the old population in the age group, 60–64, 65–
69, and 70–74 (a =10,11, and 12) by education levels. The estimation results show that the more
educated people have lower mortality rates. Appendix Note 1.A describes more details on the
estimation of survival rates.
An important issue is how to combine forward and backward-flow estimates when both are
available for a missing cell. We have carried out a simulation exercise in which we regressed the
‘observed’ actual census values of the various levels of educational attainment on the estimates
generated from forward- and backward-flow estimates (based on both five- or ten-year lead and
lagged values from actual censuses). We use the regression results to construct a weighted-

6
average of forward and backward-flow estimates (see Appendix Note 1.B for more details on
how to combine forward-flow and backward-flow estimates).
Note that the forward and backward-flow estimates cannot be applicable for the two youngest
cohorts between ages 15 and 24 because part of the population is in school during dates t and t+5.
For these age groups (a =1: 15–19 age group and a =2: 20–24), we construct the estimates by
using the estimates of the same age group in t–5 (or t+5) and the change in (age-specific)
enrollment for the corresponding age groups over time (see Appendix Note 1.A. for more details).
C. Estimation of sub-categories of educational attainment
We have estimated school attainment at four broad levels of schooling: no school, some primary,
some secondary, and some higher. We break down the three levels of schooling into incomplete
and complete education by using estimates of completion ratios.
First, we describe our procedure for estimating missing observations for the subcategories for the
primary schooling category. We filled in the missing cells using information from the available
census/survey data. The completion rate at the primary level is expressed as a ratio of people
who completed primary schooling but did not enter secondary schooling to people who entered
primary school. For the remaining missing cells, we filled them in by forward and backward
extrapolation of the census/survey observations on completion ratios with an appropriate time lag.
This procedure applies to the age group a=3 (25–29) and above.4 If both forward and backward
estimates are available, we combine them by using the results of regression of the ‘observed’
actual census values of the various levels of completion ratio on the estimates generated from
forward- and backward-flow estimates (based on both 5-year or ten-year lead and lagged values
from actual censuses). On the other hand, we assume that the completion ratios for aged 15–19
and 20–24 are determined by age specific profile of completion ratios in each country (see
Appendix Note 3).
4 For the countries in which only the completion ratio for total population is available, we break down it into age groups based on the typical age profile of completion ratios constructed using the available data of the countries in the same region.

7
We applied similar methods to estimate missing observations for the subcategories for secondary
and tertiary schooling. Secondary-school enrollees aged 15–19 are treated as incompletely
educated at the secondary level, and higher-school enrollees aged 20–24 are treated as
incompletely educated at the higher level. Appendix Note 3.B explains more details on how to
combine forward-flow and backward-flow estimates of completion ratios.
D. Average Years of Schooling
The number of years of schooling for the population aged 15 and above, st , is constructed as
st ltast
a
a1
A
(3)
where :gtl the population share of group g in population 15 and above and st
a : the number of
years of schooling of age group a— (a =1: 15–19 age group, a =2: 20–24 age group, … , a =13:
75 and above).
The number of years of schooling of age group a in time t is
sta hj ,t
a Durj ,ta
j
(4)
where h
ja the fraction of group a having attained the educational level j = pri, sec, ter, and Dur
indicates the corresponding duration in years.
The duration data is constructed by taking account of changes in the duration system over time in
a country. We suppose that changes in the duration of schooling at the primary level applied to
new entrants in primary school (that is, ages 5–9) at the time of change.
We use the same sources and methodology to construct a panel data set on educational
attainment of females by age group. The data on the distribution of educational attainment
among the population, combined with the information for each country on the duration of school
at each level, generate the number of years of schooling achieved by the average person at
various levels and at all levels of schooling combined.

8
3. The Complete Data Set on Educational Attainment, 1950–2010
Tables 3 and 4 summarize the progress in educational attainment of the population aged 15 years
and above by region and by income classification from 1950 to 2010 for the 146 countries that
have complete information.5
The table considers two broad groups—24 advanced countries and 122 developing countries.
The developing group is further broken down into six regions: Middle East/North Africa (18
countries), Sub-Saharan Africa (33), Latin America/Caribbean (25), East Asia/Pacific (19), South
Asia (7), and Europe and Central Asia (20). Regional averages are computed by weighting each
country's observation by its share in total population of the region.
Some of the important developments that represent the progress of developing countries in
achieving higher educational attainment are summarized as:
In 2010, the world population aged 15 and above is estimated to have an average of 7.8 years
of schooling, increasing steadily from 3.2 years in 1950 and 5.3 years in 1980. The overall
population over age 15 in high-income economies is estimated to have 11 years of schooling,
compared to 7.1 years in developing countries. Both Sub-Saharan African and South Asian
countries have the lowest at 5.2 years on average.
Since 1950, the average years of schooling among the total population aged 15 years and
above in developing countries increased significantly from 2.1 years to 7.1 years. In South
Asia and Middle East/North Africa regions, average years of schooling have more than
5 The additional countries/territories that have complete estimates in the new data set include Albania, Belize, Burundi, Brunei Darussalam, Cambodia, Congo, Cote d’Ivoire, Egypt, Gambia, Gabon, Lao People's Democratic Republic, Luxembourg, Libya, Morocco, Macao Special Administrative Region, Maldives, Malta, Mauritania, Mongolia, Namibia, People's Republic of China, Qatar, Reunion, Rwanda, Saudi Arabia, Tonga, United Arab Emirates, Viet Nam, Yemen. The data set include Croatia, Czech Republic, Serbia, Slovakia, and Slovenia as independent countries, replacing the former Yugoslavia and Czechoslovakia. The former USSR is replaced by the Russian Republic, Armenia, Azerbaijan, Estonia, Kazakhstan, Kyrgyzstan, Latvia, Lithuania, Republic of Moldova, Tajikistan, and Ukraine.
9
doubled since the 1980s. In South Asia, for instance, average years of schooling among the
total population aged 15 and over rose from 2.1 years in 1980 to 5.2 years in 2010.
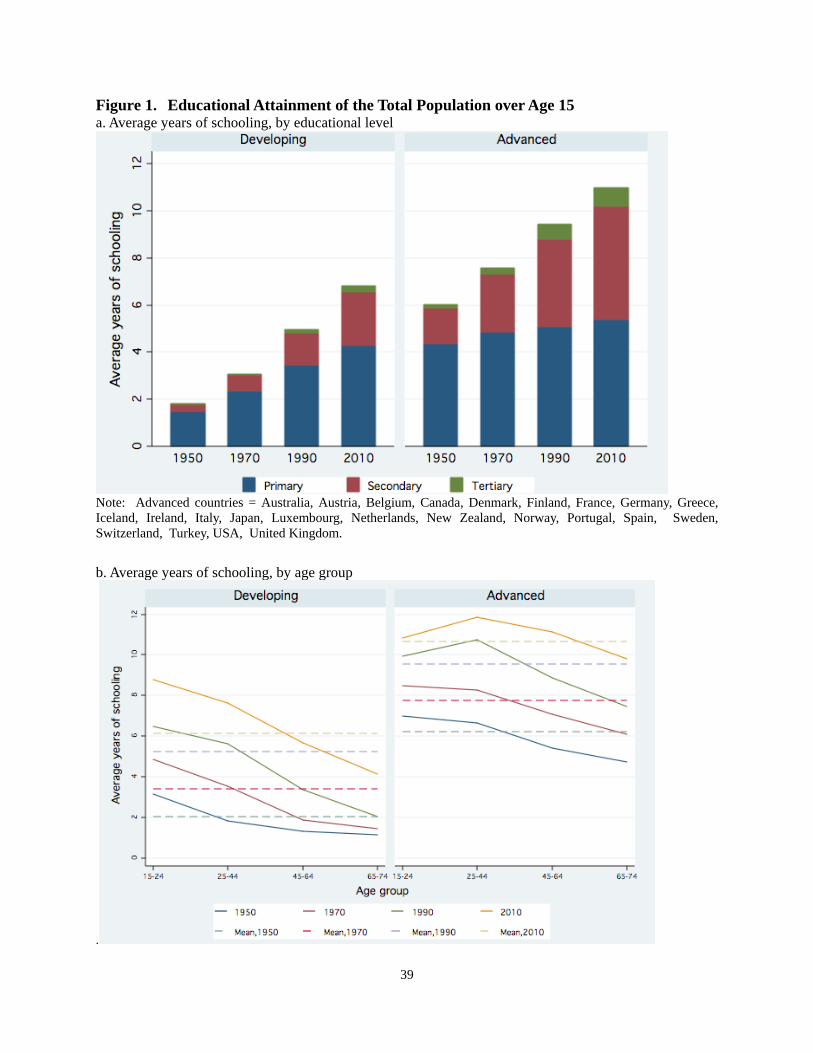
While higher secondary and tertiary completion and enrollment ratios account for most of the
improvements in years of schooling in advanced countries, most of the improvements in
developing countries are accounted for by higher primary and secondary completion and
enrollment ratios (see Figure 1a).
Average years of education among the population aged 15–24 years in developing countries
rose from 3.15 years in 1950 to 6.48 years in 1990 and to more than 8.77 years in recent years
(see Figure 1b). The improvements in completion and enrollment ratios at all levels among the
younger cohorts in every generation continually contribute to rising average years of schooling
as they mature over time. The biggest improvement in average years of schooling among the
younger cohorts was recorded between 1970 and 1990 in both developing and advanced
countries.
Figure 2 shows that developing countries have successfully reduced illiteracy rates, especially
among the younger cohorts. Specifically, the proportion of the uneducated in the total
population over age 15 in developing countries has declined significantly over the past six
decades since 1950, from 64.9% in 1950 to 20.1% in 2010. Among 15–24 year olds, this
proportion has declined from 47.1% in 1950 to 7.1% in 2010.
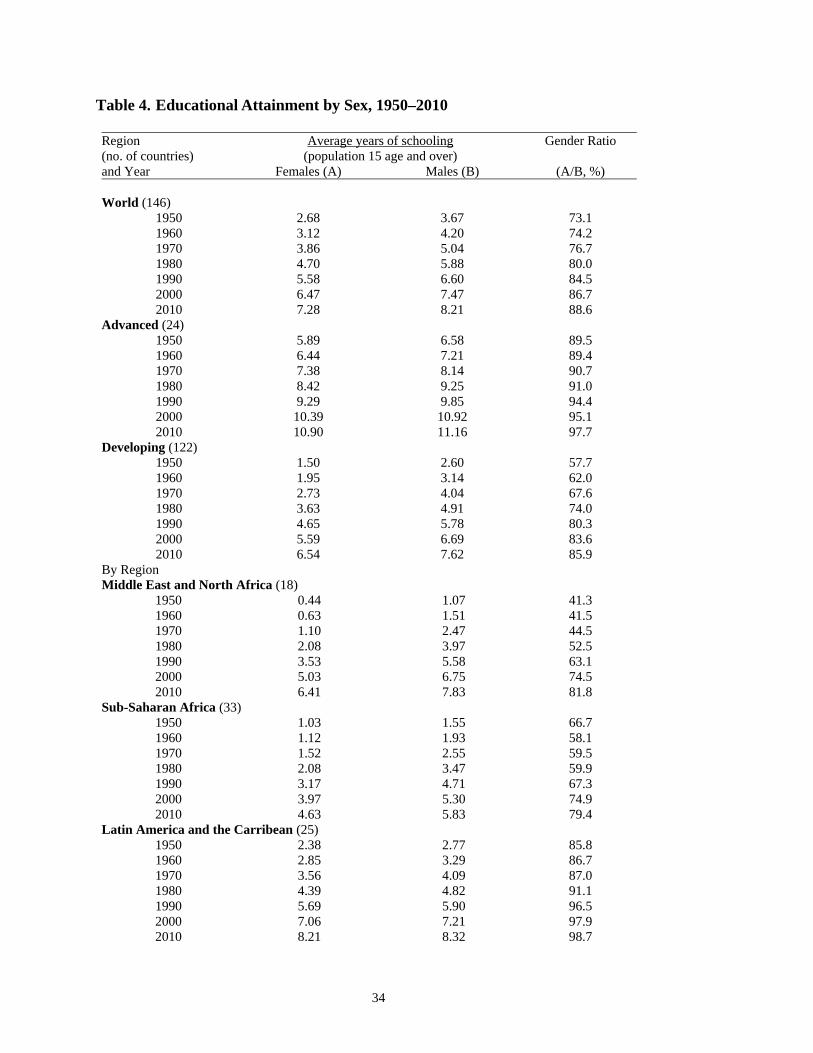
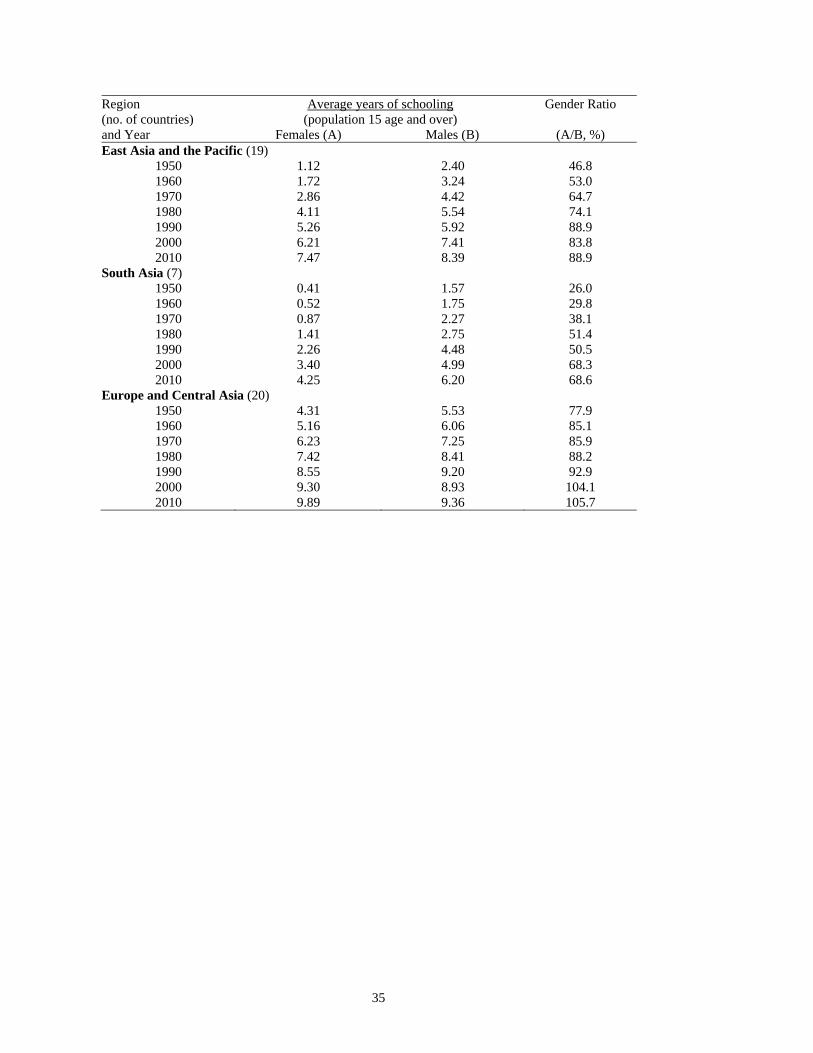
Table 4 summarizes the educational attainment among males and females by region since 1950.
It shows that significant progress has been made by developing countries in terms of reducing
gender inequality in education among the overall population over age 15. The ratio of female
to male average years of schooling increased from around 57.7% in 1950 to 80.3% in 1990
and 85.9% by 2010.
Despite these major developments, many challenges in making education more inclusive remain.
Notwithstanding significant improvements, the current level and distribution of educational
attainment in developing countries is comparable only to that of advanced countries in the late
10
1960s (see Figure 1a).
The gap between developing and advanced countries in average years of schooling among the
overall population over age 15 remains high (3.94 years in 2010) as it has narrowed by only
less than 1 year in the past 40 years.
One factor that contributed to the slow reduction in this gap is the continued increase in the
proportion of the population in advanced countries reaching higher levels of education.
Also, the narrowing of the gap in average years of schooling among younger cohorts between
developing and developed countries is less than enough to compensate for the huge gap among
the older cohorts (see Figure 1b). For example, while the gap between the average years of
schooling among 15–24 year olds in developing economies and advanced countries has
narrowed since 1970 by around 1.58 years in 2010 (3.63 years in 1970 to 2.05 years in 2010),
this gap has even widened by around 1 year (from 4.69 years in 1970 to 5.69 years) among
those aged 65 years and above (see Figure 1a).
The challenge of making education more gender inclusive also remains in many developing
regions, such as South Asia, Middle East, and sub-Saharan Africa. The ratio of years of
schooling among females to males remains below 70% in South Asia.
The prospects of narrowing the educational attainment gap between developing and developed
countries greatly rely on the capability of developing countries to (1) significantly increase
enrollment ratios among new entrants (below 15 years old); and (2) catch up with the high rate
of survival from primary to secondary level and from secondary to tertiary level (15–24 years
old) in developing countries.
4. Comparison with Alternative Estimates
This section compares our estimates of educational attainment with other estimates. First, we

11
want to check our new estimates with our previous estimates in Barro and Lee (2001). Table 5
shows the means and standard deviation of levels and 10-year differences of the overlapping
observations between the new Barro-Lee data set and Barro and Lee (2001) estimates over 1960–
2000. The two estimates are highly correlated in both levels and 10-year differences, with
correlation coefficients over 0.96.
Figure 3 shows that, on average, the new Barro-Lee estimates for average years of schooling for
advanced countries are higher than the previous Barro-Lee estimates. For developing countries,
estimates of average years of schooling until 1990 are slightly lower than the previous estimates.
Figure 3 also shows that the new estimates display a smoother increasing trend in average years
of schooling, both for developing and advanced countries, than the previous estimates.
Country level estimates are also much smoother over time. Figure 4 compares the new Barro-Lee
estimates with Barro-Lee (2001) estimates for selected countries. The new estimates provide
smother time profiles of educational attainment in Norway, the United States, Peru, and
Venezuela.
We also compare the new estimates with the estimates by Cohen and Soto (2007). Cohen-Soto
constructed a data set for average years of schooling for 95 countries at 10-year intervals for
1960–2010. They adopt data and methodology similar to ours. They use forward-flow and
backward-flow methods to fill-in missing observations by extrapolating the census/survey
observations on educational attainment by 5-year age group. But there are also significant
differences. First, Cohen and Soto use OECD sources for OECD countries and UNESCO sources
for non-OECD countries.6 As discussed in Barro and Lee (2001), there exist significant
differences between the OECD data and UNESCO censuses. Most OECD data come from labor-
force surveys based on samples of households or individuals, in contrast to the national censuses
in the UNESCO database. There are also significant differences in the classification of education
systems between the OECD and the UNESCO sources. As a result, Cohen and Soto’s procedure
tends to over-estimate educational attainment for OECD countries (see Figure 5).
6 For only a few OECD countries including Finland, Portugal and Turkey, Cohen and Soto combine both OECD and UNESCO sources.

12
Second, relying on only OECD sources, which are available since the 1990s, underutilizes
available information. For example, Cohen and Soto’s estimation for the United States relies on
only two OECD surveys in 1991 and 1998. The data are then used to estimate missing
observations in the earlier years by the backward-flow method, whereas for the age groups for
which the backward estimates are not applicable, the estimates are constructed mainly by lagged
enrollment rates. In contrast, our estimation for the United States relies on seven UNESCO
censuses from 1950 to 2002, so that the census information on educational attainment by age
group is used to fill in missing observations by both forward-flow and backward-flow estimates.
Third, for non-OECD countries, we use substantially more UNESCO censuses than Cohen and
Soto. Cohen and Soto's estimation uses only 70 UNESCO censuses for 75 developing countries
in their sample, compared to 392 for 122 developing countries in our sample. In fact, Cohen-
Soto’s estimates for 27 countries (including most sub-Saharan African countries) rely entirely on
enrollment data. We believe our estimates based on more censuses must contribute to more
accurate estimation of missing observations by forward-flow and backward-flow method by age-
group.
Finally, Cohen-Soto do not consider the difference in mortality rates by educational levels nor
the change in durations over time.
Table 5 shows means and standard deviations of average schooling years in levels and 10-year
differences for the sample of the overlapping observations between the new Barro-Lee data set
and Cohen-Soto (2007). The new Barro-Lee estimates for average years of schooling in 1960 are,
on average, lower than those in Cohen and Soto (2007). However, the new Barro-Lee estimates
for 2010 are higher on average. It also shows that the new Barro-Lee data set displays less
dispersion than Cohen-Soto (2007). Lower dispersion is observed across estimates for
developing countries and advanced countries across time, except for advanced countries in 1960.
Figure 5 show that the estimates for advanced countries in the new Barro-Lee data set are on
average lower than in Cohen-Soto (2007) for the overall period, 1960-2010. Table 5 shows that
13
estimate for advanced countries are less correlated than those for developing countries. For
developing countries, the new Barro-Lee estimates are on average very close to Cohen-Soto
(2007) estimates in earlier years but higher for 2010.
We estimate reliability ratios for the new Barro-Lee estimates vis-à-vis Cohen-Soto (2007) in
levels and first 10-year differences. As used by Krueger and Lindahl (2001) in checking quality
of schooling data, the reliability ratio gauges the fraction of the variability of a (unobserved) true
variable in the total variability of the variable measured with error. Suppose S1 and S2 represent
two observed noisy measures of the (unobserved) true variable S. That is, S1 = S + e1 and S2 = S +
e2, where e1 and e1 are the measurement error of S1 and S2. If e1 and e2 are uncorrelated, the
reliability ratio of S1 is defined as R1 = cov(S1 , S2) /var(S1) and has probability limit equal to
var(S)/var(S1). Similarly, the reliability ratio of S2, R2 = cov(S1 , S2) /var(S2) has probability limit
equal to var(S)/var(S2).
Cohen-Soto (2007) showed that their estimates perform better as compared with Barro and Lee
(2001). It turns out, however, the reliability ratio for the new Barro-Lee estimates is greater than
that of Cohen Soto (2007), both in levels and 10-year differences in years of schooling for
persons 15 years and older. Specifically, while the new Barro-Lee data set has reliability ratios of
0.99 for levels and 1.00 for differences, the reliability ratios of Cohen-Soto (2007) are 0.90 for
levels and 0.88 for differences. This means that a greater proportion of the variability in observed
levels and changes in the new Barro-Lee data set represents true levels and changes than in the
Cohen-Soto (2007) data set. In other words, the new Barro-Lee data set conveys more signal
than the Cohen-Soto (2007) data, both in levels and changes.7
Our estimates of educational attainment provide a reasonable proxy for the stock of schooling
capital for a broad group of countries. However, the school attainment does not take account of
the skills and experience gained after formal education. The measure does not directly measure
the skills obtained at schools and, specifically, does not take account for differences in the quality
7 We have also computed reliability ratios of De La Fuente and Domenech (2006) for the sample of OECD countries.
The reliability ratios of the estimates by De La Fuente and Domenech are similar to those of our current data set. The results can be obtained from the authors upon request.

14
of schooling across countries. Figure 6 compares our concept of educational attainment with
Hanushek and Woessmann’s (2009) measure of human capital quality, which was constructed by
standardizing and combining available international math and science test results, covering
1964–2003 for 50 countries.8 Educational attainment and human capital quality measures are
highly correlated but human capital quality is quite diverse for countries with similar levels of
educational attainment.
5. Revisiting the Relationship between Education and Income
Using the updated Barro-Lee data set, we revisit the important relationship between education
and income.
We set up a specification in which the cross-country differences in output per worker (working
age population between 15-64 years old) are related to differences in human capital stock, measured
by years of schooling, in addition to factor inputs and total factor productivity.
Assume the Cobb-Douglas production function such as,
1HAKY . (5)
where Y is output, K is the stock of physical capital, H represents human capital stock, and A
denotes a measure of total factor productivity. By assuming hLH , where h represents the
amount of human capital per worker and L represents the number of workers, the production
function can be rewritten,
1)(hLAKY (5a)
Expressing the variables in per worker term and then taking the log yields:
ln(Y / L) ln A ln(K / L) (1 )ln(H / L) (5b) or
ln y ln A ln k (1 ) lnh (5c)
8 See Hanushek and Woessmann (2009) for more details about their methodology for estimating human capital quality.

15
where y is output per worker and k is capital stock per worker.
Human capital per worker is assumed to have a relation to the number of years of schooling as
follows:9
)(seh (6)
In this equation, (s) measures the efficiency of a unit of labor, with S years of education being
relative to one without any schooling. We further assume that (s) is linear,
h es (6a)
Substituting (6a) into (5c) yields,
ln y ln A ln k (1 )s (7)
To measure the relationship between output and human capital, we estimate:
log(yt ) t 1 log(kt ) 2 (st ) t (8)
The coefficient 1 is the share of capital in total output () and 2 is the marginal rate-of-return
to an additional year of schooling. The regression includes a period dummy variable, which
represents total factor productivity that is assumed to vary over time. We also include a dummy
variable for oil exporters.
We use data on average years of schooling from the updated Barro-Lee data set, and Penn World
Table (PWT version 6.3) (Heston, Summers, and Aten, 2009) data on output per worker. Physical
capital stock data is generated by perpetual inventory method following Bernanke and
Gurkaynak’s (2001) approach.10 The data set is an unbalanced panel consisting of 962
9 See Klenow and Rodriguez-Clare (1997) and Hall and Jones (1999). 10 An initial value of the capital stock series for each country I is generated by: Ki,0 Ii,1 / (gi,1 ) where K0 is the
capital stock, I1 is the capital flow at year 1 or the year after the initial year, g1 is the 5-year average annual growth
rate around year 1, and is the depreciation which is assumed to be the same across countries (0.06). After we exclude the first 5 years of capital stock estimates, we construct the capital stock series using the perpetual inventory method: Ki,t Ki,t1(1 ) Ii,t
. The data on investment-to-GDP ratio, real GDP, and real GDP growth are from the
16
observations at 5-year intervals over the period 1970 to 2005 for 127 countries. We exclude 19
countries with less than 6 observations.11
We use random- and fixed-country-effects panel estimation procedures, as well as an instrument-
variable (IV) estimation procedure.
The estimate on human capital (as well as physical capital-worker ratio) in equation (8) is subject
to potential bias that may come from several sources. First, there can be omitted variable bias. It
is plausible that some important institutional and economic factors that are not included as
explanatory variables in the specification of the production function model can influence both
output and human capital simultaneously. If an omitted variable varies by country, but is constant
over time, an inclusion of country-fixed-effects term eliminates this source of endogeneity bias.
The other potential source of bias comes from simultaneity. The significantly positive effect of
education on output may reflect reverse causality. For example, people may invest more in
education when they have higher (current or anticipated) income. This simultaneity bias can be,
in principle, handled with instruments. The problem, however, is to find good instrumental
variables. At the micro level, it is common to estimate Mincer-type regressions to gauge rates of
return from education. Often people worry about the endogeneity of schooling with respect to
income or earnings and use measures of ability or parents' income as instruments for schooling.
Adopting the methodology developed in the micro-labor literature, we use parental education as
the instrument for the education variable in the IV estimation. The contemporaneous educational
attainment for the population aged 15 and over includes a portion of educational attainment of
the younger generation (e.g. between 15 and 25 years old), which may be correlated with current
income. But, considering that the educational attainment of the parents’ generation was
accumulated by their past investment in education, it can be uncorrelated with the error term ( t )
in equation (8). Specifically, we take the 10-year lag average years of schooling among the
Penn World Table. 11 To make the data more balanced, we use the 5-year lag of lnk in lieu of missing 10-year lag of lnk to instrument for capital-worker ratio in the IV estimation described later. Note that adding the excluded country samples or deleting observations without 10-year lagged instruments do not incur any significant change to the estimation results.
17
population of 40 years and over (S(t-10) 40-75) to represent parents’ education and use it to
instrument for the average years of schooling variable (St). We also use the 10-year lag of log
capital-worker ratio to instrument for the log capital-worker ratio since we assume that the
lagged capital-worker ratio is uncorrelated with the unobserved error term in equation (8).
Table 6 presents the estimation results of specification (8) to investigate the impact of education
on output. We apply two different estimation techniques: random-effects and fixed-effects.
Columns (1) and (2) of Table 6 present the random-effects and fixed-effects estimates. The
estimated coefficients on the educational attainment variable are always positive and statistically
significant, though marginal. In both random- and fixed-effects settings, the estimates for the
rate-of-return to education are around 0.02. The estimates suggest that, holding other things
constant, output for the world economy as a whole would increase by around 2% for every
additional year of schooling.
Columns (3) – (4) in Table 6 present our estimates for random-effects and fixed-effects IV
models. The estimated coefficients on the educational attainment variable are statistically
significant. The IV fixed-effects estimate for the rate-of-return to education (12.1%) is higher
than the IV random-effects estimate (5.5%). These figures are close to the typical Mincerian
return estimates found in labor literature.12 Comparing our results with columns (3) and (4) and
without instruments (columns 1 and 2), our IV estimates for the rate-of-return to education are
higher than our benchmark OLS estimates for both random- and fixed-effects models.
We extend our analysis to examine whether the return to human capital varies across regional
groups. We estimate the following specifications:
log(yr ,t ) t 1 log(kt ) 2r (st Dr ) r ,t (8a)
where Dr is dummy for region r.
12 Cross-country evidence indicates that the average Mincerian return to schooling is centered around 10% (Psacharapoulos and Patrinos, 2004).

18
Columns (5), (6), (7), and (8) in Table 6 present our regional estimates for the random-effects
and country fixed-effects models with and without instruments, respectively. Consistent with our
earlier results (in Table 6 columns 1 – 4), the IV estimates for the rate-of-return to education, by
region, are higher than the estimates without instruments, for both random-effects and fixed-
effects models. Rates of return to education estimates vary across regions. Rate-of-return
estimates in the three regions—the group of advanced countries, East Asia and the Pacific, and
South Asia—are higher than in the other regions. The group of advanced countries has the
highest IV fixed-effects rate-of-return estimate (13.3%). This figure suggests that on average, the
wage differential between a primary school graduate and a secondary school graduate in this
region is around 110%. By contrast, the estimated rate-of-return to education is quite low in Sub-
Saharan Africa (6.6%) and Latin America (6.5%). Figure 7 shows the rate-of-return estimates by
region.
We also examine whether the link between education and income changes by level of education.
log(yt ) t 1 log(kt ) prist , pri secst ,sec terst ,ter t (8b)
Columns (9), (10), (11), and (12) in Table 6 present our estimates for random-effects and fixed-
effects models with and without instruments, respectively.13 Results confirm that the return to
human capital varies across different levels of education. Based on the IV fixed-effects estimates,
the return to every additional year of schooling is 10.0% at the secondary level and 17.9% at the
tertiary level. This finding suggests that on average, the wage differential between a secondary-
school graduate and a primary-school graduate is around 77%, and the wage differential between
a college graduate and a primary-school graduate is around 240%.
Our results indicate that the return is negative, though not statistically significant, at the primary,
and increasingly positive in secondary and tertiary levels, which is contrary to the usual pattern
shown in the literature that Mincerian returns are decreasing by level of education
13 Here we use the 10-year lag of parental education (Sl,(t-10) 40-75 where l = pri, sec, ter) to instrument for years of
schooling by level of schooling (Sl,t 40-75) and, as in the other specifications, the 10-year lagged log capital-worker ratio is used to instrument for log capital-worker ratio by region.

19
(Psacharapoulos and Patrinos, 2004). But, there are also cross-country studies that present trends
in rate-of-return that is increasing with levels of schooling (see for example, Schultz, 2004 and
Duraisamy, 2002). Nevertheless, our finding that the estimated return to an additional year of
primary schooling is negative is puzzling. The hypothesis that the return to human capital is the
same for all regardless of educational attainment (H0: pri sec ter vs. HA:
pri sec ter ) is always rejected, whereas the hypothesis that the return to human capital is the
same for secondary and tertiary education is always accepted.
6. Concluding Remarks
Our new data set on educational attainment applies to 146 countries at five-year intervals from
1950 to 2010. The estimates are disaggregated by sex and by 5-year age intervals. These
estimates improve on our previous, widely used data set by utilizing more information and better
estimation methodology. We use the new schooling data to investigate the relationship between
education and income. We confirm that the schooling of workers has a significantly positive
effect on the level of income at the country level.
This improved data set on educational attainment should be helpful for a variety of empirical
work. Our earlier estimates of educational attainment have been used in many studies. Up to
February 2010, our papers on educational attainment data published in 1993, 1996, and 2001
have been cited in journals over 740 times, according to the Social Science Citations Index. The
total number of citations by all journal articles, books, and working papers amounts to over 5,100,
according to Google Scholar. Our estimates of educational attainment provide a reasonable
proxy for the stock of human capital for a broad group of countries. The data set has been useful
for studying the linkages across countries between education and important economic and social
variables, such as economic growth, export competitiveness, fertility, income inequality,
democracy, institutions, and political freedom. We expect that this new data set will help to
improve the reliability of these types of analyses.
20
References
Barro, R.J. 1991. “Economic Growth in a Cross Section of Countries,” The Quarterly Journal of Economics, 106(2): 407-43. Barro, R.J. and J.W. Lee. 1993. “International Comparisons of Educational Attainment,” Journal of Monetary Economics, 32, 363-94. Barro, R.J. and J.W. Lee. 1996. “International Measures of Schooling Years and Schooling Quality,“ American Economic Review, 86, 218-23. Barro, R. and J.W. Lee. 1994, “Sources of Economic Growth,” Carnegie Conference Series on Public Policy, 40: 1. Barro, R. and J.W. Lee. 2001. “International Data on Educational Attainment: Updates and Implications,” Oxford Economic Papers 53(3). Bernanke, B.S. and R.S. Gurkaynak. 2001. “Is Growth Exogenous? Taking Mankiw, Romer, and Weil Seriously,” NBER Macroeconomics Annual, 16: 11-57. Breierova, L. and E. Duflo. 2004.“The Impact of Education on Fertility and Child Mortality: Do Fathers Really Matter Less than Mothers?” NBER Working Paper No. 10513. Cohen, D. and M. Soto. 2007 “Growth and Human Capital: Good Data, Good Results,” Journal of Economic Growth, 12:51–76. Cutler, D., A. Deaton, A. Lleras-Muney. 2006. “The Determinants of Mortality,” The Journal of Economic Perspectives, 20(3): 97-120. De Gregorio J. and J.W. Lee. 2002. “Education and Income Inequality: New Evidence from cross-country data,” Review of Income and Wealth, 48(3): 395–416. De La Fuente, A. and R. Doménech. 2006. “Human Capital in Growth Regressions: How Much Difference Does Data Quality Make?,” Journal of the European Economic Association, 4(1): 1-36. Duraisamy, P. 2002. “Changes in Returns to Education in India, 1983-94: by gender, age-cohort and location,” Economics of Education Review, 21(6): 609-622. Hall, R.E. and C.I. Jones. 1999. “Why Do Some Countries Produce So Much More Output Per Worker Than Others?,” Quarterly Journal of Economics, 114(1): 83-116. Hanushek E.A. and L. Woessmann. 2009. “Do Better Schools Lead to More Growth? Cognitive Skills, Economic Outcomes, and Causation,” NBER Working Paper No. 14633. Heston, A., R. Summers, and B. Aten. 2009. Penn World Table Version 6.3, Center for

21
International Comparisons of Production, Income and Prices at the University of Pennsylvania. Klenow, P. and A. Rodriguez-Clare. 1997). "The Neoclassical Revival in Growth Economics: Has It Gone Too?" in NBER Macroeconomics Annual 1997, eds . B. Bernanke and J. Rotemberg, MIT press, pp. 73-103. Krueger, A.B. and M. Lindahl. 2001. “Education for Growth: Why and For Whom?,” Journal of Economic Literature, 39 (December): 1101–1136. Lucas R.E. 1988. "On the Mechanics of Economic Development," Journal of Monetary Economics, July, 3-42. Mankiw, G., D. Romer, and D. Weil. 1992. "A Contribution to the Empirics of Economic Growth," Quarterly Journal of Economics, 107. Psacharopoulos, G. and H.A. Patrinos. 2004. “Returns to Investment in Education: A Further Update,” Education Economics, 12(2): 111–135. Romer, Paul. 1990. "Endogenous Technological Change," Journal of Political Economy, October, S71-S102. Schultz, T.P. 2004. “Evidence of Returns to Schooling in Africa from Household Surveys: Monitoring and Restructuring the Market for Education,” Journal of African Economies, 13(Suppl.1): ii95-ii148. UNESCO. various years. Statistical Yearbook. Paris.

22
Appendix Notes: Estimation Procedures
We use census/survey information compiled by UNESCO, Eurostat, and others as benchmark
figures to estimate average years of schooling at 5-year intervals from 1950 to 2010. As
discussed in the main text, these census figures report the distribution of educational attainment
in the population over age 15 by sex and by 5-year age groups, at 5-year intervals. In most cases,
the distribution of educational attainment is classified according to the following four broad
categories: no formal education (lu), primary (lp), secondary (ls), and tertiary (lh). It is further
classified in many cases into subcategories: incomplete primary (lpi), incomplete secondary (lsi),
and incomplete tertiary (lhi).
1. Estimation of missing attainment data by forward and backward extrapolation.
We fill in most of the missing census observations by forward and backward extrapolation of the
census/survey observations on attainment by age group, with an appropriate time lag. Notes
Table 1 below summarizes the backward and forward estimation procedure by age group.
Table 1. General Rules for Estimating Missing Observations through Backward and
Forward extrapolation
Age group (a) Backward extrapolation Forward extrapolation 15–19, 20–24 hj ,t
a hj ,t 5a enroll j ,t
a hj ,ta hj ,t5
a enroll j ,ta
25–29, 30–35,…, 60–64 hj ,ta hj ,t5
a1 hj ,ta hj ,t5
a1
65–69, 70–74, 75–79 hj ,ta hj ,t 5
a1 j hj ,ta hj ,t5
a1 j
Note: hj ,ta is the proportion of people in age group a, for whom j is the highest level of schooling attained at time t,
enroll j ,ta is the enrollment adjustment factor for age group a in level j at time t, and j is the survival ratio for the
education group j over the five year at time t.
A. We perform either backward or forward extrapolation when at least one benchmark figure is
available from either an earlier or later period. If more than one benchmark figure is available,
we use the figure from the closest period as the benchmark figure.
Aged 25–64. We assume that an individual’s educational attainment remains unchanged from age
25 to 64 and that mortality is uniform across all individuals, regardless of educational attainment.

23
Hence, for age groups between 25 and 64, we fill the missing attainment data using the
attainment of the younger age group from the previous period (forward) as benchmark or the
attainment of the older age group from the succeeding period (backward).
Aged 15–19 and 20–24. Since direct backward or forward extrapolation is not applicable for
these two youngest age groups, we use attainment and enrollment data to estimate missing
attainment data. We assume that the change in enrollment leads to a proportional change in
attainment over time with time lag. Hence, for these age groups, we use estimates for the same
age group from the previous (or in the next) period as benchmark and adjust this benchmark
figure by the change in enrollment over time or the enrollment adjustment factor. The following
summarizes how the age-specific enrollment adjustment factors are derived in case of backward
extrapolation.
Table 2. Enrollment Adjustment Factor
Level Backward extrapolation No education (enrollpri,t
a enrollpri,t 5a )
Primary (enrollpri,ta enrollpri,t5
a ) (enrollsec,ta enrollsec,t5
a )
Secondary (enrollsec,ta enrollsec,t5
a ) (enrollter ,ta enrollter ,t5
a )Tertiary (enrollter ,t
a enrollter ,t5a )
Note: enroll j ,ta is the enrollment rate for age group a in level j at time t.
Aged 65 and over. For older age groups, however, we distinguish between a less-educated
population (uneducated and people who have reached the primary level) and a more-educated
population (reached at least secondary schooling). We assume mortality is higher for the less-
educated and lower for the more- educated. We estimate the survival ratio for less-educated (RL )
and for more-educated (RU ) individuals, for advanced countries (R = OECD) and for developing
countries (R = non-OECD) using a weighted least squares procedure with the available census
information and the following equations.
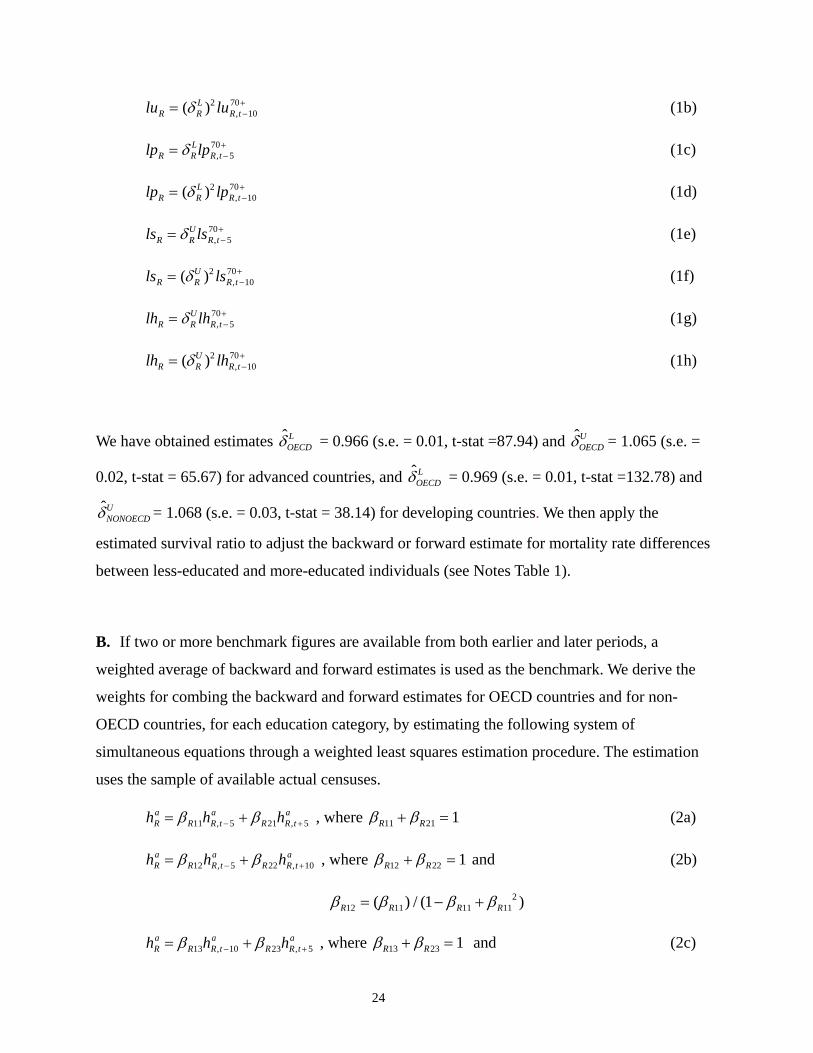
luR RLluR,t 5
70 (1a)
24
luR (RL )2 luR,t 10
70 (1b)
lpR RLlpR,t 5
70 (1c)
lpR (RL )2 lpR,t 10
70 (1d)
lsR RUlsR,t 5
70 (1e)
lsR (RU )2 lsR,t 10
70 (1f)
lhR RUlhR,t 5
70 (1g)
lhR (RU )2 lhR,t10
70 (1h)
We have obtained estimates OECDL = 0.966 (s.e. = 0.01, t-stat =87.94) and OECD
U = 1.065 (s.e. =
0.02, t-stat = 65.67) for advanced countries, and OECDL = 0.969 (s.e. = 0.01, t-stat =132.78) and
NONOECDU = 1.068 (s.e. = 0.03, t-stat = 38.14) for developing countries. We then apply the
estimated survival ratio to adjust the backward or forward estimate for mortality rate differences
between less-educated and more-educated individuals (see Notes Table 1).
B. If two or more benchmark figures are available from both earlier and later periods, a
weighted average of backward and forward estimates is used as the benchmark. We derive the
weights for combing the backward and forward estimates for OECD countries and for non-
OECD countries, for each education category, by estimating the following system of
simultaneous equations through a weighted least squares estimation procedure. The estimation
uses the sample of available actual censuses.
hRa R11hR,t 5
a R21hR,t5a , where R11 R21 1 (2a)
hRa R12hR,t 5
a R22hR,t10a , where R12 R22 1 and (2b)
R12 (R11) / (1 R11 R112 )
hRa R13hR,t 10
a R23hR,t5a
, where R13 R23 1 and (2c)
25
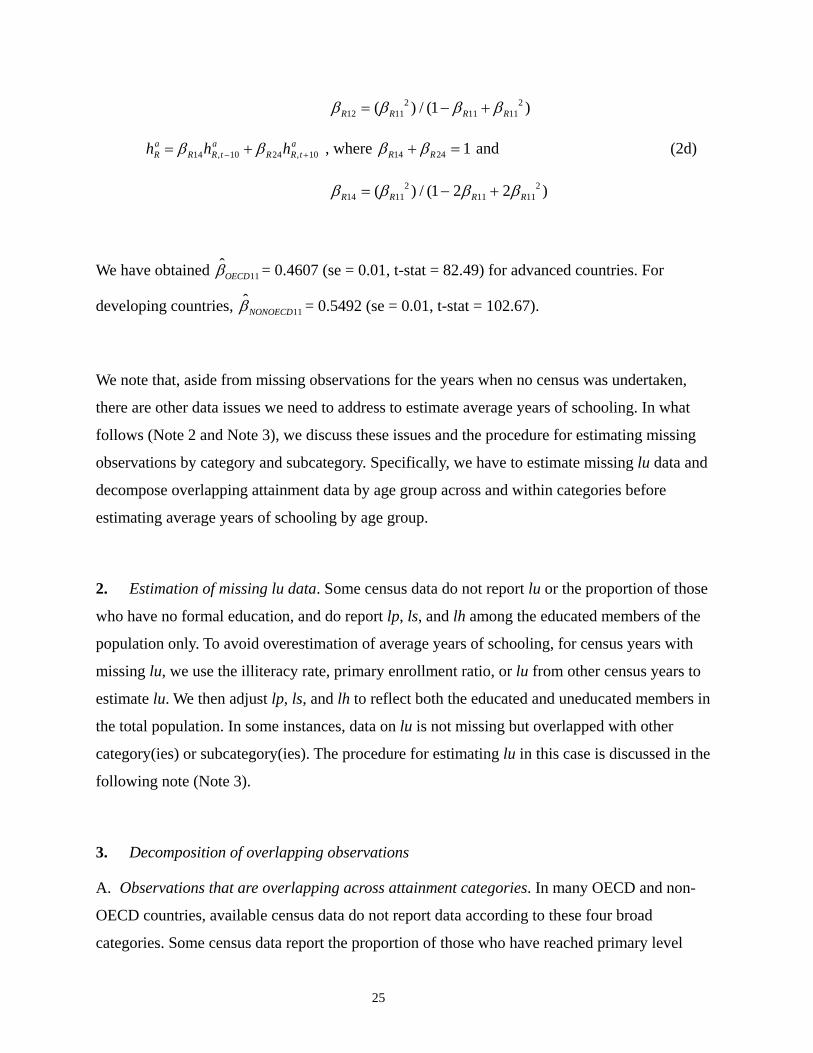
R12 (R112 ) / (1 R11 R11
2 )
hRa R14hR,t 10
a R24hR,t10a , where R14 R24 1 and (2d)
R14 (R112 ) / (1 2R11 2R11
2 )
We have obtained OECD11 = 0.4607 (se = 0.01, t-stat = 82.49) for advanced countries. For
developing countries, NONOECD11 = 0.5492 (se = 0.01, t-stat = 102.67).
We note that, aside from missing observations for the years when no census was undertaken,
there are other data issues we need to address to estimate average years of schooling. In what
follows (Note 2 and Note 3), we discuss these issues and the procedure for estimating missing
observations by category and subcategory. Specifically, we have to estimate missing lu data and
decompose overlapping attainment data by age group across and within categories before
estimating average years of schooling by age group.
2. Estimation of missing lu data. Some census data do not report lu or the proportion of those
who have no formal education, and do report lp, ls, and lh among the educated members of the
population only. To avoid overestimation of average years of schooling, for census years with
missing lu, we use the illiteracy rate, primary enrollment ratio, or lu from other census years to
estimate lu. We then adjust lp, ls, and lh to reflect both the educated and uneducated members in
the total population. In some instances, data on lu is not missing but overlapped with other
category(ies) or subcategory(ies). The procedure for estimating lu in this case is discussed in the
following note (Note 3).
3. Decomposition of overlapping observations
A. Observations that are overlapping across attainment categories. In many OECD and non-
OECD countries, available census data do not report data according to these four broad
categories. Some census data report the proportion of those who have reached primary level

26
together with those who have no formal education (lulp). A number of countries also report the
combined proportion of those who have reached secondary schooling or less (lulpls). Also, some
census data report lpls or the combination of those who have reached primary or secondary
levels.
To decompose these overlapping census observations we use enrollment data. Specifically, for
census years where lu is combined with other category(ies) or subcategory(ies) (i.e., lulp, lulpi,
lulplsi, lulpls), we use adjusted primary and/or secondary enrollment ratio by age group from
earlier or later years and the age distribution profile to decompose the overlapping observations.
The adjusted enrollment ratio is the gross enrollment ratio minus the proportion of repeaters. The
age distribution profile is the relative population distribution by age group within an educational
attainment at a specific time period. If the gross enrolment ratio is not available, the net
enrolment ratio is used as a proxy for the adjusted enrollment ratio.
B. Observations that are overlapping within an attainment category. For more accurate
estimates of average years of schooling, we also estimate distribution in each of the three broad
educated categories (i.e., lp, ls, lh) if distribution data by subcategory (i.e., lpi, lsi, lhi) is missing.
Specifically, we estimate and use available data on completion ratios to decompose overlapping
observations within each category to sub-categories (i.e. hjc,ta hj ,t
a cj ,ta and hji,t
a hj ,ta hjc,t
a ). For
countries with complete and available completion ratio data (i.e., for all age groups at either the
primary, secondary, or tertiary level) for at least one year, we use a backward or forward
estimation procedure to estimate the completion ratio for earlier and later years, respectively. The
following describes the procedure for estimating missing data on the completion ratio in more
detail.
i. Estimating the primary and secondary completion ratio. Table 3 below presents the rules
for extrapolating from earlier or later years through a backward or forward extrapolation
procedure for missing primary and secondary completion ratio data.
If available, we use country-specific completion ratio data to perform either or both backward or
forward extrapolation of missing completion ratio data. Otherwise, we use income/regional
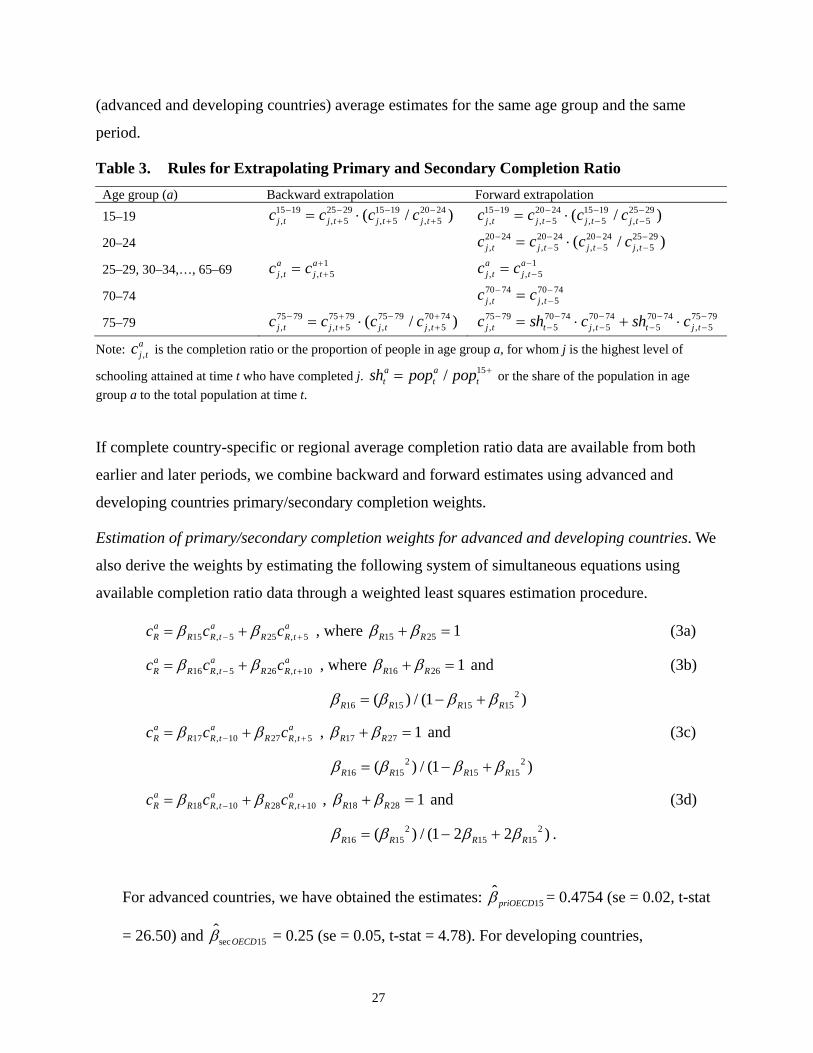
27
(advanced and developing countries) average estimates for the same age group and the same
period.
Table 3. Rules for Extrapolating Primary and Secondary Completion Ratio
Age group (a) Backward extrapolation Forward extrapolation
15–19 cj ,t1519 cj ,t5
2529 (cj ,t51519 / cj ,t5
2024 ) cj ,t1519 cj ,t5
2024 (cj ,t51519 / cj ,t5
2529 )
20–24
cj ,ta cj ,t5
a1
cj ,t2024 cj ,t5
2024 (cj ,t52024 / cj ,t5
2529 )
25–29, 30–34,…, 65–69 cj ,ta cj ,t5
a1
70–74 cj ,t7074 cj ,t5
7074
75–79 cj ,t7579 cj ,t5
7579 (cj ,t7579 / cj ,t5
7074 ) cj ,t7579 sht5
7074 cj ,t57074 sht5
7074 cj ,t57579
Note: cj ,ta is the completion ratio or the proportion of people in age group a, for whom j is the highest level of
schooling attained at time t who have completed j. shta popt
a / popt15 or the share of the population in age
group a to the total population at time t.
If complete country-specific or regional average completion ratio data are available from both
earlier and later periods, we combine backward and forward estimates using advanced and
developing countries primary/secondary completion weights.
Estimation of primary/secondary completion weights for advanced and developing countries. We
also derive the weights by estimating the following system of simultaneous equations using
available completion ratio data through a weighted least squares estimation procedure.
cRa R15cR,t 5
a R25cR,t 5a , where R15 R25 1 (3a)
cRa R16cR,t5
a R26cR,t10a , where R16 R26 1 and (3b)
R16 (R15 ) / (1 R15 R152 )
cRa R17cR,t10
a R27cR,t5a , R17 R27 1 and (3c)
R16 (R152 ) / (1 R15 R15
2 )
cRa R18cR,t 10
a R28cR,t 10a , R18 R28 1 and (3d)
R16 (R152 ) / (1 2R15 2R15
2 ) .
For advanced countries, we have obtained the estimates: priOECD15 = 0.4754 (se = 0.02, t-stat
= 26.50) and sec OECD15 = 0.25 (se = 0.05, t-stat = 4.78). For developing countries,
28
priNONOECD15 = 0.3077 (se = 0.04, t-stat = 8.45) and sec NONOECD15 = 0.5929 (se = 0.03, t-stat =
20.69).
Aged 15–19 and 20–24. As with attainment data, we cannot directly estimate the completion
ratio for those aged 15–19 and 20–24. We assume that the distribution of completion
between two age groups will be stable across time. Hence, as shown in the table below, to
estimate the completion ratio for 15–19 year olds through forward estimation, we use the
completion ratio for the older age group from a later period as the benchmark figure and
adjust this by multiplying with the ratio between the completion ratio among 15–19 year olds
and the completion ratio among 20–25 year olds during the benchmark period. For 20-24
year olds, we use the completion ratio for the same age group from the earlier period and
adjust it by the ratio between the completion ratio of 20–24 and 25–29 year olds.
When using backward estimation, we use the completion ratio among 25–29 year olds from
the earlier period as benchmark to estimate the completion ratio for both 15–19 and 20–24
age groups. We adjust the benchmark value by multiply it with the ratio of the completion
ratio between the corresponding age group (15–19 or 20–24 year olds) and 25–29 year olds
during the benchmark period.
Aged 70 and over. For 70–74 year olds, we use the completion ratio for the same age group
from the previous period as benchmark. For 75 years and above, we use the population
weighted average of the completion ratios for 70–74 year olds and 75 and above during the
reference period.
Since direct backward estimation is not applicable for individuals aged 75 years and above,
when using backward estimation we use the completion ratio of the same age group and
adjust it by the ratio of completion ratio among 75–79 year olds during the benchmark
period to that of 70–74 year olds.
ii. Estimating tertiary completion ratio. Since tertiary data is not reported by subcategory for
most countries, we use available tertiary completion ratio data reported by the UN Demographic
29
Yearbook (various years) and Kaneko (1986) to derive country-specific and income/region
(advanced and developing countries) tertiary completion ratio estimates by age group. Again, we
use a backward and forward estimation procedure to estimate completion ratio for years with
missing information.
For time periods with no available tertiary completion ratio estimate, we again estimate missing
values through a backward or forward estimation procedure, as discussed above. We also use a
combination of backward and forward estimates and apply the appropriate tertiary completion
ratio weight (estimation described below)
Aged 15–19 and 20–24. We assume that tertiary completion is relatively stable for the two
younger age groups. Hence, when using either a backward or forward estimation procedure to
estimate missing tertiary completion ratio for the 15–19 and 20–24 age groups, we use an
unadjusted tertiary completion ratio for the same age group in the benchmark year (see table
below).
Aged 25–29. When using forward estimation for ages 25–29, we multiply the completion ratio
for the same age group with the ratio of completion ratio between 25–29 and 30–34 in the
benchmark period.
Aged 75 and above. When estimating tertiary completion ratio for individuals 75 years and above
through backward estimation, we also use the tertiary ratio for the same age group in the next
period as the benchmark figure and adjust it by the ratio of the tertiary completion ratio between
75–79 to 70–74 in the same benchmark figure. When estimating through forward estimation, we
use both the population weighted average of the tertiary completion ratio of 70–74 and 75 and
above during the benchmark period.
Tertiary completion weights for advanced and developing countries. If both backward and
forward estimates are available, we again combine backward and forward estimates using
tertiary completion weights for advanced and developing countries. We also estimate these
weights as in primary and secondary completion weights discussed in Note 2.B.i.
We have obtained estimates, terOECD15 = 0.5111 (se = 0.03, t-stat = 18.88) for advanced countries
and terNONOECD15 = 0.4680 (se = 0.06, t-stat = 8.32) for developing countries.

30
Table 4. Rules for Extrapolating Tertiary Ratio
Age group (a) Backward extrapolation Forward extrapolation
15–19, 20–24 cj ,ta cj ,t5
a cj ,ta cj ,t5
a
25–29
cj ,ta cj ,t5
a1
cj ,t2529 cj ,t5
2529 (cj ,t52529 / cj ,t5
3034 )
30–34, 35-39,…, 65–69 cj ,t
a cj ,t5a1
70–74
75–79 cj ,t7579 cj ,t5
7574 (cj ,t7579 / cj ,t5
7574 ) cj ,t7579 sht5
7074 cj ,t57074 sht5
7074 cj ,t57579
Note: cj ,ta is the completion ratio or the proportion of persons in age group a, for whom j is the highest level of
schooling attained at time t who have completed j. shta popt
a / popt15 or the share of the population in age
group a to the total population at time t.

31
Table 1. Breakdown of Number of Countries by Number of Census-Survey Observations
Number of observations
Number of countries All Advanced Developing
(1950–2005) MF F MF F MF F
1 54 53 1 1 53 52 2 43 47 1 1 42 46 3 32 29 3 3 29 26 4 22 26 4 4 18 22 5 29 26 8 8 21 18 6 11 8 2 2 9 6 7 3 4 1 2 2 2 8 5 4 4 3 1 1 9 0 0 0 0 0 0
10 1 1 0 0 1 1
Total 200 198 24 24 176 174 Note: The data refer to census-survey observations for educational attainment for the total (MF) and female (F) populations in each age category. Table 2. Breakdown of Number of Countries by Number of Census-survey Year Census-survey year (to
the nearest 5-year value)
Number of countries All Advanced Developing
MF F MF F MF F
1950 25 25 8 8 17 17 1955 14 13 1 1 13 12 1960 64 64 15 15 49 49 1965 30 29 4 4 26 25 1970 85 81 17 17 68 64 1975 43 42 7 7 36 35 1980 90 87 18 18 72 69 1985 26 24 5 5 21 19 1990 91 88 14 13 77 75 1995 26 24 4 4 22 20 2000 68 68 11 11 57 57 2005 37 37 15 15 22 22
Total 599 582 119 118 480 464
Note: The data refer to census-survey observations for educational attainment for the total (MF) and female (F) populations in each age category.

32
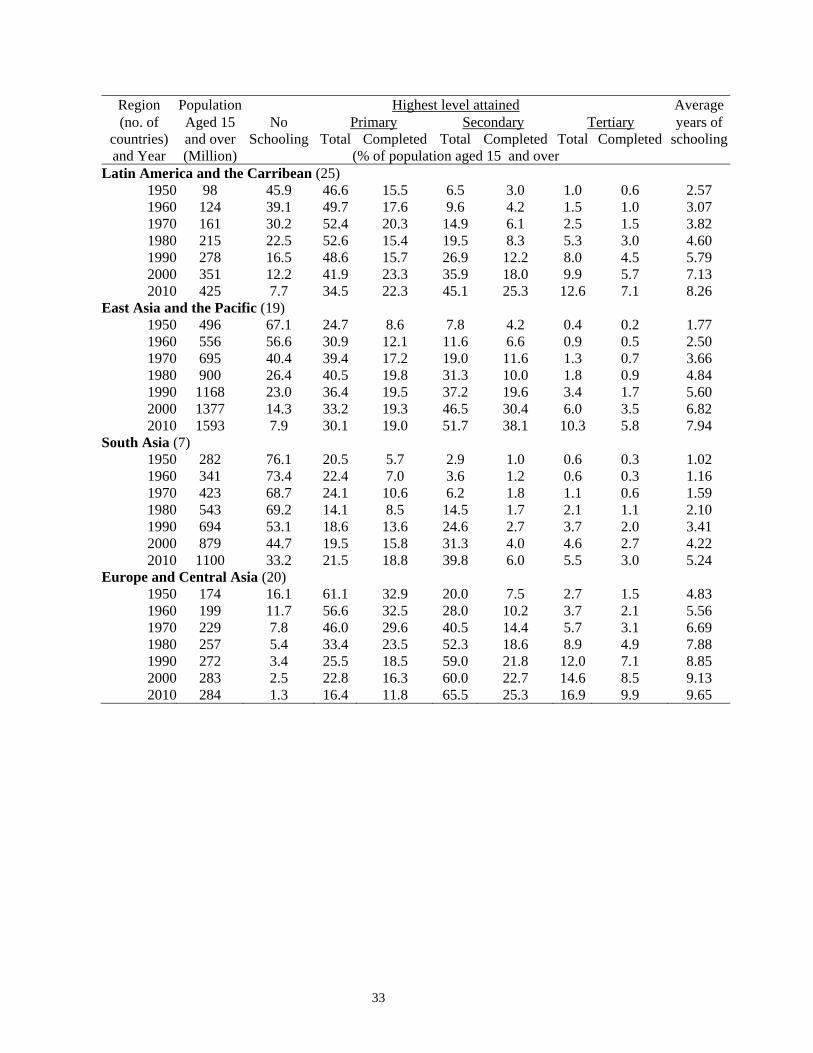
Table 3. Trends of Educational Attainment of the Total Population Aged 15 and Over by Region
Region Population Highest level attained Average(no. of Aged 15 No Primary Secondary Tertiary years of
countries) and over Schooling Total Completed Total Completed Total Completed schoolingand Year (Million) (% of population aged 15 and over
World (146)
1950 1588 47.2 38.1 18.8 12.5 6.0 2.2 1.1 3.17 1960 1831 42.5 38.4 19.1 16.3 8.1 2.7 1.4 3.65 1970 2221 35.6 38.1 20.2 22.4 11.4 3.9 2.0 4.45 1980 2761 30.6 33.0 17.8 30.5 12.4 6.0 3.1 5.29 1990 3413 25.5 30.5 17.5 35.6 16.1 8.3 4.4 6.09 2000 4064 20.1 27.5 17.5 41.8 21.5 10.6 5.9 6.98 2010 4759 14.8 25.2 17.6 48.0 26.1 11.9 6.7 7.76
Advanced (24) 1950 428 9.2 60.1 38.1 25.0 12.7 5.7 2.8 6.22 1960 476 7.8 54.1 34.5 31.1 16.8 6.9 3.5 6.81 1970 541 6.2 45.3 31.7 38.6 21.8 9.9 5.1 7.74 1980 614 5.5 34.2 24.6 44.4 26.7 16.0 8.3 8.82 1990 683 5.5 27.0 19.7 44.9 25.9 22.6 11.6 9.56 2000 746 3.4 19.1 14.8 49.5 31.7 28.0 15.4 10.65 2010 805 2.3 14.2 11.5 57.9 37.7 25.6 14.5 11.03
Developing (122) 1950 1160 61.2 30.0 11.7 7.9 3.5 0.9 0.5 2.05 1960 1355 54.7 32.9 13.7 11.1 5.1 1.3 0.7 2.55 1970 1681 45.1 35.8 16.4 17.2 8.1 1.9 1.0 3.39 1980 2146 37.7 32.7 15.9 26.5 8.3 3.1 1.6 4.28 1990 2730 30.5 31.4 16.9 33.3 13.6 4.8 2.6 5.22 2000 3318 23.9 29.4 18.2 40.1 19.2 6.6 3.8 6.15 2010 3954 17.4 27.4 18.8 46.0 23.7 9.2 5.1 7.09
By Region
Middle East and North Africa (18) 1950 48 88.1 8.5 3.5 2.6 1.1 0.9 0.5 0.76 1960 58 84.3 10.2 4.4 4.2 1.8 1.2 0.7 1.07 1970 75 75.6 14.1 6.1 8.4 3.8 2.0 1.0 1.78 1980 102 61.6 19.0 8.3 15.9 8.2 3.5 1.8 3.04 1990 142 45.2 24.1 11.3 25.6 14.5 5.1 2.8 4.58 2000 196 32.9 26.4 12.8 32.8 19.6 7.9 4.4 5.90 2010 256 24.5 24.4 14.8 39.6 23.3 11.6 6.0 7.12
Sub-Saharan Africa (33) 1950 61 77.1 17.7 5.0 4.6 1.2 0.6 0.1 1.28 1960 76 72.3 22.1 6.5 5.0 1.3 0.7 0.2 1.52 1970 97 64.6 26.5 6.9 8.1 2.2 0.8 0.2 2.02 1980 129 55.2 32.1 11.0 12.0 3.8 0.8 0.3 2.76 1990 175 43.6 36.4 17.1 18.4 6.2 1.5 0.5 3.93 2000 233 38.4 35.9 19.3 23.5 7.3 2.2 0.7 4.62 2010 295 32.6 37.9 23.5 26.9 8.6 2.5 0.9 5.23
33
Region Population Highest level attained Average(no. of Aged 15 No Primary Secondary Tertiary years of
countries) and over Schooling Total Completed Total Completed Total Completed schoolingand Year (Million) (% of population aged 15 and over
Latin America and the Carribean (25) 1950 98 45.9 46.6 15.5 6.5 3.0 1.0 0.6 2.57 1960 124 39.1 49.7 17.6 9.6 4.2 1.5 1.0 3.07 1970 161 30.2 52.4 20.3 14.9 6.1 2.5 1.5 3.82 1980 215 22.5 52.6 15.4 19.5 8.3 5.3 3.0 4.60 1990 278 16.5 48.6 15.7 26.9 12.2 8.0 4.5 5.79 2000 351 12.2 41.9 23.3 35.9 18.0 9.9 5.7 7.13 2010 425 7.7 34.5 22.3 45.1 25.3 12.6 7.1 8.26
East Asia and the Pacific (19) 1950 496 67.1 24.7 8.6 7.8 4.2 0.4 0.2 1.77 1960 556 56.6 30.9 12.1 11.6 6.6 0.9 0.5 2.50 1970 695 40.4 39.4 17.2 19.0 11.6 1.3 0.7 3.66 1980 900 26.4 40.5 19.8 31.3 10.0 1.8 0.9 4.84 1990 1168 23.0 36.4 19.5 37.2 19.6 3.4 1.7 5.60 2000 1377 14.3 33.2 19.3 46.5 30.4 6.0 3.5 6.82 2010 1593 7.9 30.1 19.0 51.7 38.1 10.3 5.8 7.94
South Asia (7) 1950 282 76.1 20.5 5.7 2.9 1.0 0.6 0.3 1.02 1960 341 73.4 22.4 7.0 3.6 1.2 0.6 0.3 1.16 1970 423 68.7 24.1 10.6 6.2 1.8 1.1 0.6 1.59 1980 543 69.2 14.1 8.5 14.5 1.7 2.1 1.1 2.10 1990 694 53.1 18.6 13.6 24.6 2.7 3.7 2.0 3.41 2000 879 44.7 19.5 15.8 31.3 4.0 4.6 2.7 4.22 2010 1100 33.2 21.5 18.8 39.8 6.0 5.5 3.0 5.24
Europe and Central Asia (20) 1950 174 16.1 61.1 32.9 20.0 7.5 2.7 1.5 4.83 1960 199 11.7 56.6 32.5 28.0 10.2 3.7 2.1 5.56 1970 229 7.8 46.0 29.6 40.5 14.4 5.7 3.1 6.69 1980 257 5.4 33.4 23.5 52.3 18.6 8.9 4.9 7.88 1990 272 3.4 25.5 18.5 59.0 21.8 12.0 7.1 8.85 2000 283 2.5 22.8 16.3 60.0 22.7 14.6 8.5 9.13 2010 284 1.3 16.4 11.8 65.5 25.3 16.9 9.9 9.65
34
Table 4. Educational Attainment by Sex, 1950–2010 Region Average years of schooling Gender Ratio (no. of countries) (population 15 age and over) and Year Females (A) Males (B) (A/B, %) World (146)
1950 2.68 3.67 73.1 1960 3.12 4.20 74.2 1970 3.86 5.04 76.7 1980 4.70 5.88 80.0 1990 5.58 6.60 84.5 2000 6.47 7.47 86.7 2010 7.28 8.21 88.6
Advanced (24) 1950 5.89 6.58 89.5 1960 6.44 7.21 89.4 1970 7.38 8.14 90.7 1980 8.42 9.25 91.0 1990 9.29 9.85 94.4 2000 10.39 10.92 95.1 2010 10.90 11.16 97.7
Developing (122) 1950 1.50 2.60 57.7 1960 1.95 3.14 62.0 1970 2.73 4.04 67.6 1980 3.63 4.91 74.0 1990 4.65 5.78 80.3 2000 5.59 6.69 83.6 2010 6.54 7.62 85.9
By Region Middle East and North Africa (18)
1950 0.44 1.07 41.3 1960 0.63 1.51 41.5 1970 1.10 2.47 44.5 1980 2.08 3.97 52.5 1990 3.53 5.58 63.1 2000 5.03 6.75 74.5 2010 6.41 7.83 81.8
Sub-Saharan Africa (33) 1950 1.03 1.55 66.7 1960 1.12 1.93 58.1 1970 1.52 2.55 59.5 1980 2.08 3.47 59.9 1990 3.17 4.71 67.3 2000 3.97 5.30 74.9 2010 4.63 5.83 79.4
Latin America and the Carribean (25) 1950 2.38 2.77 85.8 1960 2.85 3.29 86.7 1970 3.56 4.09 87.0 1980 4.39 4.82 91.1 1990 5.69 5.90 96.5 2000 7.06 7.21 97.9 2010 8.21 8.32 98.7
35
Region Average years of schooling Gender Ratio (no. of countries) (population 15 age and over) and Year Females (A) Males (B) (A/B, %) East Asia and the Pacific (19)
1950 1.12 2.40 46.8 1960 1.72 3.24 53.0 1970 2.86 4.42 64.7 1980 4.11 5.54 74.1 1990 5.26 5.92 88.9 2000 6.21 7.41 83.8 2010 7.47 8.39 88.9
South Asia (7) 1950 0.41 1.57 26.0 1960 0.52 1.75 29.8 1970 0.87 2.27 38.1 1980 1.41 2.75 51.4 1990 2.26 4.48 50.5 2000 3.40 4.99 68.3 2010 4.25 6.20 68.6
Europe and Central Asia (20) 1950 4.31 5.53 77.9 1960 5.16 6.06 85.1 1970 6.23 7.25 85.9 1980 7.42 8.41 88.2 1990 8.55 9.20 92.9 2000 9.30 8.93 104.1 2010 9.89 9.36 105.7

36
Table 5. Comparison of Average Years of Schooling (Over Age 15 and 25) Between Series A. Barro-Lee 2010 and Obs Correlation Barro-Lee 2010 Barro-Lee 2001 Barro-Lee 2001 1960 2000 1960 2000 World
Levels 984 0.96 4.00 6.98 4.30 6.58 2.57 2.73 2.54 2.79 10-year difference 746 0.97 5.93 5.97 2.72 2.77
Advanced countries Levels 201 0.92 7.03 10.65 6.96 9.77 2.21 1.55 2.27 1.85 10-year difference 155 0.92 9.55 9.21 1.78 1.99
Developing countries Levels 783 0.95 2.46 6.10 2.96 5.82 2.02 2.52 1.99 2.43 10-year difference 591 0.96 5.06 5.19
2.46 2.40 B. Barro-Lee 2010 and Obs Correlation Barro-Lee 2010 Cohen-Soto (2007) Cohen-Soto (2007) 1960 2010 1960 2010 World
Levels 540 0.94 3.54 7.78 4.03 7.40 2.56 2.71 2.85 3.05 10-year difference 450 0.95 6.86 6.71 2.78 3.06
Advanced countries Levels 132 0.83 6.81 11.03 8.14 11.66 2.23 1.37 2.10 1.77 10-year difference 110 0.82 10.66 11.15 1.59 1.86
Developing countries Levels 408 0.95 2.10 7.00 2.23 6.37 1.76 2.50 1.91 2.53 10-year difference 340 0.95 5.94 5.63
2.48 2.46 Obs = overlapping observations Notes: Figures presented in this table represent overlapping observations only. The new Barro-Lee data set consists of a total of 1,898 observations on average years of schooling at 5-year intervals for 146 countries (1950–2010); Barro-Lee data set (2001): 930 observations for 107 countries (1960-2000); Cohen-Soto (2007): 570 observations at 10-year intervals for 95 countries (1960–2010). Of these 95 countries, 5 countries are not in Barro-Lee (2010). Numbers in italics are standard deviations. Source: Authors’ calculations based on Barro-Lee (2001), Cohen-Soto (2007) data sets and own data.

37
Table 6. OLS and IV Regression Results for Log Output per Worker A. Rate-of-return to Schooling: Total Population, 15 years and above ln(Real GDP per worker) OLS IV Random Fixed Random Fixed (1) (2) (3) (4) ln(capital stock per worker) 0.652 0.650 0.580 0.544 [27.3]*** [20.1]*** [18.3]*** [12.3]*** Ave. years of schooling 0.017 0.019 0.055 0.121 [1.77]* [1.74]* [3.26]*** [3.16]*** Observations 962 962 962 962 Number of countries 127 127 127 127 R-squared 0.87 0.61 0.86 0.55
B. Rate-of-return to Schooling by Region (5) (6) (7) (8) ln(capital stock per worker) 0.625 0.596 0.560 0.492 [23.0]*** [15.1]*** [16.4]*** [8.55]*** Ave. years of schooling
North Africa and Middle East 0.008 -0.001 0.057 0.078 [0.57] [0.04] [2.91]*** [2.43]** Sub-Saharan Africa 0.006 0.004 0.038 0.066 [0.51] [0.27] [1.76]* [1.78]* Latin America 0.000 -0.001 0.034 0.065 [0.02] [0.05] [1.81]* [1.82]* East Asia 0.032 0.052 0.052 0.103 [2.52]** [3.91]*** [2.43]** [2.53]** South Asia -0.015 0.001 0.035 0.113 [0.57] [0.05] [1.09] [1.97]** Europe and Central Asia -0.012 0.008 0.015 0.085 [0.94] [0.38] [0.75] [1.56] Advanced countries 0.031 0.047 0.066 0.133 [3.27]*** [3.90]*** [3.75]*** [3.39]***
Observations 962 962 962 962 Number of countries 127 127 127 127 R-squared 0.87 0.62 0.87 0.58
C. Rate-of-return to Schooling by Educational Attainment (9) (10) (11) (12) ln(capital stock per worker) 0.634 0.613 0.569 0.534 [26.4]*** [18.1]*** [17.8]*** [13.0]*** Ave. years of schooling
Primary -0.042 -0.055 -0.023 -0.045 [3.13]*** [3.19]*** [0.98] [0.83] Secondary 0.063 0.063 0.103 0.100 [3.94]*** [3.66]*** [2.62]*** [2.26]** Tertiary 0.211 0.173 0.268 0.179 [3.54]*** [2.52]** [2.01]** [0.83]
Observations 962 962 962 962 Number of countries 127 127 127 127

38
R-squared 0.88 0.62 0.87 0.62 Notes: Robust t/z statistics in brackets. *significant at 10%; ** significant at 5%; *** significant at 1%. Intercept term, oil exporters dummy and time dummies are included but not reported. Instrument for the average years of schooling (s) is the 10-year lag of s among 40-74 years old (L2.s40-74); For the average years of schooling (s) by region, say region j, the instrument is the 10-year lag of s among 40-74 years old in region j; Instrument for the average years of schooling (s) among those who have reached level k is the 10-year lag of s among 40-74 years old who have reached level k; Instrument for log capital-worker ratio is the 10-year lagged variable.
39
Figure 1. Educational Attainment of the Total Population over Age 15 a. Average years of schooling, by educational level
Note: Advanced countries = Australia, Austria, Belgium, Canada, Denmark, Finland, France, Germany, Greece,Iceland, Ireland, Italy, Japan, Luxembourg, Netherlands, New Zealand, Norway, Portugal, Spain, Sweden,Switzerland, Turkey, USA, United Kingdom.
b. Average years of schooling, by age group
.

40
Figure 2. Proportion of Population (15 Years Old and Above) with No schooling, by Age Group
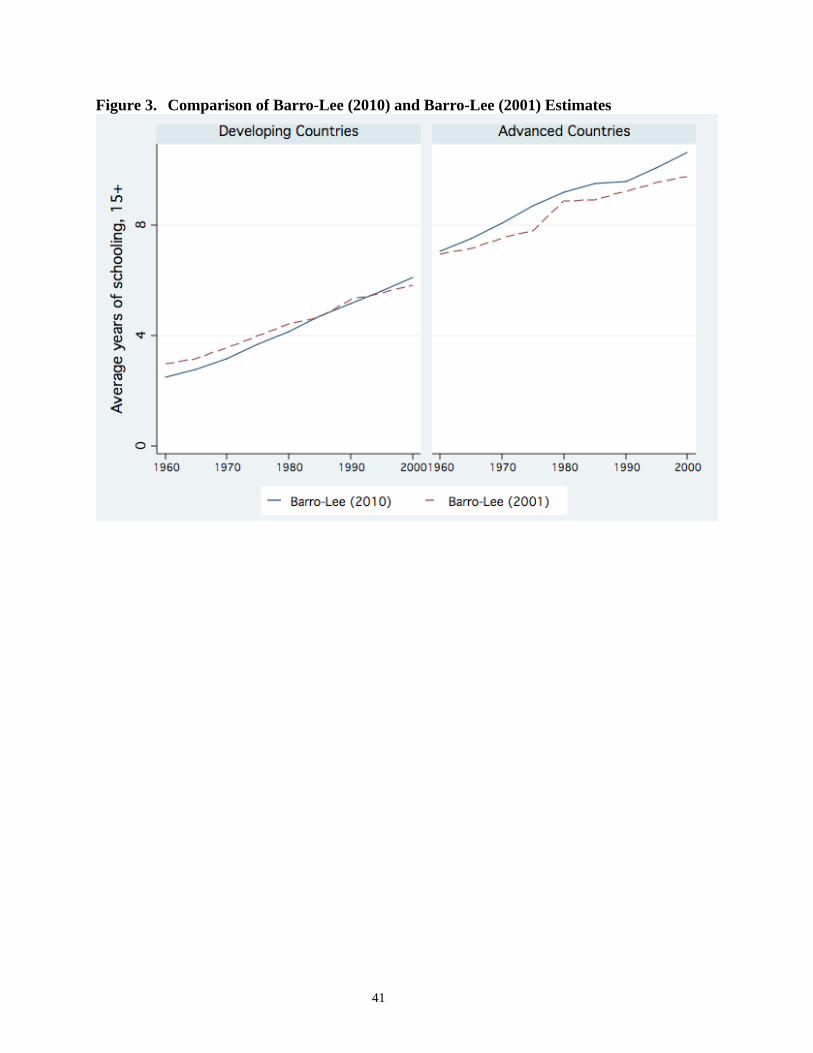
41
Figure 3. Comparison of Barro-Lee (2010) and Barro-Lee (2001) Estimates
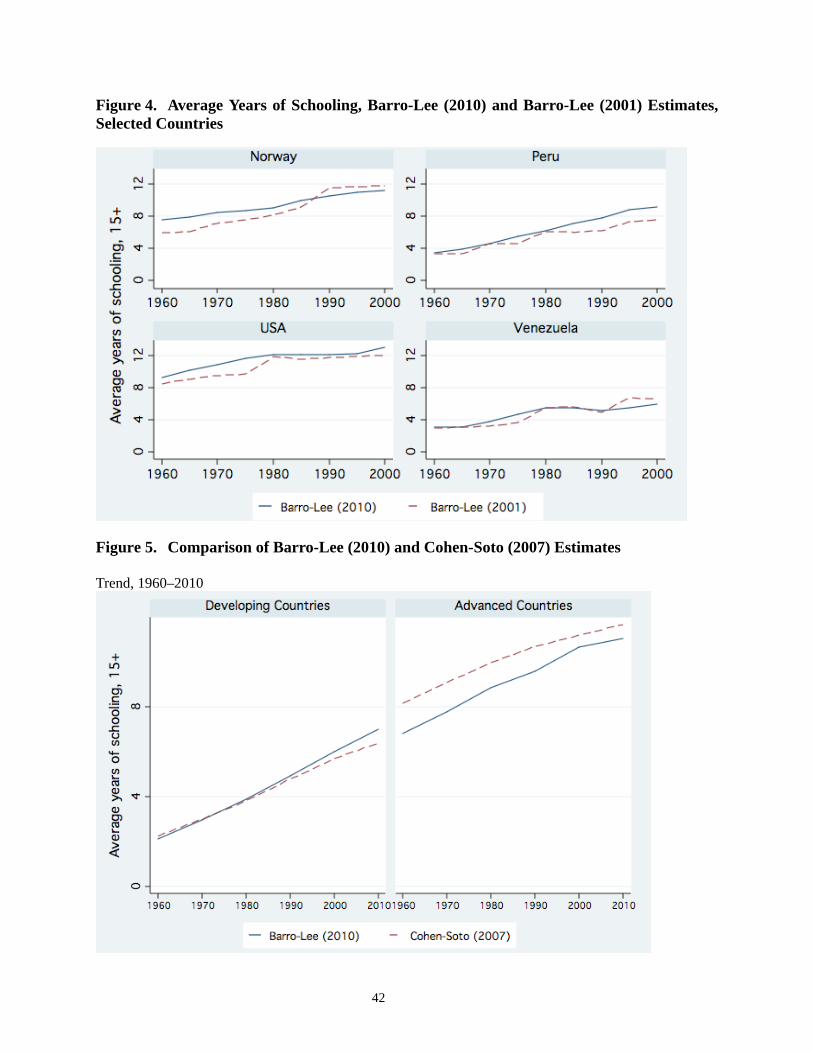
42
Figure 4. Average Years of Schooling, Barro-Lee (2010) and Barro-Lee (2001) Estimates, Selected Countries
Figure 5. Comparison of Barro-Lee (2010) and Cohen-Soto (2007) Estimates Trend, 1960–2010
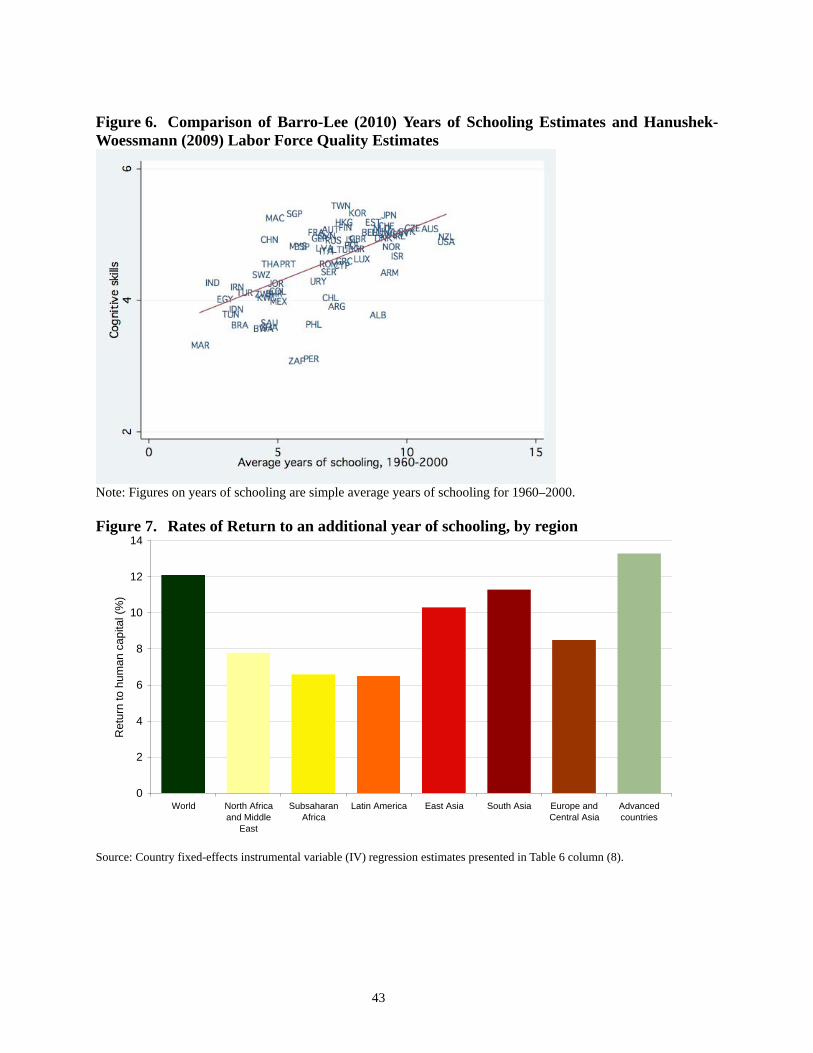
43
Figure 6. Comparison of Barro-Lee (2010) Years of Schooling Estimates and Hanushek-Woessmann (2009) Labor Force Quality Estimates
Note: Figures on years of schooling are simple average years of schooling for 1960–2000. Figure 7. Rates of Return to an additional year of schooling, by region
0
2
4
6
8
10
12
14
World North Africaand Middle
East
SubsaharanAfrica
Latin America East Asia South Asia Europe andCentral Asia
Advancedcountries
Ret
urn
to h
uman
cap
ital (
%)
Source: Country fixed-effects instrumental variable (IV) regression estimates presented in Table 6 column (8).

44
Appendix Table. Availability of Educational Attainment Census/Survey Data by Country Region/Country No. of
censuses Original census year
1950 1955 1960 1965 1970 1975 1980 1985 1990 1995 2000 2005Middle East and North Africa
Algeria 4 1954 1966* 1971 2000Bahrain 4 1965# 1971 1991 2001Cyprus 5 1946# 1960 1992 2001 2005Egypt 2 1976 1986 Iran, Islamic Republic of
3 1956 1966 1996
Iraq 2 1957 1965 Israel 4 1961 1972 1982 2006Jordan 2 1961 1979 Kuwait 6 1970 1975 1980 1985 1995 2006Libyan Arab Jamahiriya 3 1964# 1973 1984 Malta 3 1948 1967 2005Morocco 1 1971 Qatar 2 1986 2004Saudi Arabia 1 2004Syrian Arab Republic 3 1960 1970 2002Tunisia 5 1966 1975 1980 1984 1994 United Arab Emirates 1 1975 Yemen 1 1975# Sub-Saharan Africa Benin 3 1979# 1992* 2000Botswana 4 1964# 1971 1981# 1991 Burundi 1 1990 Cameroon 1 1976 Central Africa 2 1975 1988 Congo 1 1984 Cote d'Ivoire 1 1988 Democratic Republic of the Congo
1 1955
Gabon 1 1993 Gambia 2 1973 1993 Ghana 2 1960# 1970 Kenya 3 1962 1969 1979 Lesotho 2 1966 1976 Liberia 2 1962# 1974# Malawi 4 1966 1977 1987 1998Mali 1 1976 Mauritania 1 1988 Mauritius 6 1952 1962 1972 1983 1990 2000Mozambique 2 1980 1997 Namibia 2 1960 1991 Niger 1 1977 Reunion 2 195#4 1967# Rwanda 1 1978

45
Region/Country No. of censuses
Original census year 1950 1955 1960 1965 1970 1975 1980 1985 1990 1995 2000 2005
Senegal 1 1976 Sierra Leone 1 1963# South Africa 6 1960 1970 1980* 1985 1996 2001Sudan 2 1956 1983 Swaziland 3 1966 1976 1986 Togo 2 1970 1981 Uganda 4 1959# 1969 1991 2002United Republic of Tanzania
1 2000
Zambia 4 1969 1980# 1990 1993# Zimbabwe 2 1992 2002Latin America and the Caribbean
Argentina 6 1947# 1960# 1970 1980# 1991 2001Barbados 3 1970 1980 2000Belize 4 1960 1970 1980 1991 Bolivia 3 1976 1992 2001Brazil 5 1950 1970 1976 1980 2004Chile 6 1952 1960# 1970 1982 1992 2002Colombia 4 1951 1973# 1993 2006Costa Rica 5 1950 1963 1968 1973 2007Cuba 2 1953 1981 Dominican Republic 2 1960# 1970 Ecuador 6 1950 1962 1974 1982 1990 2001El Salvador 5 1950 1961# 1971* 1992 2006Guatemala 5 1950 1964# 1973 1981 2006Guyana 2 1970 1980 Haiti 4 1950 1971 1982 1986* Honduras 3 1961 1974 1983 Jamaica 5 1960 1970 1982 1991 2001Mexico 6 1960# 1970*
# 1980 1990 2000 2006
Nicaragua 2 1950 1971* Panama 6 1950 1960 1970* 1980 1990 2000Paraguay 7 1950 1962# 1972# 1982 1992 2002 2006Peru 4 1961 1972 1981 1993 Trinidad and Tobago 3 1970 1980 1990 Uruguay 5 1963 1975 1985 1996 2006Venezuela 5 1950 1961 1971 1981 1990 East Asia and the Pacific
Brunei Darussalam 3 1960 1971 1981 Cambodia 1 1998China 3 1982 1990* 2000China, Hong Kong SAR 7 1966 1971 1976 1981 1986 1991 2001China, Macau SAR 3 1970 1991# 2006Fiji 4 1965 1976 1986 1996 Indonesia 5 1961 1971 1980 1990 2000#

46
Region/Country No. of censuses
Original census year 1950 1955 1960 1965 1970 1975 1980 1985 1990 1995 2000 2005
Lao, People's Democratic Republic
1 1995
Malaysia 4 1957# 1980* 1991 2000Mongolia 2 1989 2000Myanmar 4 1953# 1973 1983 1991 Papua New Guinea 2 1971 1980 Philippines 8 1948 1956 1960# 1970 1975# 1980# 1990# 2000Republic of Korea 10 1955# 1960 1965 1970 1975 1980 1985 1990 1995 2000Singapore 5 1970 1980 1990 2000# 2006Taiwan 5 1965# 1975 1980* 2001 2005Thailand 4 1960 1970 1980 2000Tonga 2 1986# 1996 Viet Nam 2 1979 1989 South Asia Afghanistan 1 1979 Bangladesh 4 1961# 1974 1981 2001India 4 1961 1971# 1981 1991 Maldives 2 1985 2000Nepal 5 1961 1971 1981* 1991 2001Pakistan 5 1961# 1981 1990 1998 2006Sri Lanka 3 1963 1969 1981 Europe and Central Asia
Albania 1 2001Armenia 1 2001Bulgaria 4 1956 1965 1992 2001Croatia 2 1991 2001Czech Republic 5 1961 1970 1980 1991 2006Estonia 2 1989 2000Hungary 6 1960 1963 1970 1980 1990 2001Kazakhstan 2 1989 1999Kyrgyzstan 1 1999Latvia 2 1989 2000Lithuania 3 1989 2001 2007Republic of Moldova 1 1989 Poland 5 1960 1970 1978 1988 2002Romania 5 1953# 1966 1977* 1992 2002Russian Federation 4 1959 1970 1989 1994 Serbia 5 1953* 1971 1981 1991 2002Slovakia 5 1961 1970 1980 1991 2001Slovenia 4 1953* 1971 1981 2002 Tajikistan 1 1989 Ukraine 2 1970 2001Advanced Countries Australia 3 1966 1971 1981 Austria 5 1961# 1971 1981 1991 2005Belgium 3 1961# 1970 2006Canada 8 1951 1961 1970 1975 1981 1986 1991 2001
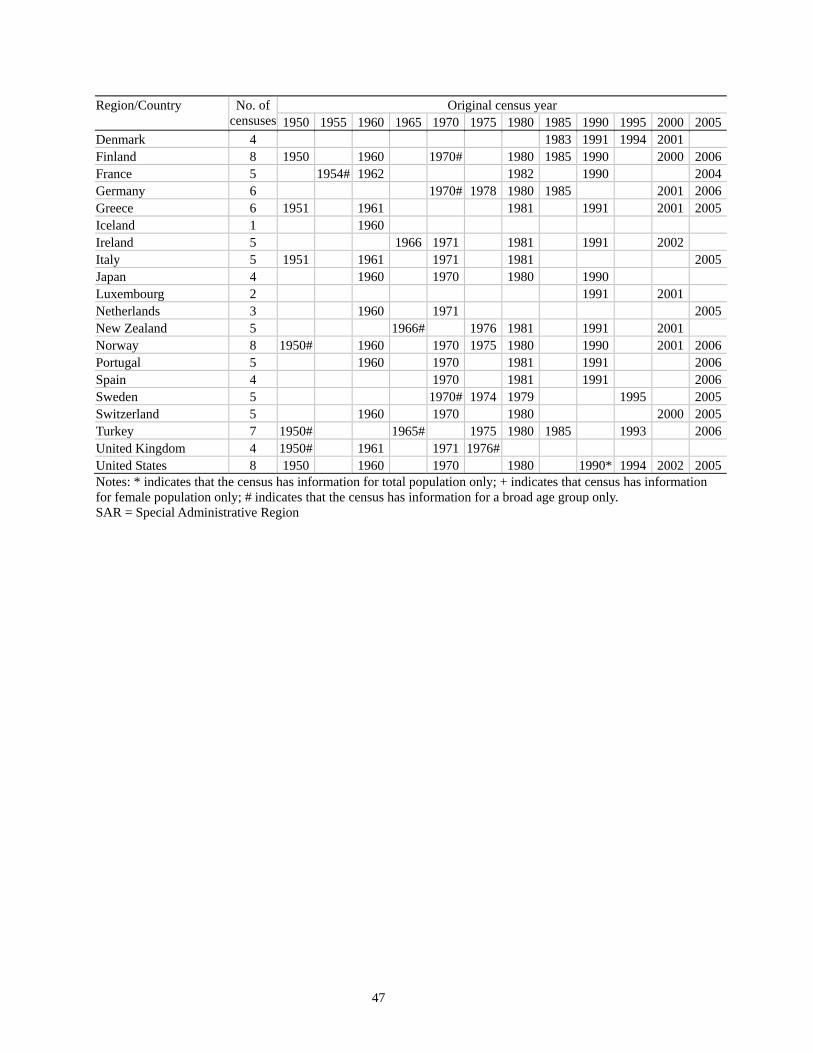
47
Region/Country No. of censuses
Original census year 1950 1955 1960 1965 1970 1975 1980 1985 1990 1995 2000 2005
Denmark 4 1983 1991 1994 2001Finland 8 1950 1960 1970# 1980 1985 1990 2000 2006France 5 1954# 1962 1982 1990 2004Germany 6 1970# 1978 1980 1985 2001 2006Greece 6 1951 1961 1981 1991 2001 2005Iceland 1 1960 Ireland 5 1966 1971 1981 1991 2002Italy 5 1951 1961 1971 1981 2005Japan 4 1960 1970 1980 1990 Luxembourg 2 1991 2001Netherlands 3 1960 1971 2005New Zealand 5 1966# 1976 1981 1991 2001Norway 8 1950# 1960 1970 1975 1980 1990 2001 2006Portugal 5 1960 1970 1981 1991 2006Spain 4 1970 1981 1991 2006Sweden 5 1970# 1974 1979 1995 2005Switzerland 5 1960 1970 1980 2000 2005Turkey 7 1950# 1965# 1975 1980 1985 1993 2006United Kingdom 4 1950# 1961 1971 1976# United States 8 1950 1960 1970 1980 1990* 1994 2002 2005Notes: * indicates that the census has information for total population only; + indicates that census has information for female population only; # indicates that the census has information for a broad age group only. SAR = Special Administrative Region