Embed Size (px)
Citation preview
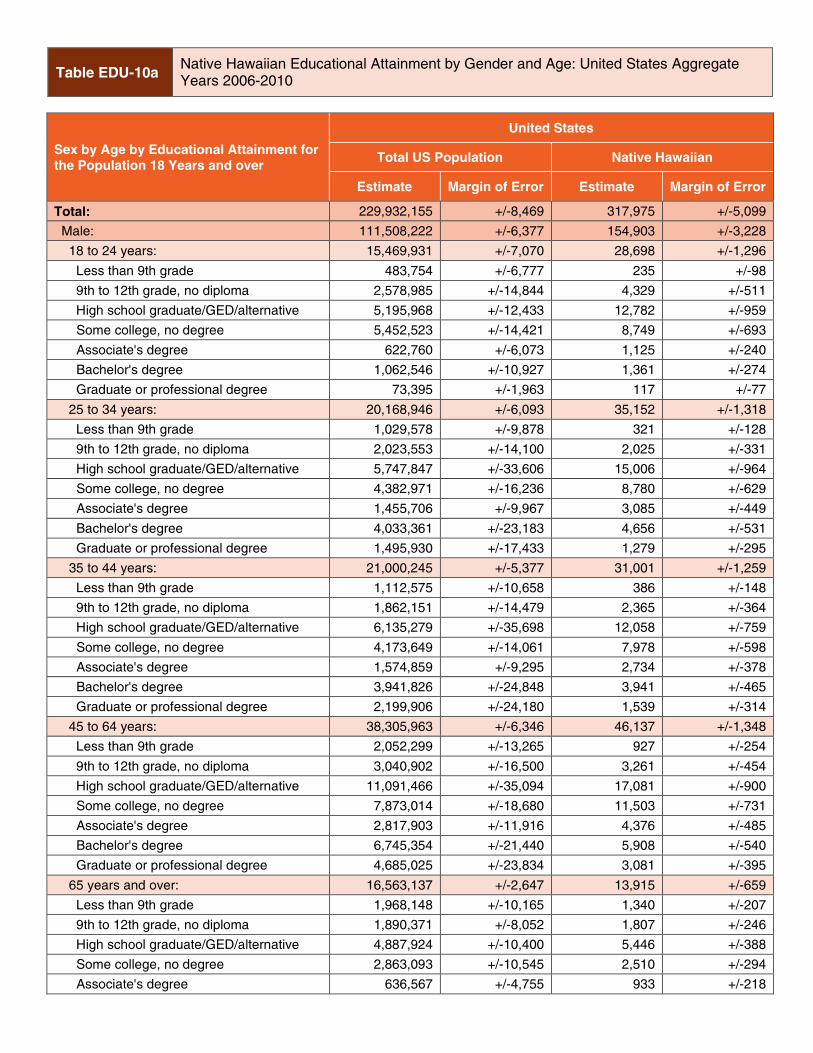
Table EDU-10a Native Hawaiian Educational Attainment by Gender and Age: United States Aggregate Years 2006-2010
Sex by Age by Educational Attainment for
the Population 18 Years and over
United States
Total US Population Native Hawaiian
Estimate Margin of Error Estimate Margin of Error
Total: 229,932,155 +/-8,469 317,975 +/-5,099
Male: 111,508,222 +/-6,377 154,903 +/-3,228
18 to 24 years: 15,469,931 +/-7,070 28,698 +/-1,296
Less than 9th grade 483,754 +/-6,777 235 +/-98
9th to 12th grade, no diploma 2,578,985 +/-14,844 4,329 +/-511
High school graduate/GED/alternative 5,195,968 +/-12,433 12,782 +/-959
Some college, no degree 5,452,523 +/-14,421 8,749 +/-693
Associate's degree 622,760 +/-6,073 1,125 +/-240
Bachelor's degree 1,062,546 +/-10,927 1,361 +/-274
Graduate or professional degree 73,395 +/-1,963 117 +/-77
25 to 34 years: 20,168,946 +/-6,093 35,152 +/-1,318
Less than 9th grade 1,029,578 +/-9,878 321 +/-128
9th to 12th grade, no diploma 2,023,553 +/-14,100 2,025 +/-331
High school graduate/GED/alternative 5,747,847 +/-33,606 15,006 +/-964
Some college, no degree 4,382,971 +/-16,236 8,780 +/-629
Associate's degree 1,455,706 +/-9,967 3,085 +/-449
Bachelor's degree 4,033,361 +/-23,183 4,656 +/-531
Graduate or professional degree 1,495,930 +/-17,433 1,279 +/-295
35 to 44 years: 21,000,245 +/-5,377 31,001 +/-1,259
Less than 9th grade 1,112,575 +/-10,658 386 +/-148
9th to 12th grade, no diploma 1,862,151 +/-14,479 2,365 +/-364
High school graduate/GED/alternative 6,135,279 +/-35,698 12,058 +/-759
Some college, no degree 4,173,649 +/-14,061 7,978 +/-598
Associate's degree 1,574,859 +/-9,295 2,734 +/-378
Bachelor's degree 3,941,826 +/-24,848 3,941 +/-465
Graduate or professional degree 2,199,906 +/-24,180 1,539 +/-314
45 to 64 years: 38,305,963 +/-6,346 46,137 +/-1,348
Less than 9th grade 2,052,299 +/-13,265 927 +/-254
9th to 12th grade, no diploma 3,040,902 +/-16,500 3,261 +/-454
High school graduate/GED/alternative 11,091,466 +/-35,094 17,081 +/-900
Some college, no degree 7,873,014 +/-18,680 11,503 +/-731
Associate's degree 2,817,903 +/-11,916 4,376 +/-485
Bachelor's degree 6,745,354 +/-21,440 5,908 +/-540
Graduate or professional degree 4,685,025 +/-23,834 3,081 +/-395
65 years and over: 16,563,137 +/-2,647 13,915 +/-659
Less than 9th grade 1,968,148 +/-10,165 1,340 +/-207
9th to 12th grade, no diploma 1,890,371 +/-8,052 1,807 +/-246
High school graduate/GED/alternative 4,887,924 +/-10,400 5,446 +/-388
Some college, no degree 2,863,093 +/-10,545 2,510 +/-294
Associate's degree 636,567 +/-4,755 933 +/-218
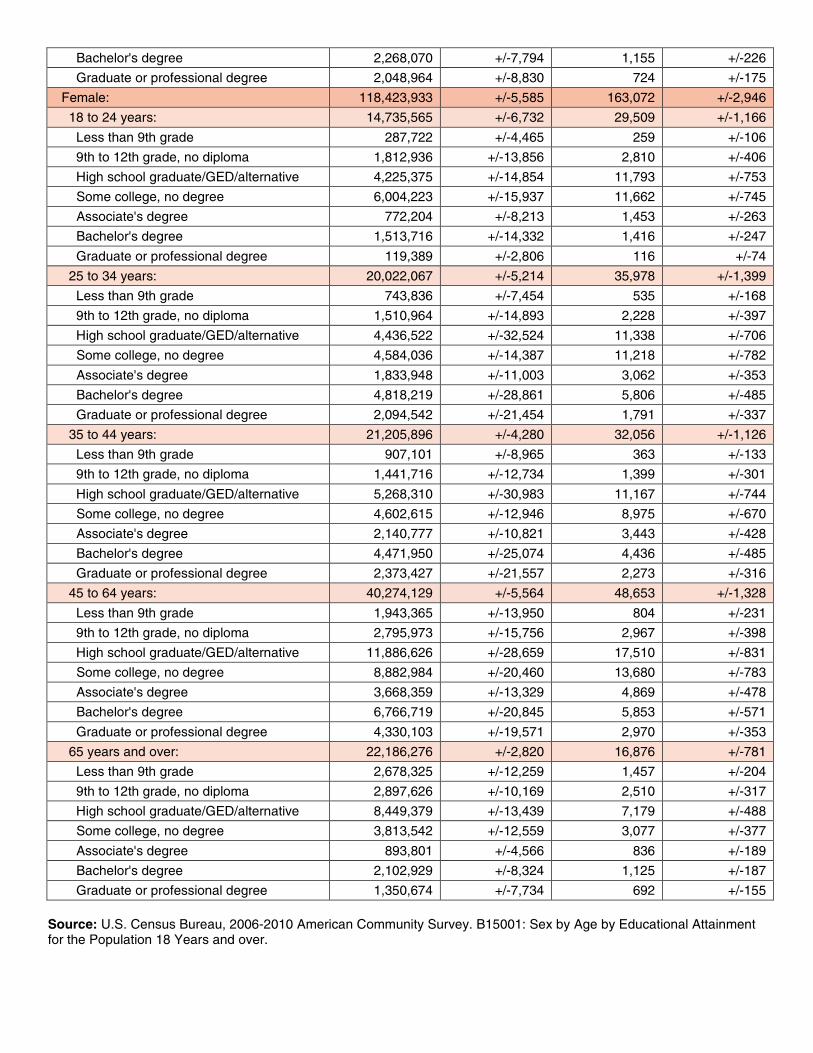
Bachelor's degree 2,268,070 +/-7,794 1,155 +/-226
Graduate or professional degree 2,048,964 +/-8,830 724 +/-175
Female: 118,423,933 +/-5,585 163,072 +/-2,946
18 to 24 years: 14,735,565 +/-6,732 29,509 +/-1,166
Less than 9th grade 287,722 +/-4,465 259 +/-106
9th to 12th grade, no diploma 1,812,936 +/-13,856 2,810 +/-406
High school graduate/GED/alternative 4,225,375 +/-14,854 11,793 +/-753
Some college, no degree 6,004,223 +/-15,937 11,662 +/-745
Associate's degree 772,204 +/-8,213 1,453 +/-263
Bachelor's degree 1,513,716 +/-14,332 1,416 +/-247
Graduate or professional degree 119,389 +/-2,806 116 +/-74
25 to 34 years: 20,022,067 +/-5,214 35,978 +/-1,399
Less than 9th grade 743,836 +/-7,454 535 +/-168
9th to 12th grade, no diploma 1,510,964 +/-14,893 2,228 +/-397
High school graduate/GED/alternative 4,436,522 +/-32,524 11,338 +/-706
Some college, no degree 4,584,036 +/-14,387 11,218 +/-782
Associate's degree 1,833,948 +/-11,003 3,062 +/-353
Bachelor's degree 4,818,219 +/-28,861 5,806 +/-485
Graduate or professional degree 2,094,542 +/-21,454 1,791 +/-337
35 to 44 years: 21,205,896 +/-4,280 32,056 +/-1,126
Less than 9th grade 907,101 +/-8,965 363 +/-133
9th to 12th grade, no diploma 1,441,716 +/-12,734 1,399 +/-301
High school graduate/GED/alternative 5,268,310 +/-30,983 11,167 +/-744
Some college, no degree 4,602,615 +/-12,946 8,975 +/-670
Associate's degree 2,140,777 +/-10,821 3,443 +/-428
Bachelor's degree 4,471,950 +/-25,074 4,436 +/-485
Graduate or professional degree 2,373,427 +/-21,557 2,273 +/-316
45 to 64 years: 40,274,129 +/-5,564 48,653 +/-1,328
Less than 9th grade 1,943,365 +/-13,950 804 +/-231
9th to 12th grade, no diploma 2,795,973 +/-15,756 2,967 +/-398
High school graduate/GED/alternative 11,886,626 +/-28,659 17,510 +/-831
Some college, no degree 8,882,984 +/-20,460 13,680 +/-783
Associate's degree 3,668,359 +/-13,329 4,869 +/-478
Bachelor's degree 6,766,719 +/-20,845 5,853 +/-571
Graduate or professional degree 4,330,103 +/-19,571 2,970 +/-353
65 years and over: 22,186,276 +/-2,820 16,876 +/-781
Less than 9th grade 2,678,325 +/-12,259 1,457 +/-204
9th to 12th grade, no diploma 2,897,626 +/-10,169 2,510 +/-317
High school graduate/GED/alternative 8,449,379 +/-13,439 7,179 +/-488
Some college, no degree 3,813,542 +/-12,559 3,077 +/-377
Associate's degree 893,801 +/-4,566 836 +/-189
Bachelor's degree 2,102,929 +/-8,324 1,125 +/-187
Graduate or professional degree 1,350,674 +/-7,734 692 +/-155
Source: U.S. Census Bureau, 2006-2010 American Community Survey. B15001: Sex by Age by Educational Attainment
for the Population 18 Years and over.
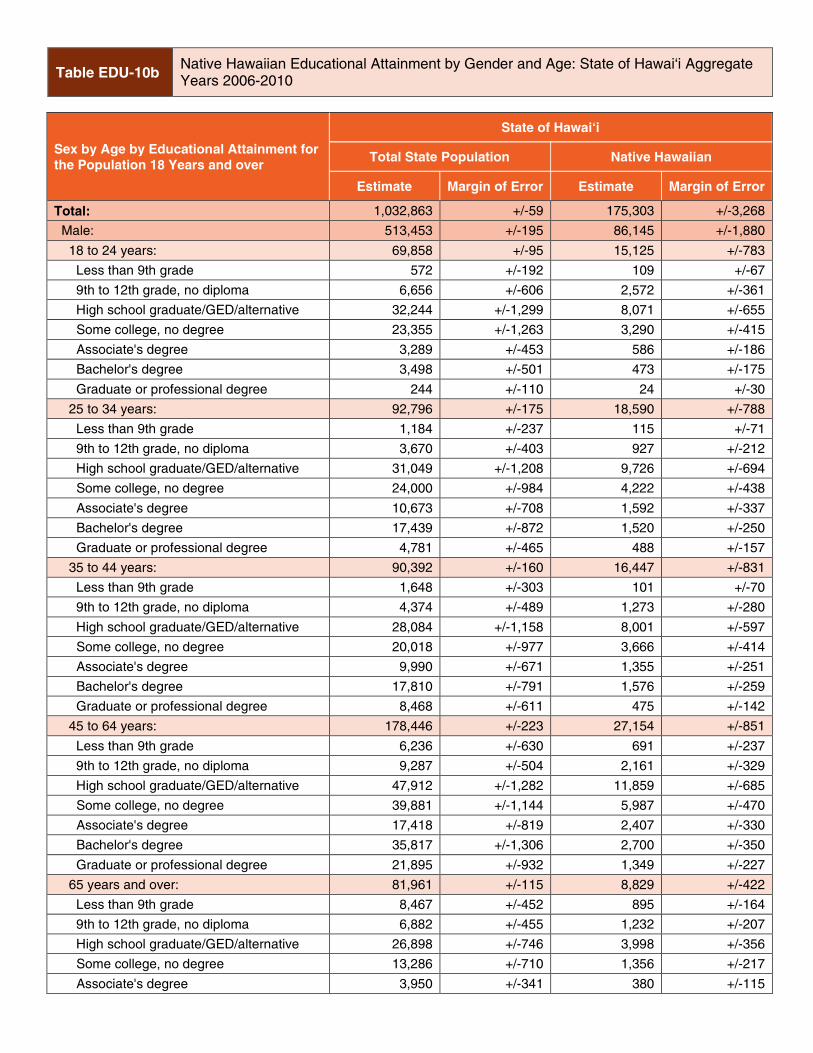
Table EDU-10b Native Hawaiian Educational Attainment by Gender and Age: State of Hawaiÿi Aggregate Years 2006-2010
Sex by Age by Educational Attainment for
the Population 18 Years and over
State of Hawaiÿi
Total State Population Native Hawaiian
Estimate Margin of Error Estimate Margin of Error
Total: 1,032,863 +/-59 175,303 +/-3,268
Male: 513,453 +/-195 86,145 +/-1,880
18 to 24 years: 69,858 +/-95 15,125 +/-783
Less than 9th grade 572 +/-192 109 +/-67
9th to 12th grade, no diploma 6,656 +/-606 2,572 +/-361
High school graduate/GED/alternative 32,244 +/-1,299 8,071 +/-655
Some college, no degree 23,355 +/-1,263 3,290 +/-415
Associate's degree 3,289 +/-453 586 +/-186
Bachelor's degree 3,498 +/-501 473 +/-175
Graduate or professional degree 244 +/-110 24 +/-30
25 to 34 years: 92,796 +/-175 18,590 +/-788
Less than 9th grade 1,184 +/-237 115 +/-71
9th to 12th grade, no diploma 3,670 +/-403 927 +/-212
High school graduate/GED/alternative 31,049 +/-1,208 9,726 +/-694
Some college, no degree 24,000 +/-984 4,222 +/-438
Associate's degree 10,673 +/-708 1,592 +/-337
Bachelor's degree 17,439 +/-872 1,520 +/-250
Graduate or professional degree 4,781 +/-465 488 +/-157
35 to 44 years: 90,392 +/-160 16,447 +/-831
Less than 9th grade 1,648 +/-303 101 +/-70
9th to 12th grade, no diploma 4,374 +/-489 1,273 +/-280
High school graduate/GED/alternative 28,084 +/-1,158 8,001 +/-597
Some college, no degree 20,018 +/-977 3,666 +/-414
Associate's degree 9,990 +/-671 1,355 +/-251
Bachelor's degree 17,810 +/-791 1,576 +/-259
Graduate or professional degree 8,468 +/-611 475 +/-142
45 to 64 years: 178,446 +/-223 27,154 +/-851
Less than 9th grade 6,236 +/-630 691 +/-237
9th to 12th grade, no diploma 9,287 +/-504 2,161 +/-329
High school graduate/GED/alternative 47,912 +/-1,282 11,859 +/-685
Some college, no degree 39,881 +/-1,144 5,987 +/-470
Associate's degree 17,418 +/-819 2,407 +/-330
Bachelor's degree 35,817 +/-1,306 2,700 +/-350
Graduate or professional degree 21,895 +/-932 1,349 +/-227
65 years and over: 81,961 +/-115 8,829 +/-422
Less than 9th grade 8,467 +/-452 895 +/-164
9th to 12th grade, no diploma 6,882 +/-455 1,232 +/-207
High school graduate/GED/alternative 26,898 +/-746 3,998 +/-356
Some college, no degree 13,286 +/-710 1,356 +/-217
Associate's degree 3,950 +/-341 380 +/-115
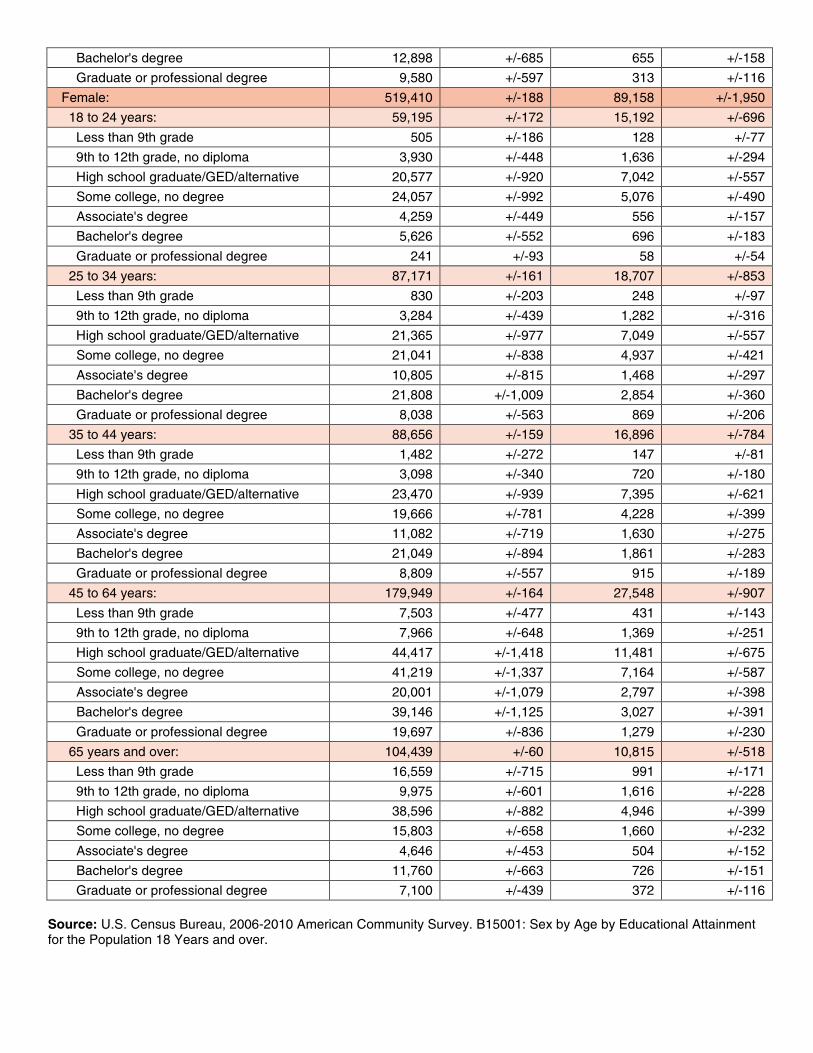
Bachelor's degree 12,898 +/-685 655 +/-158
Graduate or professional degree 9,580 +/-597 313 +/-116
Female: 519,410 +/-188 89,158 +/-1,950
18 to 24 years: 59,195 +/-172 15,192 +/-696
Less than 9th grade 505 +/-186 128 +/-77
9th to 12th grade, no diploma 3,930 +/-448 1,636 +/-294
High school graduate/GED/alternative 20,577 +/-920 7,042 +/-557
Some college, no degree 24,057 +/-992 5,076 +/-490
Associate's degree 4,259 +/-449 556 +/-157
Bachelor's degree 5,626 +/-552 696 +/-183
Graduate or professional degree 241 +/-93 58 +/-54
25 to 34 years: 87,171 +/-161 18,707 +/-853
Less than 9th grade 830 +/-203 248 +/-97
9th to 12th grade, no diploma 3,284 +/-439 1,282 +/-316
High school graduate/GED/alternative 21,365 +/-977 7,049 +/-557
Some college, no degree 21,041 +/-838 4,937 +/-421
Associate's degree 10,805 +/-815 1,468 +/-297
Bachelor's degree 21,808 +/-1,009 2,854 +/-360
Graduate or professional degree 8,038 +/-563 869 +/-206
35 to 44 years: 88,656 +/-159 16,896 +/-784
Less than 9th grade 1,482 +/-272 147 +/-81
9th to 12th grade, no diploma 3,098 +/-340 720 +/-180
High school graduate/GED/alternative 23,470 +/-939 7,395 +/-621
Some college, no degree 19,666 +/-781 4,228 +/-399
Associate's degree 11,082 +/-719 1,630 +/-275
Bachelor's degree 21,049 +/-894 1,861 +/-283
Graduate or professional degree 8,809 +/-557 915 +/-189
45 to 64 years: 179,949 +/-164 27,548 +/-907
Less than 9th grade 7,503 +/-477 431 +/-143
9th to 12th grade, no diploma 7,966 +/-648 1,369 +/-251
High school graduate/GED/alternative 44,417 +/-1,418 11,481 +/-675
Some college, no degree 41,219 +/-1,337 7,164 +/-587
Associate's degree 20,001 +/-1,079 2,797 +/-398
Bachelor's degree 39,146 +/-1,125 3,027 +/-391
Graduate or professional degree 19,697 +/-836 1,279 +/-230
65 years and over: 104,439 +/-60 10,815 +/-518
Less than 9th grade 16,559 +/-715 991 +/-171
9th to 12th grade, no diploma 9,975 +/-601 1,616 +/-228
High school graduate/GED/alternative 38,596 +/-882 4,946 +/-399
Some college, no degree 15,803 +/-658 1,660 +/-232
Associate's degree 4,646 +/-453 504 +/-152
Bachelor's degree 11,760 +/-663 726 +/-151
Graduate or professional degree 7,100 +/-439 372 +/-116
Source: U.S. Census Bureau, 2006-2010 American Community Survey. B15001: Sex by Age by Educational Attainment
for the Population 18 Years and over.

Table EDU-10c Native Hawaiian Educational Attainment by Gender and Age: Hawaiÿi County Aggregate Years 2006-2010
Sex by Age by Educational Attainment for
the Population 18 Years and over
Hawaiÿi County
Total County Population Native Hawaiian
Estimate Margin of Error Estimate Margin of Error
Total: 138,816 ***** 31,552 +/-1,336
Male: 68,951 ***** 15,289 +/-775
18 to 24 years: 7,840 +/-67 2,606 +/-296
Less than 9th grade 80 +/-53 7 +/-10
9th to 12th grade, no diploma 1,329 +/-296 570 +/-183
High school graduate/GED/alternative 3,304 +/-389 1,252 +/-230
Some college, no degree 2,391 +/-341 582 +/-202
Associate's degree 394 +/-168 147 +/-89
Bachelor's degree 315 +/-149 48 +/-37
Graduate or professional degree 27 +/-38 0 +/-123
25 to 34 years: 10,705 +/-121 3,194 +/-339
Less than 9th grade 221 +/-95 20 +/-31
9th to 12th grade, no diploma 592 +/-194 158 +/-86
High school graduate/GED/alternative 4,567 +/-337 1,876 +/-238
Some college, no degree 2,387 +/-344 713 +/-196
Associate's degree 1,207 +/-268 167 +/-85
Bachelor's degree 1,525 +/-293 222 +/-91
Graduate or professional degree 206 +/-105 38 +/-45
35 to 44 years: 10,796 +/-106 2,736 +/-331
Less than 9th grade 182 +/-108 0 +/-123
9th to 12th grade, no diploma 682 +/-171 250 +/-101
High school graduate/GED/alternative 3,897 +/-413 1,400 +/-276
Some college, no degree 2,514 +/-314 499 +/-138
Associate's degree 1,250 +/-275 297 +/-125
Bachelor's degree 1,721 +/-303 196 +/-132
Graduate or professional degree 550 +/-210 94 +/-109
45 to 64 years: 27,771 +/-132 5,343 +/-437
Less than 9th grade 469 +/-139 101 +/-67
9th to 12th grade, no diploma 1,469 +/-304 428 +/-174
High school graduate/GED/alternative 8,025 +/-524 2,491 +/-337
Some college, no degree 6,330 +/-464 1,175 +/-237
Associate's degree 3,469 +/-349 495 +/-129
Bachelor's degree 5,584 +/-455 483 +/-131
Graduate or professional degree 2,425 +/-286 170 +/-82
65 years and over: 11,839 +/-55 1,410 +/-134
Less than 9th grade 994 +/-194 107 +/-49
9th to 12th grade, no diploma 1,135 +/-200 203 +/-77
High school graduate/GED/alternative 3,506 +/-313 707 +/-161
Some college, no degree 1,942 +/-238 185 +/-77
Associate's degree 773 +/-147 76 +/-49
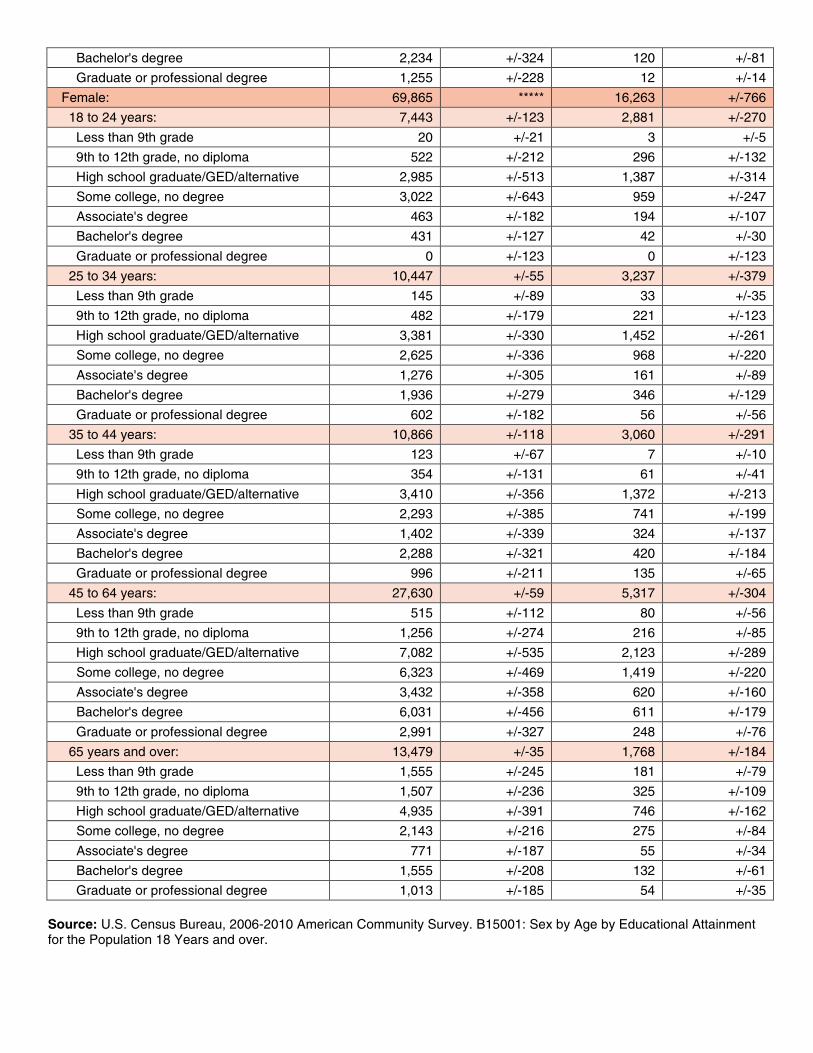
Bachelor's degree 2,234 +/-324 120 +/-81
Graduate or professional degree 1,255 +/-228 12 +/-14
Female: 69,865 ***** 16,263 +/-766
18 to 24 years: 7,443 +/-123 2,881 +/-270
Less than 9th grade 20 +/-21 3 +/-5
9th to 12th grade, no diploma 522 +/-212 296 +/-132
High school graduate/GED/alternative 2,985 +/-513 1,387 +/-314
Some college, no degree 3,022 +/-643 959 +/-247
Associate's degree 463 +/-182 194 +/-107
Bachelor's degree 431 +/-127 42 +/-30
Graduate or professional degree 0 +/-123 0 +/-123
25 to 34 years: 10,447 +/-55 3,237 +/-379
Less than 9th grade 145 +/-89 33 +/-35
9th to 12th grade, no diploma 482 +/-179 221 +/-123
High school graduate/GED/alternative 3,381 +/-330 1,452 +/-261
Some college, no degree 2,625 +/-336 968 +/-220
Associate's degree 1,276 +/-305 161 +/-89
Bachelor's degree 1,936 +/-279 346 +/-129
Graduate or professional degree 602 +/-182 56 +/-56
35 to 44 years: 10,866 +/-118 3,060 +/-291
Less than 9th grade 123 +/-67 7 +/-10
9th to 12th grade, no diploma 354 +/-131 61 +/-41
High school graduate/GED/alternative 3,410 +/-356 1,372 +/-213
Some college, no degree 2,293 +/-385 741 +/-199
Associate's degree 1,402 +/-339 324 +/-137
Bachelor's degree 2,288 +/-321 420 +/-184
Graduate or professional degree 996 +/-211 135 +/-65
45 to 64 years: 27,630 +/-59 5,317 +/-304
Less than 9th grade 515 +/-112 80 +/-56
9th to 12th grade, no diploma 1,256 +/-274 216 +/-85
High school graduate/GED/alternative 7,082 +/-535 2,123 +/-289
Some college, no degree 6,323 +/-469 1,419 +/-220
Associate's degree 3,432 +/-358 620 +/-160
Bachelor's degree 6,031 +/-456 611 +/-179
Graduate or professional degree 2,991 +/-327 248 +/-76
65 years and over: 13,479 +/-35 1,768 +/-184
Less than 9th grade 1,555 +/-245 181 +/-79
9th to 12th grade, no diploma 1,507 +/-236 325 +/-109
High school graduate/GED/alternative 4,935 +/-391 746 +/-162
Some college, no degree 2,143 +/-216 275 +/-84
Associate's degree 771 +/-187 55 +/-34
Bachelor's degree 1,555 +/-208 132 +/-61
Graduate or professional degree 1,013 +/-185 54 +/-35
Source: U.S. Census Bureau, 2006-2010 American Community Survey. B15001: Sex by Age by Educational Attainment
for the Population 18 Years and over.

Table EDU-10d Native Hawaiian Educational Attainment by Gender and Age: Honolulu County Aggregate Years 2006-2010
Sex by Age by Educational Attainment for
the Population 18 Years and over
Honolulu County
Total County Population Native Hawaiian
Estimate Margin of Error Estimate Margin of Error
Total: 728,082 ***** 110,499 +/-2,524
Male: 361,802 ***** 54,615 +/-1,514
18 to 24 years: 53,333 ***** 9,608 +/-696
Less than 9th grade 446 +/-164 79 +/-62
9th to 12th grade, no diploma 4,005 +/-456 1,421 +/-274
High school graduate/GED/alternative 24,702 +/-1,198 5,061 +/-476
Some college, no degree 18,820 +/-1,169 2,405 +/-348
Associate's degree 2,376 +/-339 297 +/-95
Bachelor's degree 2,767 +/-407 321 +/-129
Graduate or professional degree 217 +/-110 24 +/-30
25 to 34 years: 68,129 ***** 12,169 +/-637
Less than 9th grade 795 +/-211 64 +/-52
9th to 12th grade, no diploma 2,229 +/-307 498 +/-155
High school graduate/GED/alternative 20,908 +/-996 6,074 +/-538
Some college, no degree 18,127 +/-800 2,666 +/-384
Associate's degree 8,197 +/-624 1,248 +/-312
Bachelor's degree 13,604 +/-833 1,174 +/-208
Graduate or professional degree 4,269 +/-417 445 +/-146
35 to 44 years: 64,246 ***** 10,553 +/-679
Less than 9th grade 1,149 +/-232 79 +/-65
9th to 12th grade, no diploma 2,708 +/-362 699 +/-175
High school graduate/GED/alternative 18,651 +/-965 4,948 +/-502
Some college, no degree 14,129 +/-815 2,500 +/-329
Associate's degree 6,991 +/-614 779 +/-195
Bachelor's degree 13,523 +/-674 1,177 +/-231
Graduate or professional degree 7,095 +/-532 371 +/-148
45 to 64 years: 118,372 ***** 16,456 +/-653
Less than 9th grade 4,708 +/-498 426 +/-181
9th to 12th grade, no diploma 5,775 +/-423 1,197 +/-228
High school graduate/GED/alternative 30,170 +/-891 6,823 +/-512
Some college, no degree 25,477 +/-877 3,624 +/-360
Associate's degree 10,983 +/-675 1,568 +/-278
Bachelor's degree 24,612 +/-1,027 1,745 +/-283
Graduate or professional degree 16,647 +/-754 1,073 +/-219
65 years and over: 57,722 ***** 5,829 +/-363
Less than 9th grade 5,455 +/-399 417 +/-119
9th to 12th grade, no diploma 4,736 +/-393 850 +/-189
High school graduate/GED/alternative 19,982 +/-598 2,666 +/-291
Some college, no degree 9,222 +/-590 924 +/-179
Associate's degree 2,647 +/-315 283 +/-101
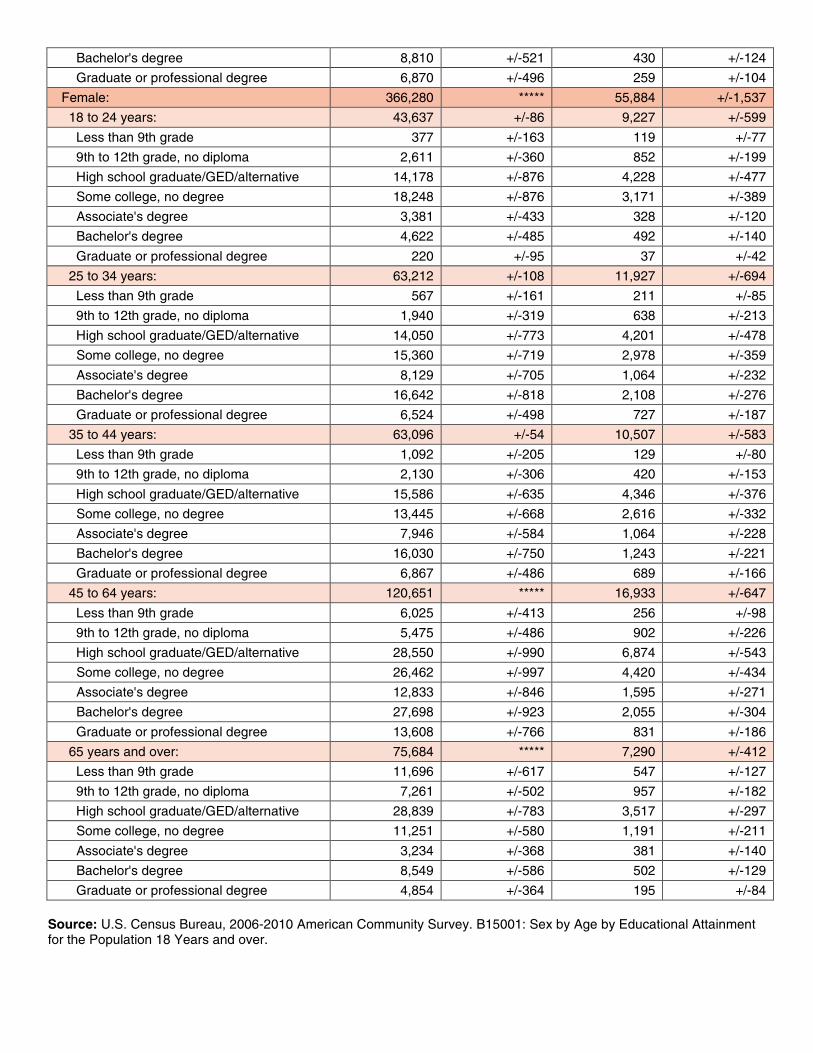
Bachelor's degree 8,810 +/-521 430 +/-124
Graduate or professional degree 6,870 +/-496 259 +/-104
Female: 366,280 ***** 55,884 +/-1,537
18 to 24 years: 43,637 +/-86 9,227 +/-599
Less than 9th grade 377 +/-163 119 +/-77
9th to 12th grade, no diploma 2,611 +/-360 852 +/-199
High school graduate/GED/alternative 14,178 +/-876 4,228 +/-477
Some college, no degree 18,248 +/-876 3,171 +/-389
Associate's degree 3,381 +/-433 328 +/-120
Bachelor's degree 4,622 +/-485 492 +/-140
Graduate or professional degree 220 +/-95 37 +/-42
25 to 34 years: 63,212 +/-108 11,927 +/-694
Less than 9th grade 567 +/-161 211 +/-85
9th to 12th grade, no diploma 1,940 +/-319 638 +/-213
High school graduate/GED/alternative 14,050 +/-773 4,201 +/-478
Some college, no degree 15,360 +/-719 2,978 +/-359
Associate's degree 8,129 +/-705 1,064 +/-232
Bachelor's degree 16,642 +/-818 2,108 +/-276
Graduate or professional degree 6,524 +/-498 727 +/-187
35 to 44 years: 63,096 +/-54 10,507 +/-583
Less than 9th grade 1,092 +/-205 129 +/-80
9th to 12th grade, no diploma 2,130 +/-306 420 +/-153
High school graduate/GED/alternative 15,586 +/-635 4,346 +/-376
Some college, no degree 13,445 +/-668 2,616 +/-332
Associate's degree 7,946 +/-584 1,064 +/-228
Bachelor's degree 16,030 +/-750 1,243 +/-221
Graduate or professional degree 6,867 +/-486 689 +/-166
45 to 64 years: 120,651 ***** 16,933 +/-647
Less than 9th grade 6,025 +/-413 256 +/-98
9th to 12th grade, no diploma 5,475 +/-486 902 +/-226
High school graduate/GED/alternative 28,550 +/-990 6,874 +/-543
Some college, no degree 26,462 +/-997 4,420 +/-434
Associate's degree 12,833 +/-846 1,595 +/-271
Bachelor's degree 27,698 +/-923 2,055 +/-304
Graduate or professional degree 13,608 +/-766 831 +/-186
65 years and over: 75,684 ***** 7,290 +/-412
Less than 9th grade 11,696 +/-617 547 +/-127
9th to 12th grade, no diploma 7,261 +/-502 957 +/-182
High school graduate/GED/alternative 28,839 +/-783 3,517 +/-297
Some college, no degree 11,251 +/-580 1,191 +/-211
Associate's degree 3,234 +/-368 381 +/-140
Bachelor's degree 8,549 +/-586 502 +/-129
Graduate or professional degree 4,854 +/-364 195 +/-84
Source: U.S. Census Bureau, 2006-2010 American Community Survey. B15001: Sex by Age by Educational Attainment
for the Population 18 Years and over.
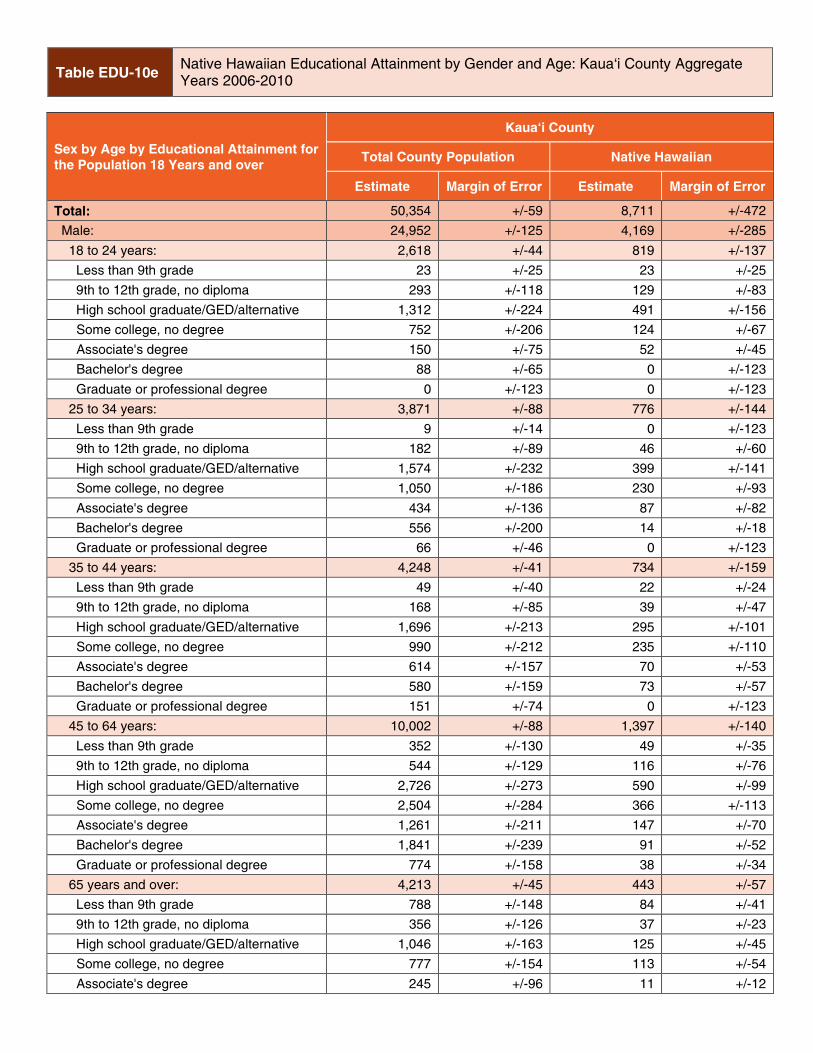
Table EDU-10e Native Hawaiian Educational Attainment by Gender and Age: Kauaÿi County Aggregate Years 2006-2010
Sex by Age by Educational Attainment for
the Population 18 Years and over
Kauaÿi County
Total County Population Native Hawaiian
Estimate Margin of Error Estimate Margin of Error
Total: 50,354 +/-59 8,711 +/-472
Male: 24,952 +/-125 4,169 +/-285
18 to 24 years: 2,618 +/-44 819 +/-137
Less than 9th grade 23 +/-25 23 +/-25
9th to 12th grade, no diploma 293 +/-118 129 +/-83
High school graduate/GED/alternative 1,312 +/-224 491 +/-156
Some college, no degree 752 +/-206 124 +/-67
Associate's degree 150 +/-75 52 +/-45
Bachelor's degree 88 +/-65 0 +/-123
Graduate or professional degree 0 +/-123 0 +/-123
25 to 34 years: 3,871 +/-88 776 +/-144
Less than 9th grade 9 +/-14 0 +/-123
9th to 12th grade, no diploma 182 +/-89 46 +/-60
High school graduate/GED/alternative 1,574 +/-232 399 +/-141
Some college, no degree 1,050 +/-186 230 +/-93
Associate's degree 434 +/-136 87 +/-82
Bachelor's degree 556 +/-200 14 +/-18
Graduate or professional degree 66 +/-46 0 +/-123
35 to 44 years: 4,248 +/-41 734 +/-159
Less than 9th grade 49 +/-40 22 +/-24
9th to 12th grade, no diploma 168 +/-85 39 +/-47
High school graduate/GED/alternative 1,696 +/-213 295 +/-101
Some college, no degree 990 +/-212 235 +/-110
Associate's degree 614 +/-157 70 +/-53
Bachelor's degree 580 +/-159 73 +/-57
Graduate or professional degree 151 +/-74 0 +/-123
45 to 64 years: 10,002 +/-88 1,397 +/-140
Less than 9th grade 352 +/-130 49 +/-35
9th to 12th grade, no diploma 544 +/-129 116 +/-76
High school graduate/GED/alternative 2,726 +/-273 590 +/-99
Some college, no degree 2,504 +/-284 366 +/-113
Associate's degree 1,261 +/-211 147 +/-70
Bachelor's degree 1,841 +/-239 91 +/-52
Graduate or professional degree 774 +/-158 38 +/-34
65 years and over: 4,213 +/-45 443 +/-57
Less than 9th grade 788 +/-148 84 +/-41
9th to 12th grade, no diploma 356 +/-126 37 +/-23
High school graduate/GED/alternative 1,046 +/-163 125 +/-45
Some college, no degree 777 +/-154 113 +/-54
Associate's degree 245 +/-96 11 +/-12
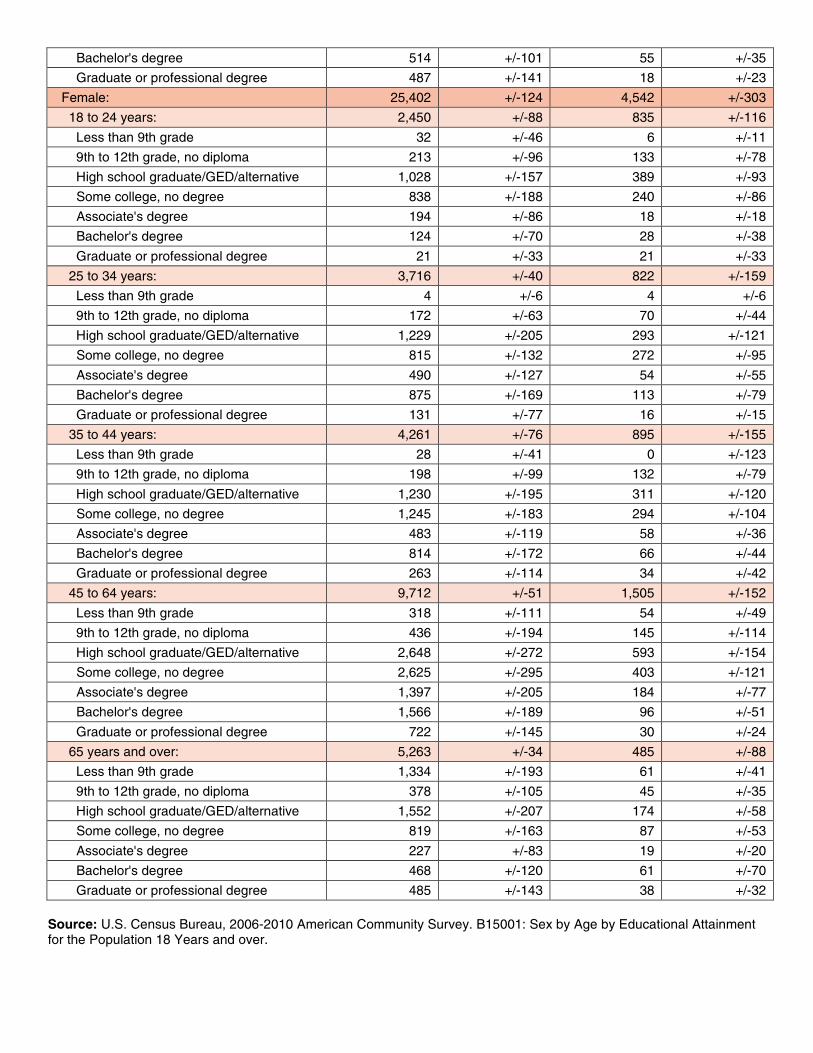
Bachelor's degree 514 +/-101 55 +/-35
Graduate or professional degree 487 +/-141 18 +/-23
Female: 25,402 +/-124 4,542 +/-303
18 to 24 years: 2,450 +/-88 835 +/-116
Less than 9th grade 32 +/-46 6 +/-11
9th to 12th grade, no diploma 213 +/-96 133 +/-78
High school graduate/GED/alternative 1,028 +/-157 389 +/-93
Some college, no degree 838 +/-188 240 +/-86
Associate's degree 194 +/-86 18 +/-18
Bachelor's degree 124 +/-70 28 +/-38
Graduate or professional degree 21 +/-33 21 +/-33
25 to 34 years: 3,716 +/-40 822 +/-159
Less than 9th grade 4 +/-6 4 +/-6
9th to 12th grade, no diploma 172 +/-63 70 +/-44
High school graduate/GED/alternative 1,229 +/-205 293 +/-121
Some college, no degree 815 +/-132 272 +/-95
Associate's degree 490 +/-127 54 +/-55
Bachelor's degree 875 +/-169 113 +/-79
Graduate or professional degree 131 +/-77 16 +/-15
35 to 44 years: 4,261 +/-76 895 +/-155
Less than 9th grade 28 +/-41 0 +/-123
9th to 12th grade, no diploma 198 +/-99 132 +/-79
High school graduate/GED/alternative 1,230 +/-195 311 +/-120
Some college, no degree 1,245 +/-183 294 +/-104
Associate's degree 483 +/-119 58 +/-36
Bachelor's degree 814 +/-172 66 +/-44
Graduate or professional degree 263 +/-114 34 +/-42
45 to 64 years: 9,712 +/-51 1,505 +/-152
Less than 9th grade 318 +/-111 54 +/-49
9th to 12th grade, no diploma 436 +/-194 145 +/-114
High school graduate/GED/alternative 2,648 +/-272 593 +/-154
Some college, no degree 2,625 +/-295 403 +/-121
Associate's degree 1,397 +/-205 184 +/-77
Bachelor's degree 1,566 +/-189 96 +/-51
Graduate or professional degree 722 +/-145 30 +/-24
65 years and over: 5,263 +/-34 485 +/-88
Less than 9th grade 1,334 +/-193 61 +/-41
9th to 12th grade, no diploma 378 +/-105 45 +/-35
High school graduate/GED/alternative 1,552 +/-207 174 +/-58
Some college, no degree 819 +/-163 87 +/-53
Associate's degree 227 +/-83 19 +/-20
Bachelor's degree 468 +/-120 61 +/-70
Graduate or professional degree 485 +/-143 38 +/-32
Source: U.S. Census Bureau, 2006-2010 American Community Survey. B15001: Sex by Age by Educational Attainment
for the Population 18 Years and over.
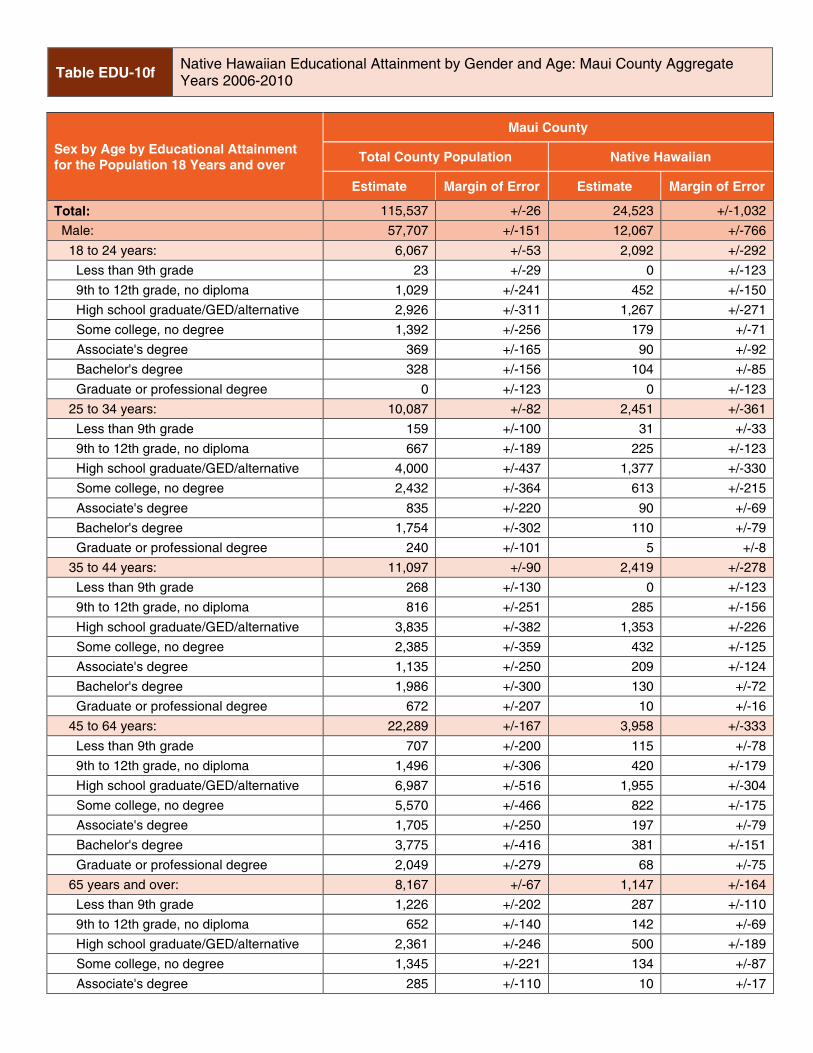
Table EDU-10f Native Hawaiian Educational Attainment by Gender and Age: Maui County Aggregate Years 2006-2010
Sex by Age by Educational Attainment
for the Population 18 Years and over
Maui County
Total County Population Native Hawaiian
Estimate Margin of Error Estimate Margin of Error
Total: 115,537 +/-26 24,523 +/-1,032
Male: 57,707 +/-151 12,067 +/-766
18 to 24 years: 6,067 +/-53 2,092 +/-292
Less than 9th grade 23 +/-29 0 +/-123
9th to 12th grade, no diploma 1,029 +/-241 452 +/-150
High school graduate/GED/alternative 2,926 +/-311 1,267 +/-271
Some college, no degree 1,392 +/-256 179 +/-71
Associate's degree 369 +/-165 90 +/-92
Bachelor's degree 328 +/-156 104 +/-85
Graduate or professional degree 0 +/-123 0 +/-123
25 to 34 years: 10,087 +/-82 2,451 +/-361
Less than 9th grade 159 +/-100 31 +/-33
9th to 12th grade, no diploma 667 +/-189 225 +/-123
High school graduate/GED/alternative 4,000 +/-437 1,377 +/-330
Some college, no degree 2,432 +/-364 613 +/-215
Associate's degree 835 +/-220 90 +/-69
Bachelor's degree 1,754 +/-302 110 +/-79
Graduate or professional degree 240 +/-101 5 +/-8
35 to 44 years: 11,097 +/-90 2,419 +/-278
Less than 9th grade 268 +/-130 0 +/-123
9th to 12th grade, no diploma 816 +/-251 285 +/-156
High school graduate/GED/alternative 3,835 +/-382 1,353 +/-226
Some college, no degree 2,385 +/-359 432 +/-125
Associate's degree 1,135 +/-250 209 +/-124
Bachelor's degree 1,986 +/-300 130 +/-72
Graduate or professional degree 672 +/-207 10 +/-16
45 to 64 years: 22,289 +/-167 3,958 +/-333
Less than 9th grade 707 +/-200 115 +/-78
9th to 12th grade, no diploma 1,496 +/-306 420 +/-179
High school graduate/GED/alternative 6,987 +/-516 1,955 +/-304
Some college, no degree 5,570 +/-466 822 +/-175
Associate's degree 1,705 +/-250 197 +/-79
Bachelor's degree 3,775 +/-416 381 +/-151
Graduate or professional degree 2,049 +/-279 68 +/-75
65 years and over: 8,167 +/-67 1,147 +/-164
Less than 9th grade 1,226 +/-202 287 +/-110
9th to 12th grade, no diploma 652 +/-140 142 +/-69
High school graduate/GED/alternative 2,361 +/-246 500 +/-189
Some college, no degree 1,345 +/-221 134 +/-87
Associate's degree 285 +/-110 10 +/-17
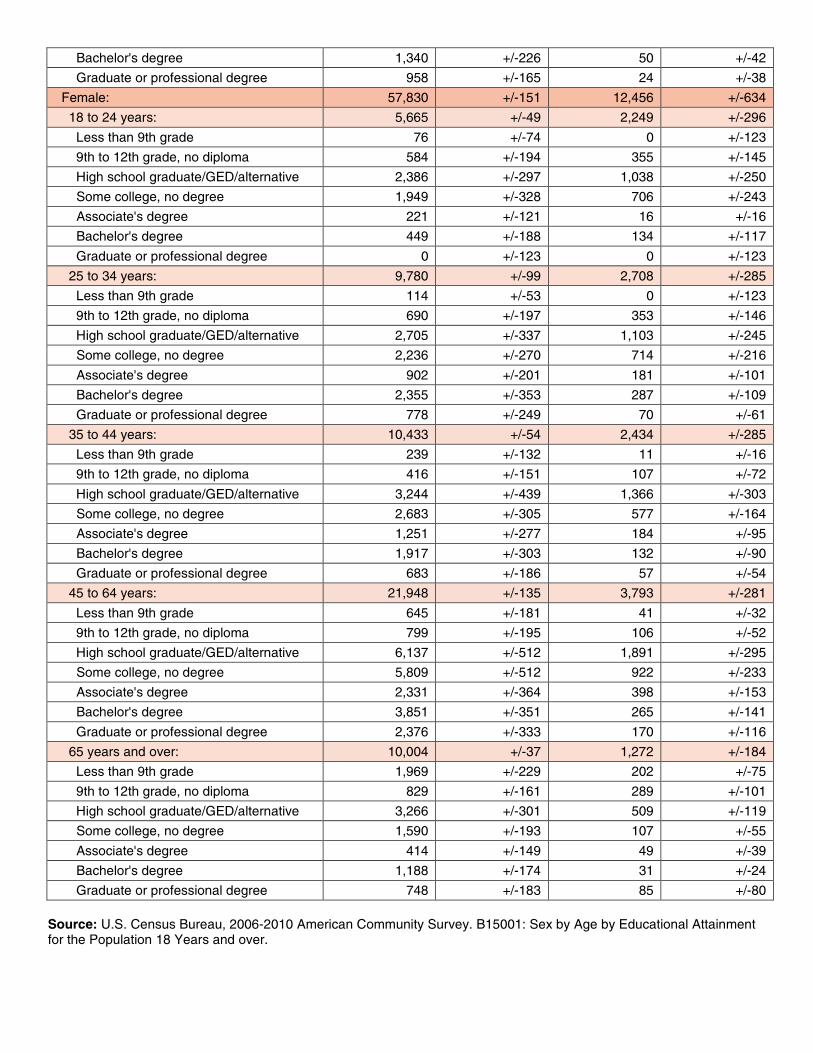
Bachelor's degree 1,340 +/-226 50 +/-42
Graduate or professional degree 958 +/-165 24 +/-38
Female: 57,830 +/-151 12,456 +/-634
18 to 24 years: 5,665 +/-49 2,249 +/-296
Less than 9th grade 76 +/-74 0 +/-123
9th to 12th grade, no diploma 584 +/-194 355 +/-145
High school graduate/GED/alternative 2,386 +/-297 1,038 +/-250
Some college, no degree 1,949 +/-328 706 +/-243
Associate's degree 221 +/-121 16 +/-16
Bachelor's degree 449 +/-188 134 +/-117
Graduate or professional degree 0 +/-123 0 +/-123
25 to 34 years: 9,780 +/-99 2,708 +/-285
Less than 9th grade 114 +/-53 0 +/-123
9th to 12th grade, no diploma 690 +/-197 353 +/-146
High school graduate/GED/alternative 2,705 +/-337 1,103 +/-245
Some college, no degree 2,236 +/-270 714 +/-216
Associate's degree 902 +/-201 181 +/-101
Bachelor's degree 2,355 +/-353 287 +/-109
Graduate or professional degree 778 +/-249 70 +/-61
35 to 44 years: 10,433 +/-54 2,434 +/-285
Less than 9th grade 239 +/-132 11 +/-16
9th to 12th grade, no diploma 416 +/-151 107 +/-72
High school graduate/GED/alternative 3,244 +/-439 1,366 +/-303
Some college, no degree 2,683 +/-305 577 +/-164
Associate's degree 1,251 +/-277 184 +/-95
Bachelor's degree 1,917 +/-303 132 +/-90
Graduate or professional degree 683 +/-186 57 +/-54
45 to 64 years: 21,948 +/-135 3,793 +/-281
Less than 9th grade 645 +/-181 41 +/-32
9th to 12th grade, no diploma 799 +/-195 106 +/-52
High school graduate/GED/alternative 6,137 +/-512 1,891 +/-295
Some college, no degree 5,809 +/-512 922 +/-233
Associate's degree 2,331 +/-364 398 +/-153
Bachelor's degree 3,851 +/-351 265 +/-141
Graduate or professional degree 2,376 +/-333 170 +/-116
65 years and over: 10,004 +/-37 1,272 +/-184
Less than 9th grade 1,969 +/-229 202 +/-75
9th to 12th grade, no diploma 829 +/-161 289 +/-101
High school graduate/GED/alternative 3,266 +/-301 509 +/-119
Some college, no degree 1,590 +/-193 107 +/-55
Associate's degree 414 +/-149 49 +/-39
Bachelor's degree 1,188 +/-174 31 +/-24
Graduate or professional degree 748 +/-183 85 +/-80
Source: U.S. Census Bureau, 2006-2010 American Community Survey. B15001: Sex by Age by Educational Attainment
for the Population 18 Years and over.