Embed Size (px)
Citation preview
Education Attainment As a Determinant of Economic Growth in African Countries
Katarzyna Błocka, SGH Warsaw School of Economics, Poland
The Asian Conference on Education & International Development 2018 Official Conference Proceedings
Abstract In the light of educational policies in developing countries being strongly influenced by the Millennium Development Goals and foreign aid programmes, the role of education and human capital accumulation in the economic development of African countries is examined. The Solow model and the augmented Solow model including human capital were estimated using the most recent data on African countries (from the International Monetary Fund and the World Bank). The shares of the working population with three different levels of education attainment were used as alternative proxy variables for human capital. The results confirm the validity of the two models for African countries, however they also reveal some interesting discrepancies with the purely theoretical models. Out of three education levels, tertiary education attainment in the working population is the best predictor of income per capita, and the sum of secondary and tertiary education attainment is the proxy variable leading to the most credible results. Potential educational policy implications of the results are discussed. Keywords: Millennium Development Goals, educational policy, education attainment, human capital, augmented Solow model
iafor The International Academic Forum
www.iafor.org
1. Introduction The Millennium Development Goal (MDG) Target 2, calling for 100% primary education enrolment globally1, has been criticized in literature in the context of African countries. Easterly (2009) argues that MDG, including Target 2, were unfair to Africa2. First of all, because it was an absolute instead of a relative measure, which put many African countries at a disadvantage in comparison to other developing regions. Easterly (2009) argues that no other region progressed so fast when they were developing their primary school systems.3 The pressure to catch up might have led to some undesired consequences, namely deterioration of quality, e.g. due to rapid increases of class. In parallel, Bloom et al. (2006) demonstrate how the “international development community has encouraged African governments’ relative neglect of higher education.”4 The shift of focus to primary education can be tracked down to before the MDG’s announcement in 2000. As Bloom et al. (2006) calculated, “from 1985 to 1989, 17 per cent of the World Bank’s worldwide education-sector spending was on higher education. But from 1995 to 1999, the proportion allotted to higher education declined to just 7 per cent.”5 This paper looks at the appropriateness of the target to the situation of African countries from the perspective of economic growth theory. Many studies have looked at how education statistics can help understand differences in economic development of countries. The specifications provided by Mankiw, Romer, and Weil (1992) are a starting point for many authors,6 just as they are in the current study. Mankiw, Romer, Weil (1992) introduced an augmented version of the neo-classical Solow model (Solow, 1956) in which they incorporated human capital to production function. The two others determinants (physical capital, and the labour force size) can be directly measured, as opposed to human capital. The unobservability of human capital requires proxy variables for the models to be empirically tested. Although many studies were aimed at comparing which variables serve as best proxies of human capital, there are important limitations. As the level of accumulated human capital increases, the variance of once suitable measures (e.g. literacy rates) decreases and they gradually become useless in differentiating affluent and middle-income countries. As education systems progress globally and education attainment reaches nearly 100% in developed countries, other measures (secondary education attainment, average years of
1 Un.org. (2015). United Nations Millennium Development Goals Report 2015. 2 Easterly, W. (2009). How the millennium development goals are unfair to Africa. World development, 37(1), 26-35. 3 Ibidem, p. 26. 4 Bloom, D. E., Canning, D., & Chan, K. (2006). Higher education and economic development in Africa (Vol. 102). Washington, DC: World Bank, p.iii. 5 Ibidem. 6 Baum, M. A., & Lake, D. A. (2003). The political economy of growth: democracy and human capital. American Journal of Political Science, 47(2), p. 334.
schooling, etc.) have to be used. Glewwe, Maiga and Zheng (2014) summarize the most important studies that estimated the influence of education on economic growth.7 Within a highly diverse group of countries, one measure of human capital might be more suitable for those with high levels of high income per capita and another one for the ones lagging behind. There are two important implications. First of all, it is justified to analyse sub-groups of countries, as performed in this study. Second of all, there can never be a universal proxy for human capital. The paper follows the following structure. First, results of estimating the original Solow model and the augmented Solow model are described, followed by choosing the best proxy for the stock of human capital. Second, the potential of primary education attainment in explaining cross-country differences in terms of income per capita is inspected. Finally potential policy implications, limitations of the adopted approach, and areas for further research are discussed. 2. Econometric modelling The most important source for the data on education attainment is the Barro-Lee Education Attainment Dataset. The dataset was constructed with the objective to provide a measure of the aggregate stock of human capital, and therefore to complement the data on school enrolment ratios or literacy rates, which can serve as proxies for human capital accumulation rate. It is important to note that the measure of education attainment of a certain level encompasses people who have completed this stage of education and did not complete a higher one (e.g., university graduates are not included in secondary attainment rate). The newest version of the dataset contains estimates for 146 countries, including 37 African countries, for the period 1950-2010. The information on country-level data availability is provided in the Appendix. The International Monetary Fund’s World Economic Outlook Database April 2018 is the source of economic data used in this study. Basing on the available data, the variables are constructed analogically to Mankiw et al. (1992). Some simplifications were performed due to lack or inconsistency of data. First of all, the total population size is used instead of the working population size. As in many African countries people start to work at a very young age, and as the working population is hard to distinguish from the non-working because of the informality of the labour market, the assumption should not excessively sensitize the results.
7 Glewwe, P., Maiga, E., & Zheng, H. (2014). The contribution of education to economic growth: A review of the evidence, with special attention and an application to Sub-Saharan Africa. World Development, 59, Table 1.
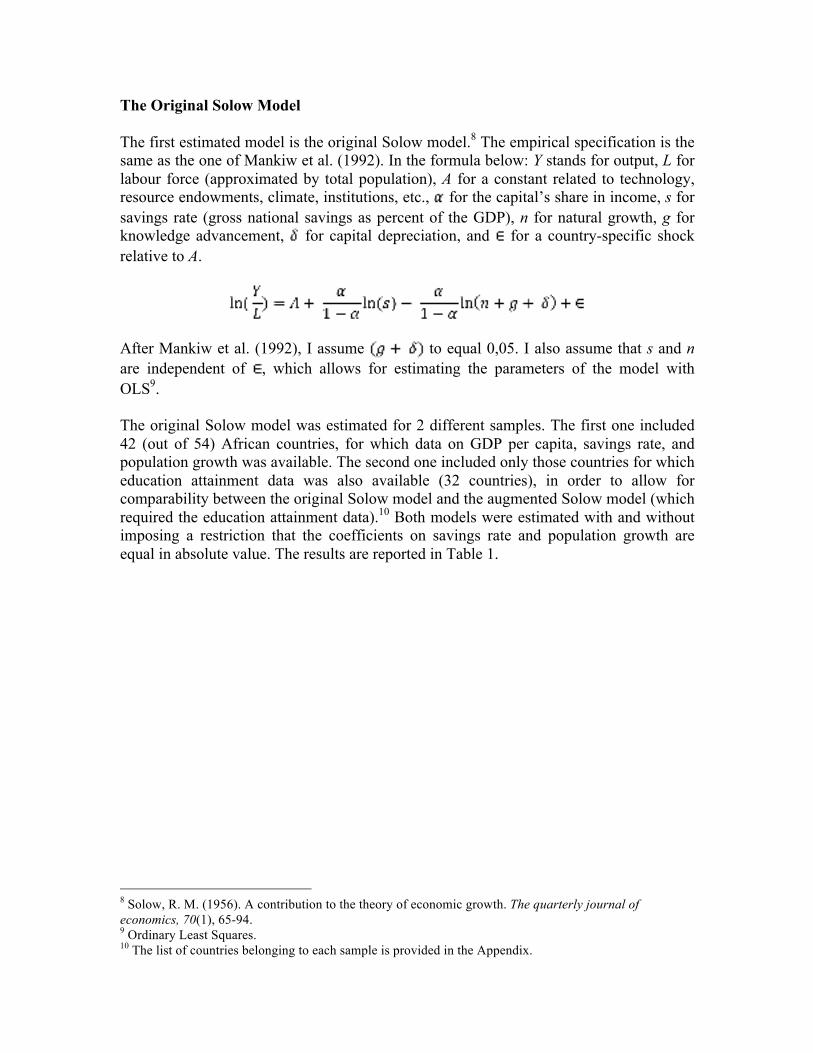
The Original Solow Model The first estimated model is the original Solow model.8 The empirical specification is the same as the one of Mankiw et al. (1992). In the formula below: Y stands for output, L for labour force (approximated by total population), A for a constant related to technology, resource endowments, climate, institutions, etc., for the capital’s share in income, s for savings rate (gross national savings as percent of the GDP), n for natural growth, g for knowledge advancement, for capital depreciation, and for a country-specific shock relative to A.
After Mankiw et al. (1992), I assume to equal 0,05. I also assume that s and n are independent of , which allows for estimating the parameters of the model with OLS9. The original Solow model was estimated for 2 different samples. The first one included 42 (out of 54) African countries, for which data on GDP per capita, savings rate, and population growth was available. The second one included only those countries for which education attainment data was also available (32 countries), in order to allow for comparability between the original Solow model and the augmented Solow model (which required the education attainment data).10 Both models were estimated with and without imposing a restriction that the coefficients on savings rate and population growth are equal in absolute value. The results are reported in Table 1. 8 Solow, R. M. (1956). A contribution to the theory of economic growth. The quarterly journal of economics, 70(1), 65-94. 9 Ordinary Least Squares. 10 The list of countries belonging to each sample is provided in the Appendix.
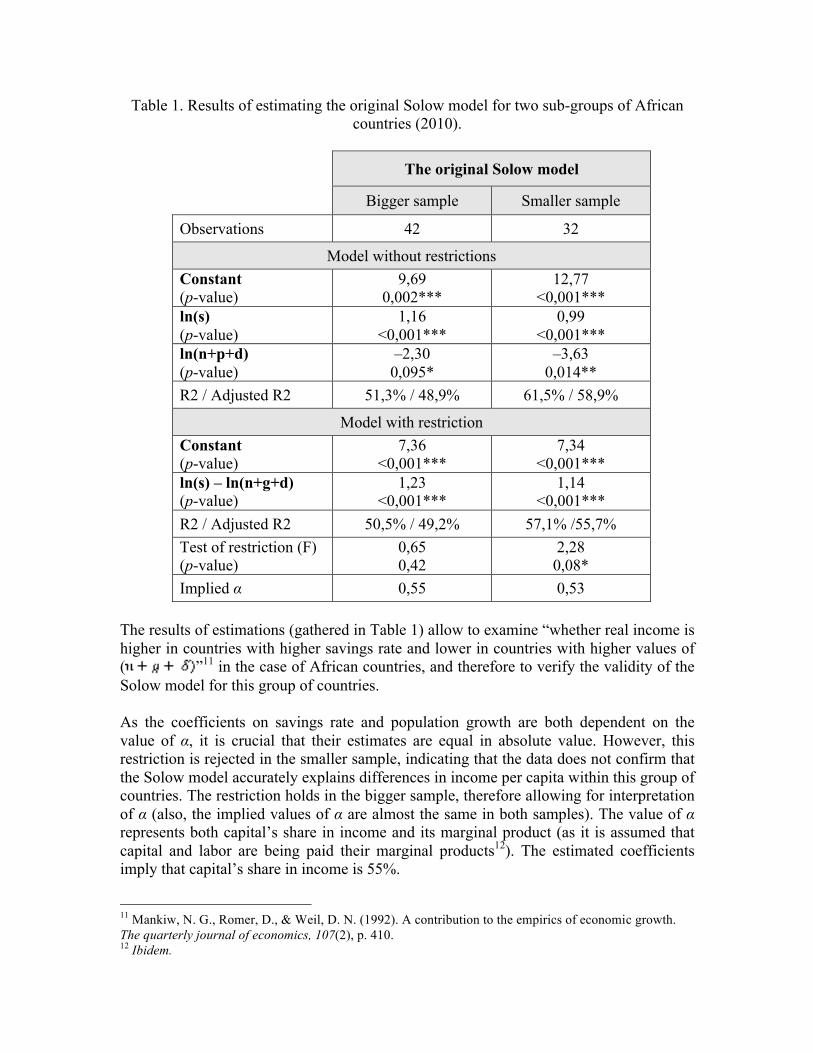
Table 1. Results of estimating the original Solow model for two sub-groups of African countries (2010).
The original Solow model
Bigger sample Smaller sample
Observations 42 32
Model without restrictions Constant (p-value)
9,69 0,002***
12,77 <0,001***
ln(s) (p-value)
1,16 <0,001***
0,99 <0,001***
ln(n+p+d) (p-value)
–2,30 0,095*
–3,63 0,014**
R2 / Adjusted R2 51,3% / 48,9% 61,5% / 58,9%
Model with restriction Constant (p-value)
7,36 <0,001***
7,34 <0,001***
ln(s) – ln(n+g+d) (p-value)
1,23 <0,001***
1,14 <0,001***
R2 / Adjusted R2 50,5% / 49,2% 57,1% /55,7% Test of restriction (F) (p-value)
0,65 0,42
2,28 0,08*
Implied α 0,55 0,53 The results of estimations (gathered in Table 1) allow to examine “whether real income is higher in countries with higher savings rate and lower in countries with higher values of ( ”11 in the case of African countries, and therefore to verify the validity of the Solow model for this group of countries. As the coefficients on savings rate and population growth are both dependent on the value of α, it is crucial that their estimates are equal in absolute value. However, this restriction is rejected in the smaller sample, indicating that the data does not confirm that the Solow model accurately explains differences in income per capita within this group of countries. The restriction holds in the bigger sample, therefore allowing for interpretation of α (also, the implied values of α are almost the same in both samples). The value of α represents both capital’s share in income and its marginal product (as it is assumed that capital and labor are being paid their marginal products12). The estimated coefficients imply that capital’s share in income is 55%.
11 Mankiw, N. G., Romer, D., & Weil, D. N. (1992). A contribution to the empirics of economic growth. The quarterly journal of economics, 107(2), p. 410. 12 Ibidem.
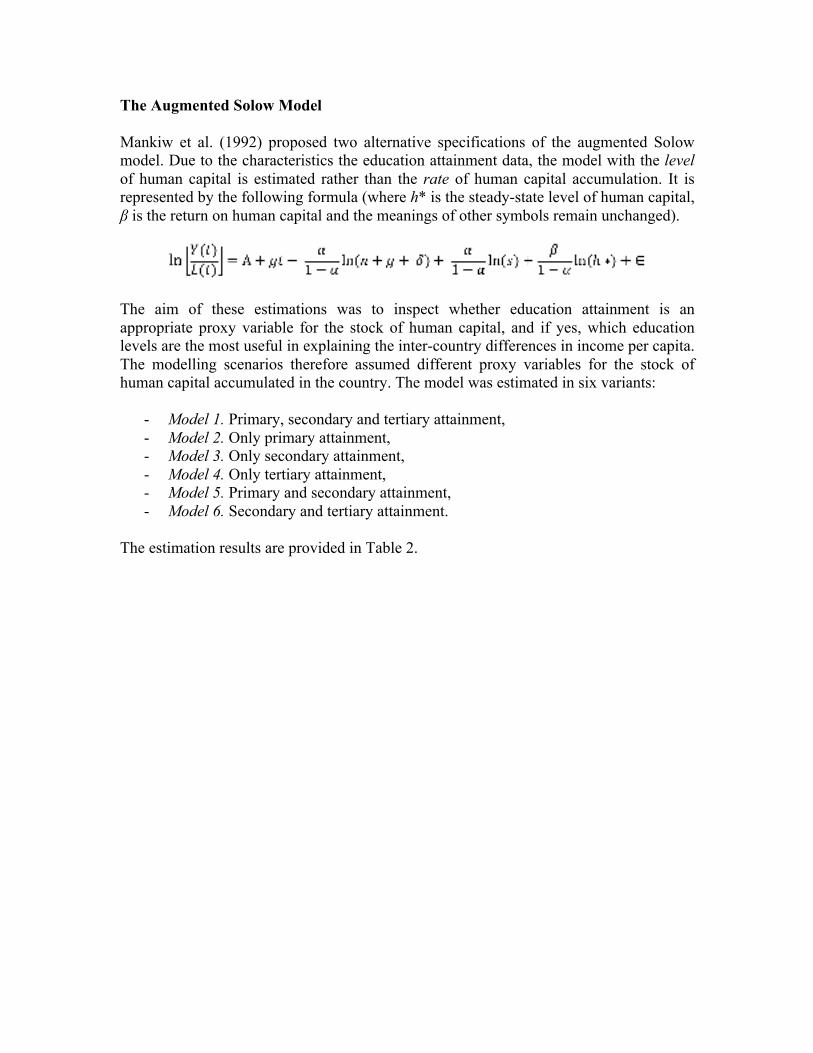
The Augmented Solow Model Mankiw et al. (1992) proposed two alternative specifications of the augmented Solow model. Due to the characteristics the education attainment data, the model with the level of human capital is estimated rather than the rate of human capital accumulation. It is represented by the following formula (where h* is the steady-state level of human capital, β is the return on human capital and the meanings of other symbols remain unchanged).
The aim of these estimations was to inspect whether education attainment is an appropriate proxy variable for the stock of human capital, and if yes, which education levels are the most useful in explaining the inter-country differences in income per capita. The modelling scenarios therefore assumed different proxy variables for the stock of human capital accumulated in the country. The model was estimated in six variants:
- Model 1. Primary, secondary and tertiary attainment, - Model 2. Only primary attainment, - Model 3. Only secondary attainment, - Model 4. Only tertiary attainment, - Model 5. Primary and secondary attainment, - Model 6. Secondary and tertiary attainment.
The estimation results are provided in Table 2.
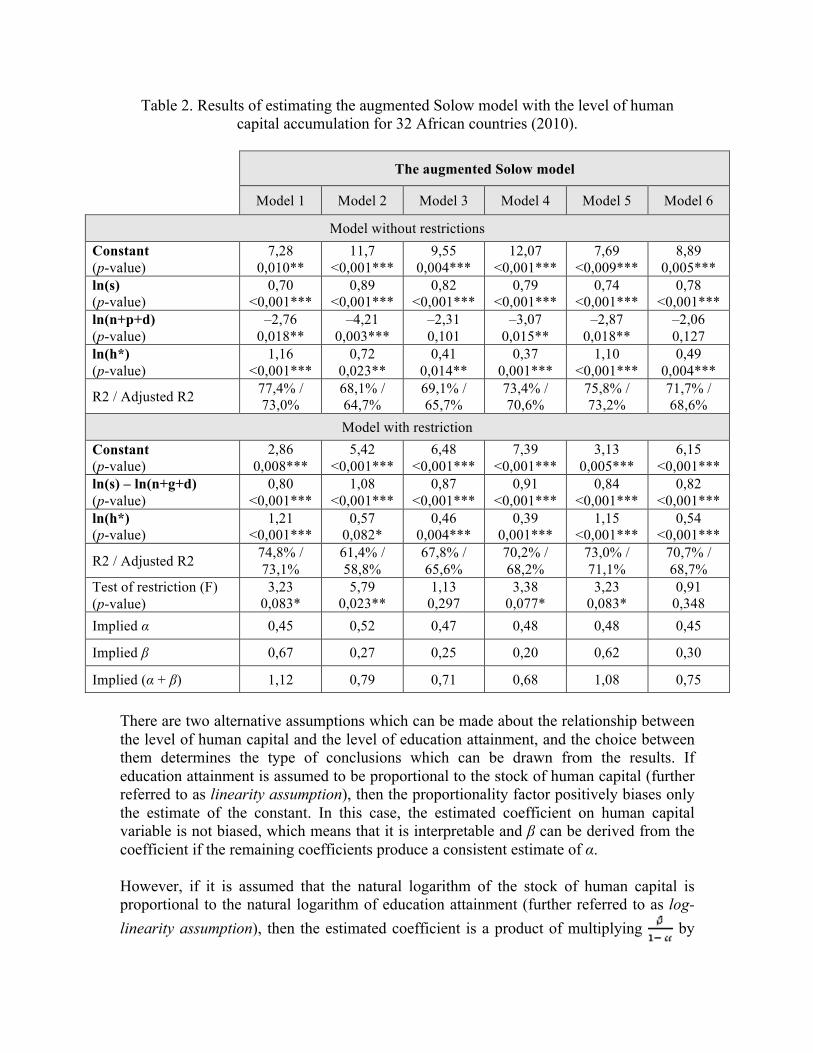
Table 2. Results of estimating the augmented Solow model with the level of human capital accumulation for 32 African countries (2010).
The augmented Solow model
Model 1 Model 2 Model 3 Model 4 Model 5 Model 6
Model without restrictions Constant (p-value)
7,28 0,010**
11,7 <0,001***
9,55 0,004***
12,07 <0,001***
7,69 <0,009***
8,89 0,005***
ln(s) (p-value)
0,70 <0,001***
0,89 <0,001***
0,82 <0,001***
0,79 <0,001***
0,74 <0,001***
0,78 <0,001***
ln(n+p+d) (p-value)
–2,76 0,018**
–4,21 0,003***
–2,31 0,101
–3,07 0,015**
–2,87 0,018**
–2,06 0,127
ln(h*) (p-value)
1,16 <0,001***
0,72 0,023**
0,41 0,014**
0,37 0,001***
1,10 <0,001***
0,49 0,004***
R2 / Adjusted R2 77,4% / 73,0%
68,1% / 64,7%
69,1% / 65,7%
73,4% / 70,6%
75,8% / 73,2%
71,7% / 68,6%
Model with restriction Constant (p-value)
2,86 0,008***
5,42 <0,001***
6,48 <0,001***
7,39 <0,001***
3,13 0,005***
6,15 <0,001***
ln(s) – ln(n+g+d) (p-value)
0,80 <0,001***
1,08 <0,001***
0,87 <0,001***
0,91 <0,001***
0,84 <0,001***
0,82 <0,001***
ln(h*) (p-value)
1,21 <0,001***
0,57 0,082*
0,46 0,004***
0,39 0,001***
1,15 <0,001***
0,54 <0,001***
R2 / Adjusted R2 74,8% / 73,1%
61,4% / 58,8%
67,8% / 65,6%
70,2% / 68,2%
73,0% / 71,1%
70,7% / 68,7%
Test of restriction (F) (p-value)
3,23 0,083*
5,79 0,023**
1,13 0,297
3,38 0,077*
3,23 0,083*
0,91 0,348
Implied α 0,45 0,52 0,47 0,48 0,48 0,45
Implied β 0,67 0,27 0,25 0,20 0,62 0,30
Implied (α + β) 1,12 0,79 0,71 0,68 1,08 0,75 There are two alternative assumptions which can be made about the relationship between the level of human capital and the level of education attainment, and the choice between them determines the type of conclusions which can be drawn from the results. If education attainment is assumed to be proportional to the stock of human capital (further referred to as linearity assumption), then the proportionality factor positively biases only the estimate of the constant. In this case, the estimated coefficient on human capital variable is not biased, which means that it is interpretable and β can be derived from the coefficient if the remaining coefficients produce a consistent estimate of α. However, if it is assumed that the natural logarithm of the stock of human capital is proportional to the natural logarithm of education attainment (further referred to as log-linearity assumption), then the estimated coefficient is a product of multiplying by
the unknown proportionality factor ( ). In that case, to find , one would need to solve the following equation: , where stands for the estimated coefficient on the level of human capital. The equation, however, has two unknowns ( and ), which makes it impossible to identify . Adopting the log-linearity assumption prohibits interpreting the respective estimated coefficient and therefore does not lead to finding the estimate for the return on human capital. However, it does not invalidate the use of the proxy. Therefore measures such as the goodness-of-fit and p-values (of the coefficient on human capital) can still be interpreted and used in order to discriminate between stronger and weaker proxies. Finding the best proxy variable for the stock of accumulated human capital The models which succeed13 in producing consistent14 values of α are Model 3 and Model 6. The restriction on the coefficients on savings rate and population growth is rejected in the four other cases (significance level of 10%). The α implied by the two successful models is around 10 percentage points lower compared to the original Solow model. The differential suggests that not accounting for human capital in the production function leads to overestimating the marginal product of capital. The bias is even greater in the case of the implied marginal product of labor, which is equal to (1 – α) in the original Solow model, and to (1 – α – β) in the augmented model15. While it is estimated to be 0,45 in original Solow model, it is only 0,29 (Model 3) or 0,25 (Model 6) in the augmented version, which is a difference of up to 20 percentage points. As the restriction is crucial (its rejection invalidates the production function and therefore any interpretation of the marginal products of production factors), only Model 3 and Model 6 will be considered in this section. While both models comply with the restriction, Model 6 produces a slightly higher goodness-of-fit, and the estimated coefficient on the level of human capital is significant at a more rigid significance level (the p-value is 0,4% in case of Model 6 and 1,4% in case of Model 3). Therefore the proxy variable for the stock of human capital used to estimate Model 6, i.e. the percentage of population of at least 15 years of age with secondary or tertiary education, is the best proxy for the level of human capital in African countries. The results of Model 6 (with restriction) will be discussed and interpreted in more detail below. The model is further referred to as the best augmented model. The best augmented model explains 13,6 percentage points more of the variance in income per capita across the sample of 32 African countries in comparison to the original Solow model (with restriction). The model implies that the elasticity of income per capita with respect to the saving rate is 0,8 and –0,8 with respect to natural growth. That means that a 1% increase in the savings rate increases the expected income per capita by 0,8% in 13 The p-values of the F-test for restriction on the coefficients on savings rate and population growth are higher than 10%. 14 I.e. the restriction that the coefficients on savings rate and population growth are equal in absolute value is not rejected. 15 The marginal product of labor for the augmented Solow model can only be calculated under the linearity assumption.
the long term. Analogically, a 1% increase in the population growth rate decreases the expected income per capita by 0,8% in the long term. The ‘long-term’ refers to the steady state. The speed of convergence to the steady state is a function of α, β, the natural growth rate.16 Plugging in the estimated values of α and β from the best augmented model, followed by the lowest and highest population growth rate observed in the sample (0,86% for Mauritius and 3,72% for the Gambia), allows to arrive at a number of years the economy takes to move halfway towards the steady state, which is between 5,2 and 5,5 years.17 When it comes to the coefficient on the level of human capital, it equals 0,54 in the best augmented model. That means that a 1% increase in the stock of human capital increases the steady state income per capita by 0,54%. Under a strong assumption that manipulating the proxy is equivalent to influencing the stock of human capital (with proportionality factor equal to 1), that means that increasing the percentage of adult population with completed at least secondary education by 1% increases the steady state income per capita by 0,54%. In the case of Tanzania, which has the lowest secondary and tertiary education attainment in the sample, this would be equivalent to increasing the figure from 2,89% to 2,92%, i.e. by around 12 thousand people. At the same time, for South Africa, which has the highest secondary and tertiary attainment in the sample, this would mean that almost 300 thousand people (0,6% of the population) would have to migrate from the ‘no education’ or ‘primary education only’ category to a higher education attainment level, by completing at least secondary education. These discrepancies clearly illustrate the decreasing returns to human capital. The explanatory power of primary education attainment as a proxy of human capital The model which used primary education attainment as the proxy variable (Model 2) returned the lowest R-squared out of the six models. As the coefficient on population growth in the non-restricted model equaled –4,21, while it was only –1,08 according to the restricted model, the restriction on the coefficients on savings rate and natural growth was rejected (p-value = 2%). One could argue however that this measure is fundamentally flawed, as it excludes those who completed not only primary, but also secondary or secondary and tertiary education. The models which take into account all adults who completed primary education (Model 1) or all adults who completed primary or secondary education but not tertiary education (Model 5) in fact produce a goodness-of-fit which is higher than for the best augmented model. However, these models can only be considered under the log-linearity assumption (which entails non-interpretability of β), as the sums of the implied values of α and β exceed 1.18 More importantly, the test of restriction in the case of these two models
16 , see: Mankiw, Romer, and Weil (1992), p. 422 17 Again, this estimation is only valid under the linearity assumption. 18 This violates one of the assumptions of the augmented Solow model, which states that there are decreasing returns to all capital. When this assumption is violated, there is no steady state in the model. At the same time, empirical estimation of the parameters of the production function is only possible if it is
returns p-values of 8%, which suggests that the coefficients of these models do not imply equal values of α and therefore are inconsistent with the production function (α can no longer be interpreted as the capital’s share in income or marginal product of capital). When adults with only primary education attainment are excluded from the data, Model 1 becomes Model 6, and Model 5 becomes Model 3. In both cases, the restriction starts holding and the coefficients on human capital start implying acceptable levels of β. In conclusion, including the adults who only completed primary education in the proxy of human capital accumulation deteriorates estimation results. Conclusions “When a measure becomes a target, it ceases to be a good measure,” states the Goodhart’s Law. Although the Millennium Development Goals have been a driver of positive change in many ways, the framework’s story is one of measures becoming targets. The purpose of this study was to empirically verify whether achieving universal primary education in 15 years was an appropriate development target for African countries from the perspective of economic growth theory. The econometric analysis indicates that primary education attainment is not the best proxy variable for the level of human capital. In fact, excluding primary education attainment from the measurements of human capital allows for obtaining results which are consistent with economic theory (which do not violate the assumption of decreasing returns to all capital). Out of the three education attainment statistics, tertiary education holds the most explanatory power in terms of cross-country differences in income per capita, and the sum of secondary and tertiary education attainment produces the most trustworthy results.19 There are several reasons for which investment in higher education can have a more lasting effect on income per capita than investment in primary education. While all levels of education produce private returns to education (such as higher productivity, translating to higher salaries and higher GDP per capita), higher education particularly increases the country’s capacity to further invest in human capital. Human capital mostly consists of education and health (both of which allow individuals to produce more output) and the cost of investing in education and health depends on the size and quality of the country’s talent pool, especially teachers and doctors. Moreover, a more comprehensive approach to education systems in developing countries seems to bring more sustainable results. Using the Qualitative Comparative Analysis method to examine the effectiveness of aid for primary education in developing countries, Birchler and Michaelowa (2016) find that one of the conditions for improving
assumed that countries are in their steady states, or that their distance from the steady states is random. See: Mankiw, Romer, and Weil (1992), p. 416. 19 Model 4 (tertiary education) with restriction is characterized by the R-squared of 70,2%, while Model 3 (secondary education) and Model 2 (primary education) reach 67,% and 61,4% respectively (see Table 2 for more details).
quality in primary education also requires investments in other areas, such as secondary and tertiary education, or vocational training.20 Potential access to higher levels of education likely motivates primary school students to put more effort into their learning process, therefore reducing drop-out rates and improving overall outcomes.21 Limitations of the results can be categorized by their origin: the specifics of Africa as a region, and the method of analysis. First of all, extensive brain drain was not taken into account. A 2013 joint UN and OECD report stated that over 10% of university graduates born in African countries resided in OECD countries. For some countries the figure was considerably higher, e.g. 43% for Zimbabwe, or 36% for the Republic of Congo.22 This phenomenon potentially further undermines the applicability of the results. If 50% of university graduates leave their home country to work abroad, then the approximate numbers of graduates needed to increase the stock of human capital by 1%, provided in the previous section, are largely underestimated. In the previously mentioned example of Tanzania, the estimated number of 12 thousand doubles to 24 thousand under the assumption that half of graduates leave. Another issue which is not accounted for in the econometric analysis is the variation in the quality of education. This is especially pertinent to the analyzed case, as the MDG framework stimulated the exceptional 20 percentage point increase in primary education net enrolment rate in only 15 years.23 Taking into account the natural growth that took place in this period, the number of children enrolled in primary school increased by 140%, from 62 million in 2000 to 149 million pupils in 2015.24 Although consistent data allowing to track education quality in African countries is scarce, it is unlikely that such rapid increase in quantity did not have any detrimental effect on quality of education. Indeed, several studies demonstrate that the learning outcomes are very poor in many African countries, e.g. one study found that in most Sub-Saharan countries the ability to read a short written text is below 50% even for those who completed as much as 5 years of primary education.25 The main limitation of the method applied in this study is that education attainment is only a proxy of human capital. While the proxy is assumed to be highly correlated with
20 Birchler, K., & Michaelowa, K. (2016). Making aid work for education in developing countries: An analysis of aid effectiveness for primary education coverage and quality. International Journal of Educational Development, 48, p. 47. 21 Birchler, K., & Michaelowa, K. (2016). Making aid work for education in developing countries: An analysis of aid effectiveness for primary education coverage and quality. International Journal of Educational Development, 48, p. 48. 22 UN-DESA, O. E. C. D. (2013). World migration in figures. A Joint Contribution by UN-DESA and the OECD to the United Nations High-Level Dialogue on Migration and Development, p. 4. 23 Un.org. (2015). United Nations Millennium Development Goals Report 2015, p. 4. 24 Un.org. (2015). United Nations Millennium Development Goals Report 2015, p. 25. 25 Birchler, K., & Michaelowa, K. (2016). Making aid work for education in developing countries: An analysis of aid effectiveness for primary education coverage and quality. International Journal of Educational Development, 48, p. 38.
the analyzed variable, it should not be expected that manipulating the proxy is equivalent to manipulating the latent variable itself. In other words, increasing education attainment will surely increase the stock of human capital, but an unknown proportionality factor likely applies. The results of this study strongly suggest that the Millennium Development Goal concerning primary education was ill-designed. The authors of the framework unwillingly created misguided incentives (neglect of secondary and tertiary education), which likely influenced the evolution of the African education system. Further research should concentrate on the challenge that these results poses to policymakers: how to effectively incorporate quality measures into development frameworks, in a way that satisfies both the theoretical (evidence of causality on economic growth) and practical (simplicity, understandability) considerations.
References Barro, R., & Jong-Wha Lee. (2013). A New Data Set of Educational Attainment in the World, 1950-2010.” Journal of Economics, vol 104, pp. 184-198. Baum, M. A., & Lake, D. A. (2003). The political economy of growth: democracy and human capital. American Journal of Political Science, 47(2), 333-347. Birchler, K., & Michaelowa, K. (2016). Making aid work for education in developing countries: An analysis of aid effectiveness for primary education coverage and quality. International Journal of Educational Development, 48, 37-52. Bloom, D. E., Canning, D., & Chan, K. (2006). Higher education and economic development in Africa (Vol. 102). Washington, DC: World Bank. Easterly, W. (2009). How the millennium development goals are unfair to Africa. World development, 37(1), 26-35. Glewwe, P., Maiga, E., & Zheng, H. (2014). The contribution of education to economic growth: A review of the evidence, with special attention and an application to Sub-Saharan Africa. World Development, 59, 379-393. Goldin, C. (2016). Human capital. Handbook of cliometrics, 55-86. Hanushek, E. A. (2013). Economic growth in developing countries: The role of human capital. Economics of Education Review, 37, 204-212. International Monetary Fund. (2018). World Economic Outlook Database April 2018. Washington, D.C.: International Monetary Fund. Mankiw, N. G., Romer, D., & Weil, D. N. (1992). A contribution to the empirics of economic growth. The quarterly journal of economics, 107(2), 407-437. Saint-Paul, G., & Verdier, T. (1993). Education, democracy and growth. Journal of development Economics, 42(2), 399-407. Smith, A. (1950). An Inquiry into the Nature and Causes of the Wealth of Nations,(1776). Methuen. Solow, R. M. (1956). A contribution to the theory of economic growth. The quarterly journal of economics, 70(1), 65-94. UN-DESA, O. E. C. D. (2013). World migration in figures. A Joint Contribution by UN-DESA and the OECD to the United Nations High-Level Dialogue on Migration and Development.
Un.org. (2015). United Nations Millennium Development Goals Report 2015. [online] Available at: http://www.un.org/millenniumgoals/ [Accessed 17 Dec. 2017]. Contact email: [email protected]
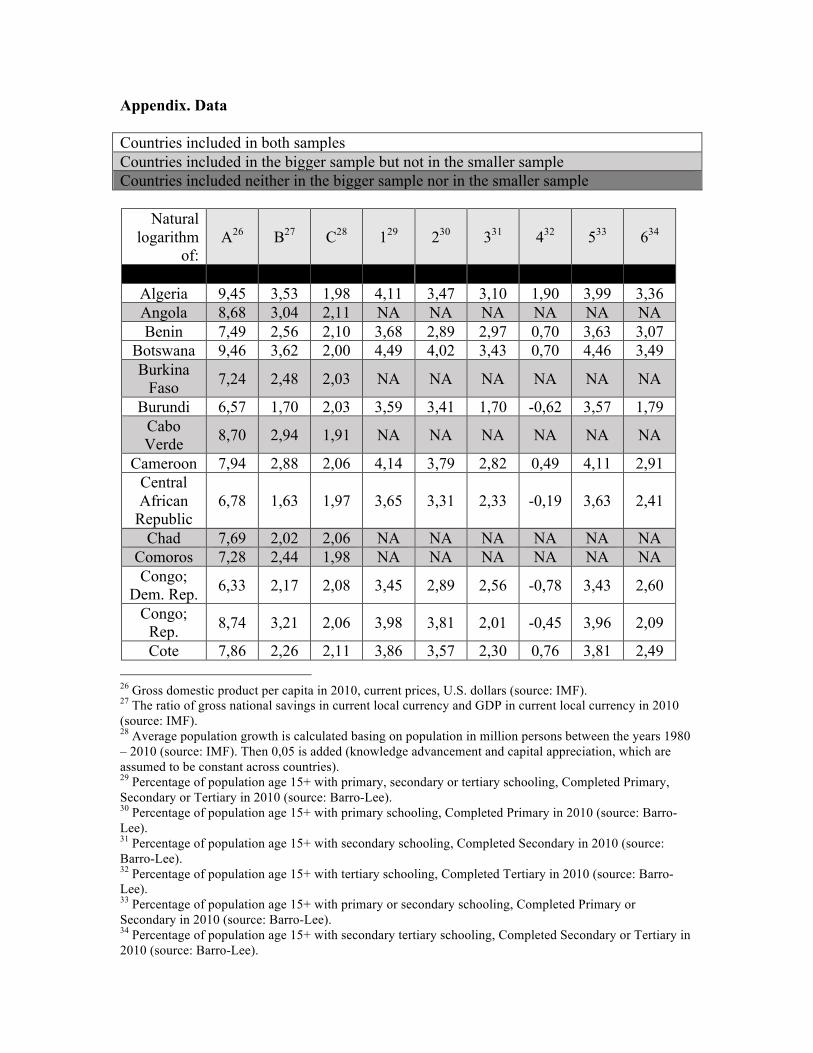
Appendix. Data Countries included in both samples Countries included in the bigger sample but not in the smaller sample Countries included neither in the bigger sample nor in the smaller sample
Natural logarithm
of: A26 B27 C28 129 230 331 432 533 634
Algeria 9,45 3,53 1,98 4,11 3,47 3,10 1,90 3,99 3,36 Angola 8,68 3,04 2,11 NA NA NA NA NA NA Benin 7,49 2,56 2,10 3,68 2,89 2,97 0,70 3,63 3,07
Botswana 9,46 3,62 2,00 4,49 4,02 3,43 0,70 4,46 3,49 Burkina
Faso 7,24 2,48 2,03 NA NA NA NA NA NA
Burundi 6,57 1,70 2,03 3,59 3,41 1,70 -0,62 3,57 1,79 Cabo Verde 8,70 2,94 1,91 NA NA NA NA NA NA
Cameroon 7,94 2,88 2,06 4,14 3,79 2,82 0,49 4,11 2,91 Central African
Republic 6,78 1,63 1,97 3,65 3,31 2,33 -0,19 3,63 2,41
Chad 7,69 2,02 2,06 NA NA NA NA NA NA Comoros 7,28 2,44 1,98 NA NA NA NA NA NA Congo;
Dem. Rep. 6,33 2,17 2,08 3,45 2,89 2,56 -0,78 3,43 2,60
Congo; Rep. 8,74 3,21 2,06 3,98 3,81 2,01 -0,45 3,96 2,09
Cote 7,86 2,26 2,11 3,86 3,57 2,30 0,76 3,81 2,49 26 Gross domestic product per capita in 2010, current prices, U.S. dollars (source: IMF). 27 The ratio of gross national savings in current local currency and GDP in current local currency in 2010 (source: IMF). 28 Average population growth is calculated basing on population in million persons between the years 1980 – 2010 (source: IMF). Then 0,05 is added (knowledge advancement and capital appreciation, which are assumed to be constant across countries). 29 Percentage of population age 15+ with primary, secondary or tertiary schooling, Completed Primary, Secondary or Tertiary in 2010 (source: Barro-Lee). 30 Percentage of population age 15+ with primary schooling, Completed Primary in 2010 (source: Barro-Lee). 31 Percentage of population age 15+ with secondary schooling, Completed Secondary in 2010 (source: Barro-Lee). 32 Percentage of population age 15+ with tertiary schooling, Completed Tertiary in 2010 (source: Barro-Lee). 33 Percentage of population age 15+ with primary or secondary schooling, Completed Primary or Secondary in 2010 (source: Barro-Lee). 34 Percentage of population age 15+ with secondary tertiary schooling, Completed Secondary or Tertiary in 2010 (source: Barro-Lee).
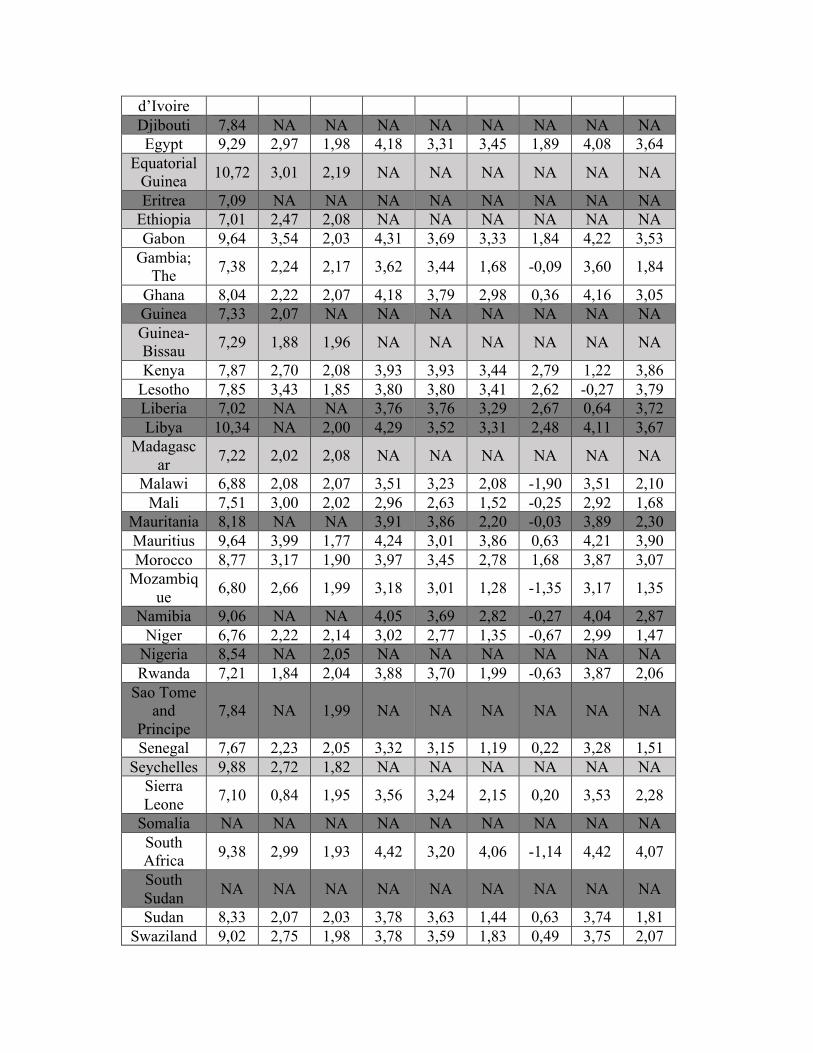
d’Ivoire Djibouti 7,84 NA NA NA NA NA NA NA NA Egypt 9,29 2,97 1,98 4,18 3,31 3,45 1,89 4,08 3,64
Equatorial Guinea 10,72 3,01 2,19 NA NA NA NA NA NA
Eritrea 7,09 NA NA NA NA NA NA NA NA Ethiopia 7,01 2,47 2,08 NA NA NA NA NA NA Gabon 9,64 3,54 2,03 4,31 3,69 3,33 1,84 4,22 3,53
Gambia; The 7,38 2,24 2,17 3,62 3,44 1,68 -0,09 3,60 1,84
Ghana 8,04 2,22 2,07 4,18 3,79 2,98 0,36 4,16 3,05 Guinea 7,33 2,07 NA NA NA NA NA NA NA Guinea-Bissau 7,29 1,88 1,96 NA NA NA NA NA NA
Kenya 7,87 2,70 2,08 3,93 3,93 3,44 2,79 1,22 3,86 Lesotho 7,85 3,43 1,85 3,80 3,80 3,41 2,62 -0,27 3,79 Liberia 7,02 NA NA 3,76 3,76 3,29 2,67 0,64 3,72 Libya 10,34 NA 2,00 4,29 3,52 3,31 2,48 4,11 3,67
Madagascar 7,22 2,02 2,08 NA NA NA NA NA NA
Malawi 6,88 2,08 2,07 3,51 3,23 2,08 -1,90 3,51 2,10 Mali 7,51 3,00 2,02 2,96 2,63 1,52 -0,25 2,92 1,68
Mauritania 8,18 NA NA 3,91 3,86 2,20 -0,03 3,89 2,30 Mauritius 9,64 3,99 1,77 4,24 3,01 3,86 0,63 4,21 3,90 Morocco 8,77 3,17 1,90 3,97 3,45 2,78 1,68 3,87 3,07
Mozambique 6,80 2,66 1,99 3,18 3,01 1,28 -1,35 3,17 1,35
Namibia 9,06 NA NA 4,05 3,69 2,82 -0,27 4,04 2,87 Niger 6,76 2,22 2,14 3,02 2,77 1,35 -0,67 2,99 1,47
Nigeria 8,54 NA 2,05 NA NA NA NA NA NA Rwanda 7,21 1,84 2,04 3,88 3,70 1,99 -0,63 3,87 2,06
Sao Tome and
Principe 7,84 NA 1,99 NA NA NA NA NA NA
Senegal 7,67 2,23 2,05 3,32 3,15 1,19 0,22 3,28 1,51 Seychelles 9,88 2,72 1,82 NA NA NA NA NA NA
Sierra Leone 7,10 0,84 1,95 3,56 3,24 2,15 0,20 3,53 2,28
Somalia NA NA NA NA NA NA NA NA NA South Africa 9,38 2,99 1,93 4,42 3,20 4,06 -1,14 4,42 4,07
South Sudan NA NA NA NA NA NA NA NA NA
Sudan 8,33 2,07 2,03 3,78 3,63 1,44 0,63 3,74 1,81 Swaziland 9,02 2,75 1,98 3,78 3,59 1,83 0,49 3,75 2,07

Tanzania 7,67 2,86 2,06 4,15 4,10 0,93 -1,02 4,14 1,06 Togo 7,09 1,94 2,13 4,06 3,83 2,35 0,41 4,03 2,49
Tunisia 9,24 3,04 1,90 4,22 3,66 3,08 2,00 4,12 3,37 Uganda 7,56 2,82 2,13 3,75 3,53 1,95 0,21 3,72 2,12 Zambia 8,07 2,62 2,07 4,32 4,05 2,83 -0,71 4,31 2,86
Zimbabwe 7,40 NA 1,93 4,41 4,31 1,97 -0,97 4,41 2,03